1. Introduction
Nowadays, the high-performance chips largely enhance the real-time computation of the modern smart device. Moreover, a smart device also enables rich interactive experiences while extending the functions by using various built-in sensors, such as the accelerometer and the gyroscope.
Built-in sensors in the smart device are kinds of microelectromechanical systems that capture the subtle changes of light, heat, and temperature. For instance, a tiny embedded accelerometer in a smartphone has the capability to detect instantaneous acceleration magnitude on three coordinate axes. Researchers also attempt to acquire accurate velocity and direction of the smart device from these instantaneous acceleration magnitudes in order to identify the motion state of a human target including walking up, running and tumbling [
1].
Recently, researchers found that built-in sensors in a smart device could output response when they receive voice as actuating signals [
2,
3]. Based on this feature, built-in sensors gradually replace microphone to realize voice control in various application scenarios. At present, the voice-activated communication between user and smart device increasingly becomes a brand-new interactive pattern. For instance, Siri in iOS system and Google Now in Android system [
4,
5] are two successful voice interactive platforms in mobile devices. Generally, these two systems would receive the specific voice commands and transform them into instructions to control a smart device to complete multiple real-time tasks by using a built-in microphone. Meanwhile, the microphone has to be kept in working condition to give immediate feedback to users. This significant energy consumption mode undoubtedly becomes a challenge in the battery-powered smart device. Therefore, a low-power built-in sensor is considered to become a viable alternative to resolve the conflict between high-energy consumption and real-time monitoring of speech signal [
6,
7].
Due to its hardware structure constraint, the output signal of a built-in sensor usually appears strong non-linear [
8]. Therefore, on the basis of non-linear dynamics chaotic theory, we attempt to reveal the chaotic features of output signal of the built-in accelerometer when the smart device receives voice commands. We also try to develop a suitable mathematical model to express the nonlinear properties of built-in accelerometer for realizing accurate output signal prediction, characteristics extraction, and pattern recognition.
The main contributions of this paper are as follow:
- (1)
We attempt to apply nonlinear dynamics and chaotic theory to built-in sensor signal analysis.
- (2)
We calculate the optimal delay time and proper correlation dimension, and then we reveal the nonlinear properties of built-in accelerometer in the smart device by reconstructing the attractors.
The remaining parts of the paper are arranged as follows:
In
Section 2, we illustrate the feasibility of built-in accelerometer in smart-device. In
Section 3, the optimal delay time and proper correlation dimension are calculated. In addition, the attractors are also reconstructed. We present the results of experiments in
Section 4. We also try to show the results of nonlinear mapping between microphone and accelerometer in
Section 5. The conclusions and subsequent research directions are finally presented in
Section 6.
2. Feasibility of Built-in Accelerometer
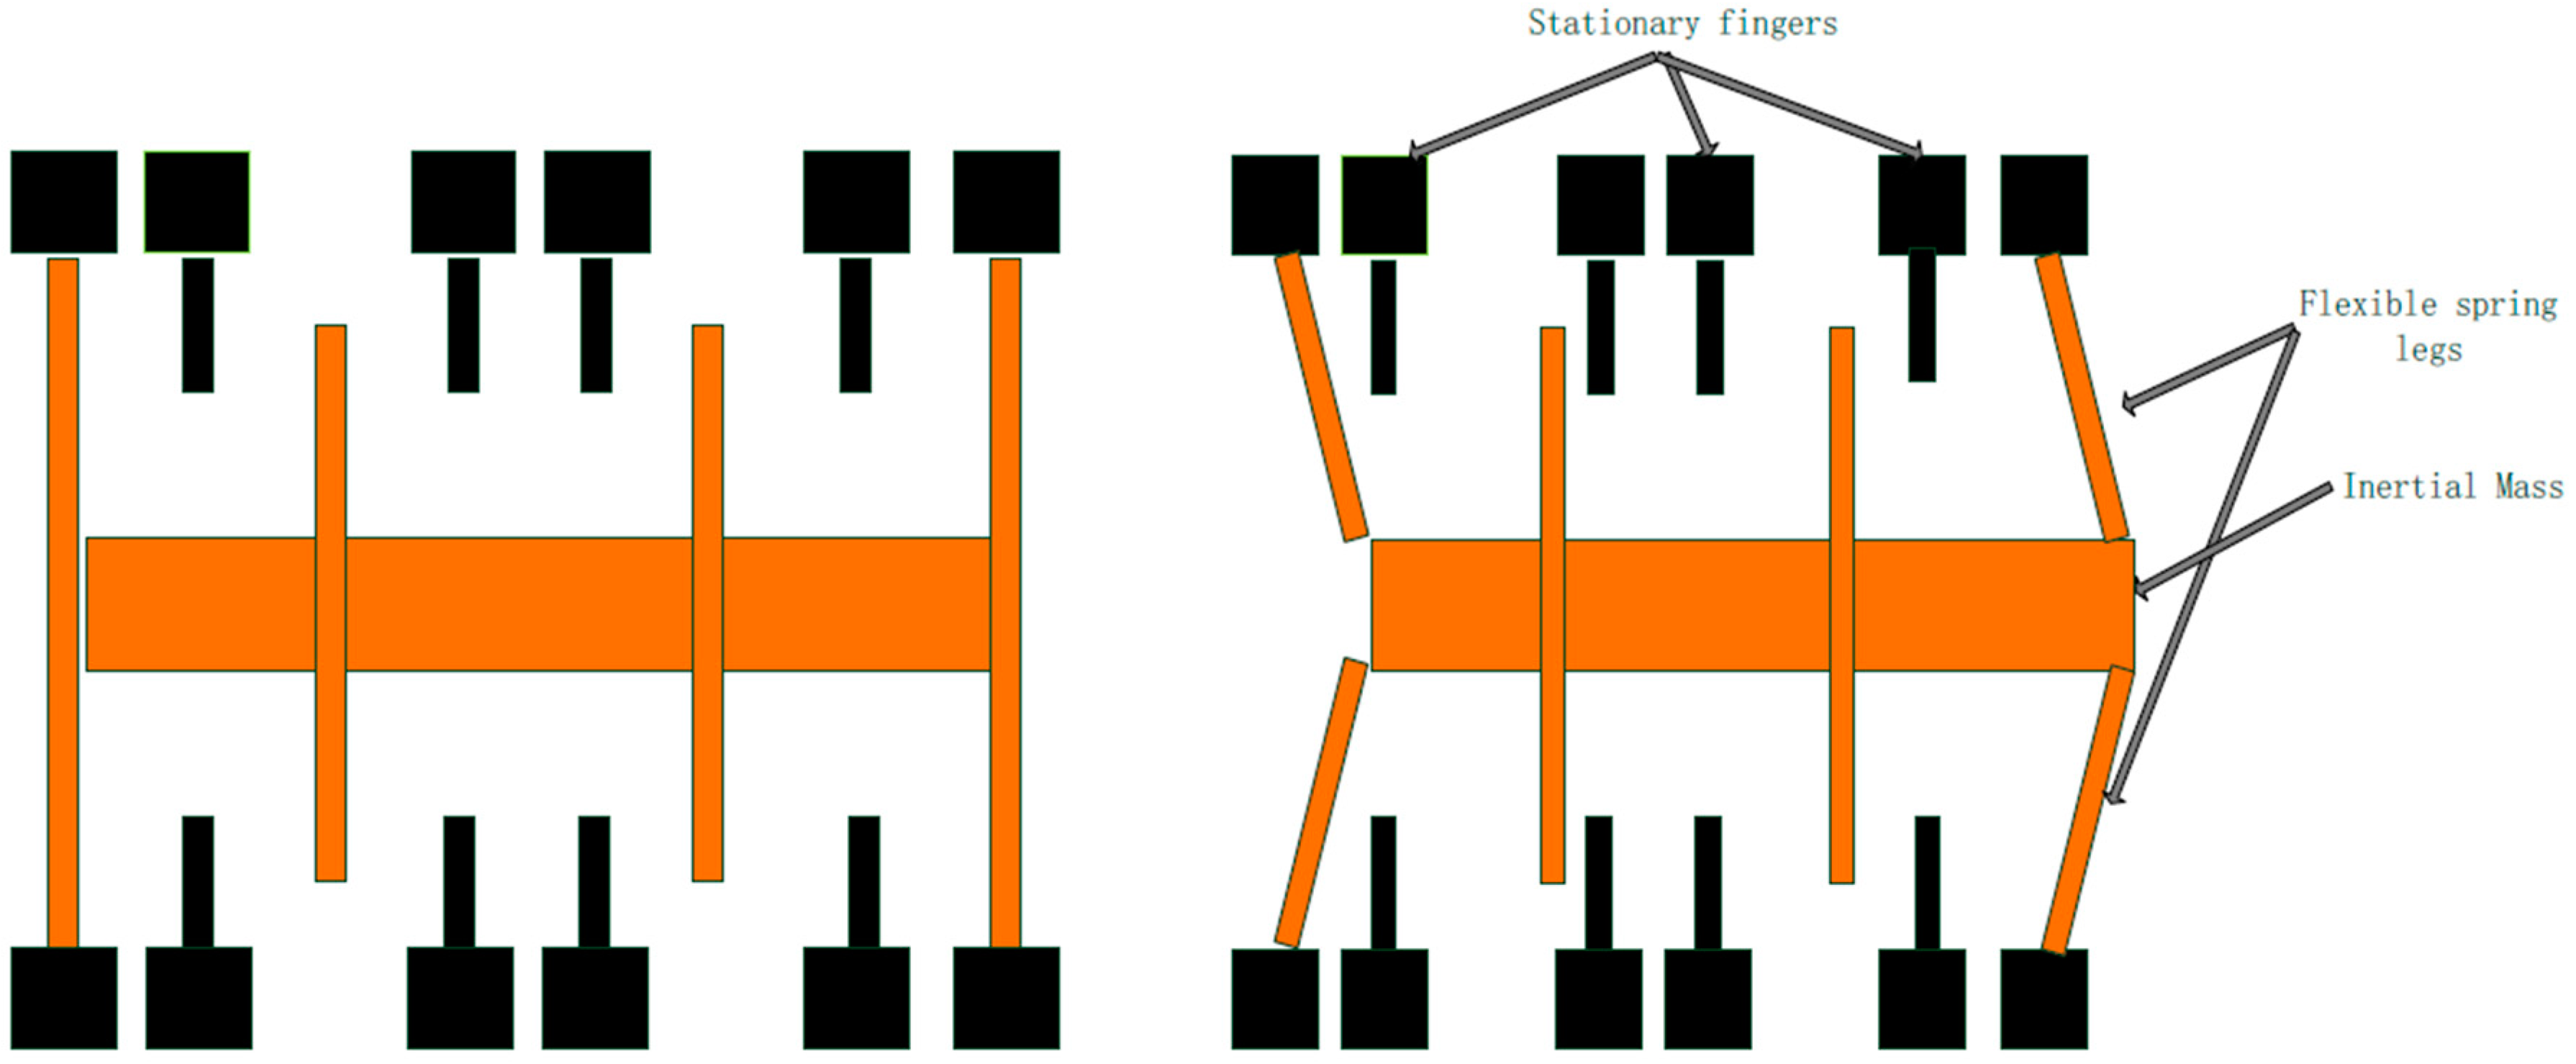
Current MEMS (Micro-Electro-Mechanical System) built-in accelerometers in smart devices are usually composed of three main components–an inertial mass, spring legs, and stationary fingers. As shown in
Figure 1, a change in the capacitance between the stationary fingers would be caused by inertial mass moving when an accelerometer is working. This change is recorded as an accurate acceleration. Moreover, three separate sets of components could be employed to measure the accelerations separately in three directions.
Owing to the limitations of hardware, capturing the voice signal is not the target of the built-in sensors in the smart device. Therefore, the accurate frequency response range under the condition of voice actuating should be determined.
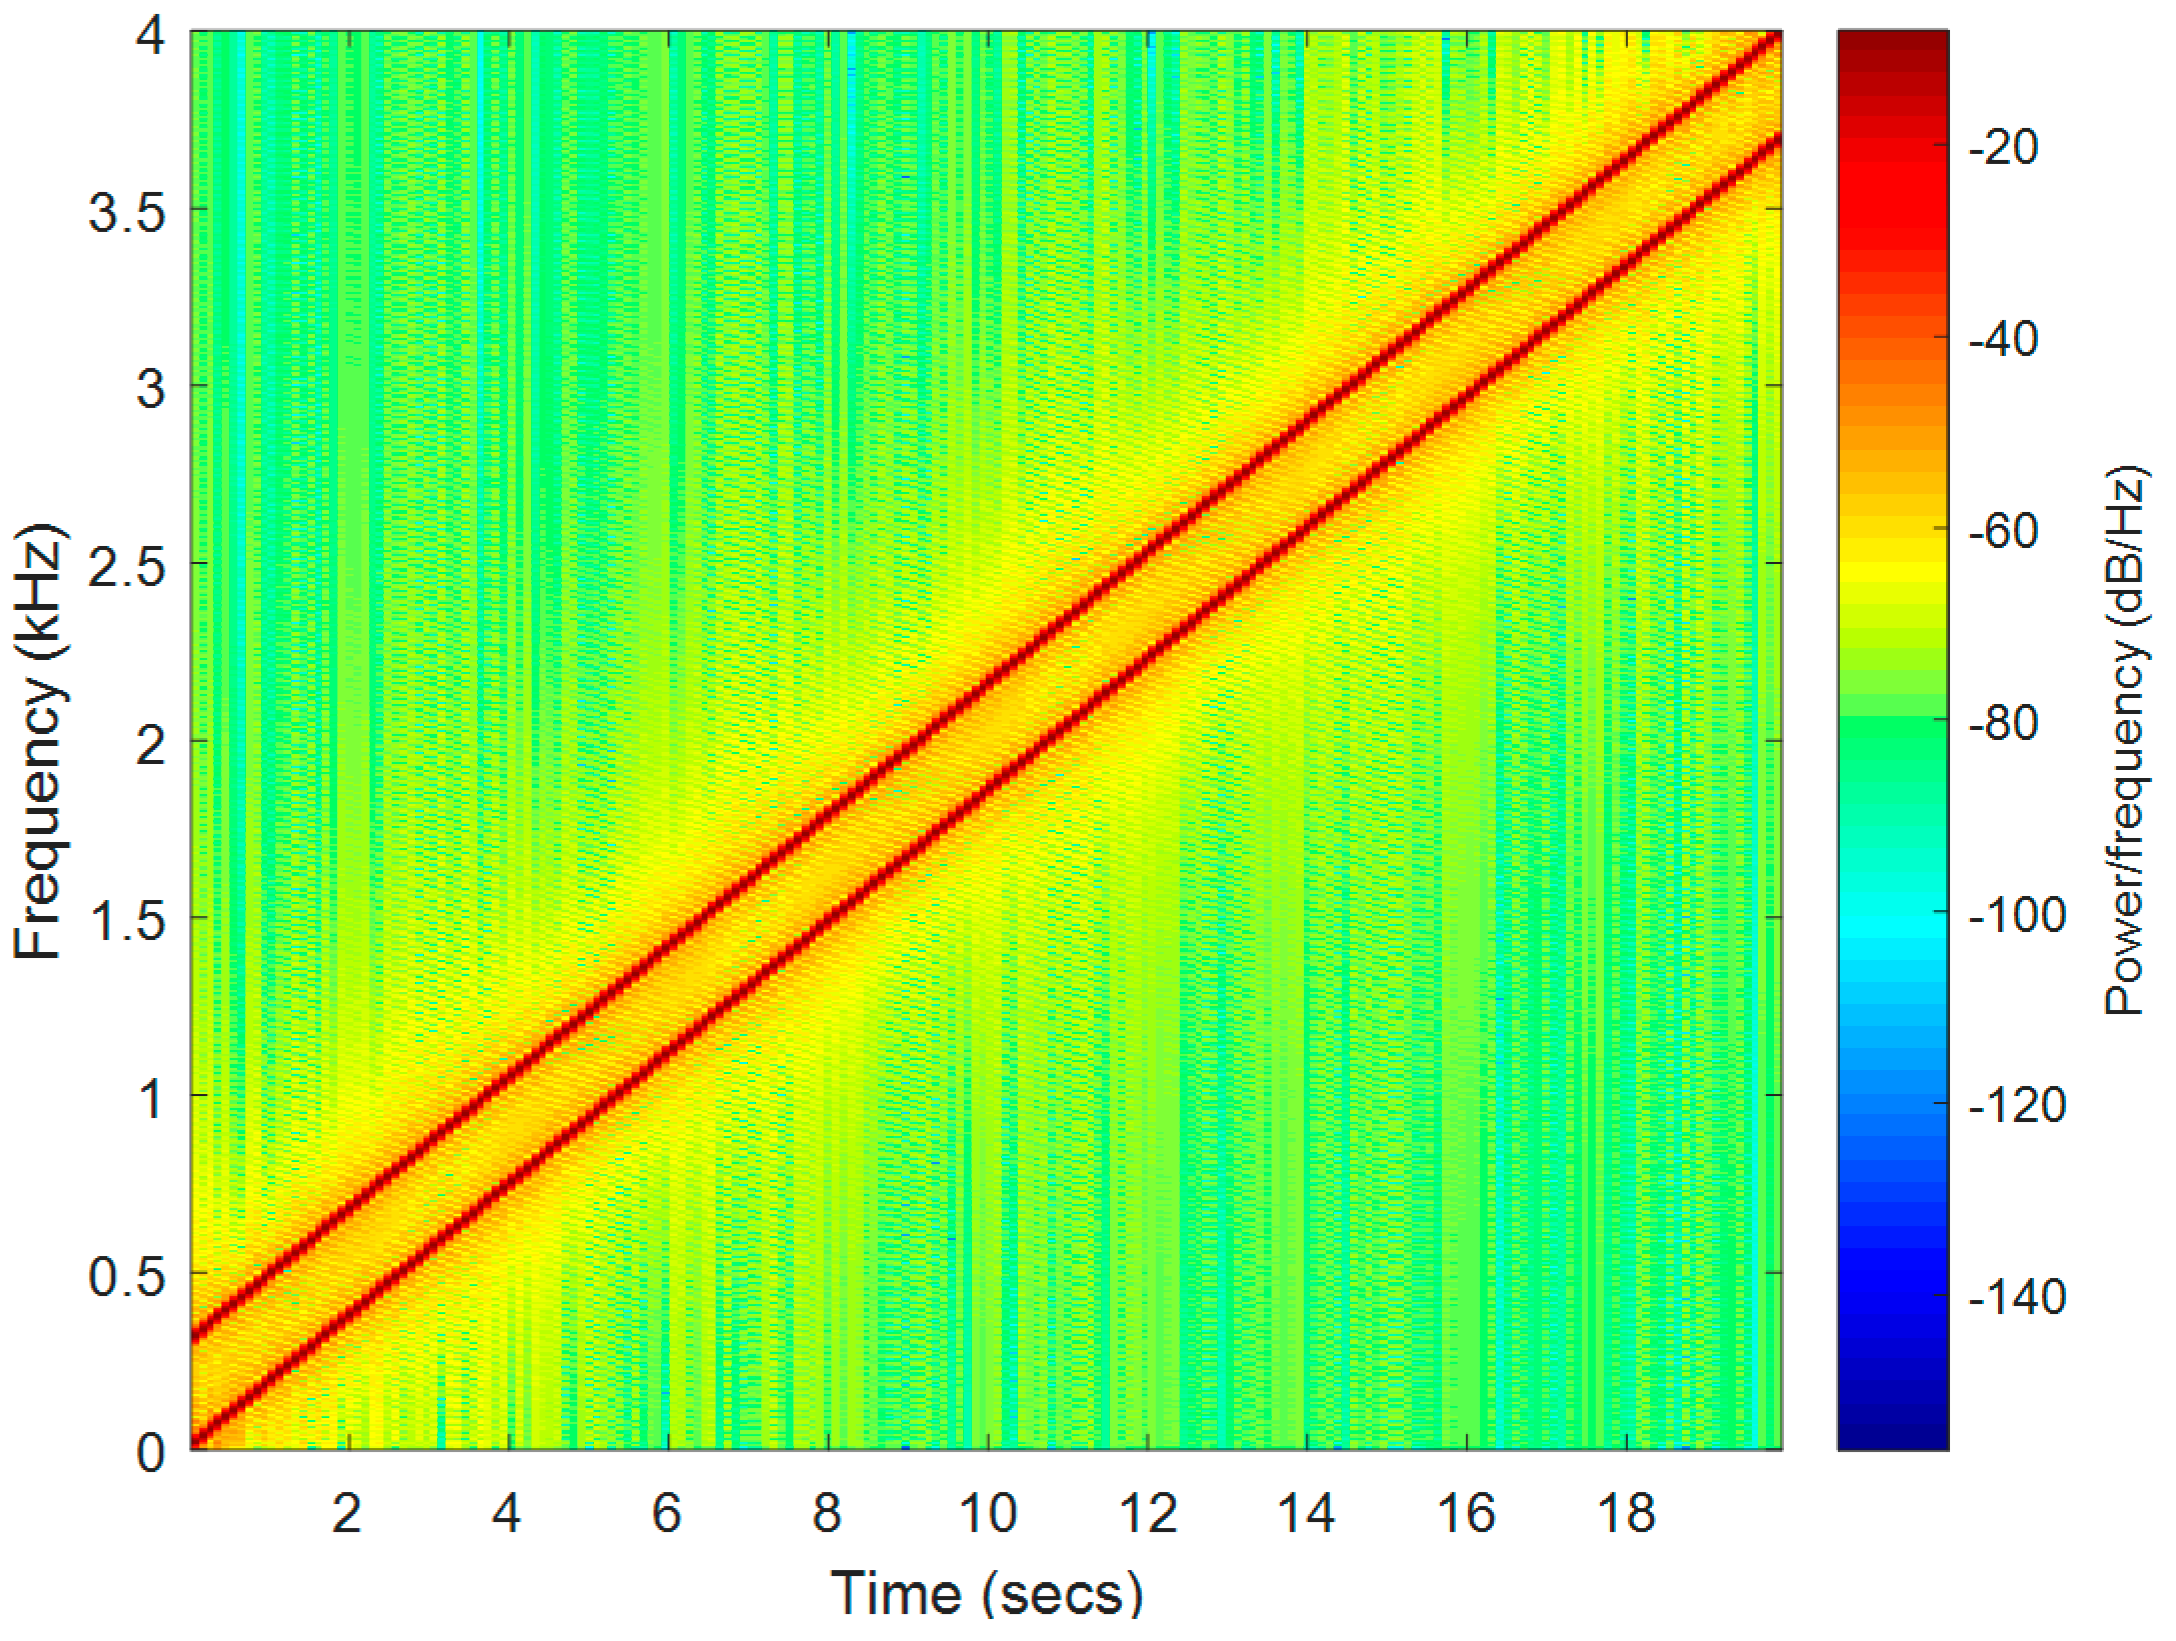
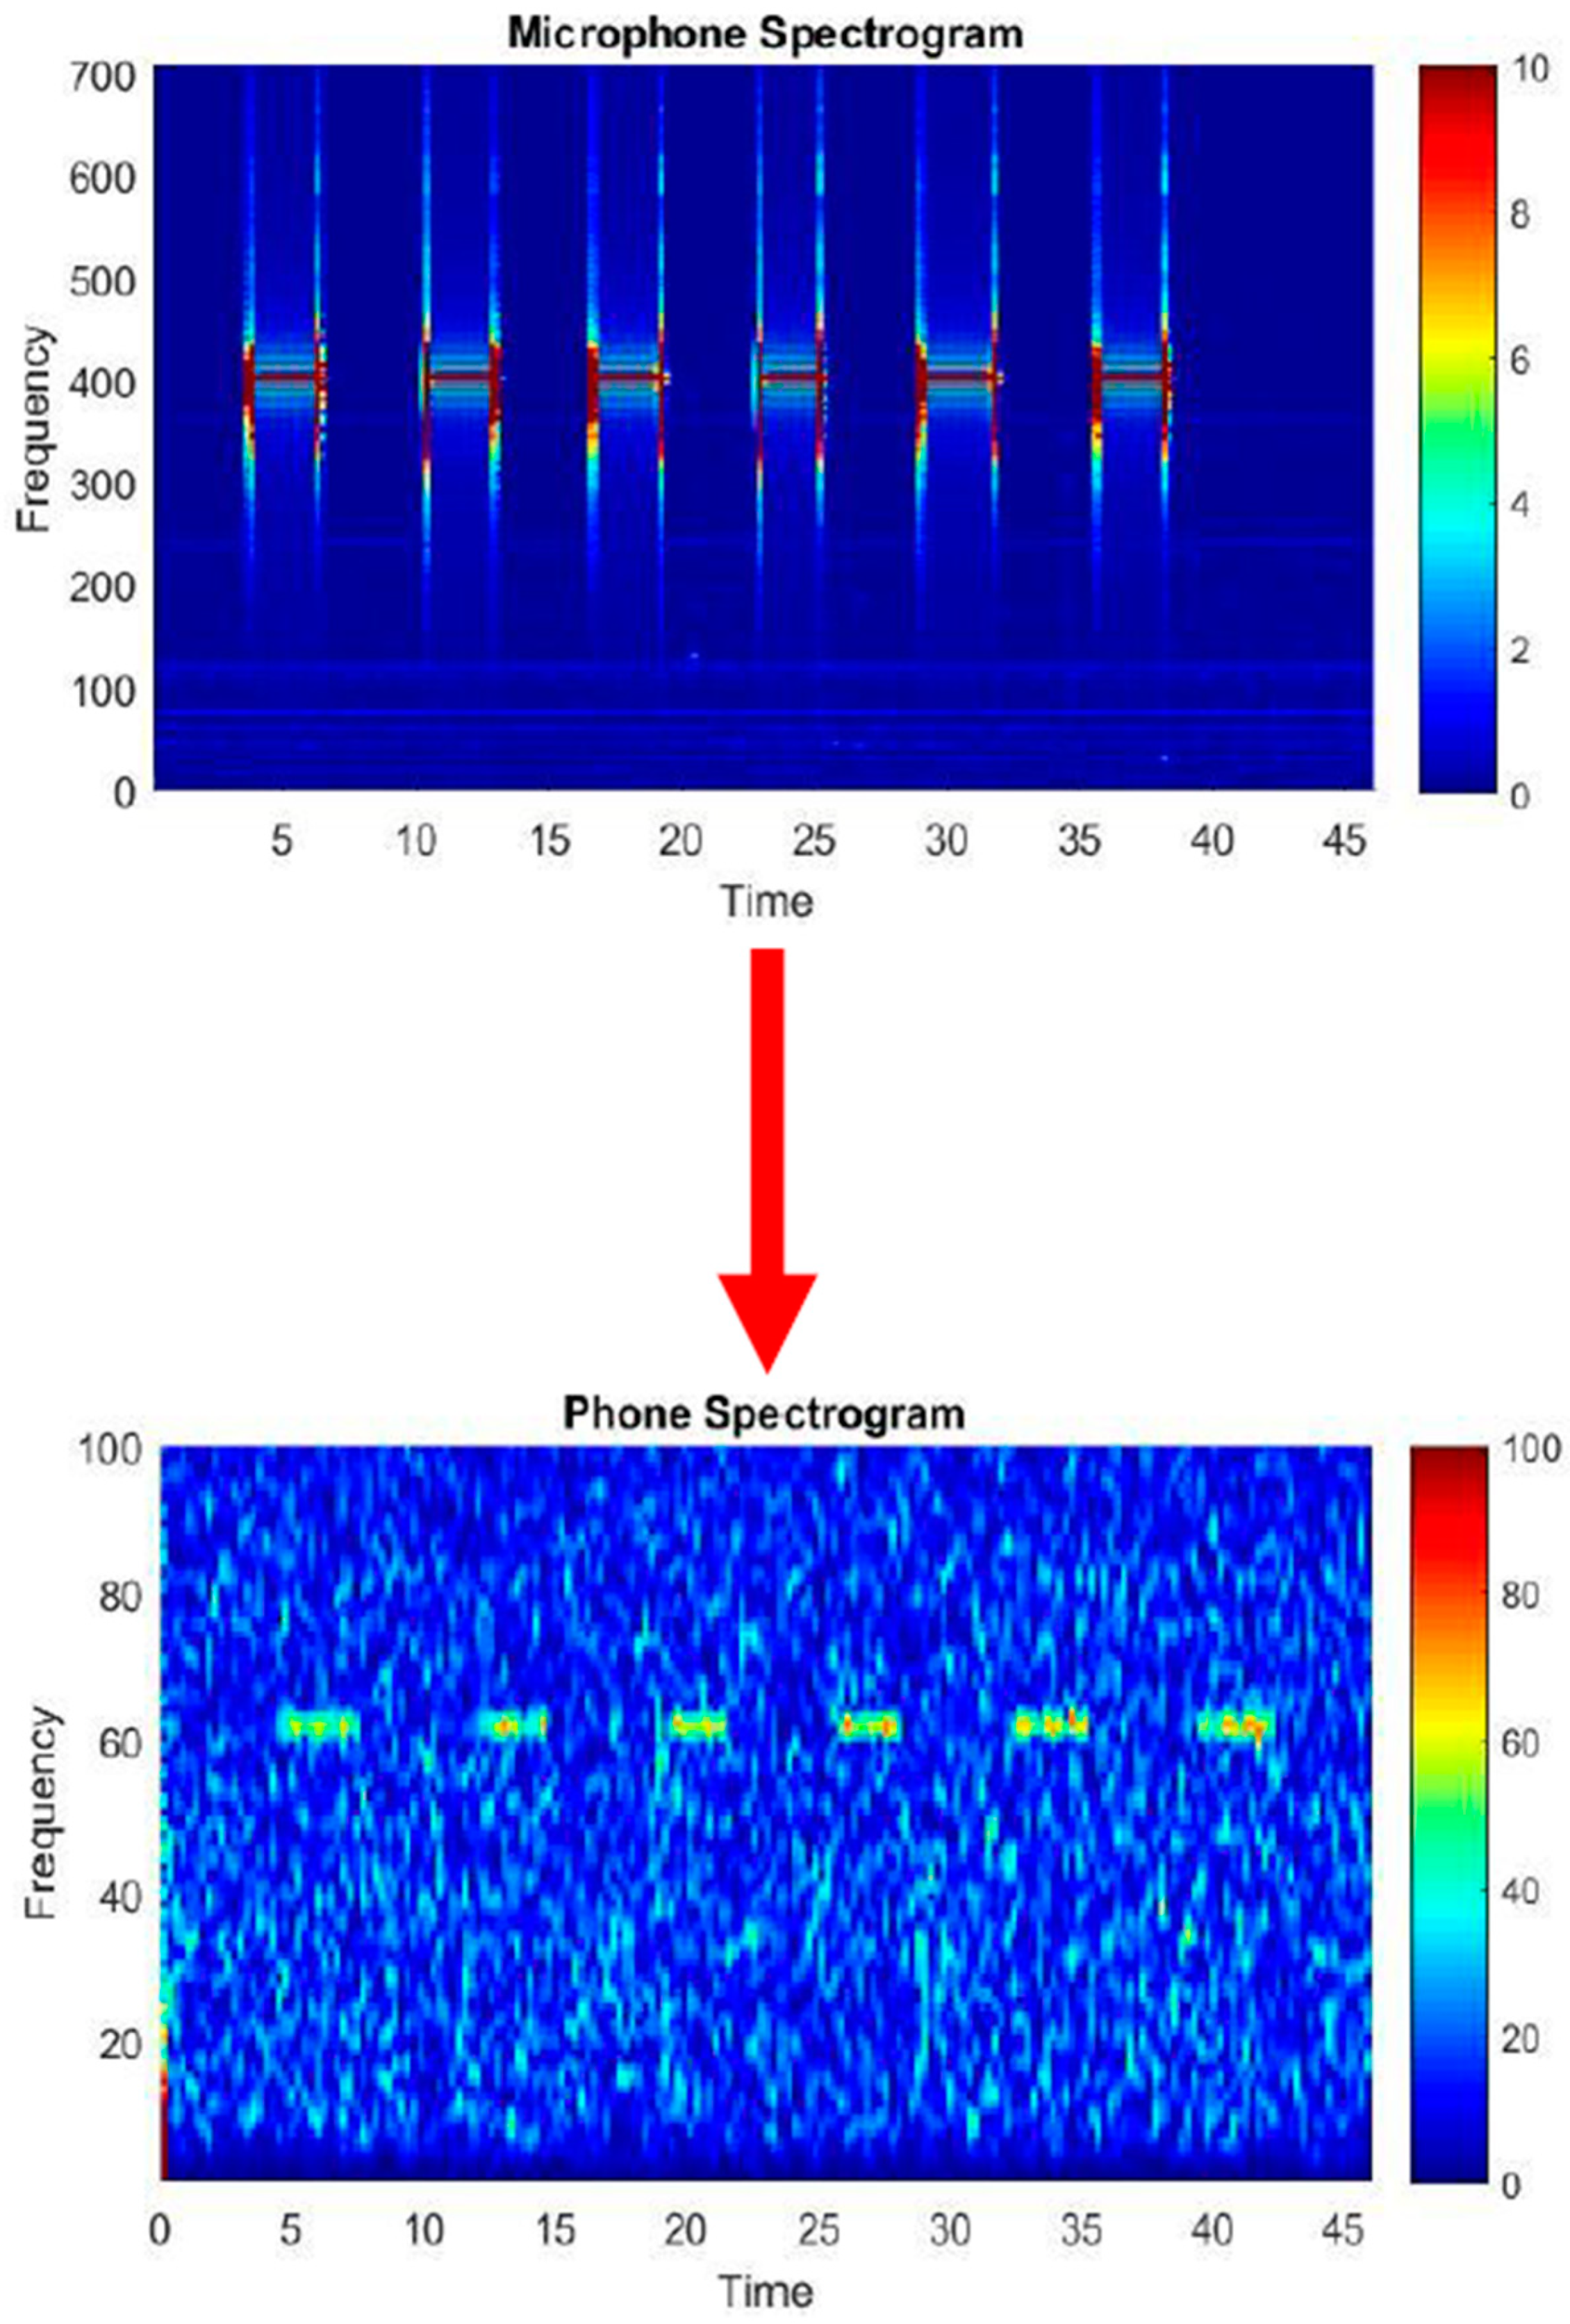
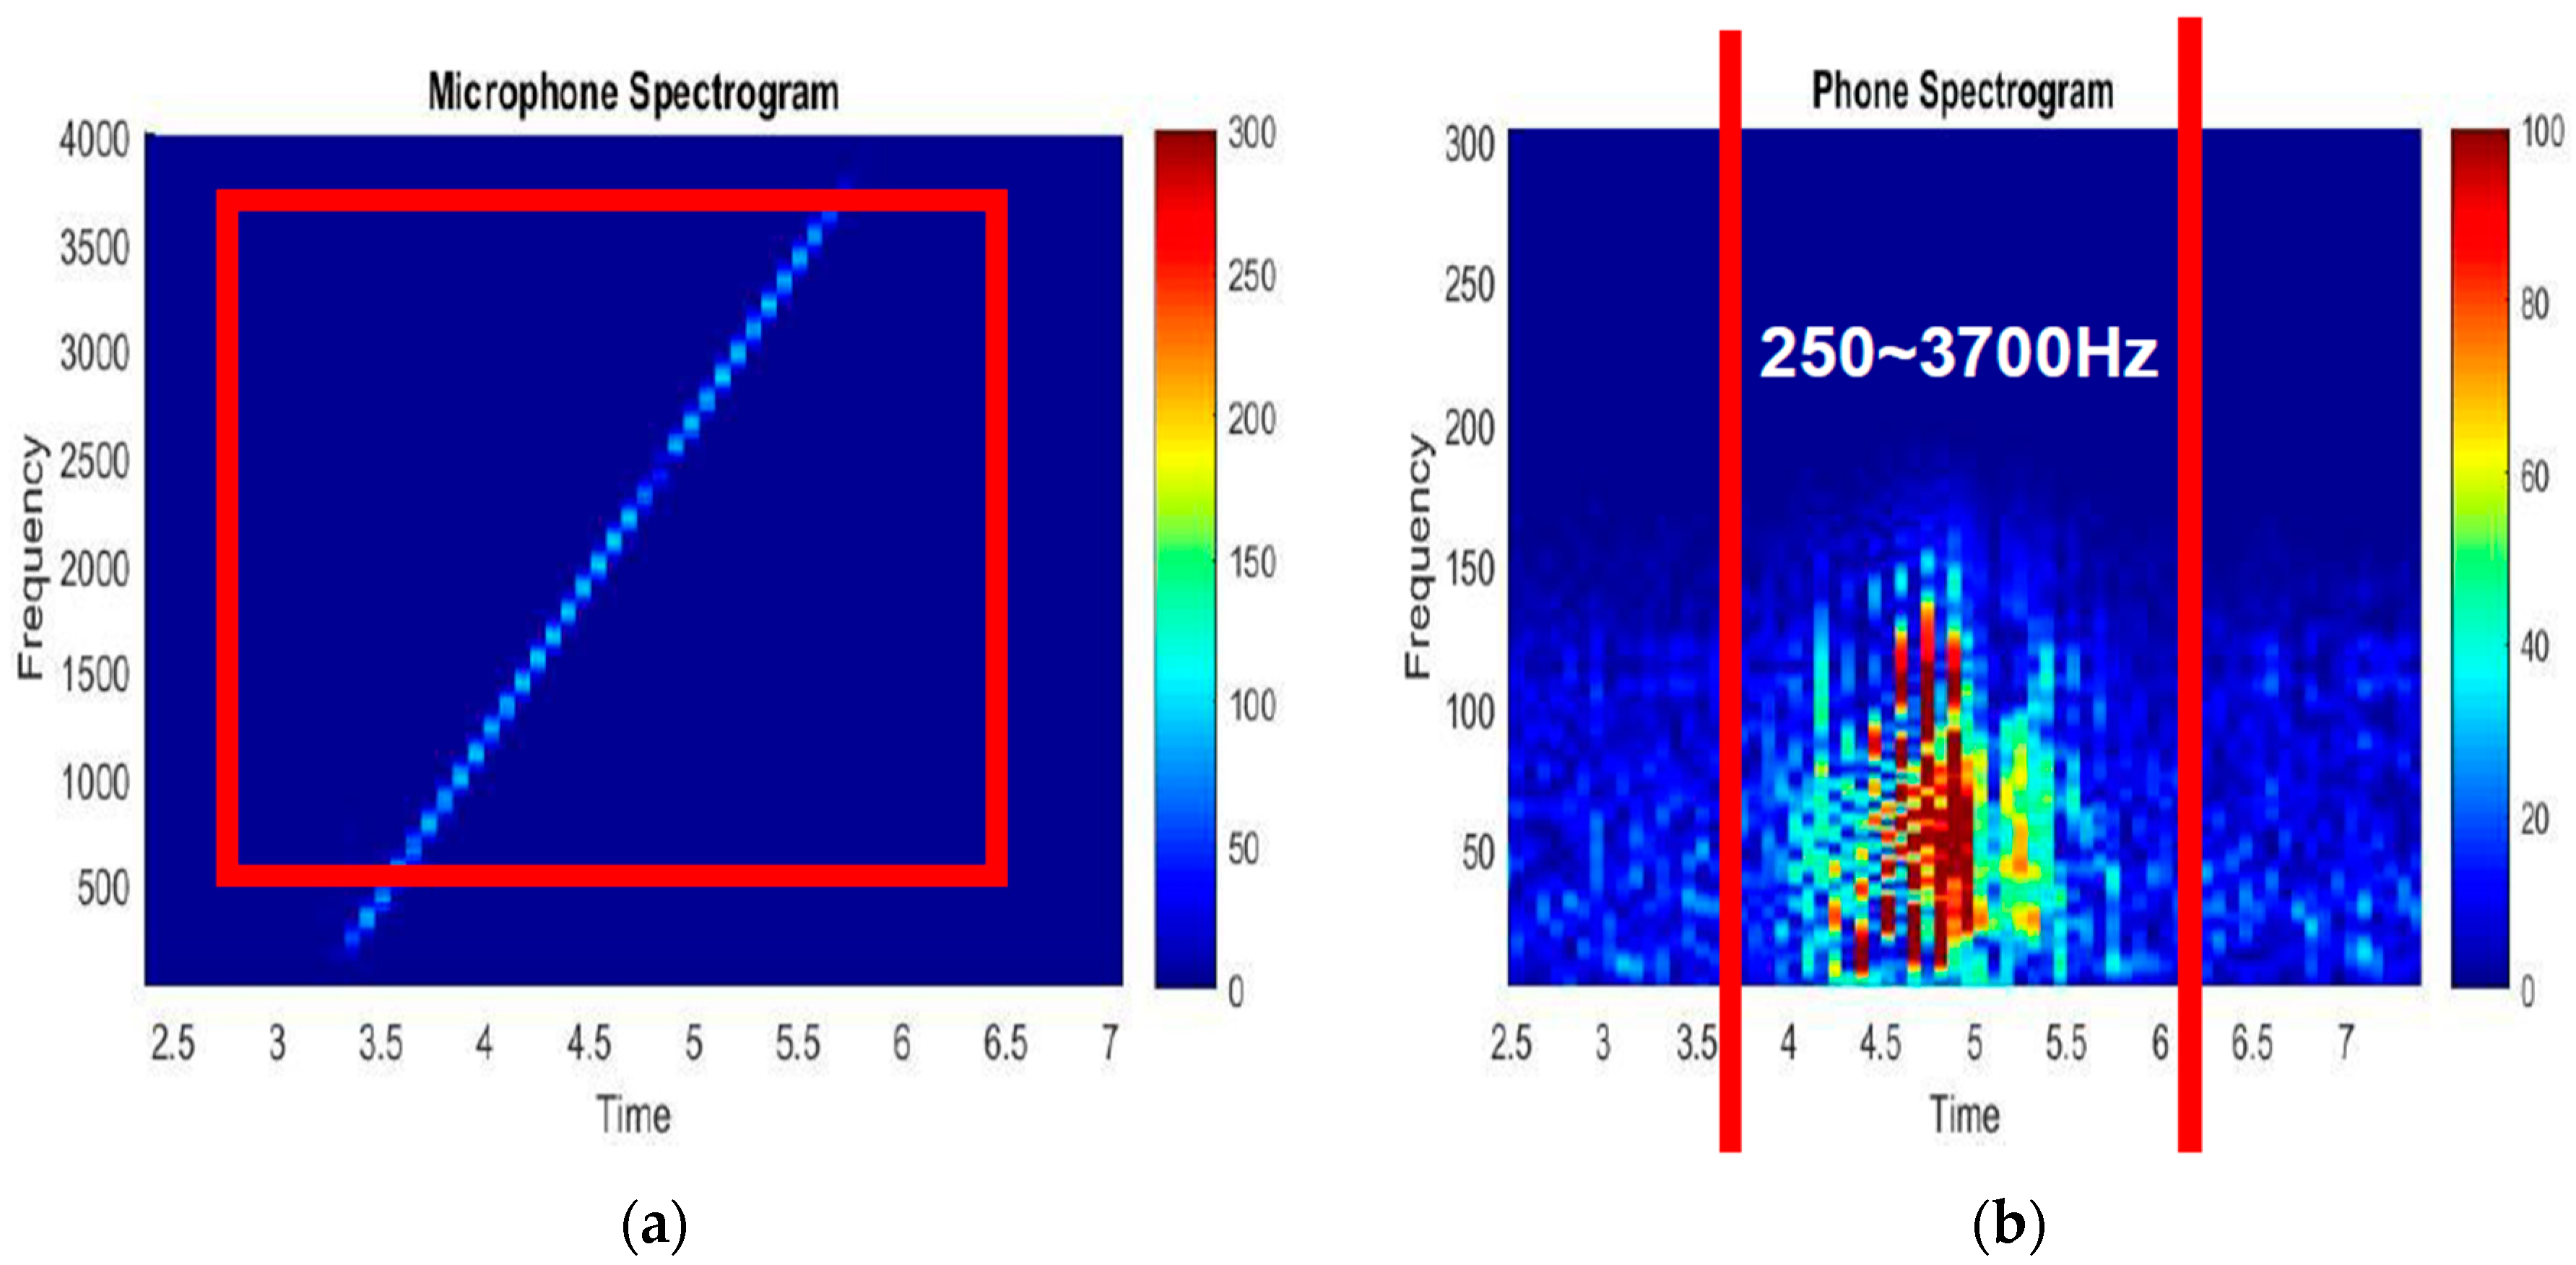
As shown in the
Figure 2, we placed two smartphones on a table, and 0–22,000 Hz chirp sound signals were generated by a small louder-speaker which was fixed 10 cm vertical above the two smartphones. One of these smartphones was used to record the responding signal to the chirp sound signals. Meanwhile, the responding signal of the built-in accelerometer to the same chirp signals was recorded by another smartphone for comparison.
It is clearly found from
Figure 3 that the built-in microphone of the mobile phone can successfully capture the chirp signal. In addition, the response signal was also an approximately straight line from 0 to 4000 Hz without aliasing. Conversely, the response signal frequency of the built-in accelerometer was mainly concentrated below 200 Hz, although the frequency of the input chirp sound signals was gradually increasing. This means that the built-in accelerometer usually filters out the sound signal above 250 Hz while arising nonlinearly distorted.
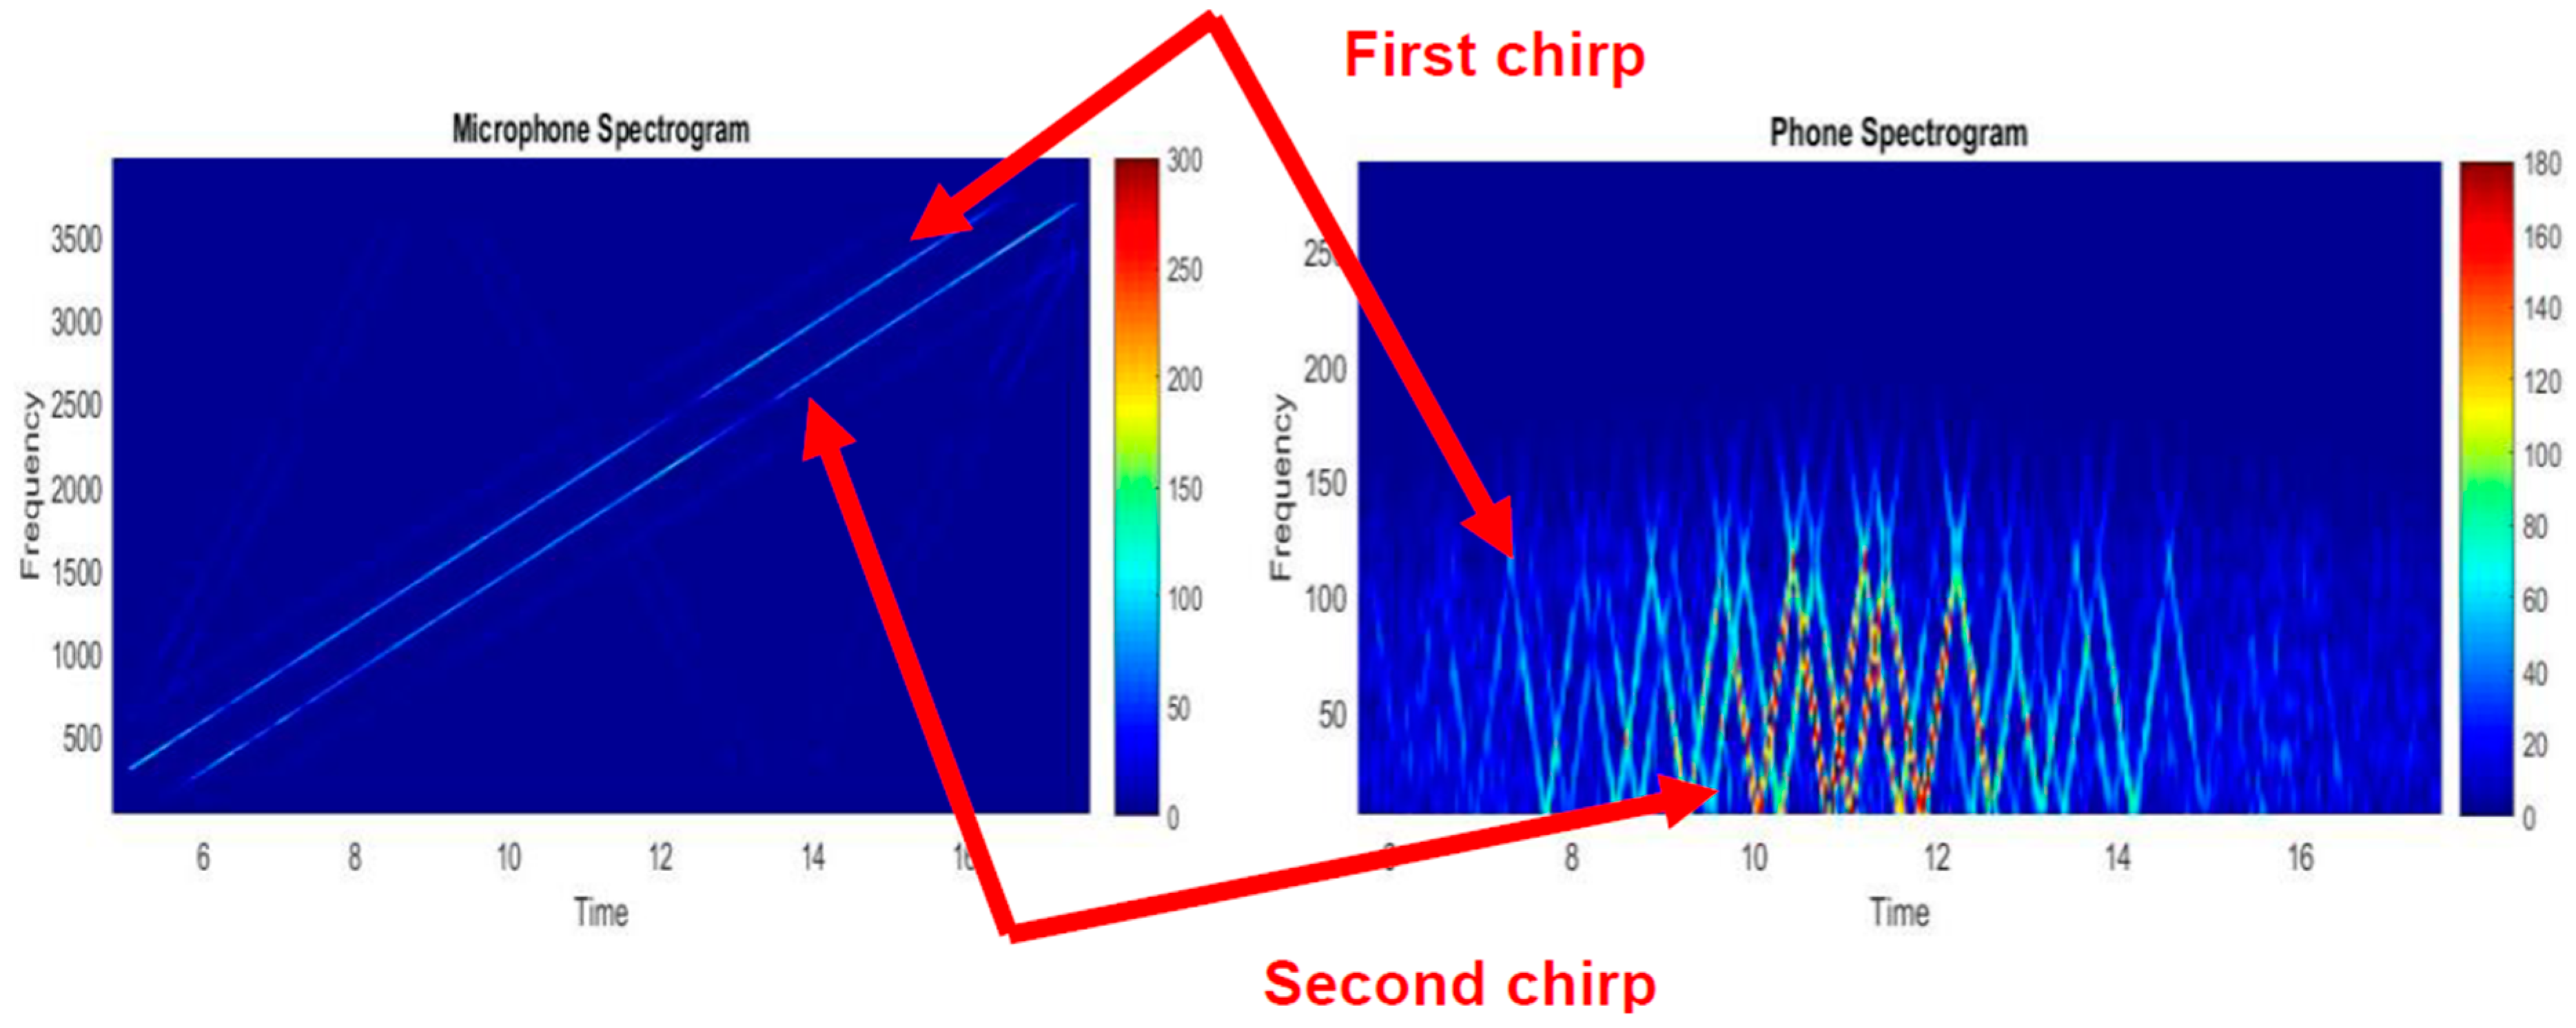
Next, we use two chirp signals with different starting frequencies as input sound signals which are shown in the
Figure 4. The response time-frequency diagrams of respond signals could be found in
Figure 5. It was found that both microphone and accelerometer can capture the two chirp signals. Similarly, we also found that for multiple frequency signals, the response signal frequency range of the built-in accelerometer was still mainly concentrated below 200 Hz and nonlinear distortion also still existed.
3. Nonlinear Characteristics Analysis
Chaotic time series analysis is one of the most important methods in nonlinear dynamics theory, and phase space reconstruction is also the main goal which would be achieved. Usually, the basic target of phase space reconstruction is to demonstrate the inherent nonlinearity of a system by studying the chaotic attractor and characteristic parameters of a specific variable in the phase space. So, how to find the most accurate attractor to effectively reconstruct the phase space for this particular built-in acceleration system? Assuming that we obtain a univariate time series output signal of accelerometer through the observation or experiment as
a state variable of the reconstructed phase space can be expressed as:
Thus, an
dimensional state space
could be formed. Moreover, the mathematical model is to be established in the state space
:
In [
9,
10], Takens and Mane proved that the reconstructed state space
has the same topological structure and geometric features with the original chaotic dynamic system, provided that the parameters
and
are properly selected. It also means that all these differential and topological invariants in the original chaotic dynamic system could be calculated in the reconstructed state space. Furthermore, the dynamic system can be analyzed and predicted by establishing a specific mathematical model in the state space
. It is clear that the correct determination of delay time
and embedding dimension
is the key for phase space reconstruction. In the modern chaos theory, it is generally believed that these two parameters are dependent on each other [
11,
12]. Therefore, we could obtain the attractor of a built-in accelerometer system and complete phase space reconstruction just after the two parameters have been simultaneously determined.
It can be known from the delay embedding theorem [
13,
14] that the delay time
can be randomly selected if the time series is infinitely long, noiseless, and infinitely accurate. However, in a general practical application, the accelerometer output signal would be a time-limited sequence with noise pollution and measurement error. Thus, the delay time
can only be chosen depending on experience. Basically, the principle of it is to give
and
a certain degree of independence to process them as independent coordinates during the reconstruction of phase space. If
is small
and
would get too close to effectively differentiate in the phase space. Moreover, they are also very close to the “diagonal” in the reconstructed phase space, which means a large amount of redundant information would be carried by the attractor. Thus, the phase space would be disordered and mixed without rules. On the contrary, the attractor track would be projected in two completely opposite directions because of the minor relevancy between
and
, which means that the actual evolution rule of the trajectory in the phase space cannot be reflected.
Referencing to the C-C algorithm [
15,
16], we define
as the delay time window while
is the delay time. So, the correlation integral can be represented as follows:
In Equation (3),
is a step function,
and
represent the length of the data set and
dimensions embedding points, respectively. The correlation integral in Equation (3) is a cumulative distribution function, which shows that the probability of the distance between any two points in the phase space is less than the radius
. Further, we define a statistic:
When the excitation input of built-in accelerometer in the smart device is a voice signal, in order to calculate the detection statistic in Equation (4), we split the output variable time series
into
disjoint sub-sequences which are shown in Equation (5):
The lengths of all these sub-sequences are
,
is reconstruction delay time. The detection statistic in Equation (4) of each sub-sequence can be calculated as follows:
Generally, output signal sequences of the built-in accelerometer are time-limited and correlated between each other. Therefore, is not zero. Moreover, the autocorrelation characteristics between these output signals also can be reflected by .
According to the autocorrelation properties of statistics signal, in order to make all points in the reconstructing phase space close to a uniform distribution, there are two optional values for the optimal delay time
. One is the first zero coordinated point of
, another is time point of the minimum mutual differentiation between
to all radius
. In addition, an equation can be defined as follows to measure this differentiation.
Therefore, local maximum time would be the zero coordinate points of
or minimum value of
. Besides, the optimal delay time
would be the first one among these local maximum time points [
17,
18,
19,
20].
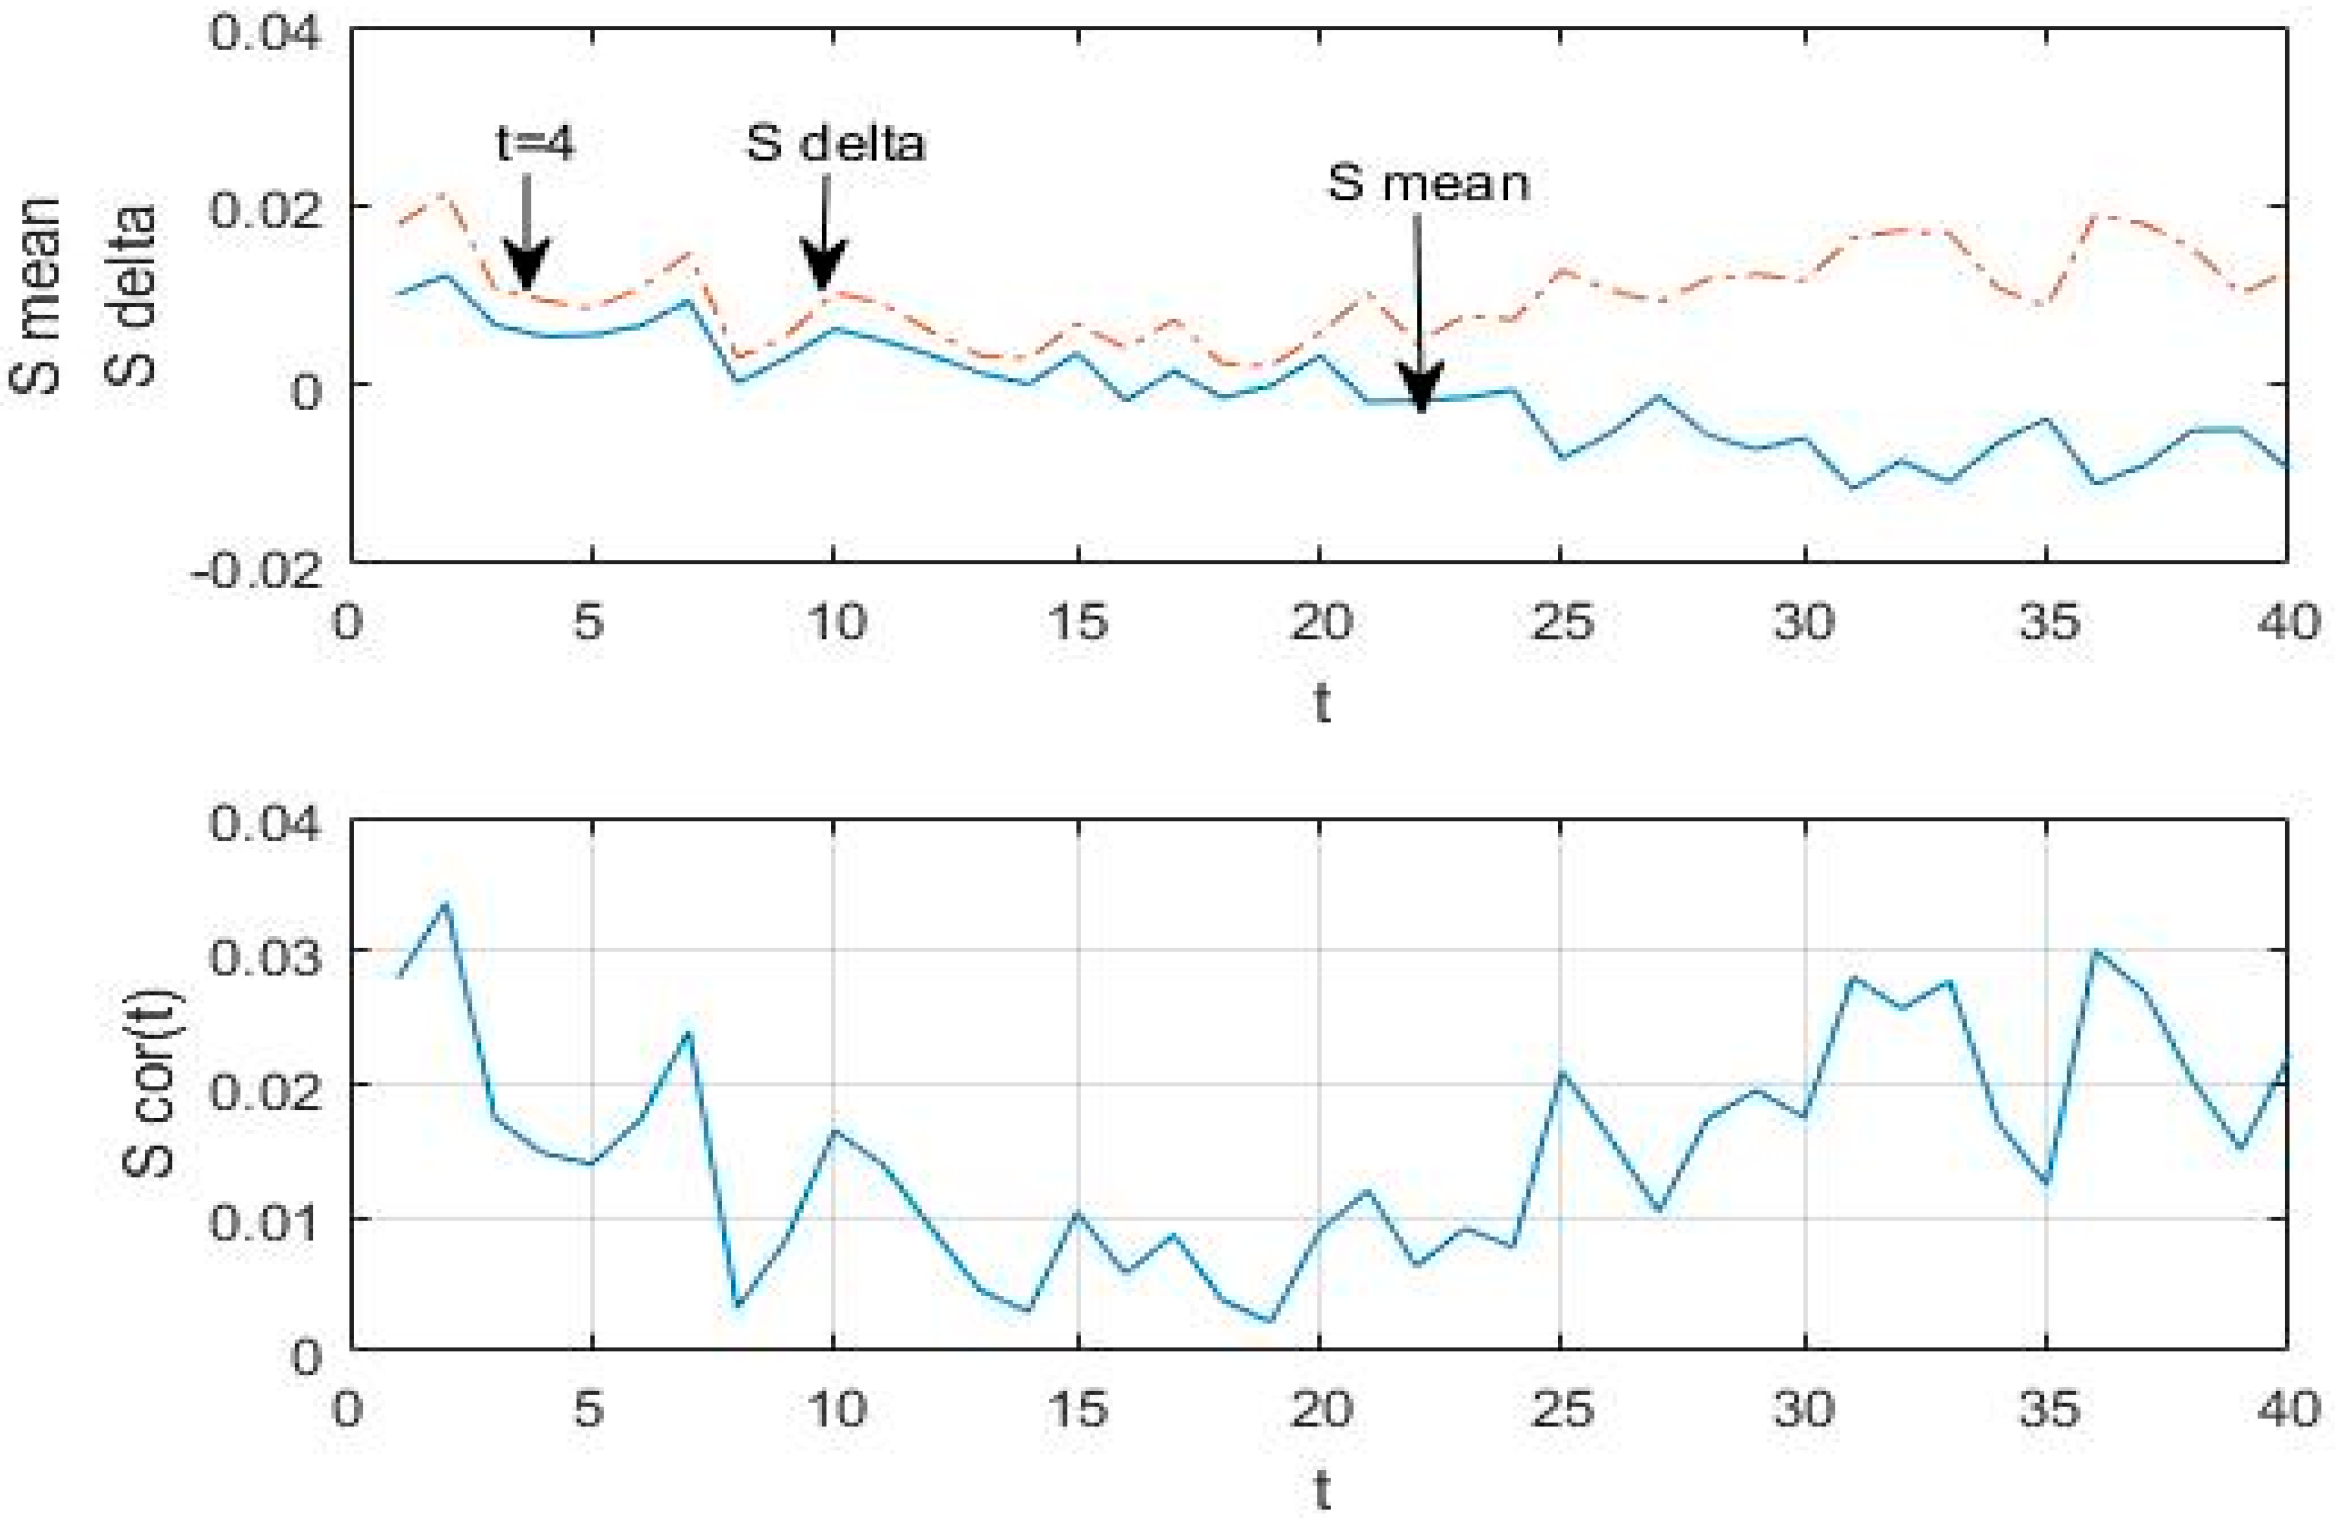
Then, the relevant statistics can be calculated by selecting proper parameters. According to the mathematical statistics results of asymptotic distribution, we chose
,
,
and put them into Equations (6) and (7) separately:
By this stage, the first zero of
or the first minimum point of
is the optimal time delay
in the reconstructed phase space of built-in accelerometer. Further, Equations (8) and (9) also can be synthesized as to follow:
The globe minimum value of
is time-window length of the built-in accelerometer output signal sequence. An instance of
,
and
base on a measured acceleration signal is shown in
Figure 6.
4. Experiments and Results Analysis
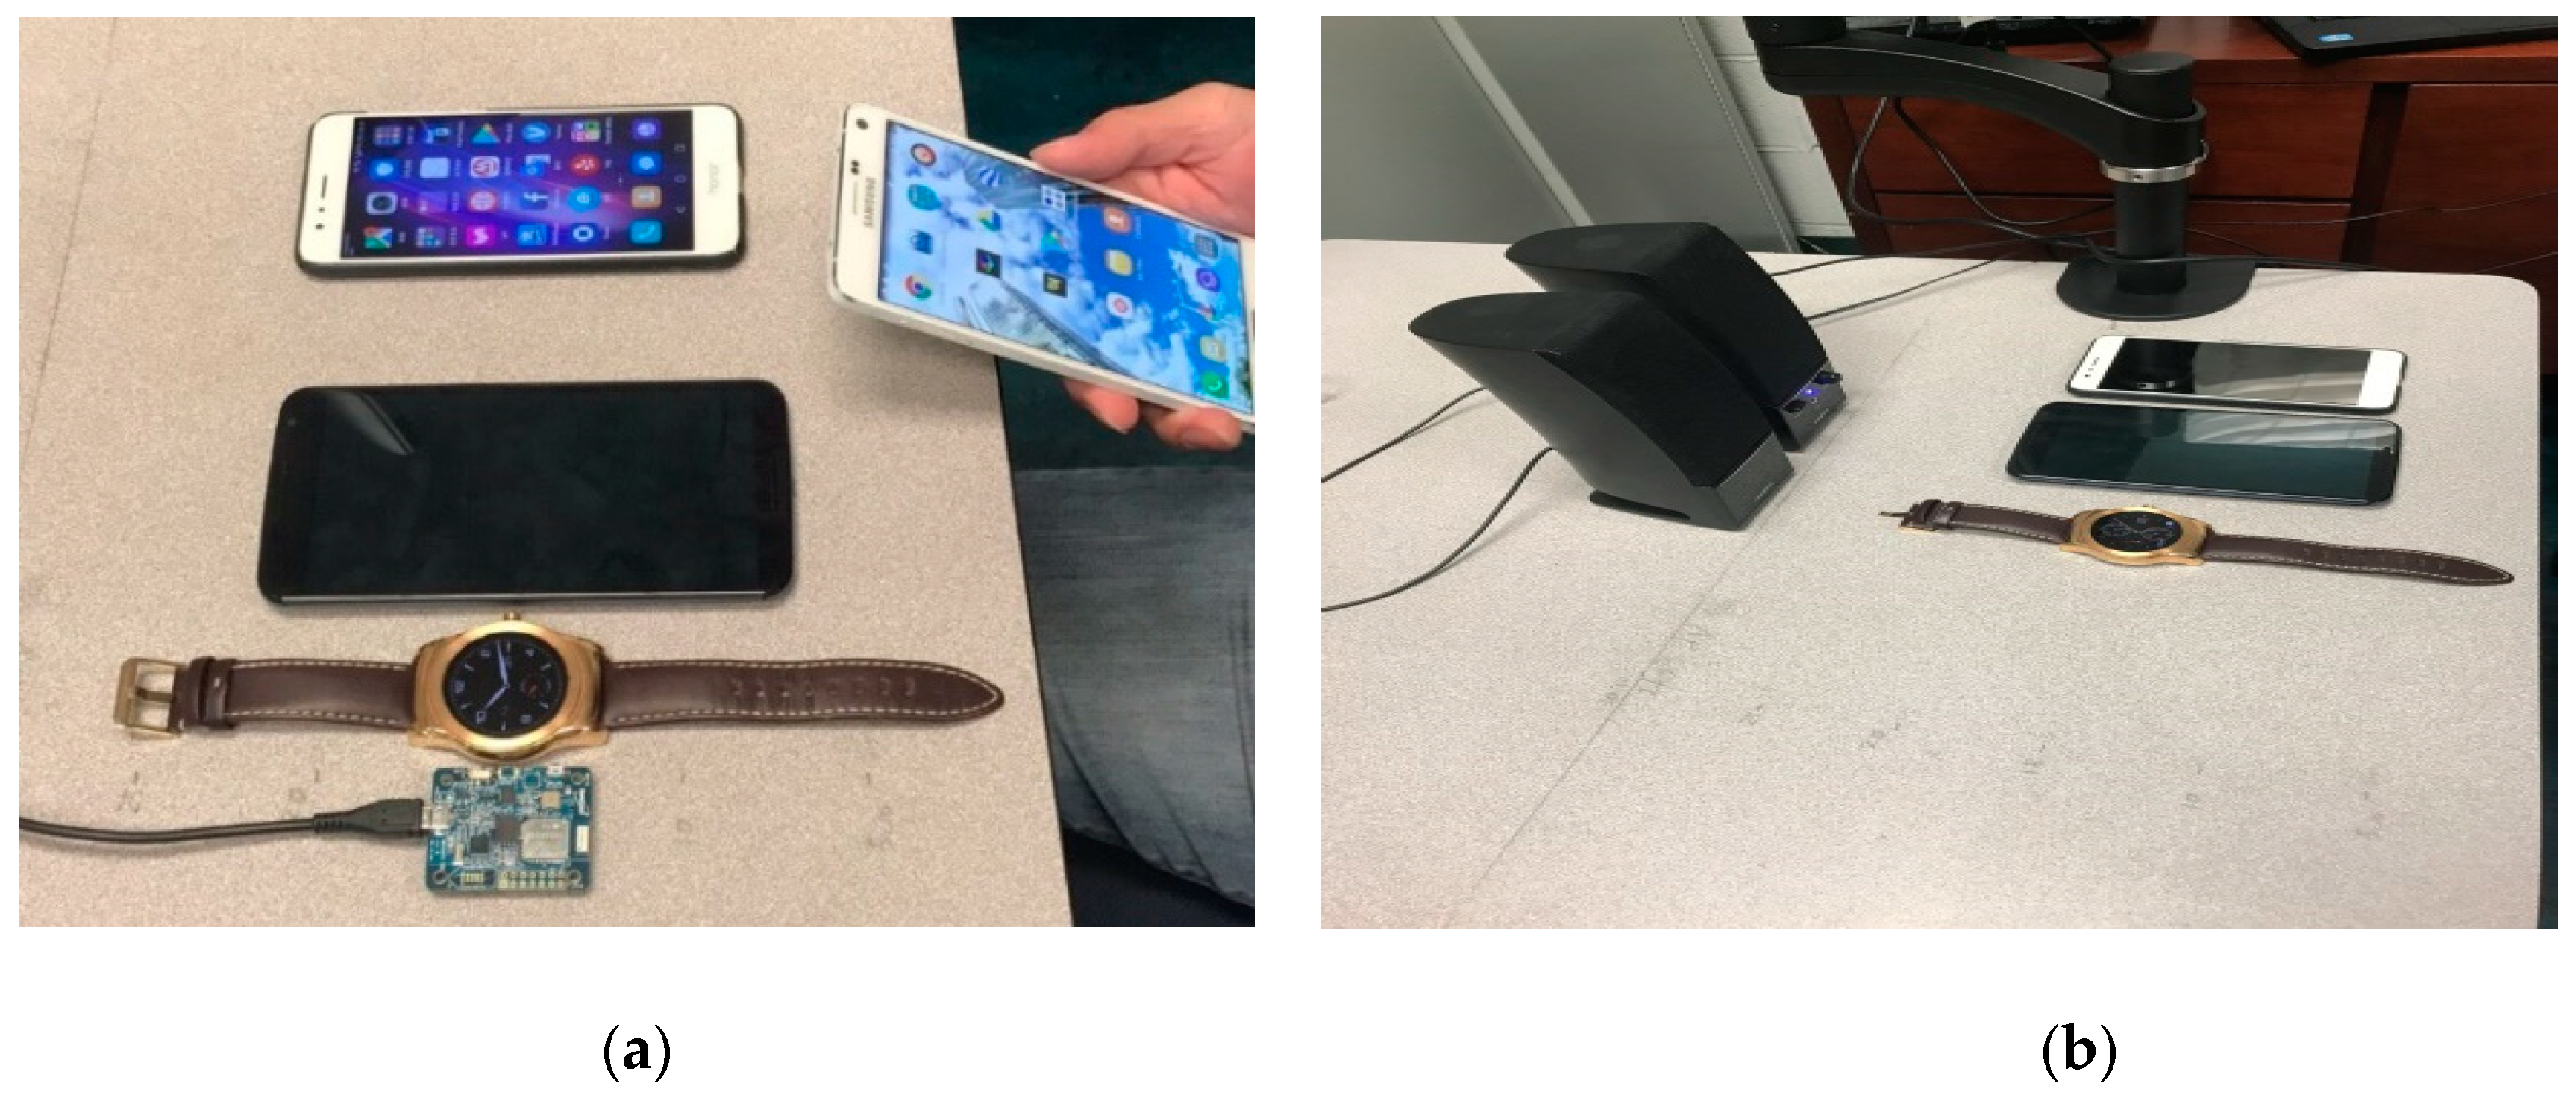
We verified the nonlinearity of built-in accelerometer in the smart device by experiments. As shown in
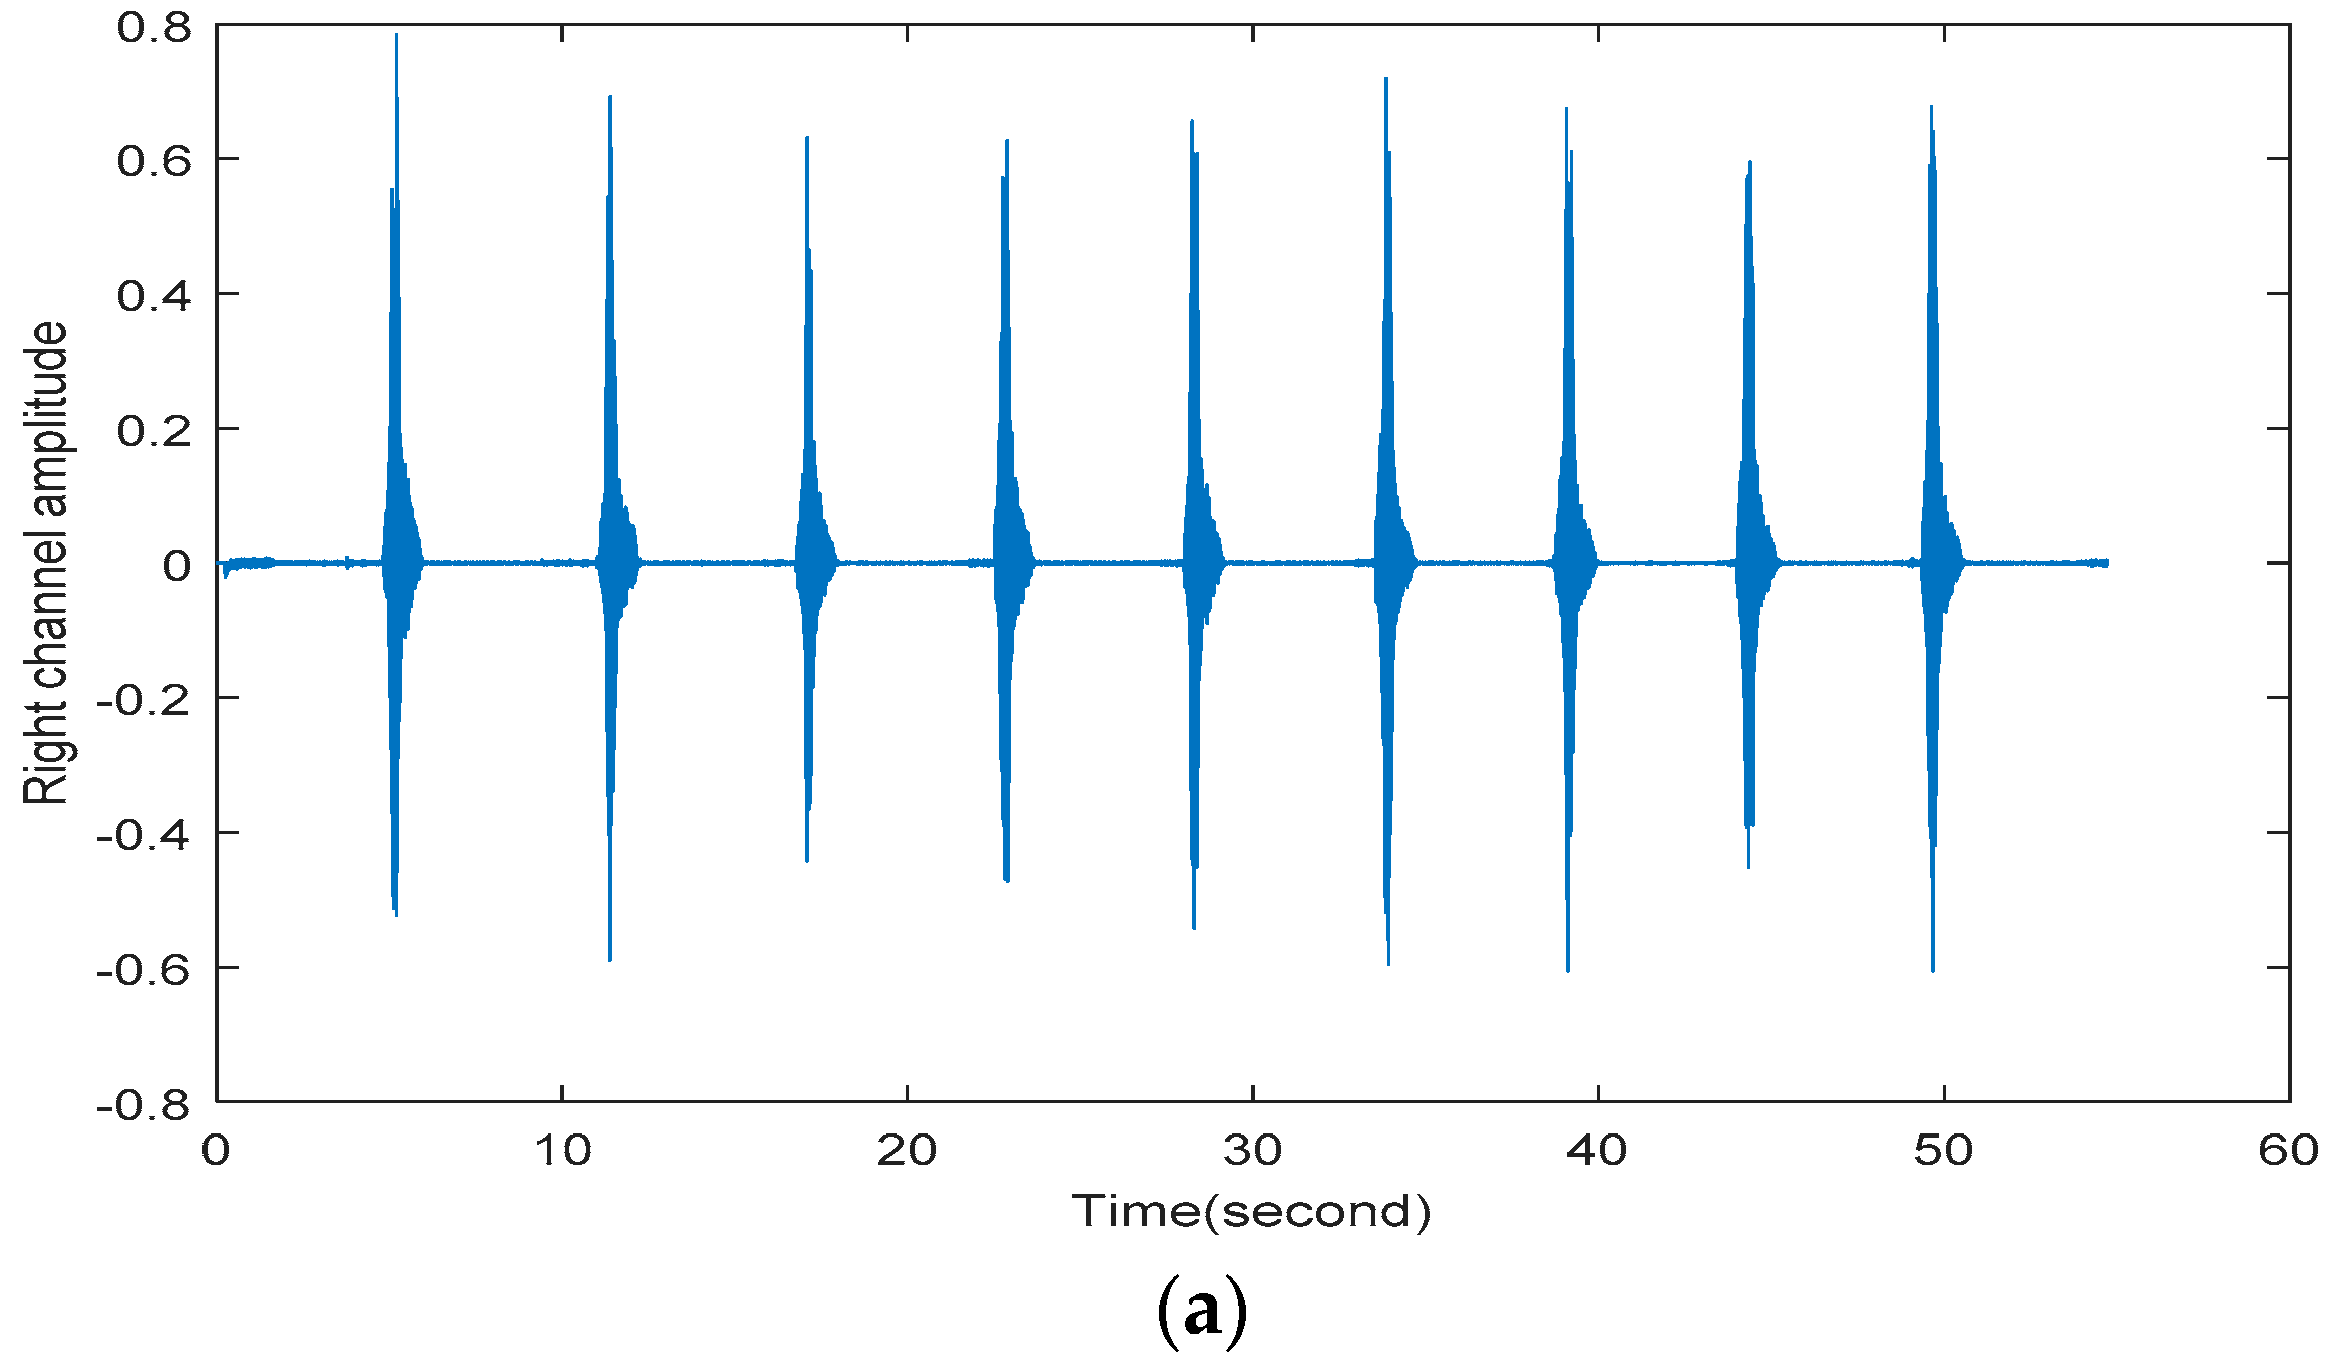
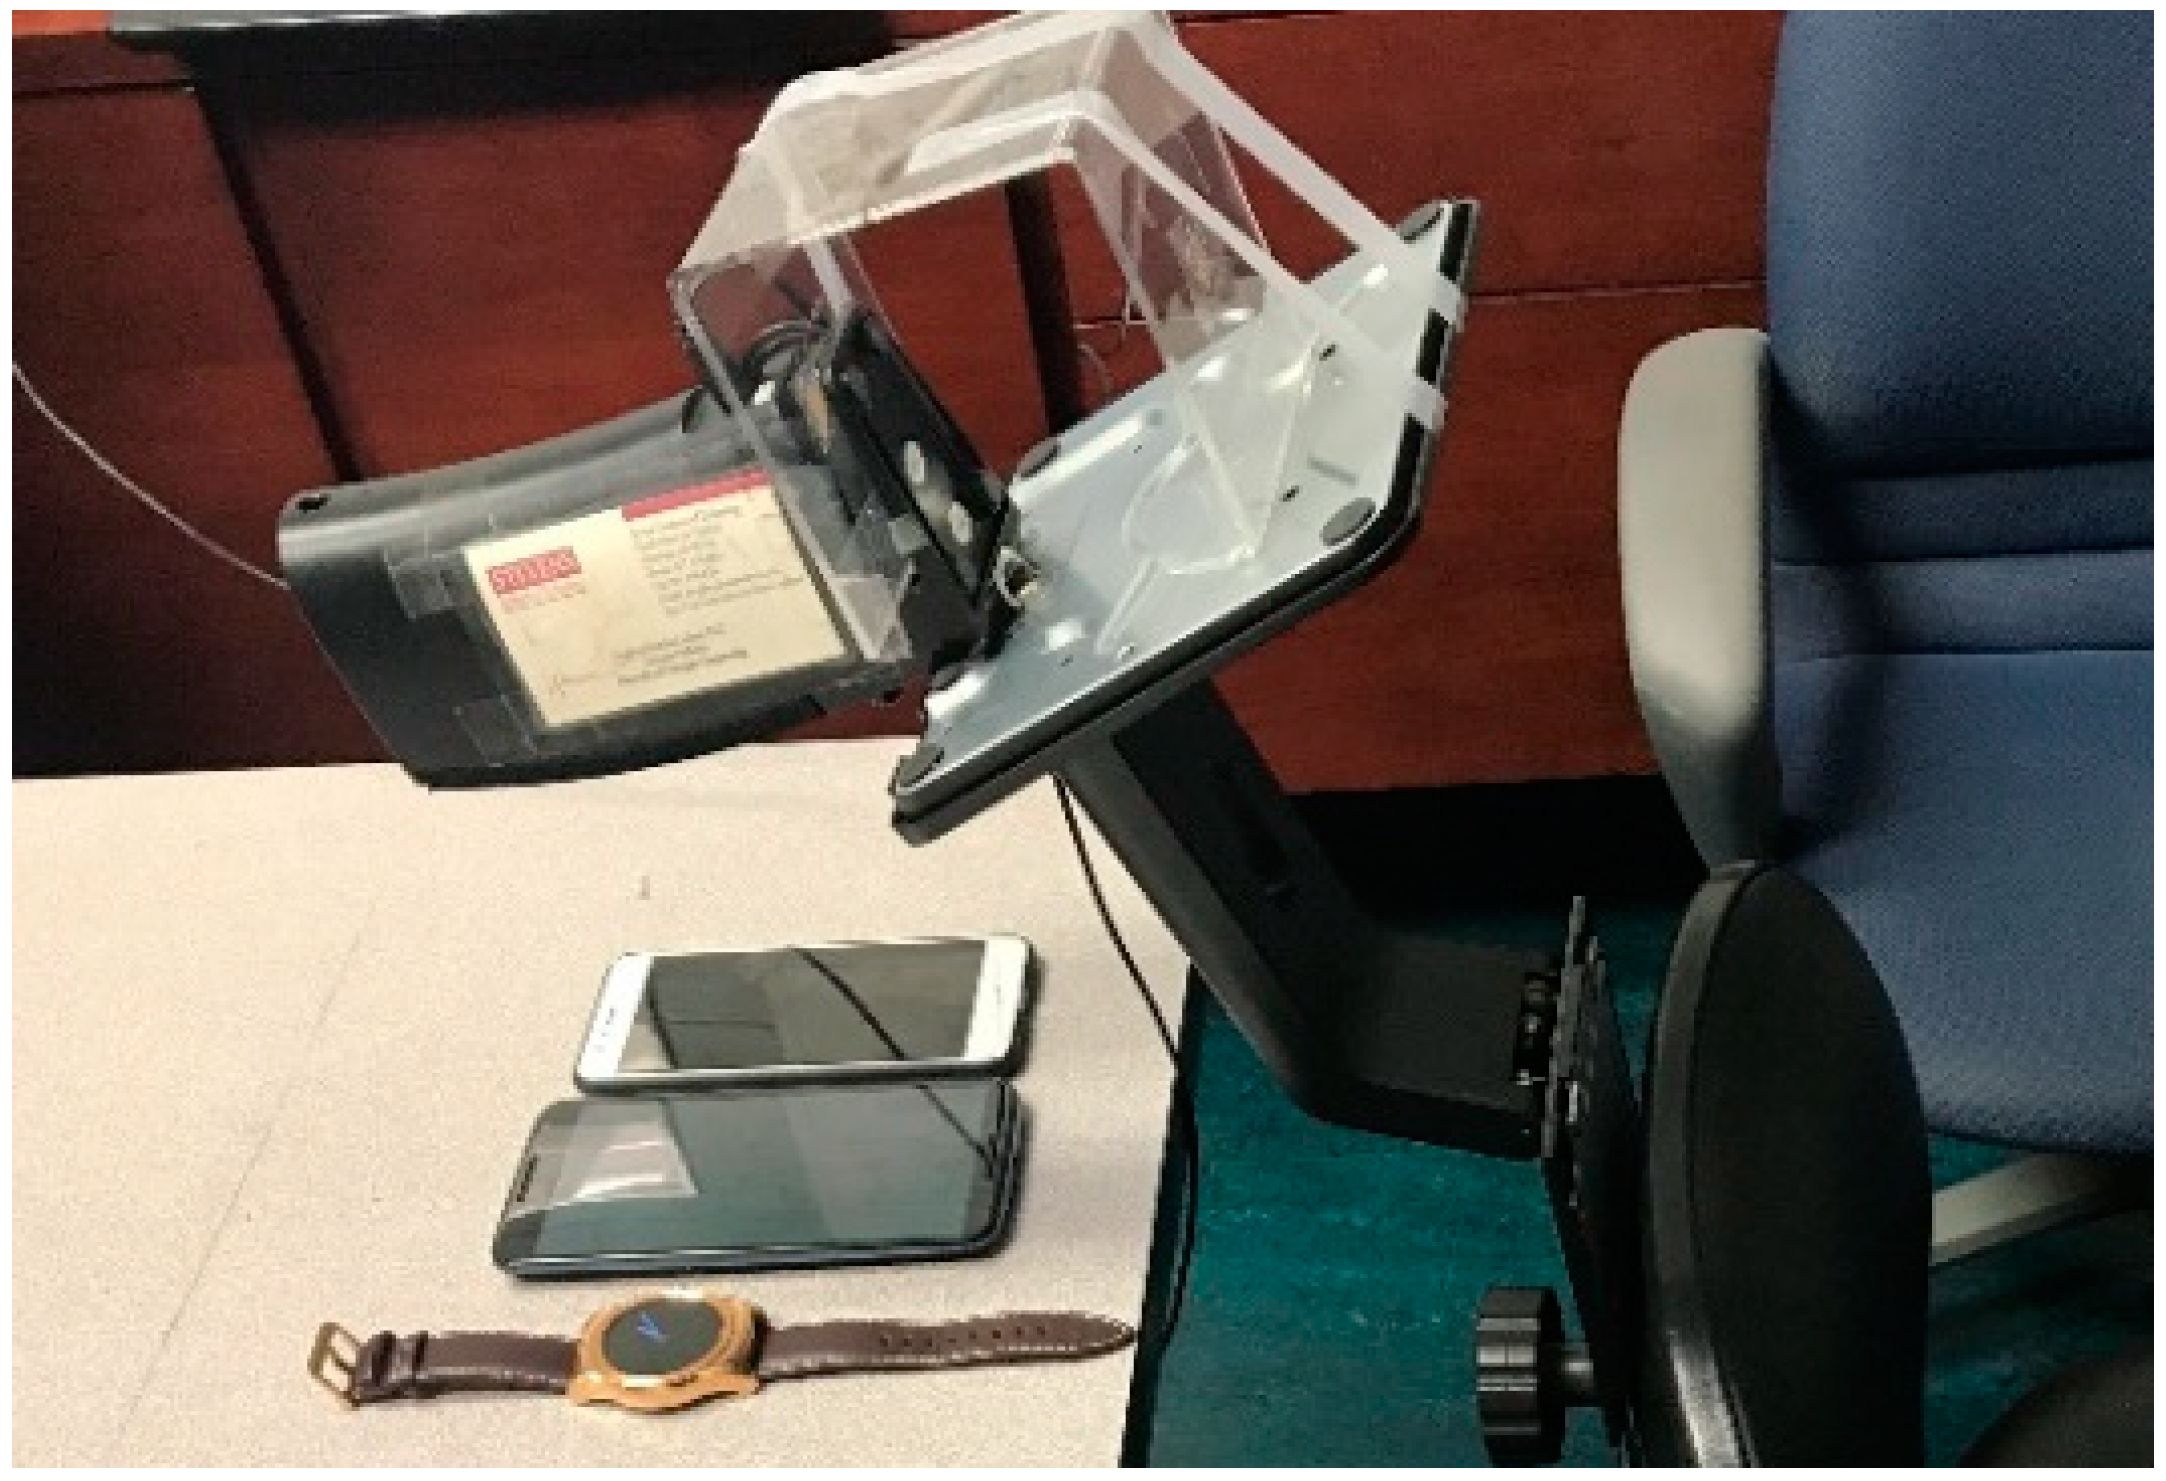
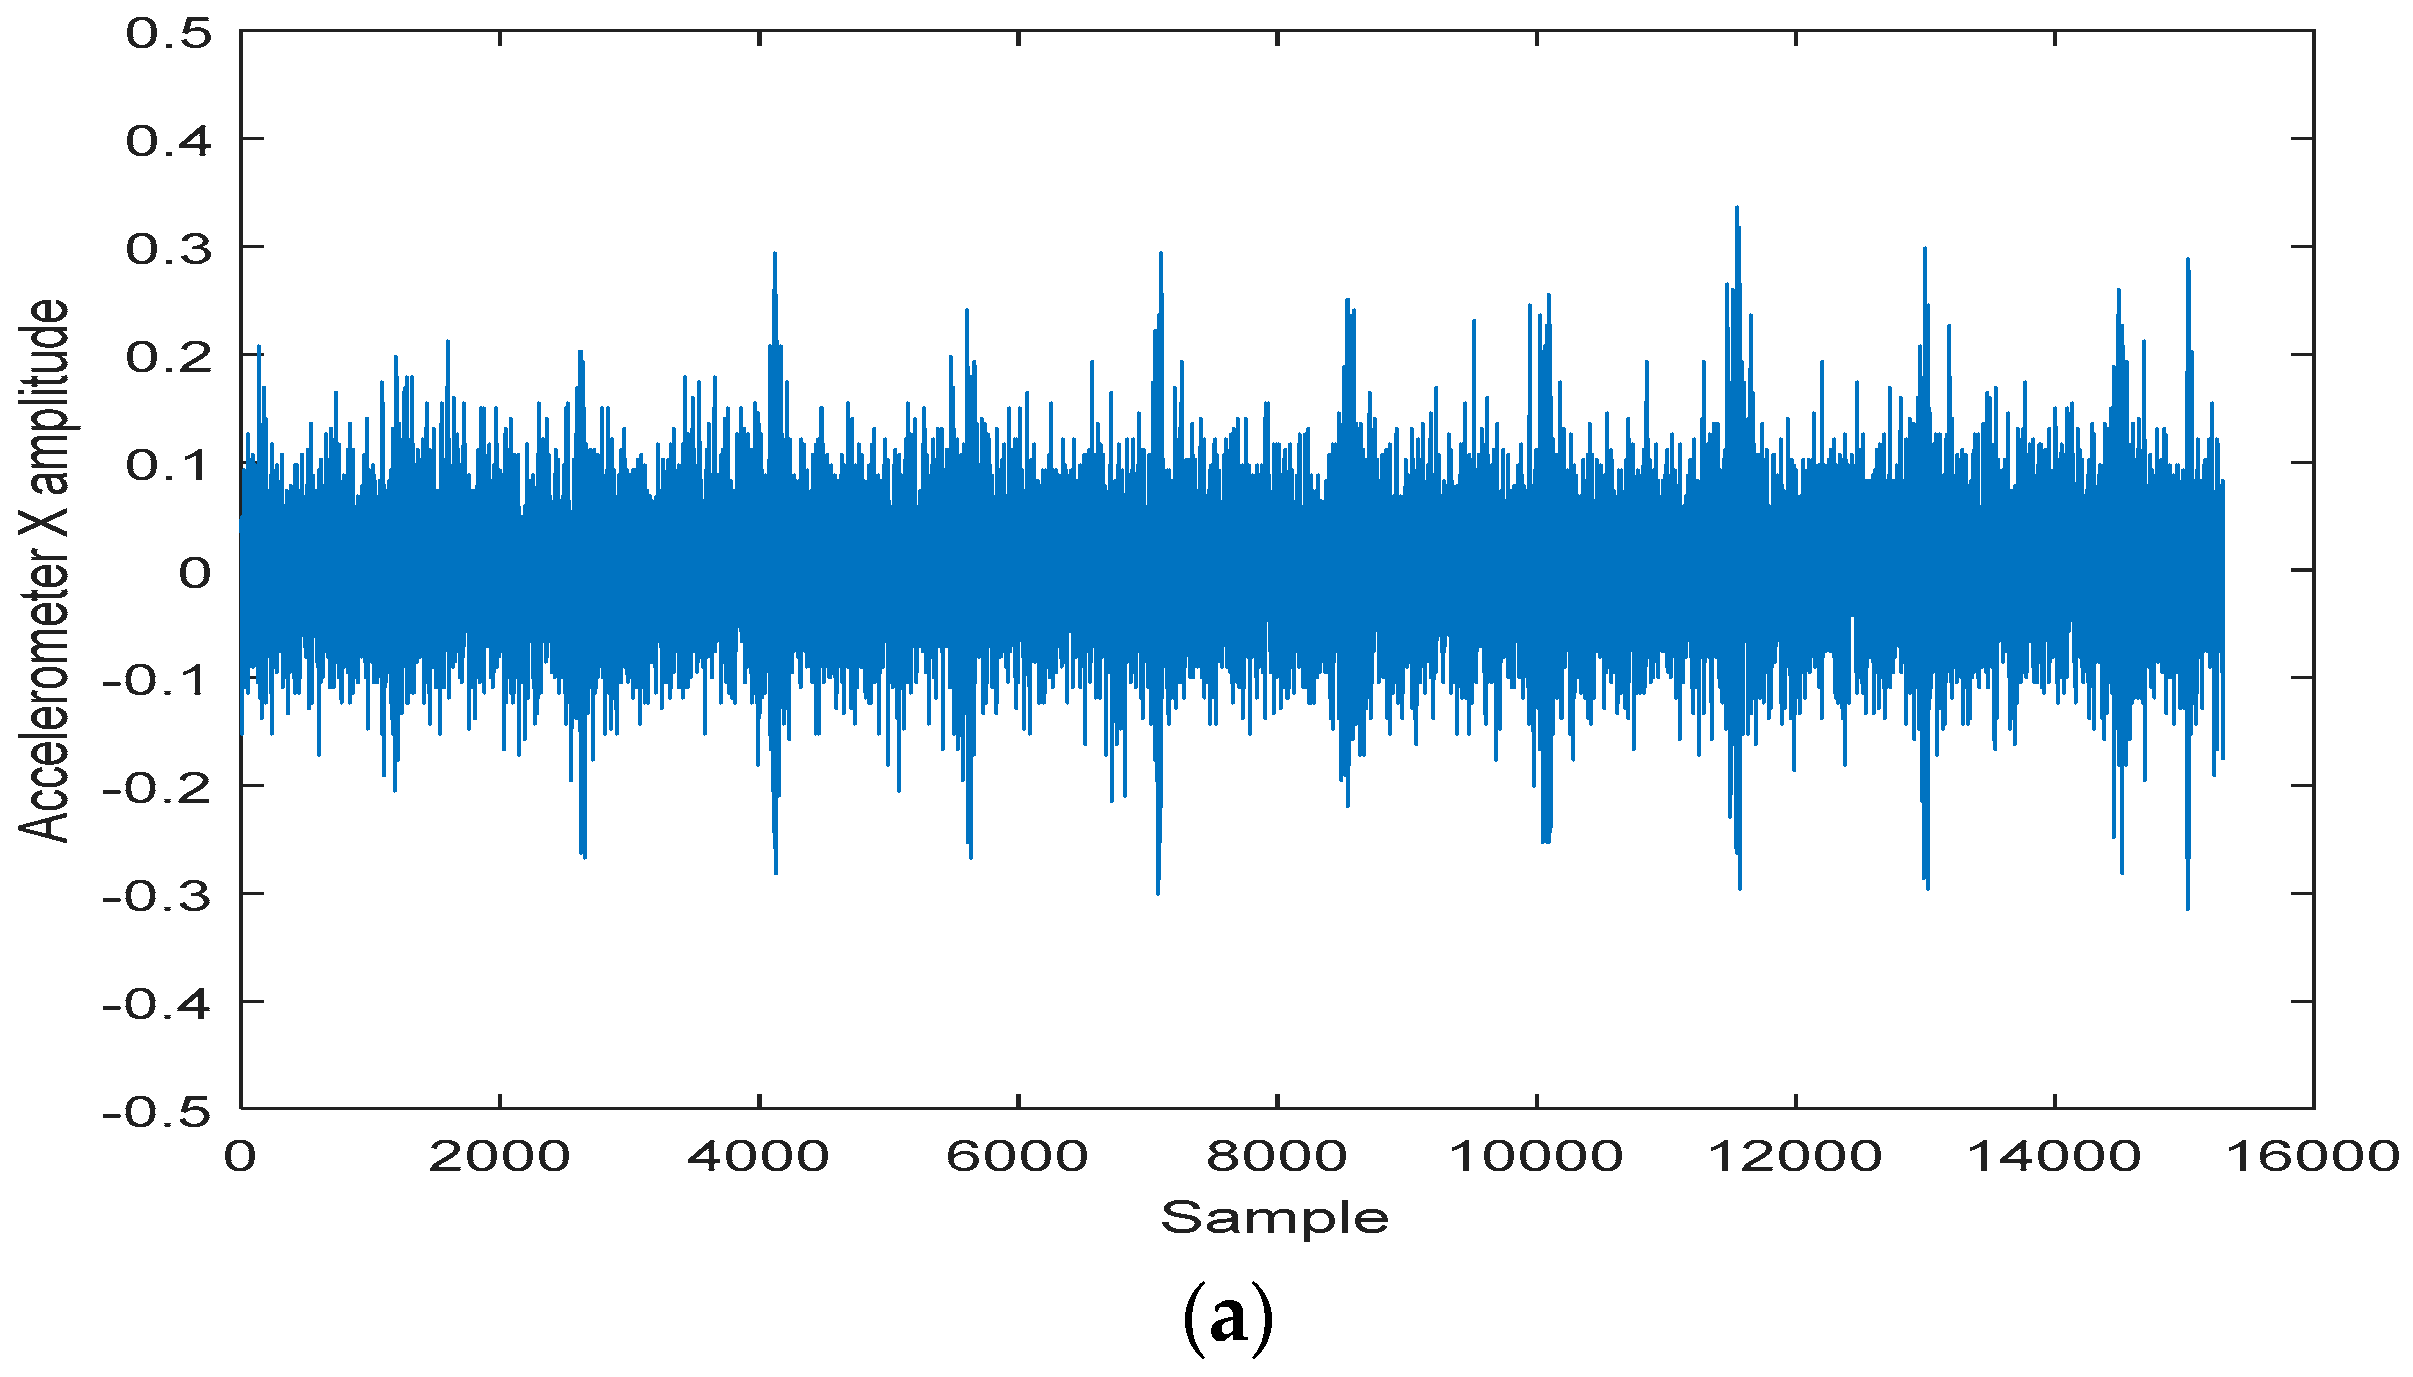
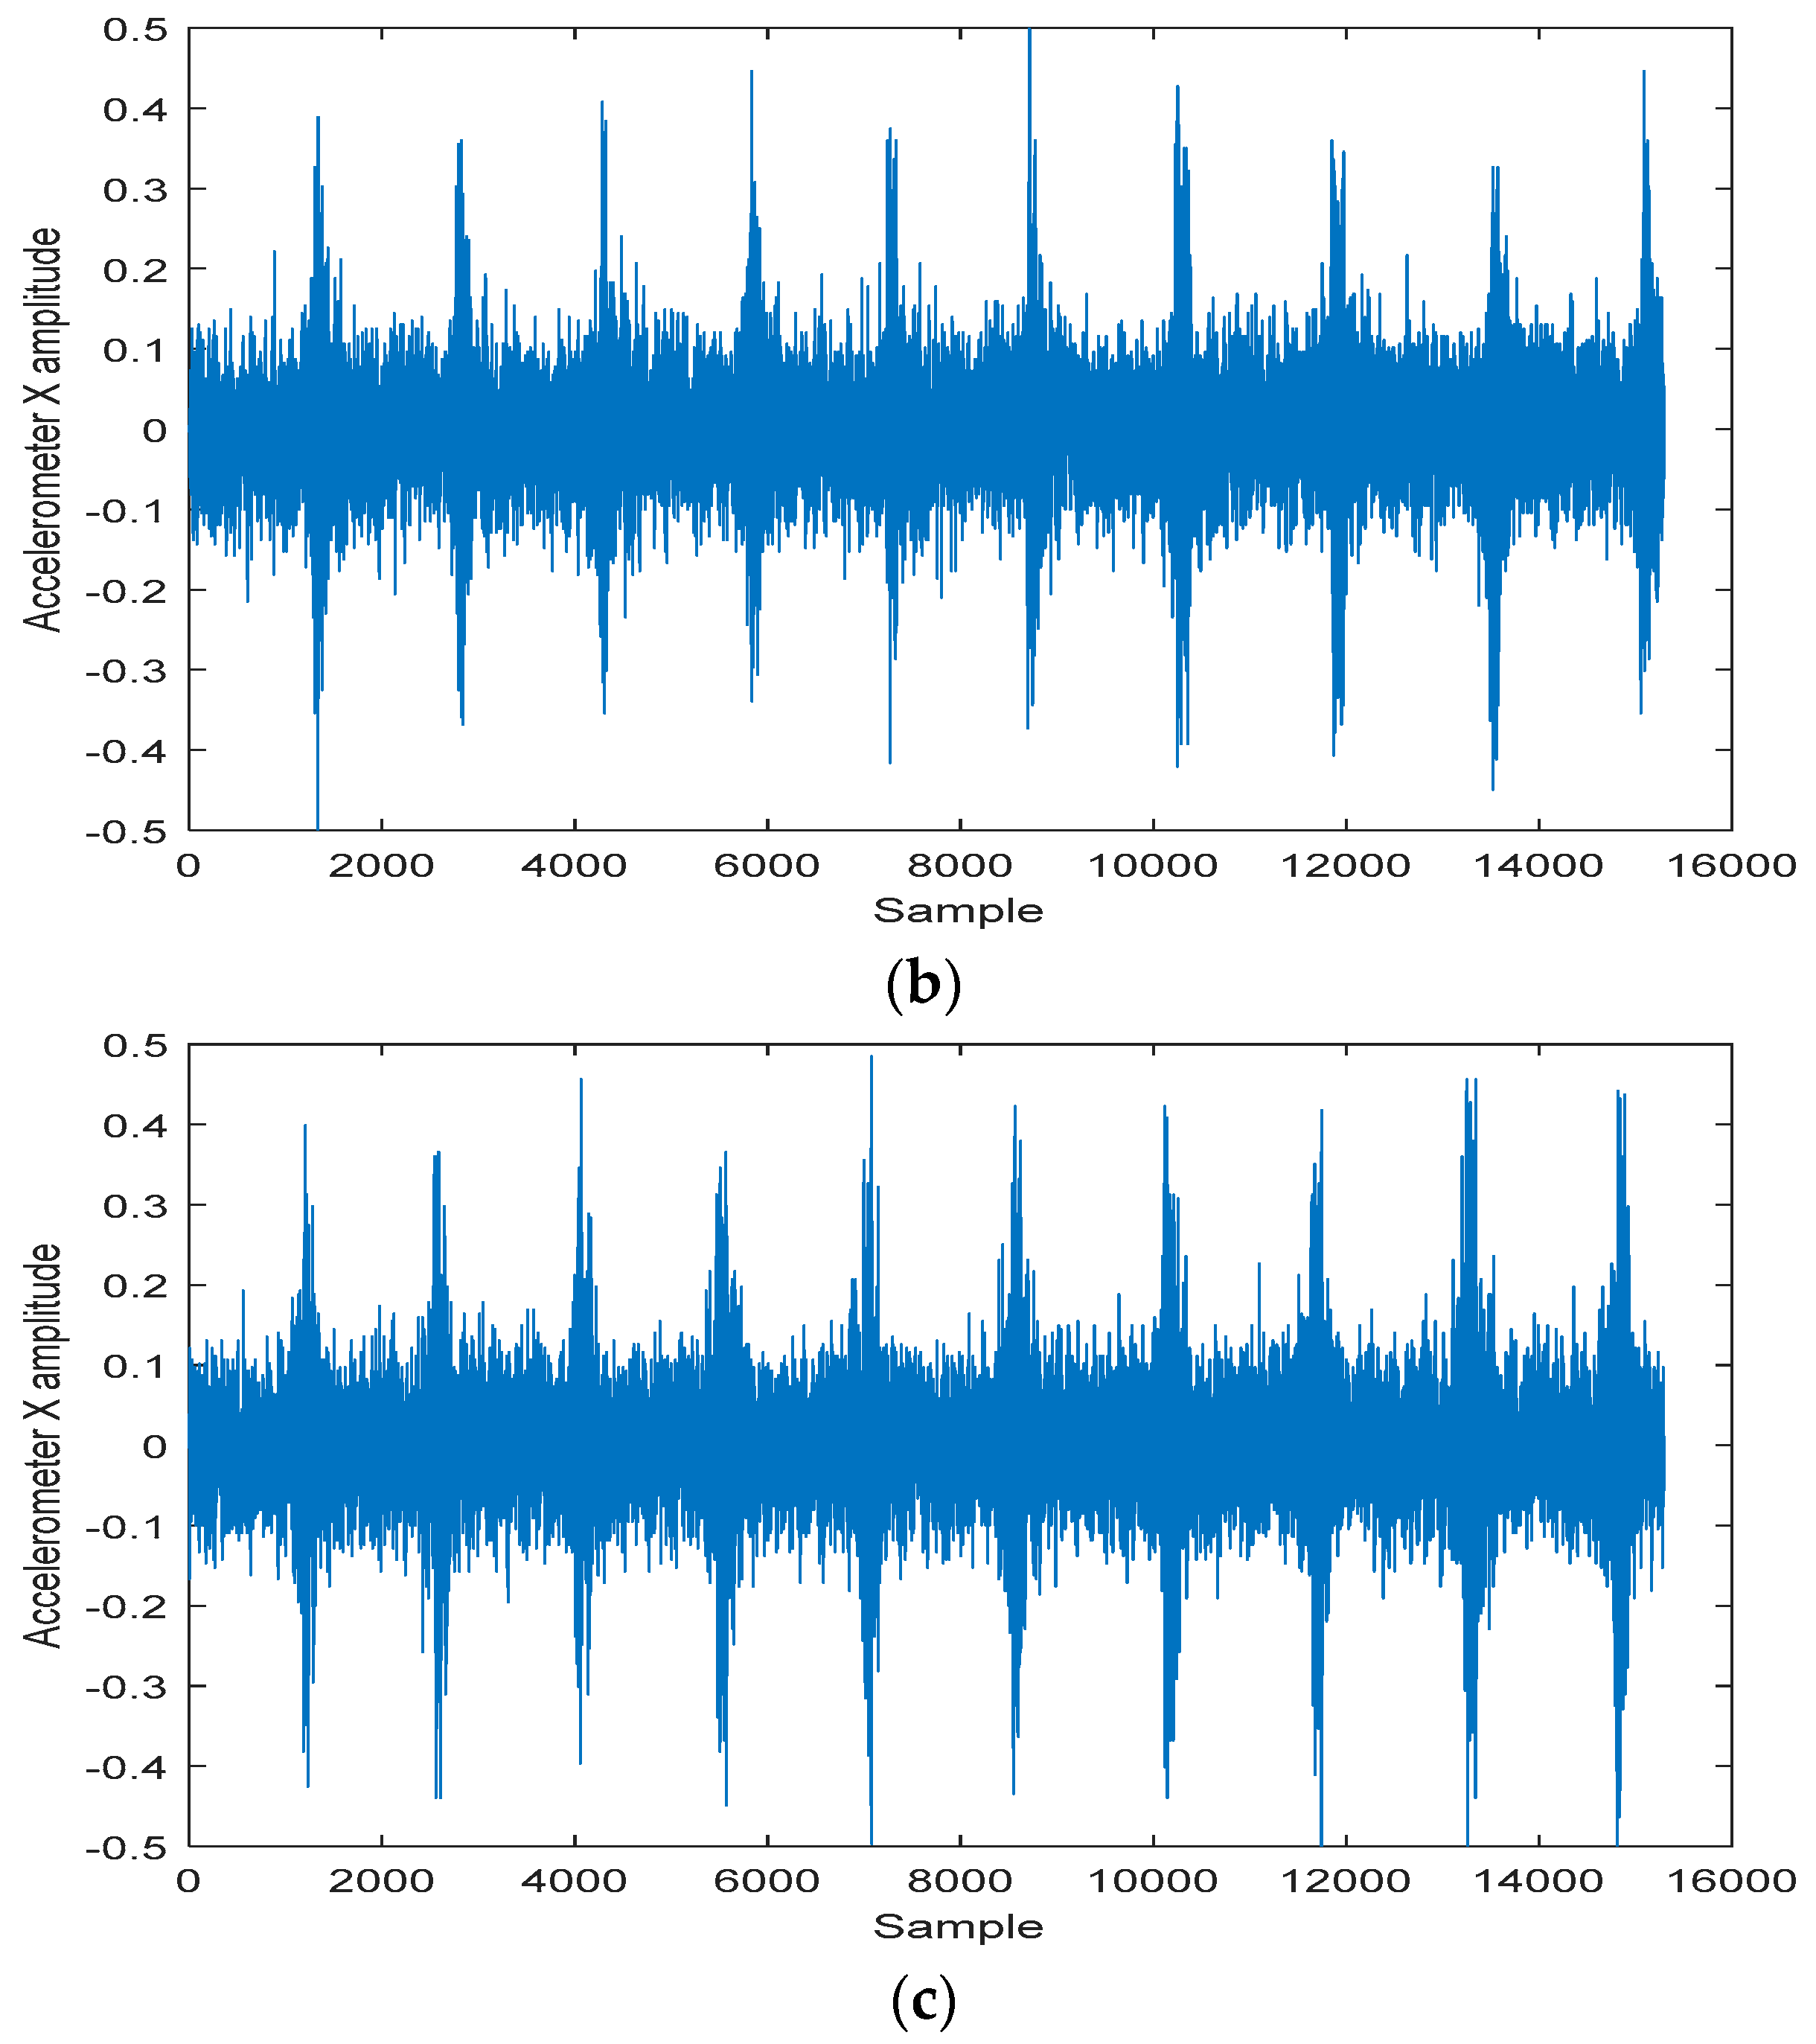
Figure 7, we placed two smartphones (one is the Motorola Nexus 6, another is the HUAWEI Honor 8) closely on the surface of a still wooden table. In order to obtain the voice excitation signal with stable intensity and frequency, the smart-phones received the voice signal from two loudspeakers which were fixed above at close distance. Then, the output signals of an accelerometer in the Motorola Nexus 6 were extracted. Simultaneously, the original voice from loudspeakers was recorded by HUAWEI Honor 8 as a comparison. As excitation signals, the three specific words “on”, “zero” and “two” were spoken and played by loudspeakers. Each word was repeated 10 times with 3 seconds intervals between each repetition. Moreover, we repeated the experiment under a different distance between the speaker and mobile phone with 5 cm, 10 cm, 15 cm, 25 cm, and 30 cm, respectively.
The output signals of the built-in accelerometer on X, Y and Z-axis at different distances from loudspeakers are shown in
Figure 8. As a comparison, the output signals of the built-in microphone at different distances are shown in
Figure 9. Besides, it is important to note that the gravity which is loaded on the Z-axis signal needs to be eliminated. It can be clearly found that the built-in accelerometer had obvious response output when we made voice as an excitation although with noise effect.
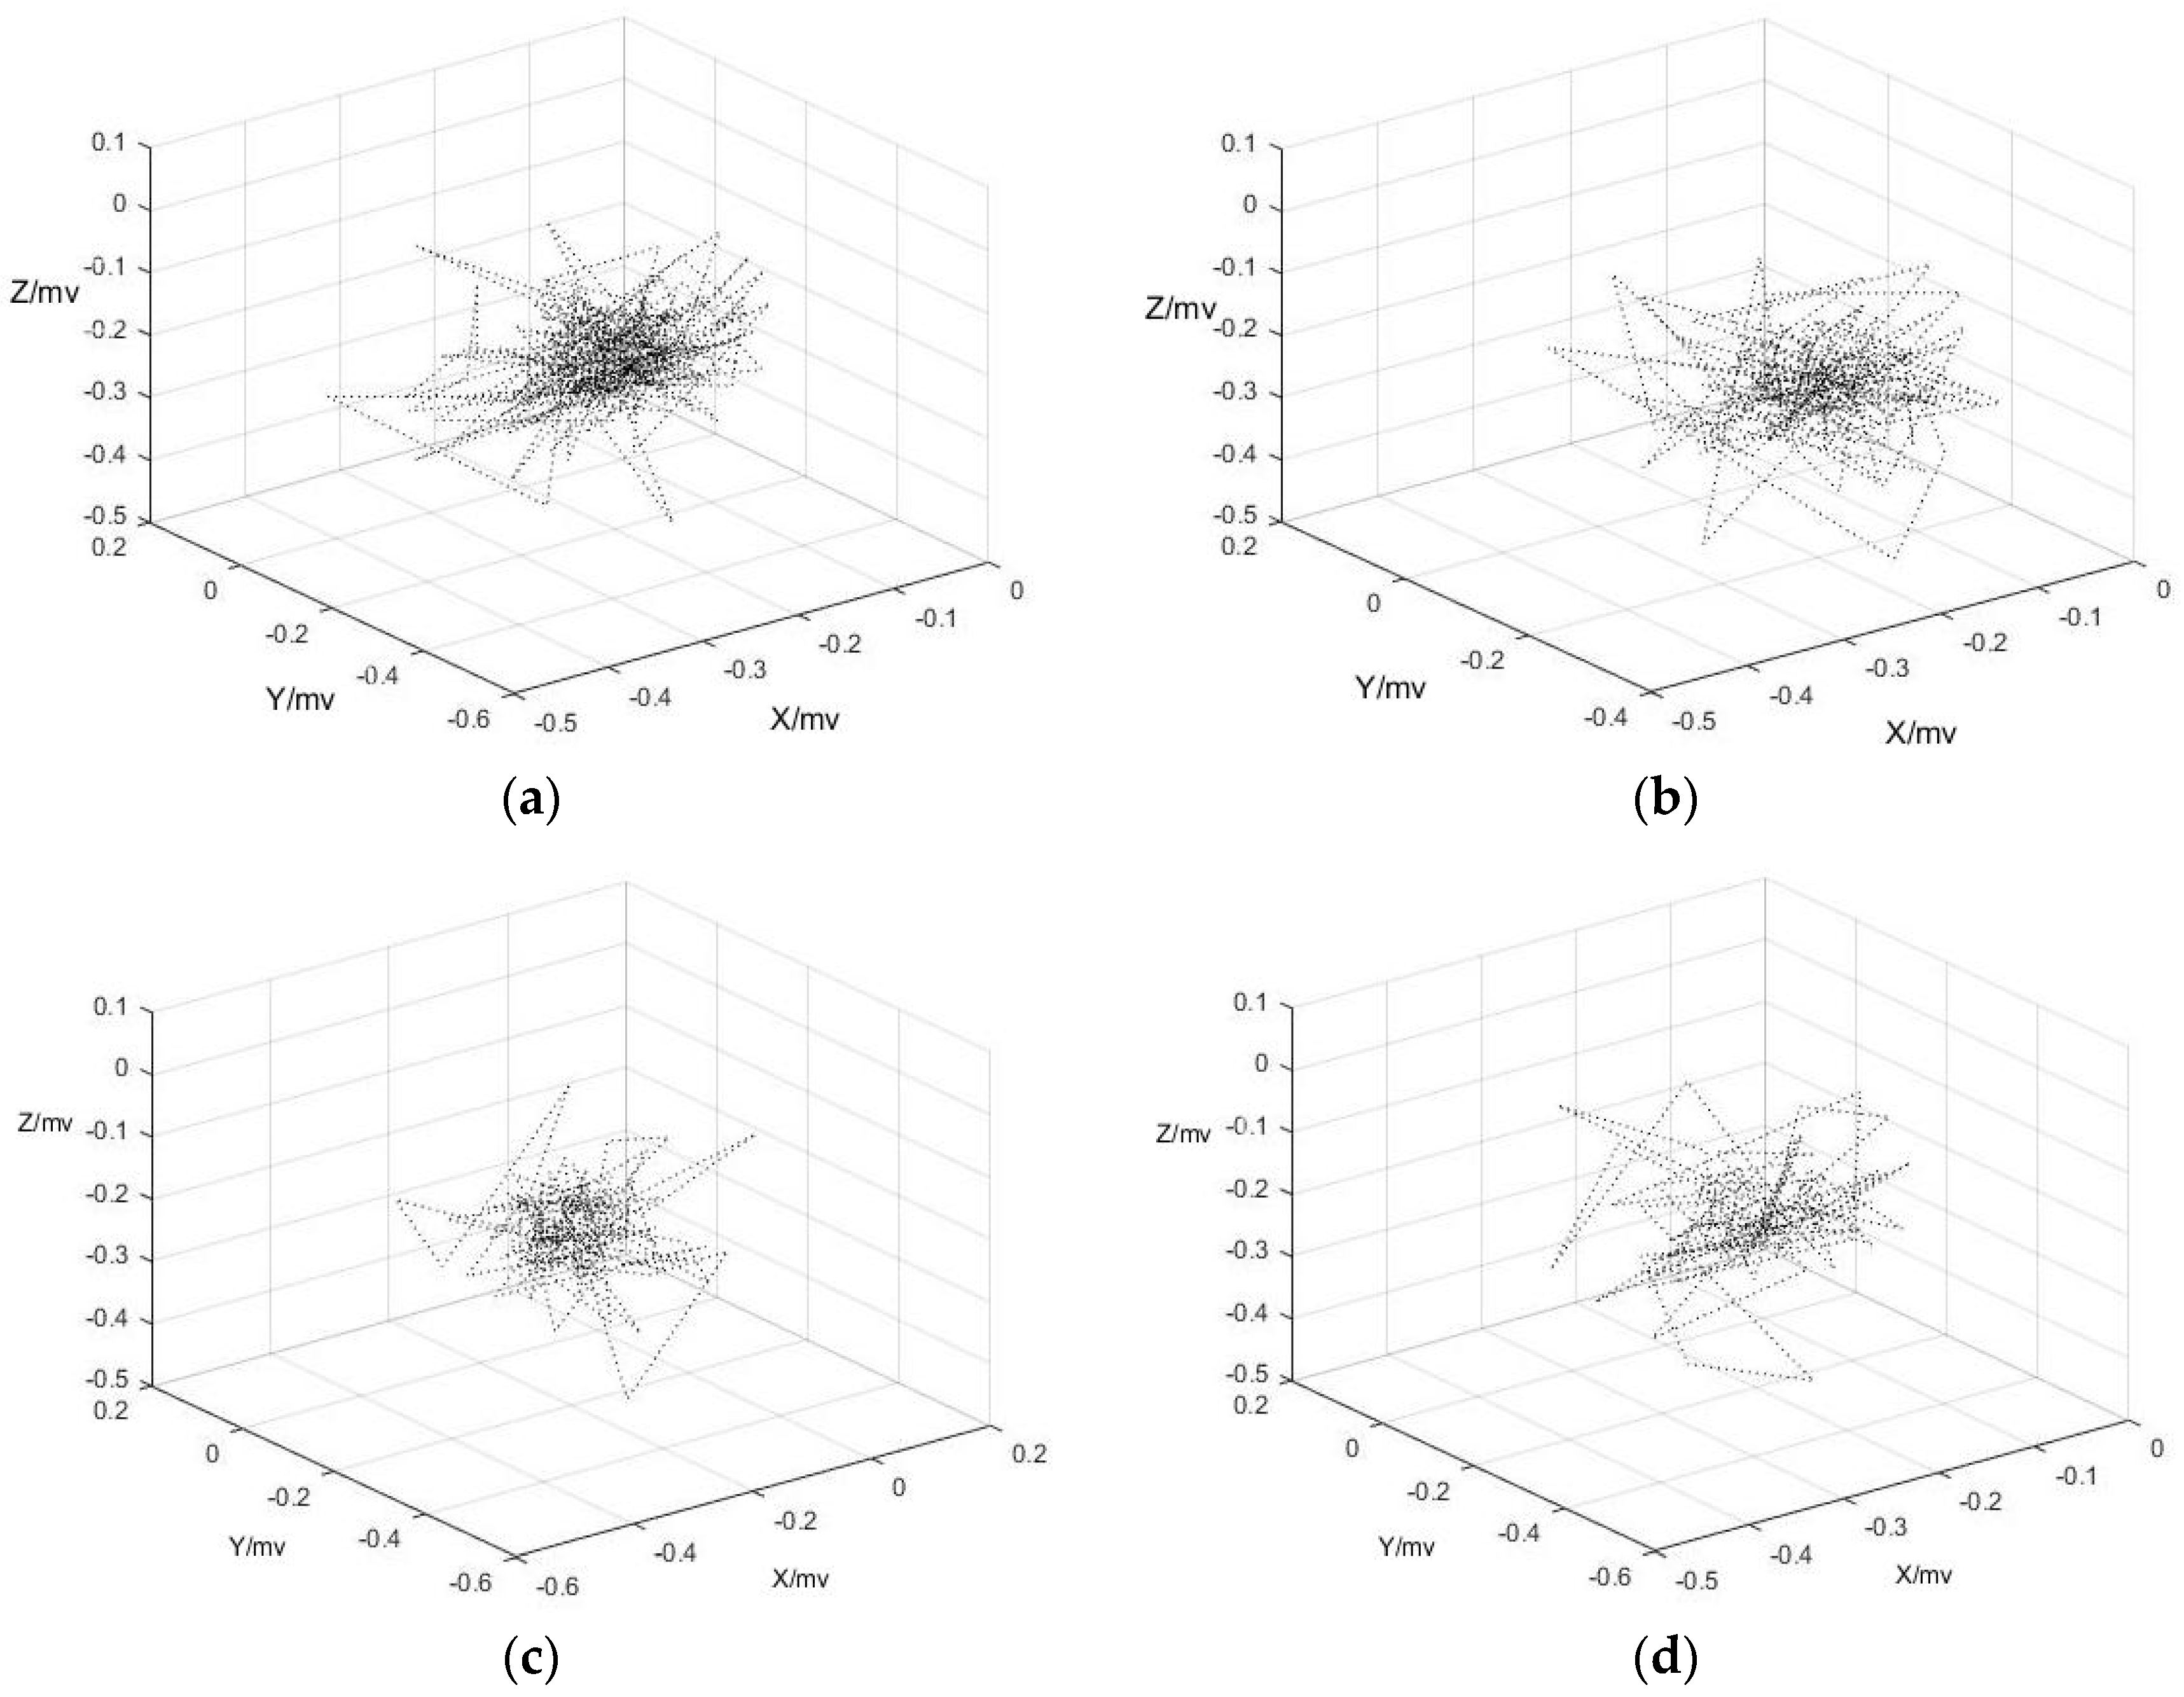
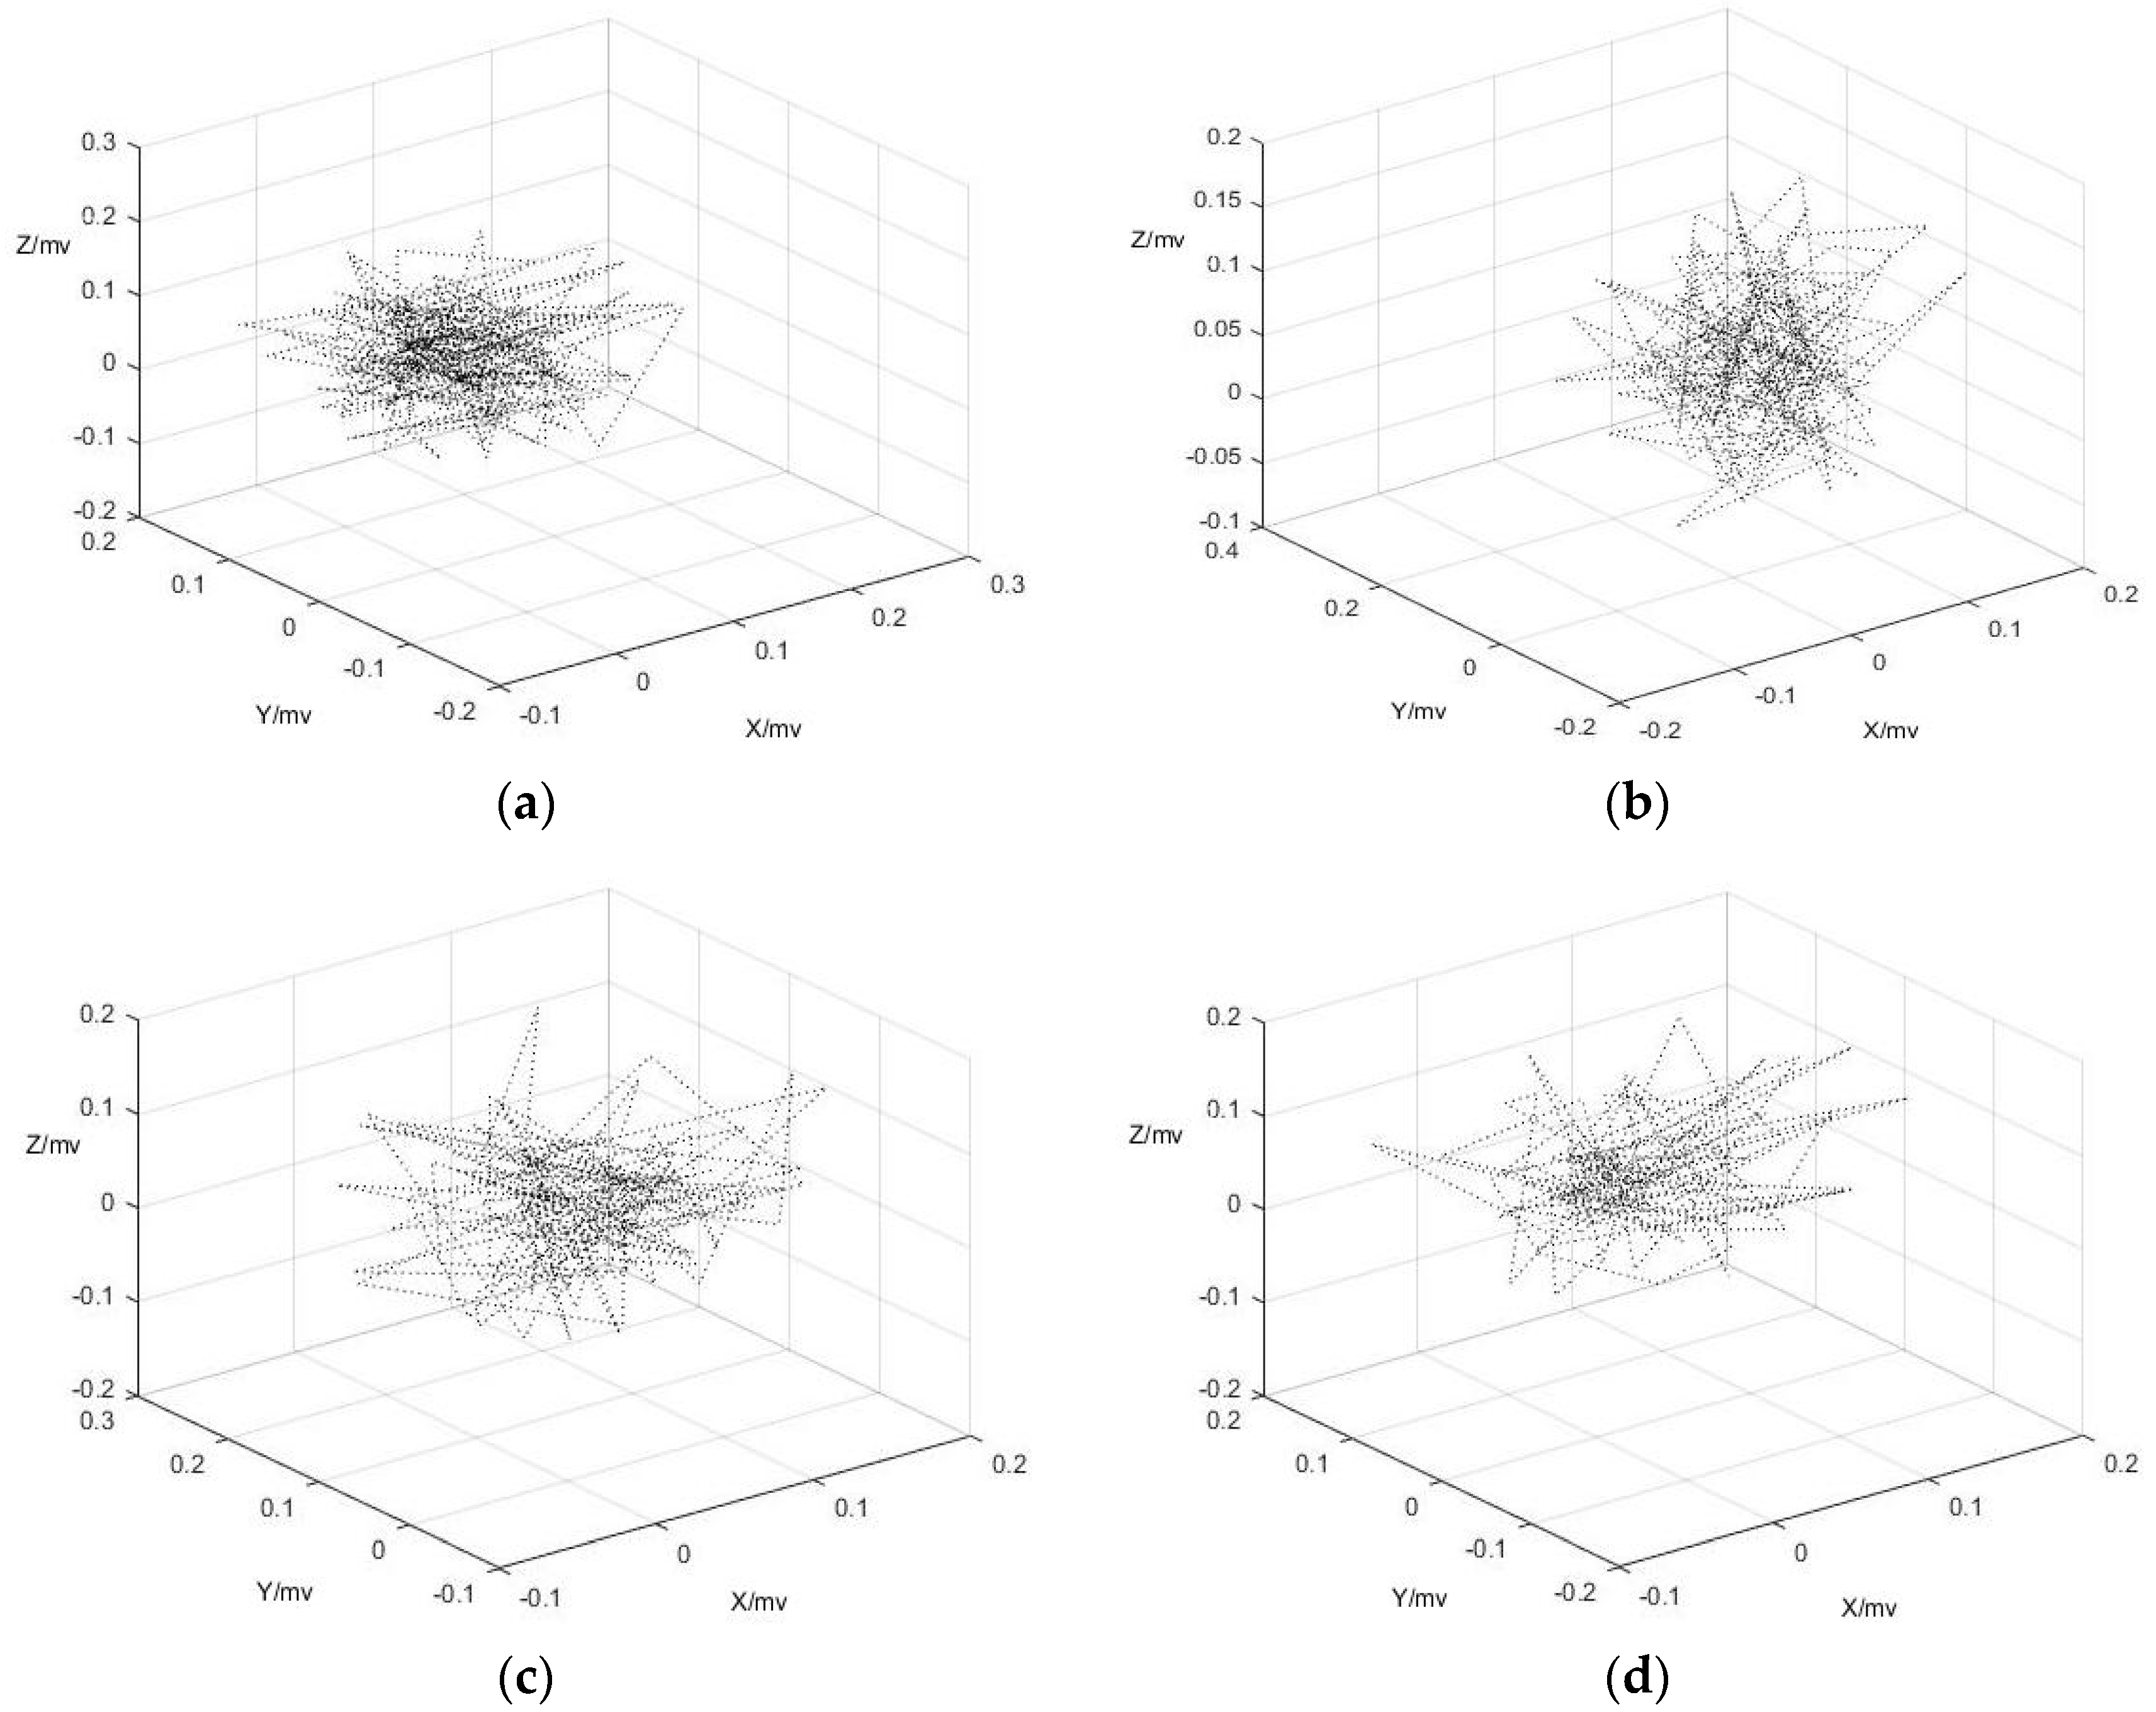
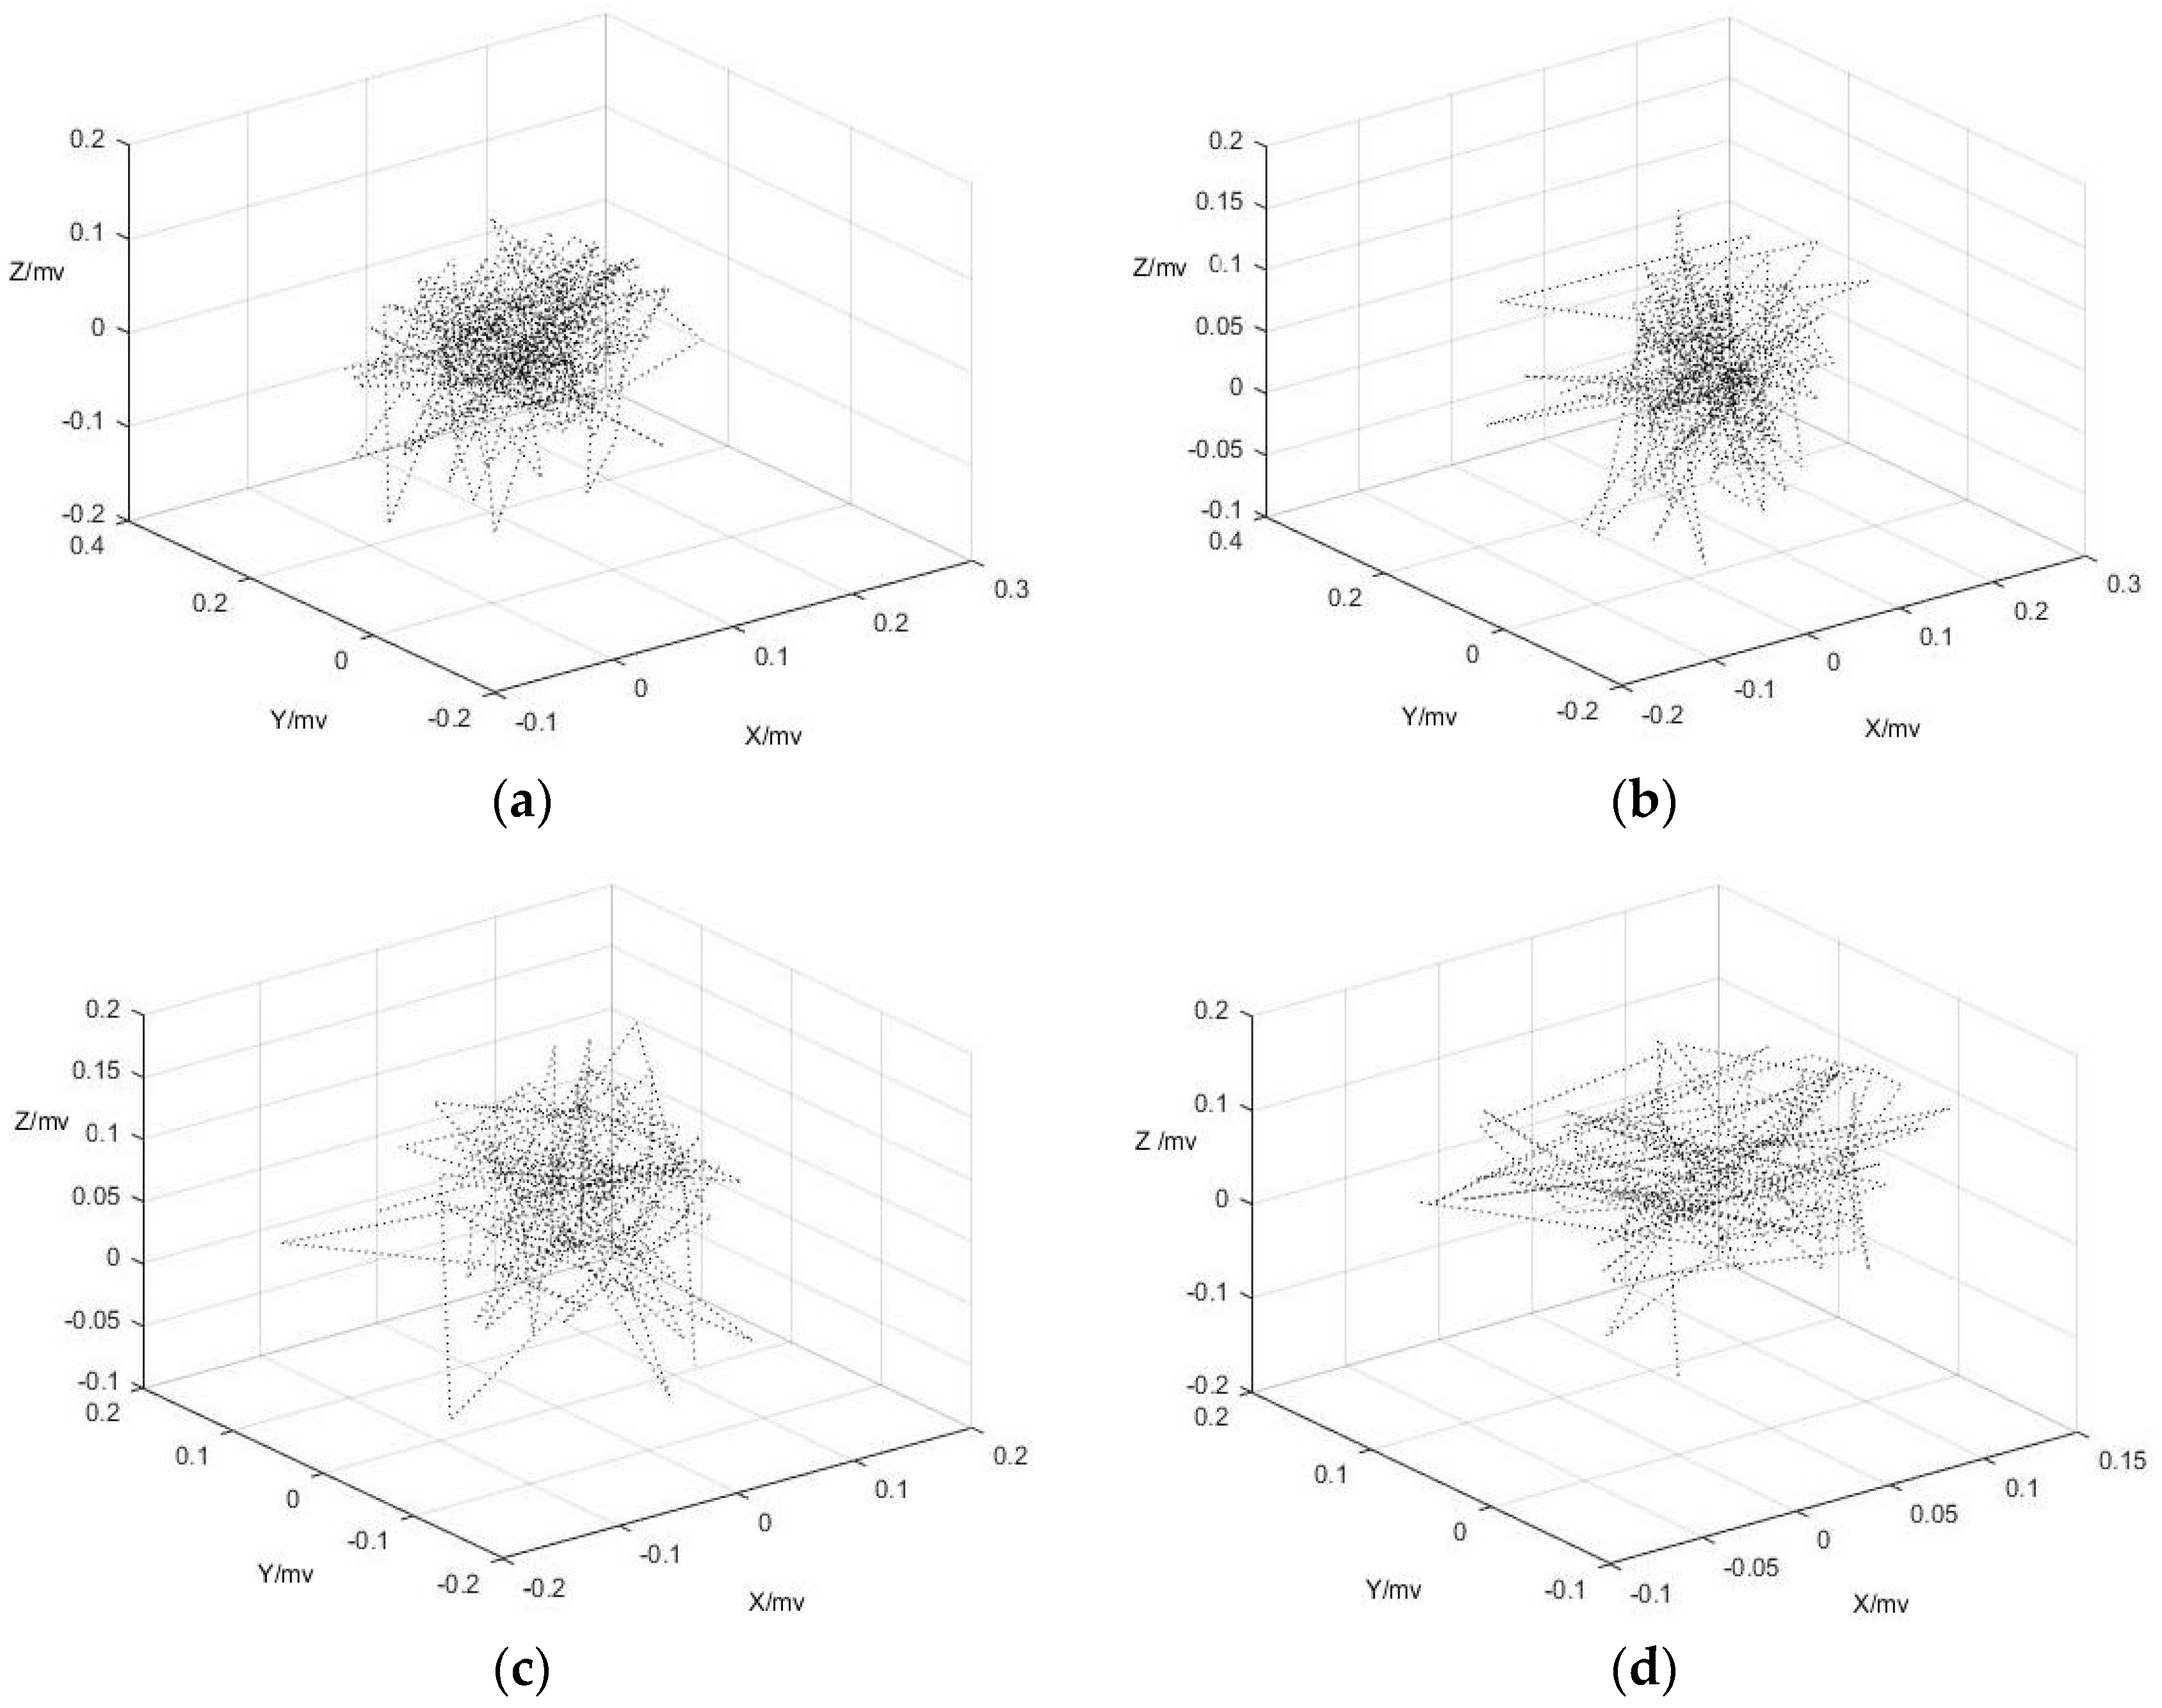
Using the optimal delay time
and embedding dimension
which was determined by previous calculation, the reconstruction attractors with the condition of
for X, Y and Z-axis of the built-in accelerometer shown in
Figure 10,
Figure 11 and
Figure 12 are attractors.
It was clearly found from these figures that the convergence of attractors when
= 3, 4 and
= 4 are better than others, which is consistent with the calculation results in
Section 3. However, the edges of these attractors were not smoothing due to the effect of white noise in original output signals which were generated by metal plate capacitance vibration inside the acceleration when it received voice signal.
