Abstract
Background/Objectives: Reflecting the interaction between dissolution and absorption, the biphasic dissolution system is an appealing approach for estimating the intestinal absorption of drugs in humans. The study aims to characterize the suitability of the biphasic in vitro dissolution testing to set up an in vitro–in vivo correlation (IVIVC) for the original and generic immediate-release (IR) tablets of a Biopharmaceutics Classification System (BCS) Class II drug, bicalutamide (BIC). Methods: USP apparatus II paddle was used to conduct dissolution testing. A level A IVIVC was obtained between in vitro partitioning and in vivo absorption data of the original drug. The single-compartmental modeling was used for pharmacokinetic (PK) analysis. The generic product’s plasma concentrations were estimated. Results: There was a good correlation between in vitro and in vivo data (r2 = 0.98). The area under the concentration–time curve (AUC) and maximum plasma concentration (Cmax) ratios for generic/original were 1.04 ± 0.01 and 0.951 ± 0.026 (mean ± SD), respectively. Conclusions: The biphasic dissolution testing may present an in vivo predictive tool for developing generic products of poorly soluble and highly permeable drugs such as BIC, which are characterized by pH-independent poor solubility.
1. Introduction
In vitro dissolution studies are vital for drug formulation development and the quality control of drug products. In addition, they are significant for establishing in vitro–in vivo correlations (IVIVC) to anticipate in vivo performance of the products [1,2]. Dissolution tests are frequently performed using the compendial dissolution equipment and methods. However, the compendial equipment and methods have low discriminatory power and use conditions that limit their ability to mimic specific features of in vivo solubility and dissolution of drugs [3]. The in vivo dissolution and absorption of oral drugs are significantly influenced by the human gastrointestinal (GI) tract’s physiological parameters, such as pH, volume of fluid, bile salt, and GI transit time [4]. Thus, it is essential to establish biorelevant dissolution methods to identify the in vivo solubility–absorption interplay and forecast the drug products’ in vivo performance in humans [5].
Reflecting the interaction between dissolution and absorption, the use of biphasic dissolution systems is an appealing approach for precisely estimating the in vivo behavior of drugs in humans. The system contains the aqueous (buffer) and organic phases (octanol) representing the drug’s dissolution and absorption processes, respectively [6]. Following the dissolution in the buffer, the drug partitions into the organic solvent medium based on its lipophilicity, yielding a more realistic drug supersaturation in the buffer medium and maintaining sink conditions in the organic solvent. Therefore, it enables the combined evaluation of drug dissolution and partition kinetics [7]. A wide range of non-polar solvents has been used in the biphasic dissolution studies [8,9,10,11]. Among these solvents, octanol is considered to be the best [12], since it is poorly soluble in water (0.5 g/L), has a low density (0.83 g/cm3 at 20 °C), enables easier sampling, and does not evaporate at 37 °C, keeping the upper phase volume fixed [13].
Pioneering studies on biphasic dissolution started in 1967 and were conducted to study the partitioning of benzoic acid and salicylic acid tablets [8,14]. Stead et al. were the first to investigate the correlation between the biphasic in vitro and in vivo outcomes of ibuprofen formulations, demonstrating a promising IVIVC [15]. In the past five decades, various biphasic dissolution systems such as a modified rotating basket, a basket–paddle hybrid system, a flow-through cell coupled with a basket, and a miniaturized system have been developed to study the dissolution and absorption kinetics of model drugs which have poor water solubilities [11,13,15,16,17]. In the meantime, studies have demonstrated the promising potential of biphasic dissolution tests in discriminating various formulations and conducting IVIVCs [16,17,18].
The present study aims to develop an IVIVC for bicalutamide (BIC) immediate-release (IR) dosage forms with the biphasic in vitro dissolution test. BIC, a non-steroidal antiandrogen, is used to treat prostate cancer. It prevents the stimulatory effects of androgens on prostate cancer cells [19]. The R-enantiomer of BIC is primarily responsible for its pharmacological activity and is predominant in human plasma. The R-enantiomer reaches the maximum plasma concentration (Cmax) of 559–970 ng/mL within 15 to 48 h after administration of a single dose of BIC (50 mg) in healthy males. The mean elimination half-life (t1/2) is 4.2 days. On the contrary, the S-enantiomer reaches Cmax of 32–66 ng/mL within 2 to 5 h post administration and exhibits a mean t1/2 of 19 h [20,21]. BIC’s oral absorption is slow due to the enterohepatic circulation. However, it is extensively absorbed after oral administration based on the total radioactivity excreted in urine (36%) and feces (43%) in humans receiving a single oral dose (50 mg), as extensive metabolism necessitates extensive absorption. Additionally, the absolute bioavailability (BA) data are absent in humans since the intravenous formulation is not available [20,21]. Oral absorption was also found to be about 80% in rat, mouse, rabbit, and dog [22]. Glucuronidation and hydroxylation followed by glucuronidation are the primary metabolic pathways for the S- and R- enantiomers, respectively. Fecal excretion points out the secretion of glucuronide conjugates in bile and subsequent hydrolysis in the GI tract [20,21,23]. Thus, BIC can be classified as a Class II drug (low solubility/extensive metabolism) according to the Biopharmaceutics Drug Disposition Classification System (BDDCS) that categorizes drugs based on their solubility and overall extent of metabolism in humans [24,25].
This study characterizes the suitability of the biphasic in vitro dissolution testing to set up an IVIVC for the original and generic IR tablets of BIC (CAS 90357-06-5). It assesses the significance in forecasting the drug’s BA in humans. BIC is a low solubility/high permeability drug (Biopharmaceutics Classification System (BCS) Class II) [26]. Displaying dissolution rate limited absorption, BCS Class II drugs are good candidates for developing IVIVCs. The plasma drug concentration profile following the oral administration of the generic formulation in healthy male volunteers was digitized from a previously published paper [21]. An excellent relation was established between in vitro biphasic dissolution and in vivo absorption data. A predictive model-dependent strategy based on this correlation was identified to forecast in vivo human results of BIC’s generic formulation.
2. Materials and Methods
2.1. Materials
BIC was kindly given by Onko & Koçsel Pharmaceuticals (Istanbul, Turkiye). Sodium chloride, sodium hydroxide, hydrochloric acid, 1-octanol, monopotassium phosphate, and sodium lauryl sulfate (SLS) were purchased from Sigma-Aldrich (Steinheim, Germany). The original and the generic 50 mg BIC IR tablets were bought from a local drug store. The commercial original (reference) (Casodex®, license holder: AstraZeneca, manufacturer: CordenPharma, Plankstadt, Germany, batch number: D21254A, serial number: 60000019352101) and the generic (test) (batch number: 30739410, serial number: BDDW177E) tablets were utilized. All the chemicals used were of analytical grade.
2.2. Single-Phase Dissolution Test
The compendial test was performed using USP apparatus II (Agilent Technologies 708-DS, Petaling Jaya, Malaysia) for the original and generic products at 37 °C. The dissolution media were 1000 mL water containing 1% SLS and phosphate buffer (50 mM, pH 6.8) for the sink and non-sink conditions, respectively. The paddle’s rotation speed was 50 rpm.
The samples were withdrawn at certain times and filtered by a Chromafil® syringe filter (CA45/25, 0.45 µm, Eschau, Germany), and followed by the addition of an equal volume of freshly prepared medium. The spectrophotometric method was used to determine the concentrations of BIC. The experiments were conducted in a total of six repeats. The total percentage (mean ± standard deviation (SD)) was calculated and represented graphically against time.
2.3. Biphasic Dissolution Test
The biphasic testing was performed as previously detailed [27]. Briefly, the aqueous (pH 6.8 phosphate buffer, 300 mL) and organic phases (octanol, 200 mL) were saturated through stirring (50 rpm) for 45 min at 37 °C. A tube extended into the octanol was employed to discharge the tablets into the aqueous phase. Thus, the tablets were avoided from being in contact with octanol. The amount of octanol (200 mL) provided the sink condition based on the saturation solubility of BIC in octanol (2.13 × 10⁻³ mol/L at 35 °C) [28].
The second paddle was placed in the middle of the octanol phase to ensure enough mixing. The primary paddle was fully immersed in the aqueous medium (300 mL). The samples (5 mL) were simultaneously collected from the phosphate buffer and octanol phases at 15, 30, 45, 60, 90, 120, 180, and 240 min. These samples were subsequently filtered using a Chromafil® syringe filter (CA45/25, 0.45 µm). Each sampling was followed by the addition of an equal volume of fresh medium to maintain sink conditions. The spectrophotometric method was employed to analyze BIC concentration in the samples. The experiments were conducted in triplicate. The cumulative percentage of drug (mean ± SD) in both phases was plotted against time. The system configuration is displayed in Figure 1.
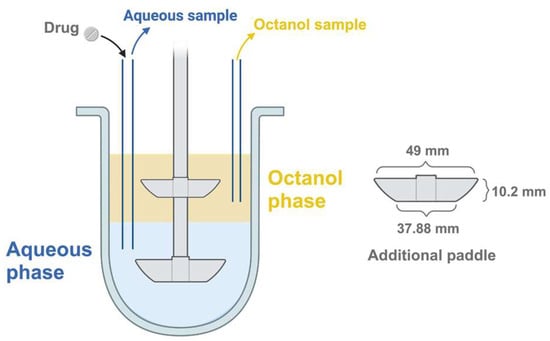
Figure 1.
The vessel of the USP apparatus II with the additional paddle.
2.4. Analytical Method
Analysis was carried out spectrophotometrically with a Cary 60 UV-Vis spectrophotometer (Agilent Technologies, Santa Clara, CA, USA). Absorbance for octanol, pH 6.8 phosphate buffer, and water containing 1% SLS was measured at 272, 273, and 272 nm, respectively. The calibration curves for the corresponding medium were used to determine the concentration of BIC in the samples. High linearity (r2 = 0.999) was achieved within the 3–18 μg/mL calibration range. The range of accuracy was between 98.9% and 102%. The precision was less than 1% (SD). The quantification limit (QL) vs. detection limit (DL) were 2.1 vs. 0.7 µg/mL, 0.08 vs. 0.03 µg/mL, and 0.11 vs. 0.04 µg/mL in octanol, pH 6.8 phosphate buffer, and water containing 1% SLS, respectively.
2.5. Prediction of Human Plasma Profiles with the Biphasic Dissolution Data
The fraction of drug dose absorbed (Fabs) values were calculated using the published single-dose pharmacokinetics (PK) data of the original drug in healthy males [21]. Fabs values were calculated using the Wagner-Nelson method (Equation (1)) [29].
where C(t) is the plasma concentration of the drug (ng/mL), and kd is the elimination rate constant (h−1).
The published plasma profile of the original drug was digitized using the Automeris.io V5 software to determine the in vivo time points (0–672 h) for the plasma profiles. For each healthy male volunteer, the plasma profiles of the original drug were obtained using Equation (2) with the PK parameters derived from the literature data (Table 1) [21].

Table 1.
Pharmacokinetic (PK) parameters derived from the literature following administration of 50 mg single oral dose of the original drug to healthy males [21].
A Level A IVIVC was established between in vitro dissolution (fraction of BIC partitioned into octanol at 15, 30, 45, 60, 90, 120, 180, and 240 min) and in vivo absorption data (Fabs at 1, 2, 3, 5, 7, 9, 12, and 15 h) for the reference. Levy’s plot was drawn to assess the time scaling. Thus the correlation between in vitro (dissolution) and in vivo (absorption) time points was assessed. Linear regression was used to investigate the relationship between variables in Microsoft 365 Excel. The Level A IVIVC was used to estimate the Fabs values of healthy male volunteers for the generic formulation. Subsequently, the absorption rate constant (ka) of each volunteer was determined by the Wagner-Nelson method for the generic [30]. The single-compartmental modeling was used for PK analysis. The determination coefficient (r2) of the one compartment model was 0.990 for the observed mean profile of the original drug (reference). The generic product’s plasma concentrations (Cp) were estimated using Equation (2), with the ka, elimination rate constant (kd), and volume of distribution (Vd) PK parameters specific to each subject. The area under the plasma concentration–time curve from 0 to infinity (AUC0→∞) was determined using the trapezoidal rule method.
where FF* is bioavailability constant, D is dose (ng), Vd is volume of distribution (mL), ka is absorption rate constant (h−1), kd is elimination rate constant (h−1), and t is time (h).
2.6. Data Analysis
All data were expressed as mean ± SD. The similarity of dissolution profiles was assessed by the f2 test [31]. The f2 value was determined using Equation (3):
where n is number of samples, Rt and Tt are cumulative dissolution percentages of the reference and test products at the specific time point, respectively. The calc f2 > 50 points outs the similarity of the reference and test profiles.
3. Results
3.1. Single-Phase Dissolution Test
The dissolution profiles of the original and generic drugs in water with 1% SLS and pH 6.8 phosphate buffer are presented in Figure 2. The drug dissolved rapidly in 1000 mL of water with 1% SLS, recommended by the USP dissolution methods database for BIC tablets to facilitate sink conditions [32]. The percentage dissolved was 78% and 90% after 15 min in water with 1% SLS medium for the original and generic drugs, respectively (Figure 2A).
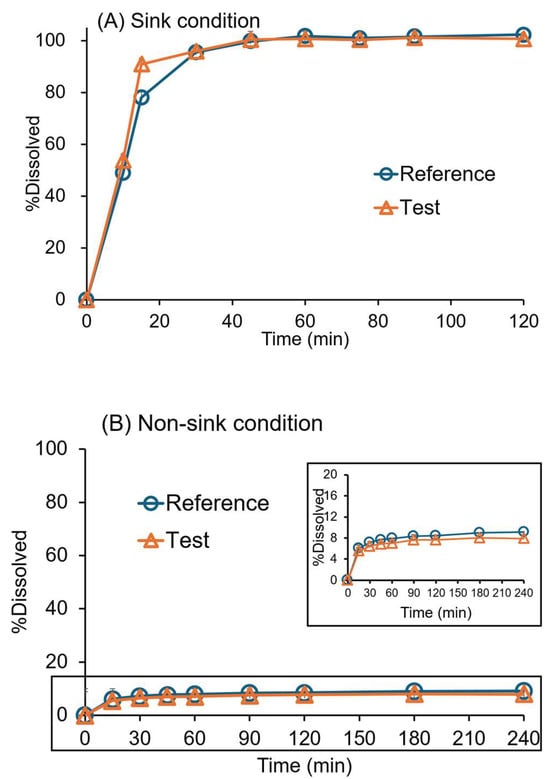
Figure 2.
Dissolution profiles of 50 mg bicalutamide (BIC) original (reference) and generic (test) tablets in a single-phase dissolution test using the USP paddle (rotation speed = 50 rpm; 37 ± 0.5 °C; mean ± SD; n = 6). (A) Sink condition (water with 1% SLS, 1000 mL) and (B) non-sink condition (pH 6.8 phosphate buffer, 1000 mL).
The drug release was low in the non-sink condition at pH 6.8, as expected (~7–8% in 1 h) (Figure 2B). Since the solubility of BIC (pKa = 11.49) is 12.95 × 10⁻⁶ mol/L (5.6 µg/mL) in water at 35 °C and is independent of pH [28]. The generic and the original drugs’ dissolution profiles were similar in water with 1% SLS (f2 = 58) and pH 6.8 medium (f2 = 94).
3.2. Biphasic Dissolution Test
The biphasic dissolution profiles of original and generic drugs in aqueous and organic phases are presented in Figure 3. The products exhibited similar profiles in the organic (f2 = 73.4) and aqueous (f2 = 98) phases. The dissolved BIC rapidly partitioned into the octanol phase between 15 min and one h. The partitioning is relatively slow after one h, exhibiting a time-dependent increase up to four h for the original and generic drugs.
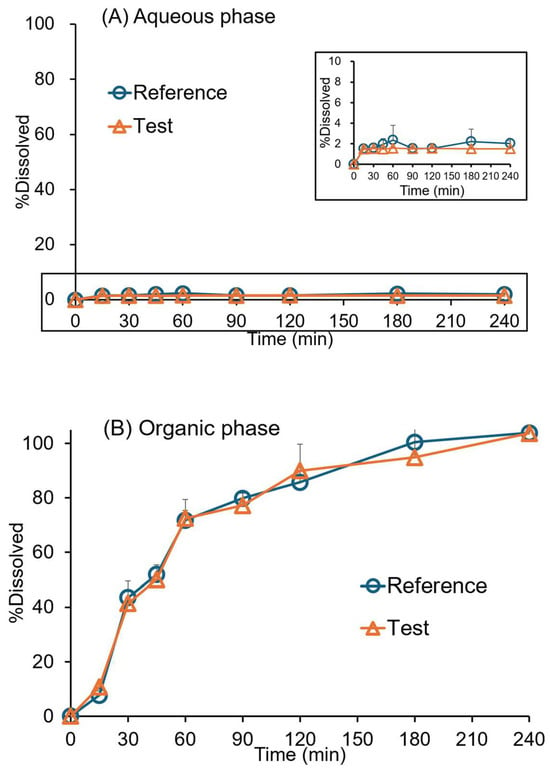
Figure 3.
Dissolution profiles of 50 mg of BIC original (reference) and generic (test) tablets in the biphasic dissolution test: (A) pH 6.8 phosphate buffer, (B) octanol phases. Data were collected using the paddle-modified USP paddle (rotation speed = 50 rpm; 37 ± 0.5 °C; mean ± SD; n = 3).
3.3. Correlation Between Absorption and Partition Profiles
A Levy’s plot was constructed to assess the relationship between dissolution and absorption (Figure 4). A good correlation was observed between in vitro and in vivo time points. The point-to-point correlation between BIC’s Fabs and the extent of BIC partitioning into organic phase for the original drug is presented in Figure 5. A good correlation was evident between the extent of BIC partitioning into octanol and the Fabs values calculated based on each subject and mean plasma data for the original drug (r2 = 0.979 vs. 0.978). The generic’s predicted mean ka value was 0.152 ± 0.119 h−1, of which 1.6 times is the original drug’s observed mean ka value (0.245 ± 0.233 h−1).
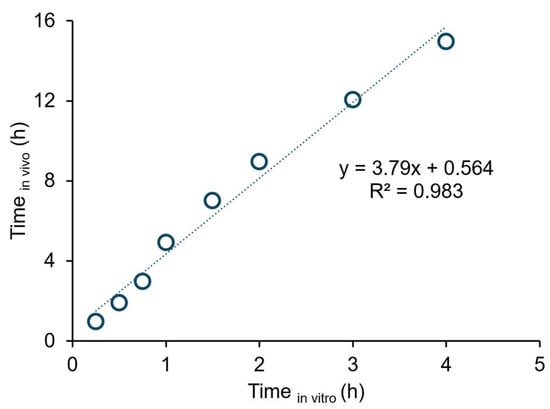
Figure 4.
Levy’s plot for the original drug. Timein vitro represents the sampling time points of the organic phase (15, 30, 45, 60, 90, 120, 180, and 240 min) in the biphasic dissolution test. Timein vivo represents the first eight in vivo time points for the plasma profiles (1, 2, 3, 5, 7, 9, 12, and 15 h).
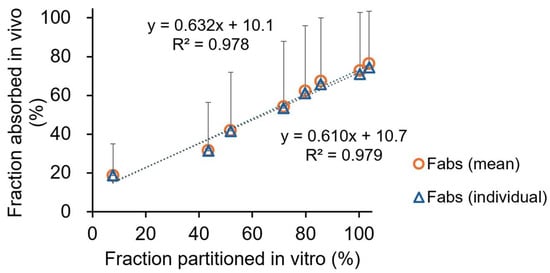
Figure 5.
The point-to-point correlation between BIC’s fraction of the dose absorbed (Fabs) and the extent of BIC partitioning into octanol for the original drug. (The triangles and circles show the individual and mean plasma data in healthy subjects, respectively. In vivo data were derived from the literature following administration of 50 mg single oral dose of the original drug to five healthy males [21].
3.4. In Vivo Prediction with the Biphasic Dissolution Data
The predicted mean and single plasma profiles of the generic product and the original drug are presented in Figure 6 and Figure 7, respectively.
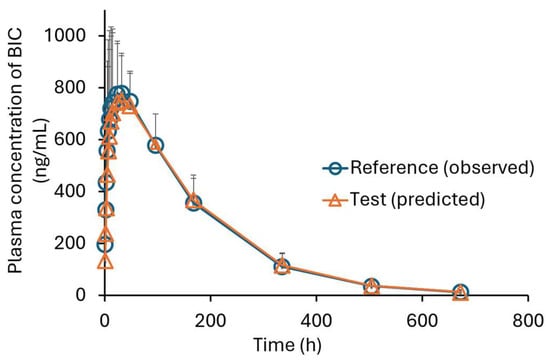
Figure 6.
The mean plasma concentration–time profiles of BIC in five healthy males. (The circles are the observed profile for the original drug (reference) [21], and the triangles are the predicted profile for the generic drug (test), mean ± SD; n = 5).
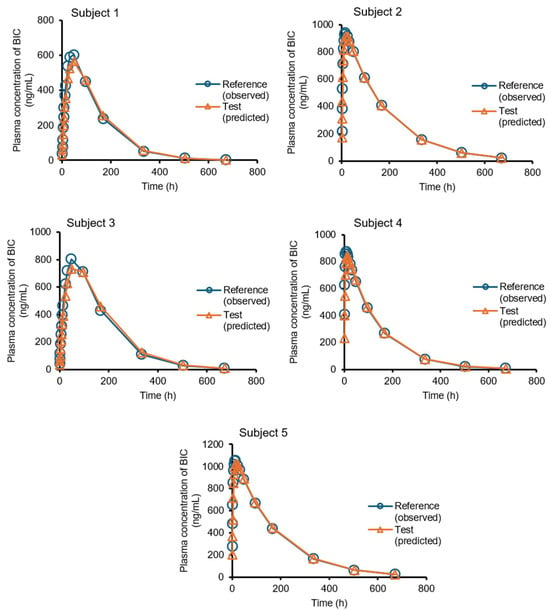
Figure 7.
The plasma concentration–time profiles of BIC in five healthy male volunteers. (The circles are the observed plasma profile for the original drug (reference) [21], and the triangles are the predicted plasma profile for the generic drug (test)).
The AUC and Cmax values are presented in Table 2. The AUC and Cmax ratios for generic/original were 1.04 ± 0.01 (mean ± SD) and 0.951 ± 0.026 (mean ± SD), respectively.

Table 2.
Bioavailability (BA) criteria for the generic (test) and original (reference) products in five healthy subjects.
4. Discussion
The present study characterized an IVIVC for BIC IR dosage forms with the biphasic in vitro dissolution test to forecast the drug’s BA in humans. The plasma profiles of the generic predicted using the in vitro dissolution data were compared with the original product’s profiles. Being a BCS Class II drug, BIC (MW: 430.373 g/mol) was selected because of its high permeability and low solubility [26,28]. In addition, the literature on human PK data of the original product enabled the conducting of an IVIVC [21].
BIC is a lipophilic compound with a log P of 2.92 and a pKa value of 11.49. The low solubility in aqueous media (~5 mg/L) is independent of the physiological pH values [20,28]. Based on the neutral characteristics, BIC can be classified as a BCS Class IIc drug [33,34]. Thus, the high unionized fractions of BIC at physiologically relevant pHs (~pH 1–7.4) and the enterohepatic circulation could explain its slow (time to reach Cmax (tmax) = 15–48 h [21]) and extensive absorption after the oral dose. Furthermore, the dose linearity of BIC exists in the dose range of 10–50 mg. However, it deviates from linearity at the doses of 50 to 150 mg because of the saturation of the absorption process due to the poor water solubility of the drug [20].
This study performed single-phase dissolution experiments under both sink (water containing 1% SLS) and non-sink (phosphate buffer, pH 6.8) conditions to evaluate the original and generic products. The products exhibited expected profiles in the single-phase test conditions. However, the single-phase tests and surfactant media used to maintain sink conditions almost reduce the discriminative power of dissolution methods [7]. Considering BCS Class II drugs such as BIC exhibit limited dissolution in the GI tract but easily permeate the intestinal membrane, dissolution testing under non-sink conditions may offer a more physiologically relevant evaluation [35]. Moreover, compounds classified as BCS Class IIc exhibit solubility that remains largely unaffected by pH variations. As a result, predictive models that integrate physiological factors such as pH shifts and transit duration may offer limited additional value when estimating the in vivo performance of these drugs. Instead, incorporating an absorption phase into dissolution setups may provide a more effective strategy for developing methodologies that better simulate in vivo conditions [34]. More predictive in vitro dissolution approaches are necessary to properly evaluate the in vivo dissolution, absorption, and oral BA of BIC.
In this aforementioned context, the biphasic dissolution test could accurately represent in vivo dissolution and absorption processes of BIC formulations. The partitioning of BIC into octanol well reflected the intestinal absorption of BIC. The sink condition was kept in octanol (200 mL) during the experiment. The formulations exhibited similar profiles in the phosphate buffer and octanol phases. The partitioning of BIC into the organic phase was based on the time-dependent manner of the equilibrium of two phases, as previously reported [27]. The rapid partitioning of BIC into octanol was attributed to its fast release from the dosage form. Also, the concentration in the aqueous phase remained stable throughout the experiment, indicating that steady-state conditions were established. The organic phase maintained the sink conditions for continuous drug dissolution. The target release percentage of BIC in octanol was found to be approximately 70% in 1 h, 85% in 2 h, and 100% in 3 h for the bioequivalent IR formulations of BIC. The octanol phase served as a surrogate for the intestinal absorption of BIC. The partitioning of BIC into octanol in 4 h is well correlated with the absorption data in 15 h, describing its slow and extensive absorption after oral administration. For the deconvolution method, it was demonstrated that no significant difference exists between the mean and separate plasma data for establishing the point-to-point correlation between in vitro and in vivo (Figure 5).
The generic product showed a lower ka compared to the original drug (0.152 ± 0.119 h−1 vs. 0.245 ± 0.233 h−1). The discrepancy in ka may be related to the high variation of the absortion in five subjects. It can be attributed to the dissolution rate-limited absorption of BIC. Additionally, in vivo intestinal dissolution may be different than in vitro dissolution due to the GI physiology, active pharmaceutical ingredient, and formulation-related factors such as excipients and particle size for poorly soluble drugs. In fact, a minimum number of 12 evaluable subjects should be included in any bioequivalence (BE) study [36]. The predictive power of the present correlation requires in vivo data available for more subjects to assess BE of the two products.
Recent studies demonstrate a level A IVIVC among in vitro biphasic dissolution data and in vivo outcomes for the IR formulations of BCS Class II drugs in humans [27,37,38,39,40]. Al Durdunji et al. constructed a Level A IVIVC that complies with the FDA acceptance criteria using the biphasic dissolution test with the USP flow-through and apparatus II for deferasirox dispersible tablets. This discriminative system successfully simulated in vivo dissolution and absorption processes for the deferasirox formulations [37]. This pioneering Level A IVIVC study was subsequently followed by the others for BCS Class II drugs such as ritonavir, fenofibrate, aprepitant, celecoxib, itraconazole, nimodipine, and lamotrigine, assessing the in vivo predictive ability of the tests [27,38,39,40].
Overall, the present study demonstrated that the relationship between in vivo absorption and in vitro biphasic dissolution enabled forecasting the plasma profiles of BIC’s generic formulation based on the compartmental model for the first time. It was concluded that biphasic dissolution testing may present an in vivo predictive capability for the BCS Class II drugs such as BIC, characterized by pH-independent poor solubility and prolonged absorption phase. Accordingly, the biphasic in vitro dissolution system may serve as a time- and cost-saving tool in developing generic products.
Author Contributions
Conceptualization, T.I.; methodology, T.I.; software, T.I. and N.T.O.; validation, N.T.O.; formal analysis, T.I. and N.T.O.; investigation, T.I. and N.T.O.; resources, T.I. and N.T.O.; data curation, T.I. and N.T.O.; writing—original draft preparation, N.T.O.; writing—review and editing, T.I. and N.T.O.; visualization, T.I. and N.T.O.; supervision, T.I.; project administration, T.I. All authors have read and agreed to the published version of the manuscript.
Funding
This study was supported by a grant from Gazi University Scientific Research Projects Coordination Unit (BAP) Project Code: TDK-2023-8489.
Institutional Review Board Statement
Not applicable.
Informed Consent Statement
Not applicable.
Data Availability Statement
The data presented in this study are available in this article.
Acknowledgments
The authors would like to thank Onko & Koçsel Pharmaceuticals (Turkiye) for kindly providing the bicalutamide drug substance.
Conflicts of Interest
The authors declare no conflicts of interest.
References
- Krollik, K.; Lehmann, A.; Wagner, C.; Kaidas, J.; Kubas, H.; Weitschies, W. The Effect of Buffer Species on Biorelevant Dissolution and Precipitation Assays-Comparison of Phosphate and Bicarbonate Buffer. Eur. J. Pharm. Biopharm. 2022, 171, 90–101. [Google Scholar] [CrossRef]
- Grady, H.; Elder, D.; Webster, G.K.; Mao, Y.; Lin, Y.; Flanagan, T.; Mann, J.; Blanchard, A.; Cohen, M.J.; Lin, J.; et al. Industry’s View on Using Quality Control, Biorelevant, and Clinically Relevant Dissolution Tests for Pharmaceutical Development, Registration, and Commercialization. J. Pharm. Sci. 2018, 107, 34–41. [Google Scholar] [CrossRef]
- Amaral Silva, D.; Al-Gousous, J.; Davies, N.M.; Bou Chacra, N.; Webster, G.K.; Lipka, E.; Amidon, G.L.; Löbenberg, R. Biphasic Dissolution as an Exploratory Method during Early Drug Product Development. Pharmaceutics 2020, 12, 420. [Google Scholar] [CrossRef] [PubMed]
- Jereb, R.; Opara, J.; Bajc, A.; Petek, B. Evaluating the Impact of Physiological Properties of the Gastrointestinal Tract on Drug In Vivo Performance Using Physiologically Based Biopharmaceutics Modeling and Virtual Clinical Trials. J. Pharm. Sci. 2021, 110, 3069–3081. [Google Scholar] [CrossRef]
- Hens, B.; Sinko, P.D.; Job, N.; Dean, M.; Al-Gousous, J.; Salehi, N.; Ziff, R.M.; Tsume, Y.; Bermejo, M.; Paixão, P.; et al. Formulation Predictive Dissolution (fPD) Testing to Advance Oral Drug Product Development: An Introduction to the US FDA Funded ‘21st Century BA/BE’ Project. Int. J. Pharm. 2018, 548, 120–127. [Google Scholar] [CrossRef]
- Pathak, S.M.; Schaefer, K.J.; Jamei, M.; Turner, D.B. Biopharmaceutic IVIVE-Mechanistic Modeling of Single- and Two-Phase In Vitro Experiments to Obtain Drug-Specific Parameters for Incorporation into PBPK Models. J. Pharm. Sci. 2019, 108, 1604–1618. [Google Scholar] [CrossRef]
- Phillips, D.J.; Pygall, S.R.; Cooper, V.B.; Mann, J.C. Overcoming Sink Limitations in Dissolution Testing: A Review of Traditional Methods and the Potential Utility of Biphasic Systems. J. Pharm. Pharmacol. 2012, 64, 1549–1559. [Google Scholar] [CrossRef]
- Niebergall, P.J.; Patil, M.Y.; Sugita, E.T. Simultaneous Determination of Dissolution and Partitioning Rates In Vitro. J. Pharm. Sci. 1967, 56, 943–947. [Google Scholar] [CrossRef] [PubMed]
- Hoa, N.T.; Kinget, R. Design and Evaluation of Two-Phase Partition-Dissolution Method and Its Use in Evaluating Artemisinin Tablets. J. Pharm. Sci. 1996, 85, 1060–1063. [Google Scholar] [CrossRef] [PubMed]
- Gabriels, M.; Plaizier-Vercammen, J. Design of a Dissolution System for the Evaluation of the Release Rate Characteristics of Artemether and Dihydroartemisinin from Tablets. Int. J. Pharm. 2004, 274, 245–260. [Google Scholar] [CrossRef]
- Vangani, S.; Li, X.; Zhou, P.; Del-Barrio, M.-A.; Chiu, R.; Cauchon, N.; Gao, P.; Medina, C.; Jasti, B. Dissolution of Poorly Water-Soluble Drugs in Biphasic Media Using USP 4 and Fiber Optic System. Clin. Res. Regul. Aff. 2009, 26, 8–19. [Google Scholar] [CrossRef]
- Panchagnula, R.; Thomas, N.S. Biopharmaceutics and Pharmacokinetics in Drug Research. Int. J. Pharm. 2000, 201, 131–150. [Google Scholar] [CrossRef] [PubMed]
- Grundy, J.S.; Anderson, K.E.; Rogers, J.A.; Foster, R.T. Studies on Dissolution Testing of the Nifedipine Gastrointestinal Therapeutic System. I. Description of a Two-Phase In Vitro Dissolution Test. J. Control. Release 1997, 48, 1–8. [Google Scholar] [CrossRef]
- Gibaldi, M.; Feldman, S. Establishment of Sink Conditions in Dissolution Rate Determinations. Theoretical Considerations and Application to Nondisintegrating Dosage Forms. J. Pharm. Sci. 1967, 56, 1238–1242. [Google Scholar] [CrossRef]
- Stead, J.A.; Freeman, M.; John, E.G.; Ward, G.T.; Whiting, B. Ibuprofen Tablets: Dissolution and Bioavailability Studies. Int. J. Pharm. 1983, 14, 59–72. [Google Scholar] [CrossRef]
- Frank, K.J.; Locher, K.; Zecevic, D.E.; Fleth, J.; Wagner, K.G. In Vivo Predictive Mini-Scale Dissolution for Weak Bases: Advantages of pH-Shift in Combination with an Absorptive Compartment. Eur. J. Pharm. Sci. 2014, 61, 32–39. [Google Scholar] [CrossRef]
- Locher, K.; Borghardt, J.M.; Frank, K.J.; Kloft, C.; Wagner, K.G. Evolution of a Mini-Scale Biphasic Dissolution Model: Impact of Model Parameters on Partitioning of Dissolved API and Modelling of In Vivo-Relevant Kinetics. Eur. J. Pharm. Biopharm. 2016, 105, 166–175. [Google Scholar] [CrossRef]
- O’Dwyer, P.J.; Box, K.J.; Imanidis, G.; Vertzoni, M.; Reppas, C. On the Usefulness of Four In Vitro Methods in Assessing the Intraluminal Performance of Poorly Soluble, Ionisable Compounds in the Fasted State. Eur. J. Pharm. Sci. 2022, 168, 106034. [Google Scholar] [CrossRef]
- Blackledge, G.R.P. Clinical Progress with a New Antiandrogen, Casodex™ (Bicalutamide). Eur. Urol. 1996, 29 (Suppl. S2), 96–104. [Google Scholar] [CrossRef] [PubMed]
- Cockshott, I.D. Bicalutamide: Clinical Pharmacokinetics and Metabolism. Clin. Pharmacokinet. 2004, 43, 855–878. [Google Scholar] [CrossRef] [PubMed]
- McKillop, D.; Boyle, G.W.; Cockshott, I.D.; Jones, D.C.; Phillips, P.J.; Yates, R.A. Metabolism and Enantioselective Pharmacokinetics of Casodex in Man. Xenobiotica 1993, 23, 1241–1253. [Google Scholar] [CrossRef] [PubMed]
- Boyle, G.W.; McKillop, D.; Phillips, P.J.; Harding, J.R.; Pickford, R.; McCormick, A.D. Metabolism of Casodex in Laboratory Animals. Xenobiotica 1993, 23, 781–798. [Google Scholar] [CrossRef]
- Wellington, K.; Keam, S.J. Bicalutamide 150 mg: A Review of Its Use in the Treatment of Locally Advanced Prostate Cancer. Drugs 2006, 66, 837–850. [Google Scholar] [CrossRef]
- Golfar, Y.; Shayanfar, A. Prediction of Biopharmaceutical Drug Disposition Classification System (BDDCS) by Structural Parameters. J. Pharm Pharm Sci. 2019, 22, 247–269. [Google Scholar] [CrossRef]
- Bamfo, N.O.; Hosey-Cojocari, C.; Benet, L.Z.; Remsberg, C.M. Examination of Urinary Excretion of Unchanged Drug in Humans and Preclinical Animal Models: Increasing the Predictability of Poor Metabolism in Humans. Pharm Res. 2021, 38, 1139–1156. [Google Scholar] [CrossRef]
- Pokharkar, V.B.; Malhi, T.; Mandpe, L. Bicalutamide nanocrystals with improved oral bioavailability: In vitro and in vivo evaluation. Pharm. Dev. Technol. 2013, 18, 660–666. [Google Scholar] [CrossRef]
- Incecayir, T.; Demir, M.E. In Vivo Relevance of a Biphasic In Vitro Dissolution Test for the Immediate Release Tablet Formulations of Lamotrigine. Pharmaceutics 2023, 15, 2474. [Google Scholar] [CrossRef] [PubMed]
- Volkova, T.V.; Simonova, O.R.; Perlovich, G.L. Physicochemical Profile of Antiandrogen Drug Bicalutamide: Solubility, Distribution, Permeability. Pharmaceutics 2022, 14, 674. [Google Scholar] [CrossRef] [PubMed]
- Wagner, J.G. Estimation of Theophylline Absorption Rate by Means of the Wagner-Nelson Equation. J. Allergy Clin. Immunol. 1986, 78, 681–688. [Google Scholar] [CrossRef]
- Wagner, J.G. Fundamentals of Clinical Pharmacokinetics, 2nd ed.; Drug Intelligence Publications: Hamilton, IL, USA, 1979; pp. 174–176. [Google Scholar]
- United States Food and Drug Administration, Department of Health and Human Services, Center for Drug Evaluation and Research (CDER). FDA Guidance. In Dissolution Testing of Immediate Release Solid Oral Dosage Forms, Guidance for Industry; U.S. Government Printing Office: Washington, DC, USA, 1997. [Google Scholar]
- The United States Pharmacopeial Convention. USP Dissolution Methods Database; The United States Pharmacopeial Convention: North Bethesda, MD, USA, 2025; Available online: https://www.usp.org/resources/dissolution-methods-database (accessed on 14 March 2025).
- Tsume, Y.; Mudie, D.M.; Langguth, P.; Amidon, G.E.; Amidon, G.L. The Biopharmaceutics Classification System: Subclasses for In Vivo Predictive Dissolution (IPD) Methodology and IVIVC. Eur. J. Pharm. Sci. 2014, 57, 152–163. [Google Scholar] [CrossRef]
- Tsume, Y.; Igawa, N.; Drelich, A.J.; Ruan, H.; Amidon, G.E.; Amidon, G.L. The In Vivo Predictive Dissolution for Immediate Release Dosage of Donepezil and Danazol, BCS Class IIc Drugs, with the GIS and the USP II with Biphasic Dissolution Apparatus. J. Drug Deliv. Sci. Technol. 2020, 56, 100920. [Google Scholar] [CrossRef]
- Deng, J.; Staufenbiel, S.; Hao, S.; Wang, B.; Dashevskiy, A.; Bodmeier, R. Development of a Discriminative Biphasic In Vitro Dissolution Test and Correlation with In Vivo Pharmacokinetic Studies for Differently Formulated Racecadotril Granules. J. Control. Release 2017, 255, 202–209. [Google Scholar] [CrossRef] [PubMed]
- U.S. Food and Drug Administration (FDA). Center for Drug Evaluation and Research (CDER). Guidance for Industry: Statistical Approaches to Establishing Bioequivalence. 2001. Available online: https://www.fda.gov/media/70958/download (accessed on 24 June 2025).
- Al Durdunji, A.; AlKhatib, H.S.; Al-Ghazawi, M. Development of a Biphasic Dissolution Test for Deferasirox Dispersible Tablets and Its Application in Establishing an In Vitro-In Vivo Correlation. Eur. J. Pharm. Biopharm. 2016, 102, 9–18. [Google Scholar] [CrossRef]
- Xu, H.; Vela, S.; Shi, Y.; Marroum, P.; Gao, P. In Vitro Characterization of Ritonavir Drug Products and Correlation to Human In Vivo Performance. Mol. Pharm. 2017, 14, 3801–3814. [Google Scholar] [CrossRef]
- Xu, H.; Shi, Y.; Vela, S.; Marroum, P.; Gao, P. Developing Quantitative In Vitro-In Vivo Correlation for Fenofibrate Immediate-Release Formulations with the Biphasic Dissolution-Partition Test Method. J. Pharm. Sci. 2018, 107, 476–487. [Google Scholar] [CrossRef]
- Denninger, A.; Westedt, U.; Wagner, K.G. Shared IVIVR for Five Commercial Enabling Formulations Using the BiPHa+ Biphasic Dissolution Assay. Pharmaceutics 2021, 13, 285. [Google Scholar] [CrossRef] [PubMed]
Disclaimer/Publisher’s Note: The statements, opinions and data contained in all publications are solely those of the individual author(s) and contributor(s) and not of MDPI and/or the editor(s). MDPI and/or the editor(s) disclaim responsibility for any injury to people or property resulting from any ideas, methods, instructions or products referred to in the content. |
© 2025 by the authors. Licensee MDPI, Basel, Switzerland. This article is an open access article distributed under the terms and conditions of the Creative Commons Attribution (CC BY) license (https://creativecommons.org/licenses/by/4.0/).