

Understanding the Interaction of Thermal, Rheological, and Mechanical Parameters Critical for the Processability of Polyvinyl Alcohol-Based Systems during Hot Melt Extrusion


Abstract

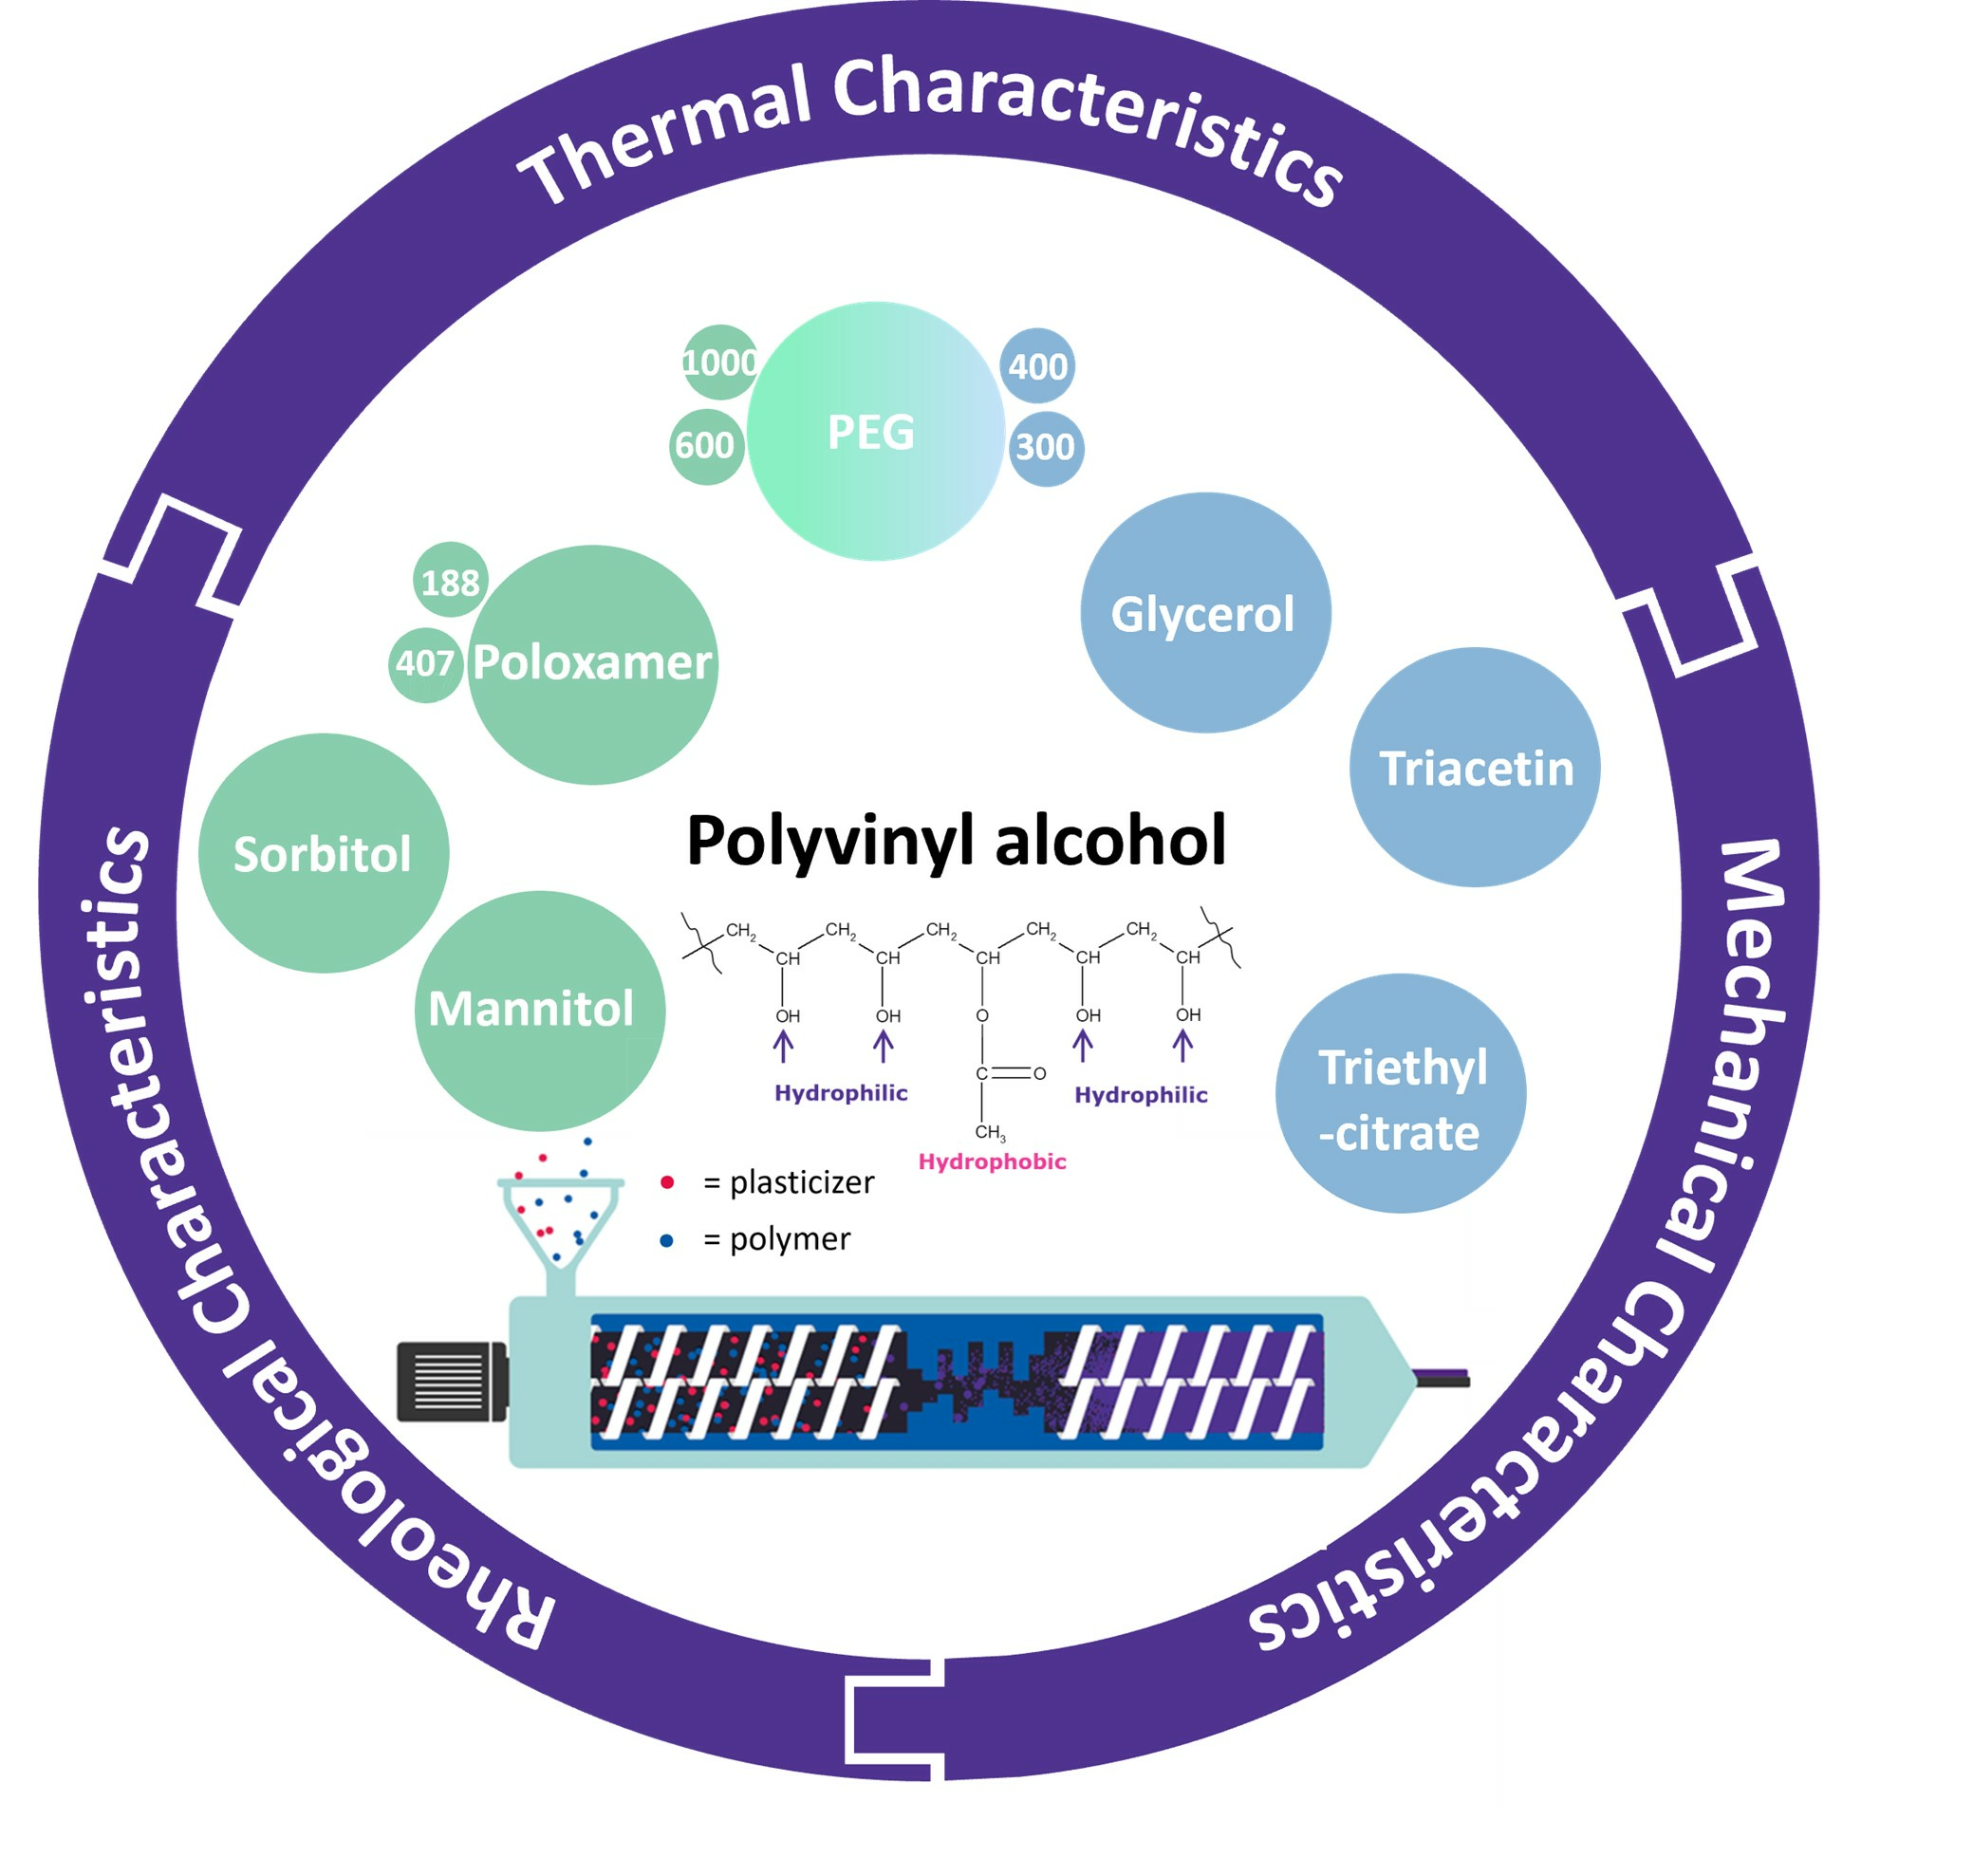
1. Introduction
2. Materials and Methods
2.1. Materials
2.2. Methods
2.2.1. Blend Composition and Sample Preparation
2.2.2. Differential Scanning Calorimetry (DSC)
2.2.3. Melt Rheology
2.2.4. Hot Melt Extrusion of Filament Strands
2.2.5. Mechanical Testing of the Filaments
2.2.6. Principal Component Analysis (PCA)
3. Results
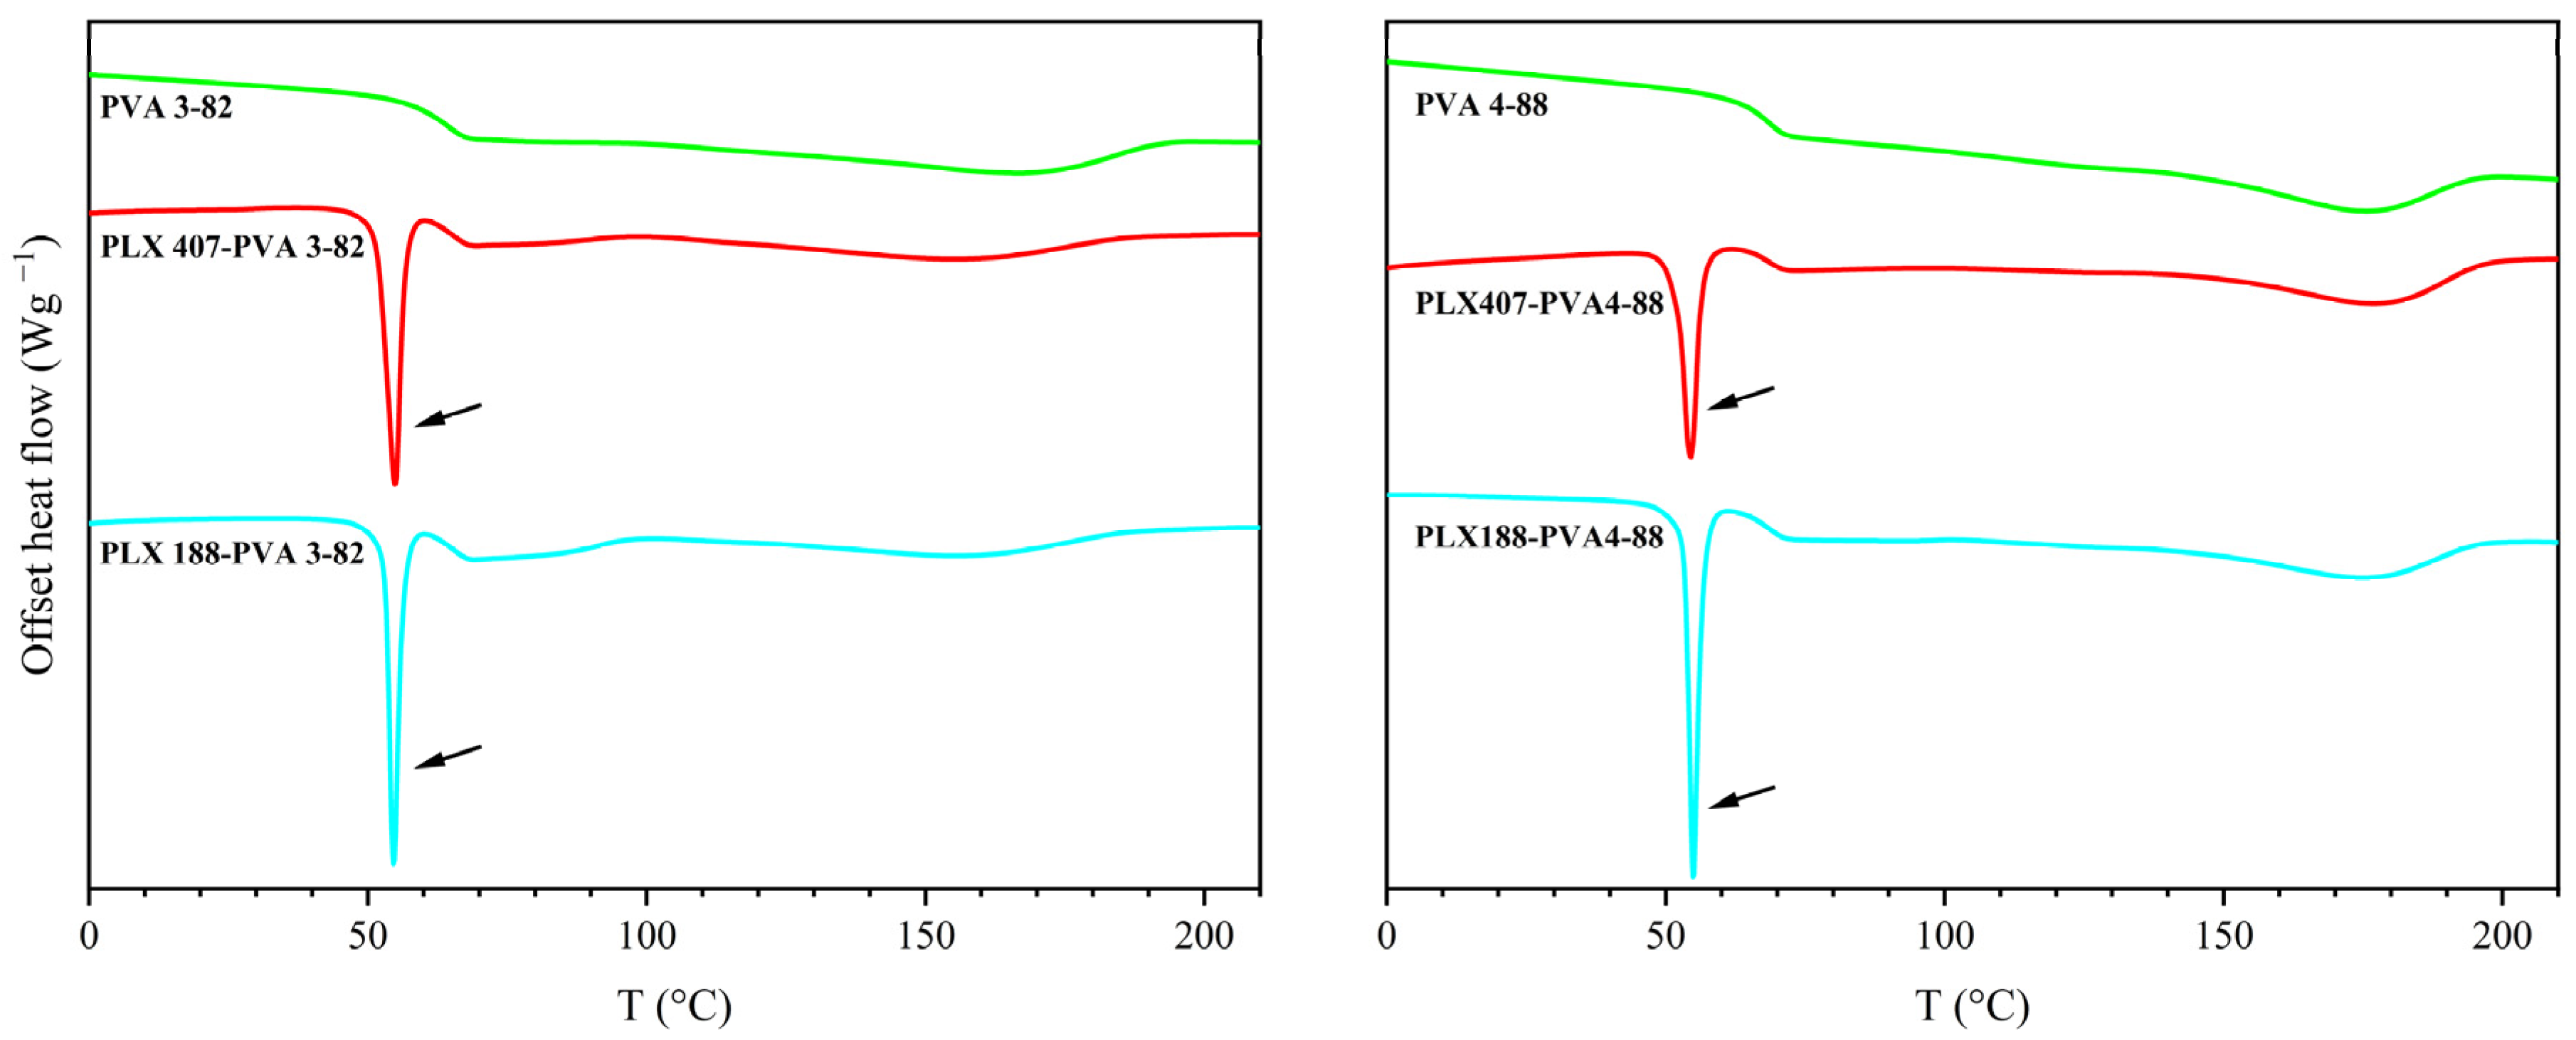
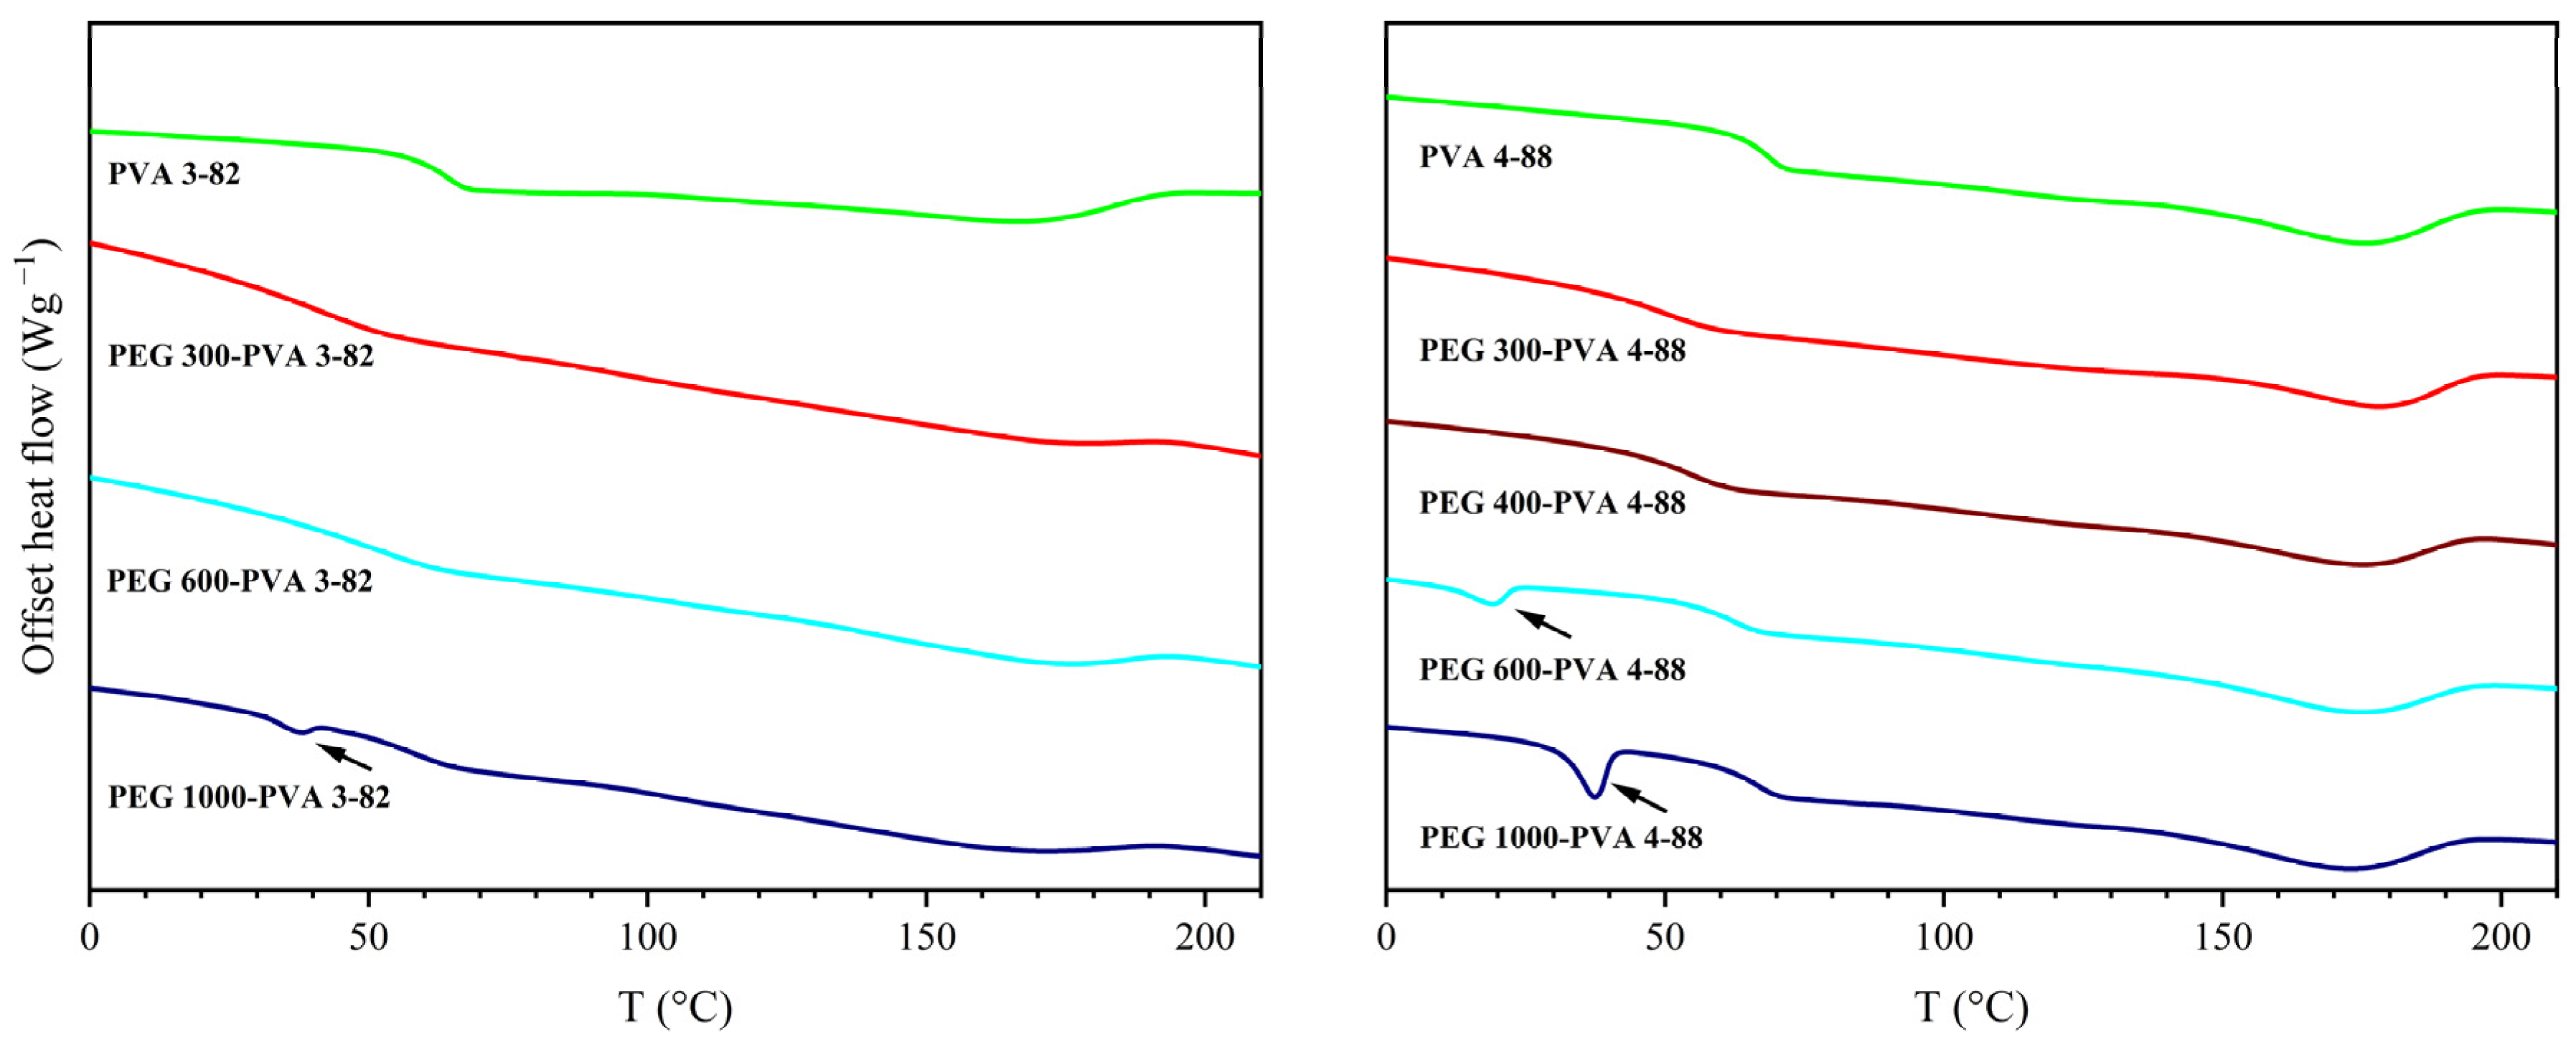
3.1. Thermal Analysis
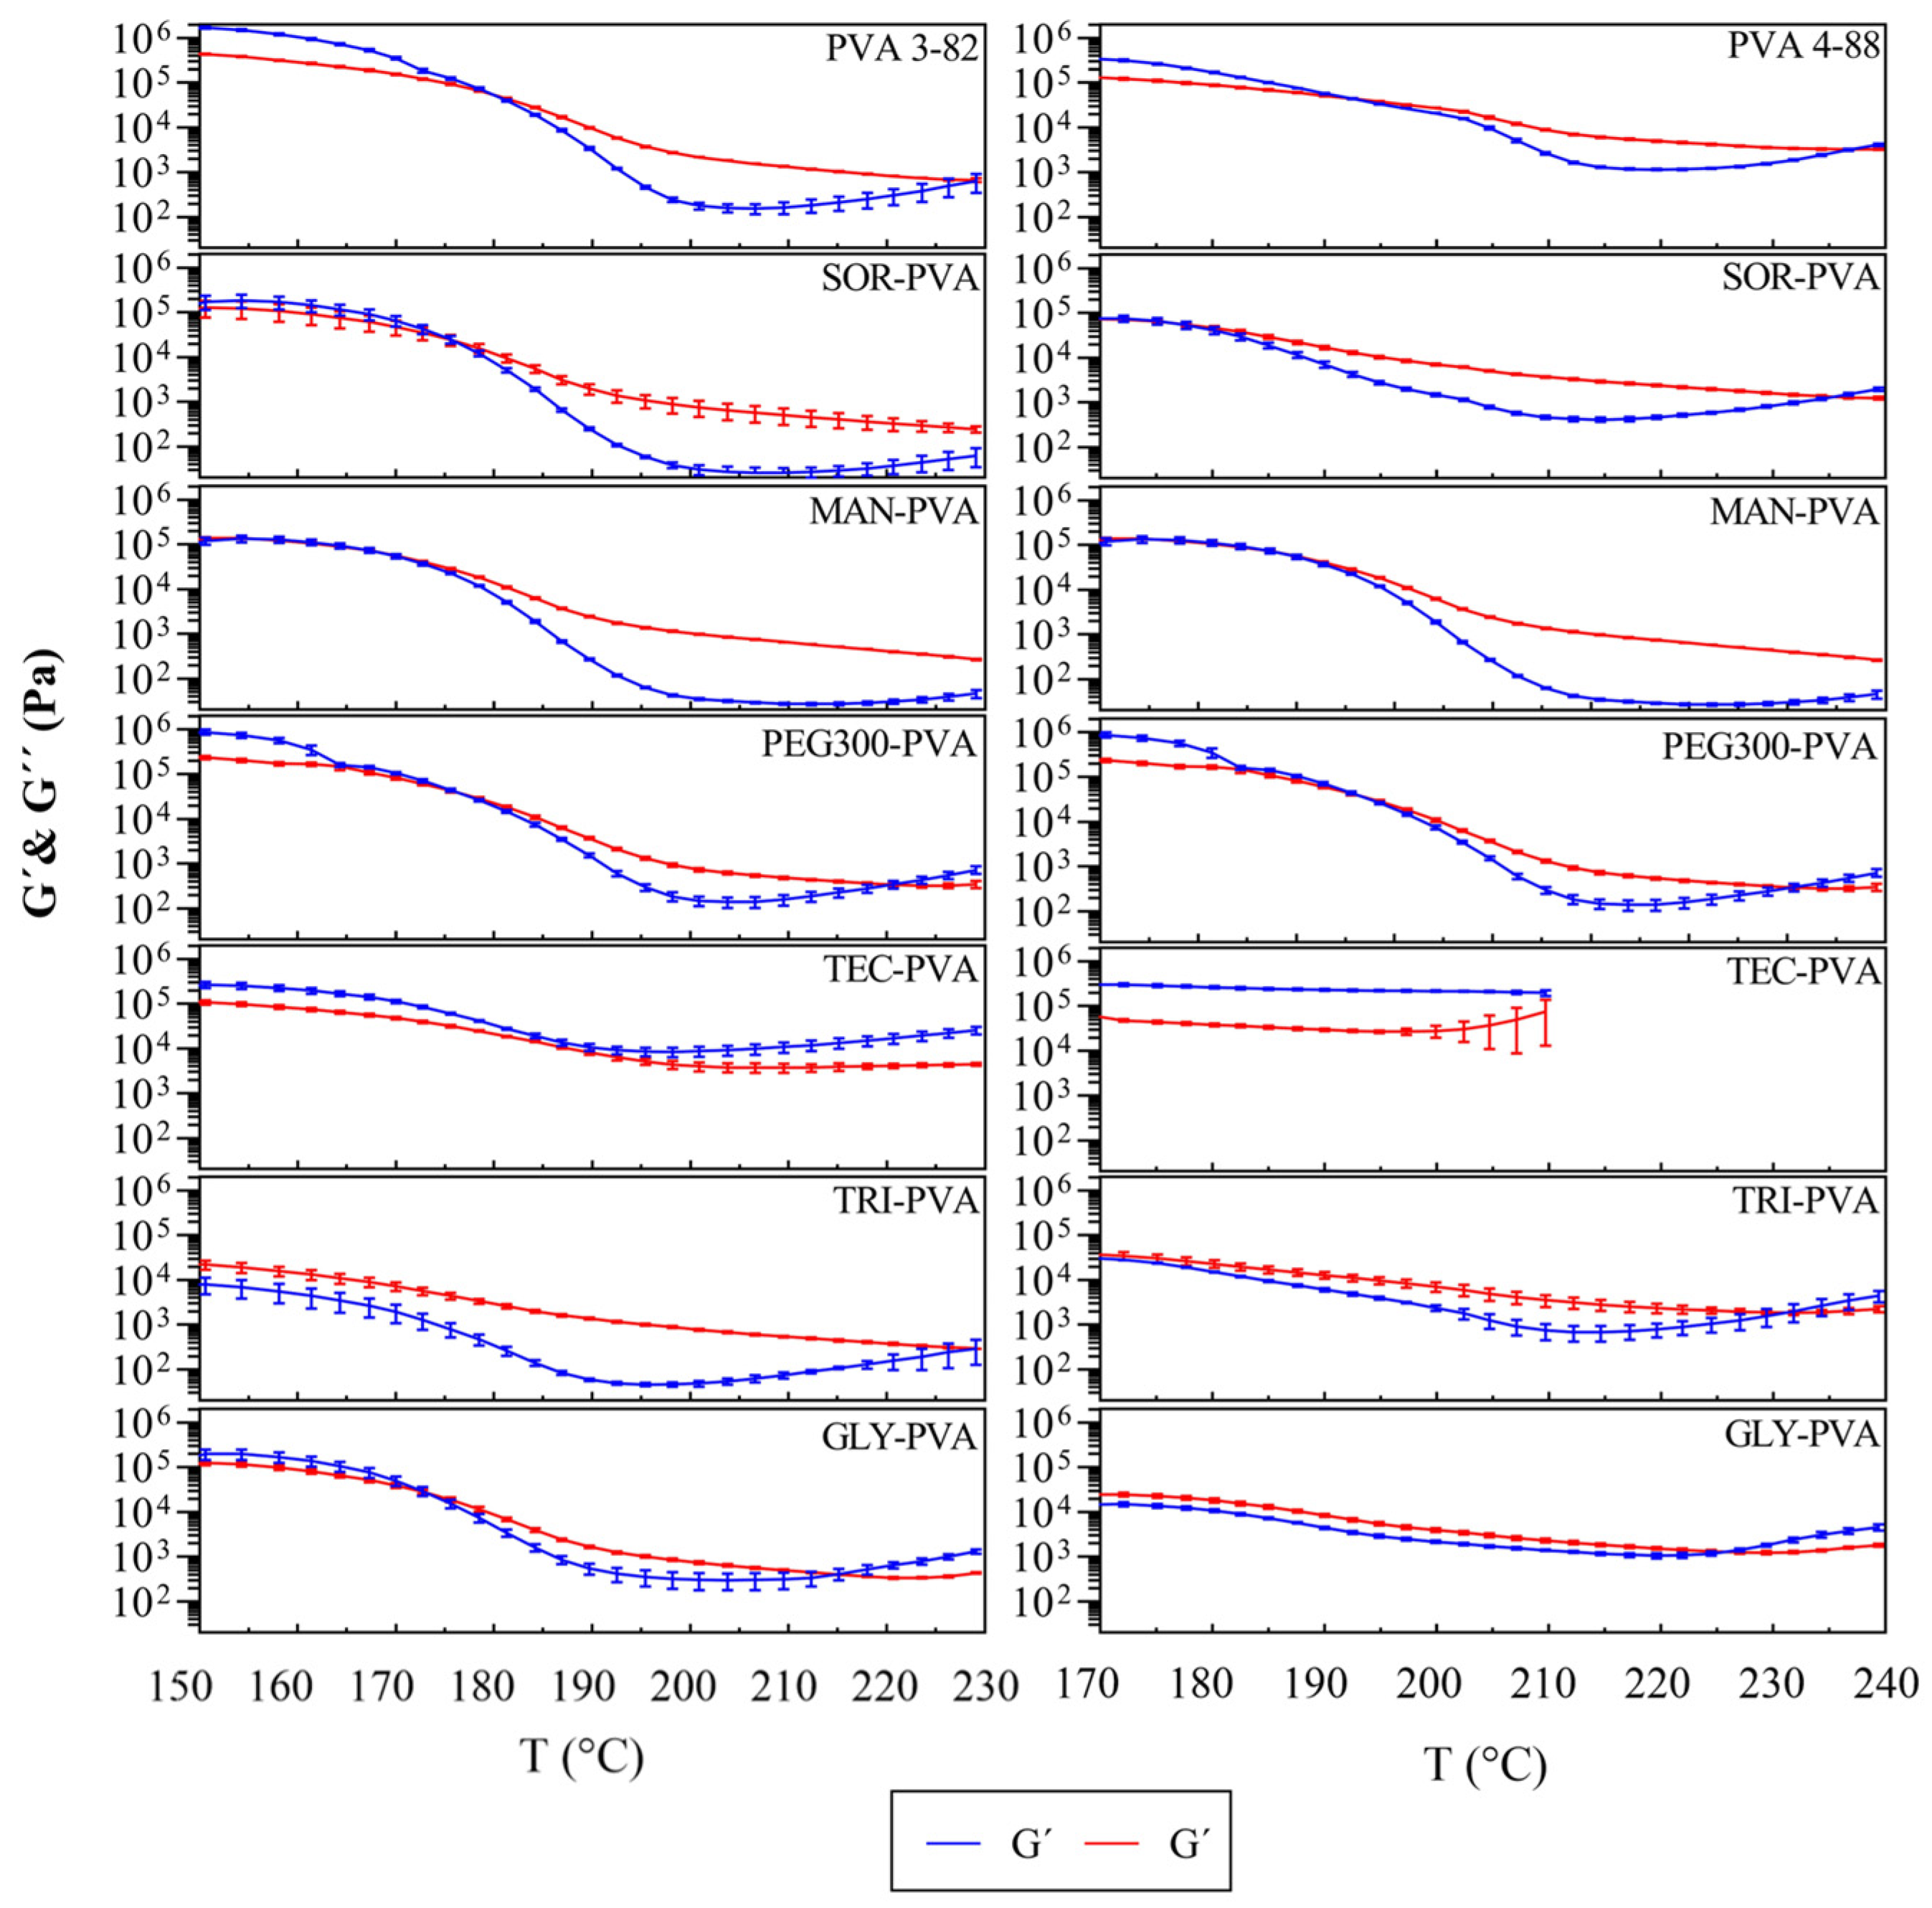
3.2. Melt Rheology
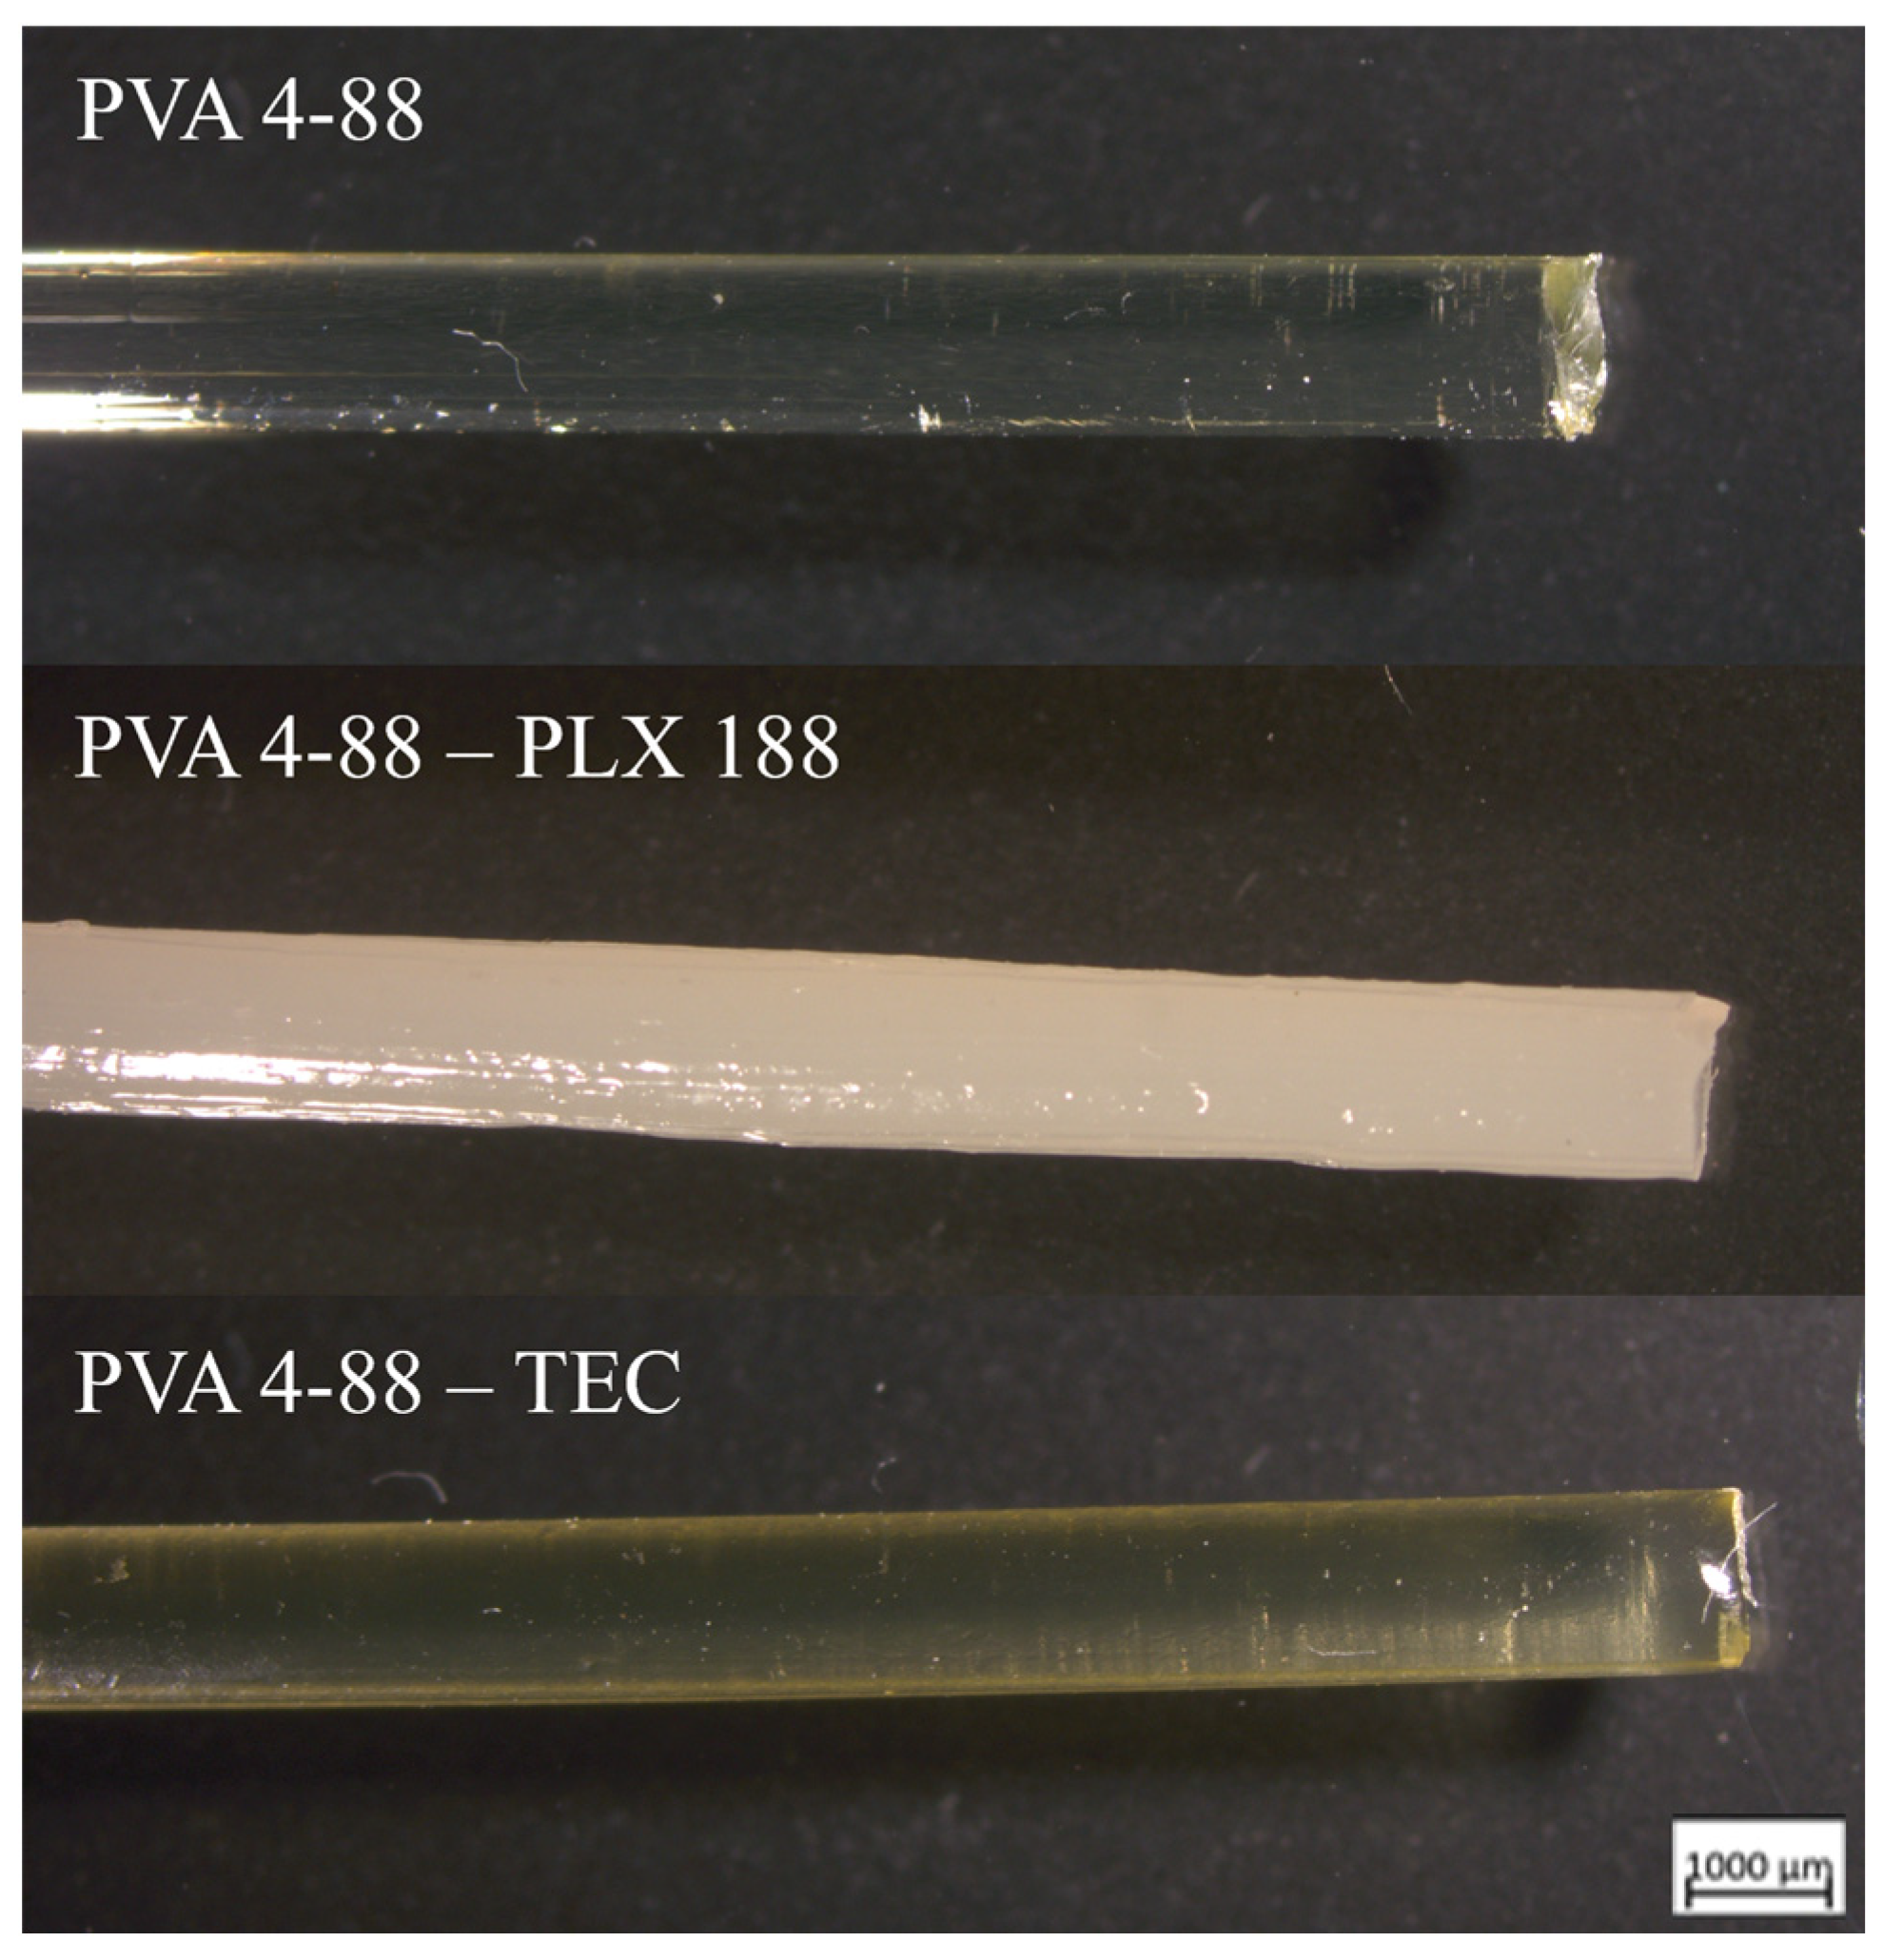
3.3. Hot Melt Extrusion
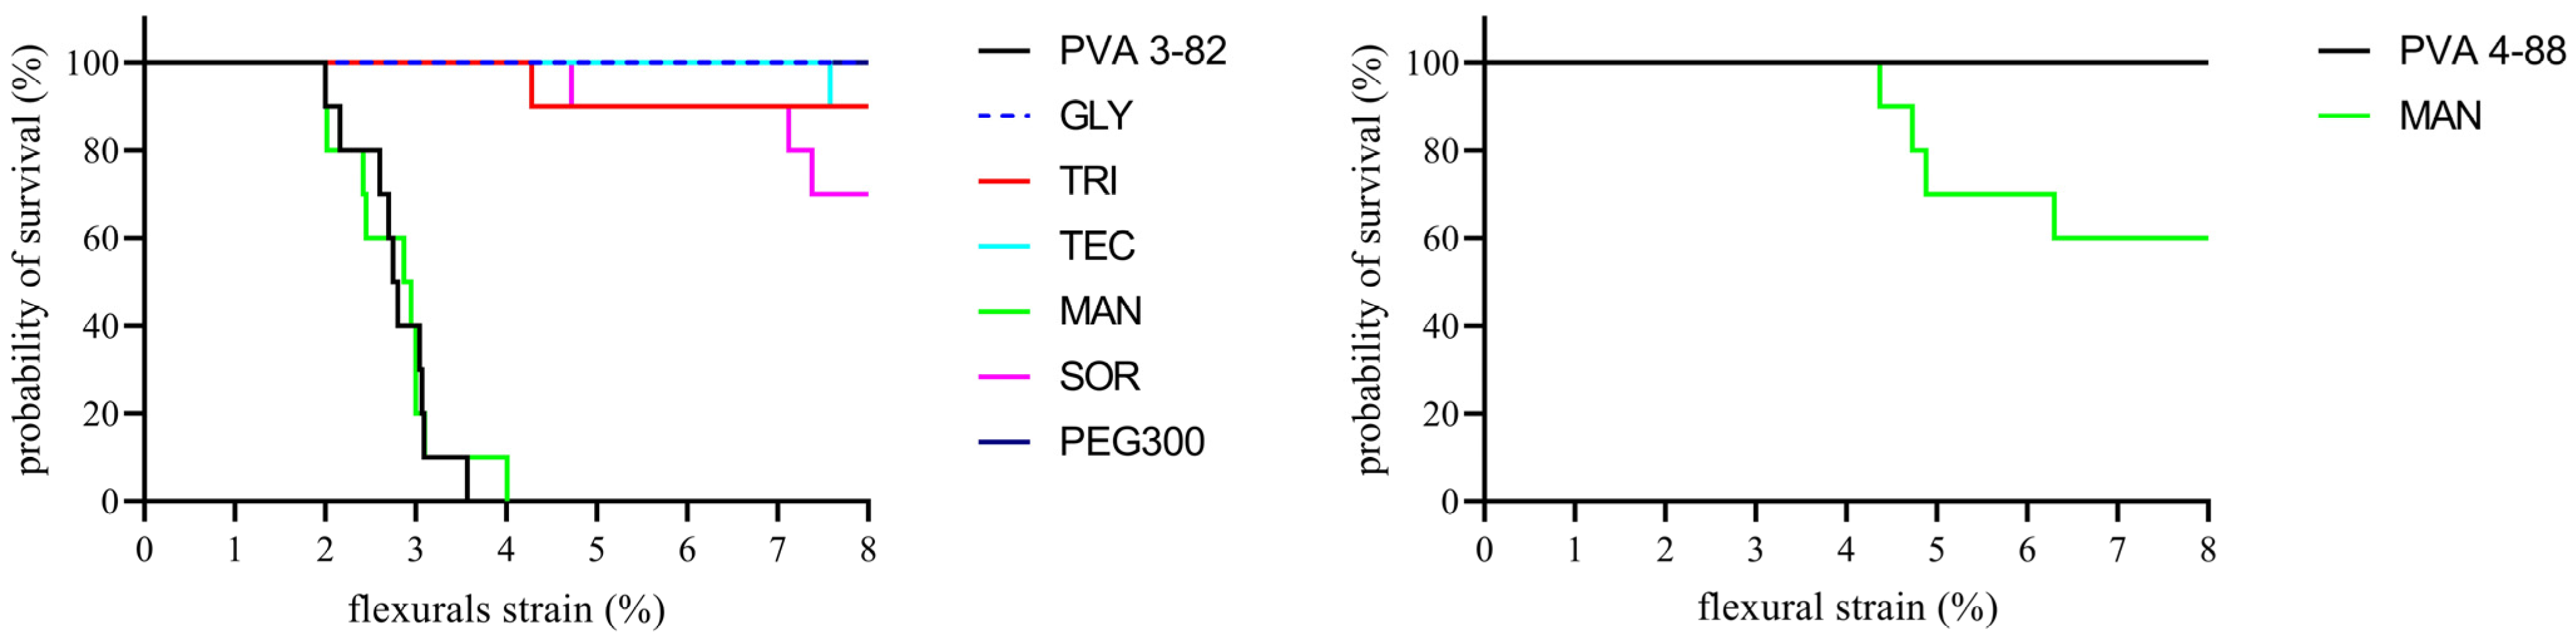
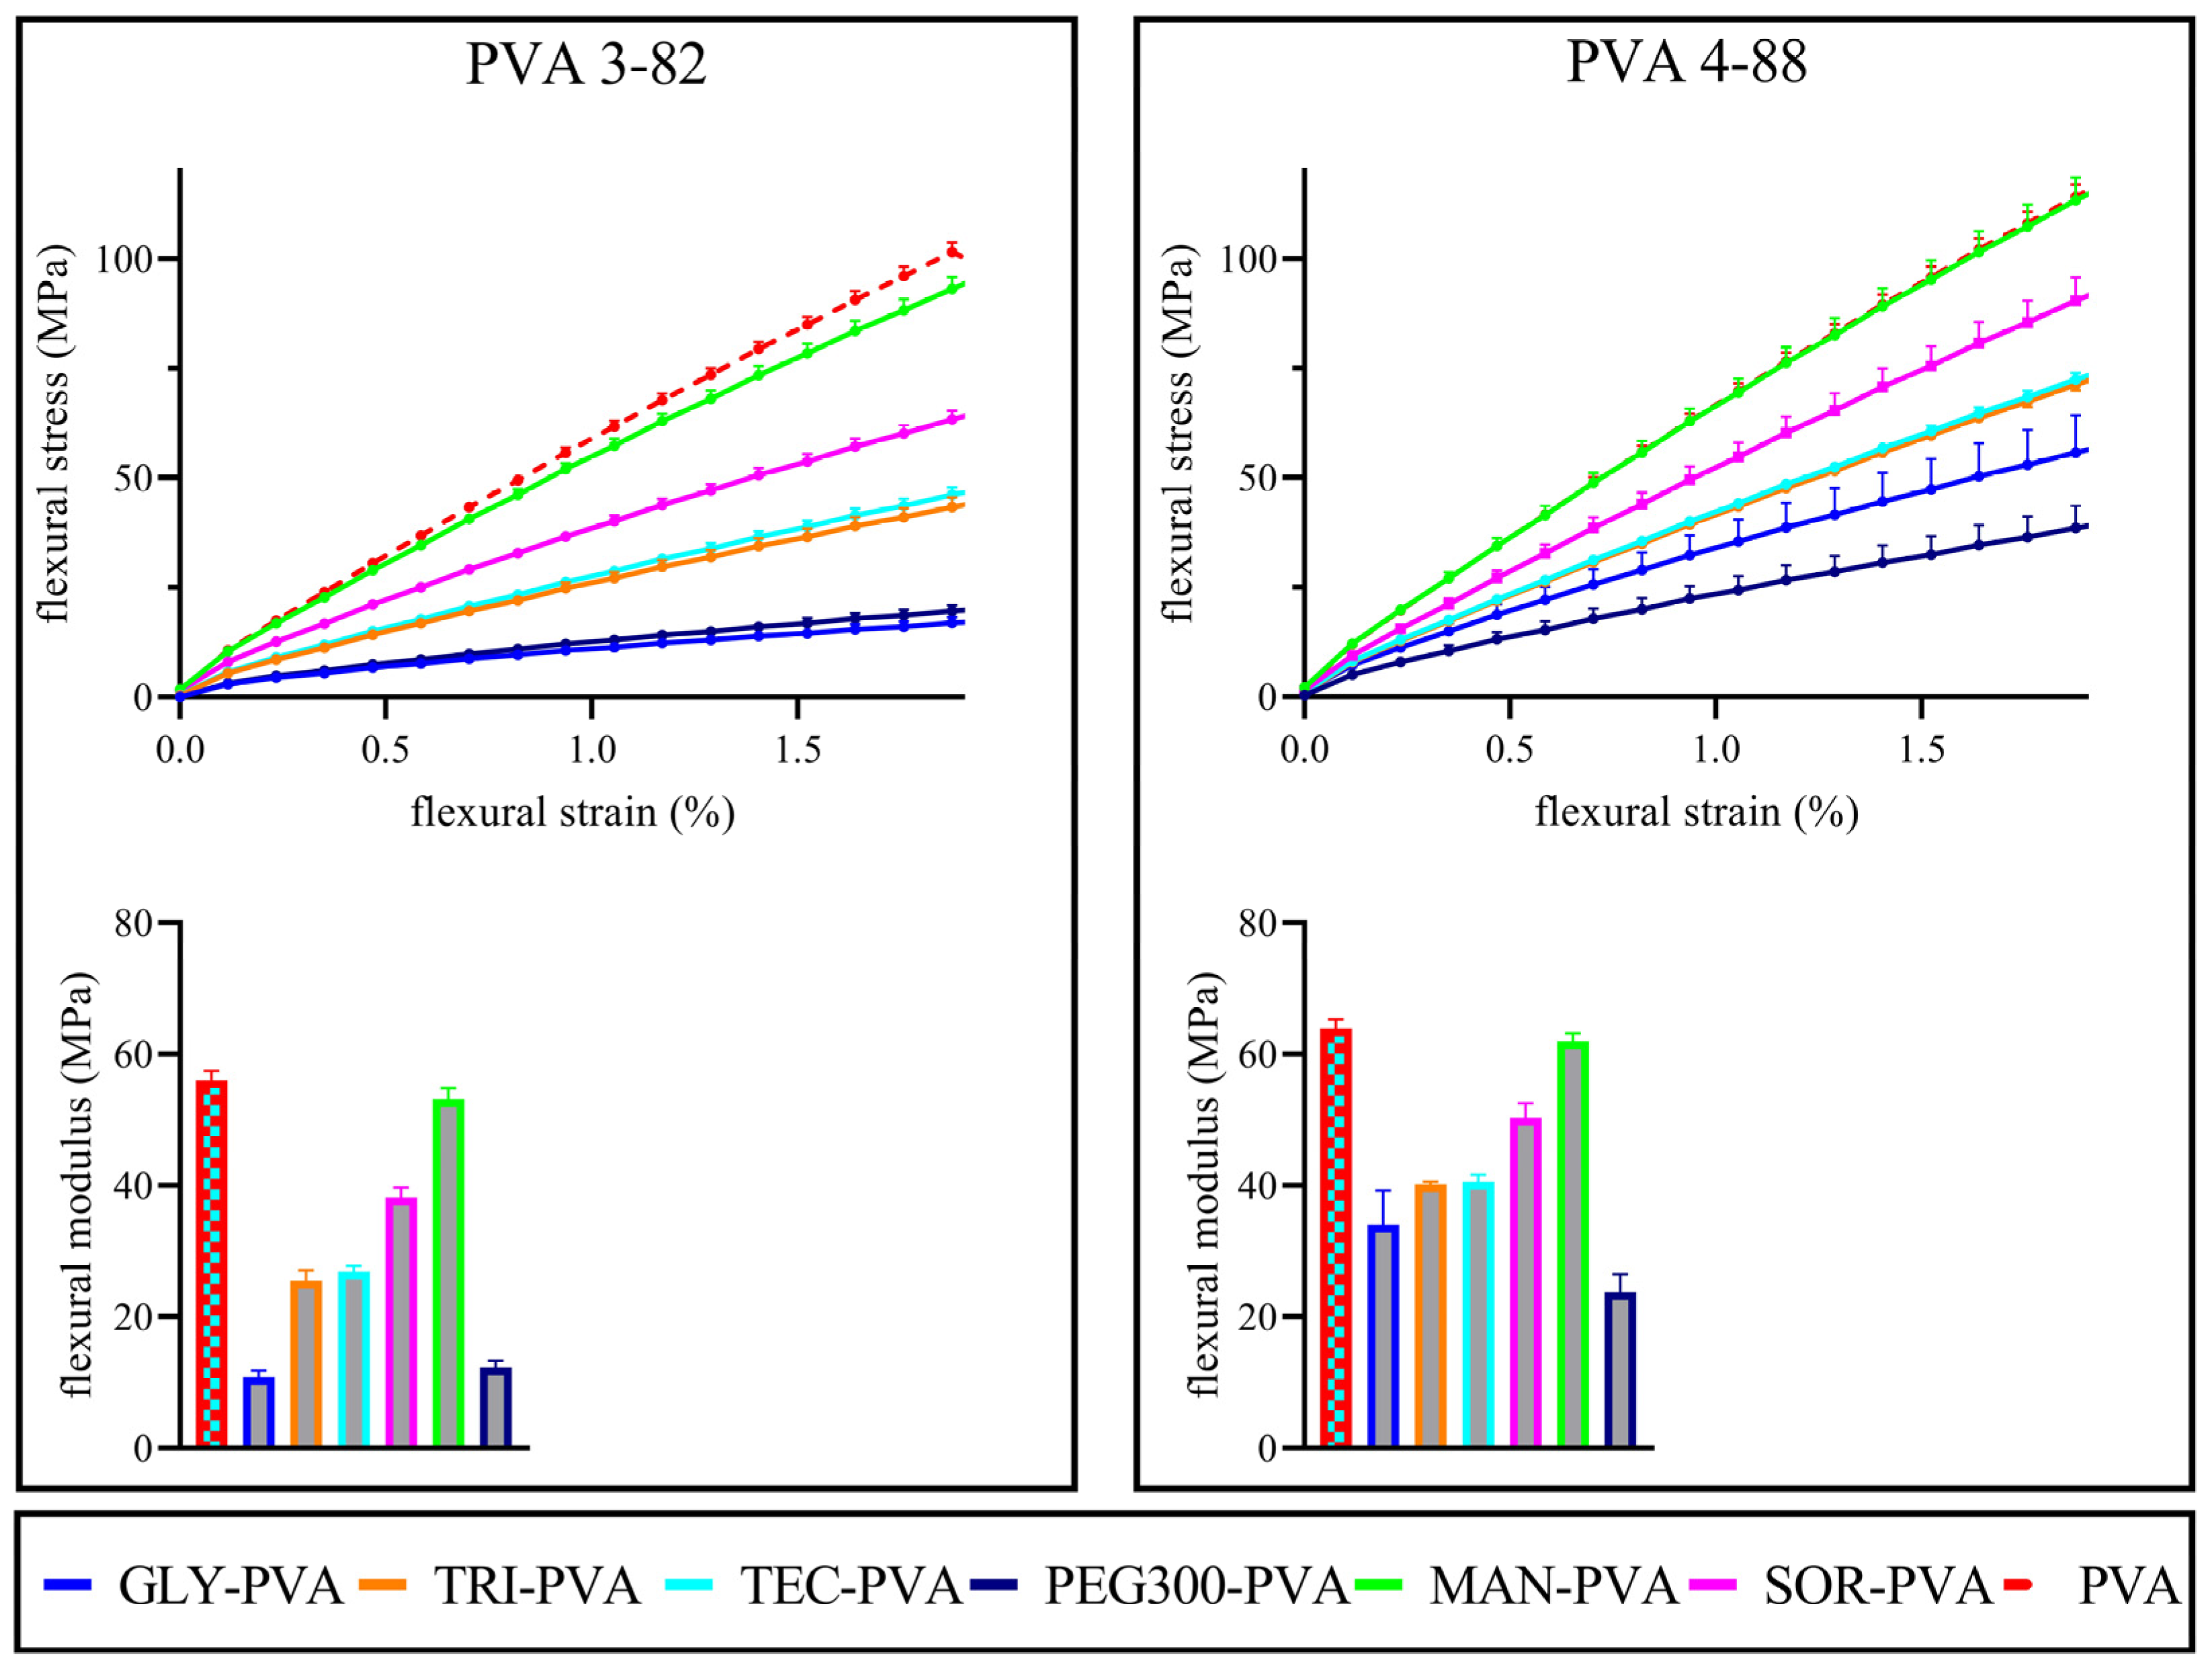
3.4. Mechanical Testing of the Filaments
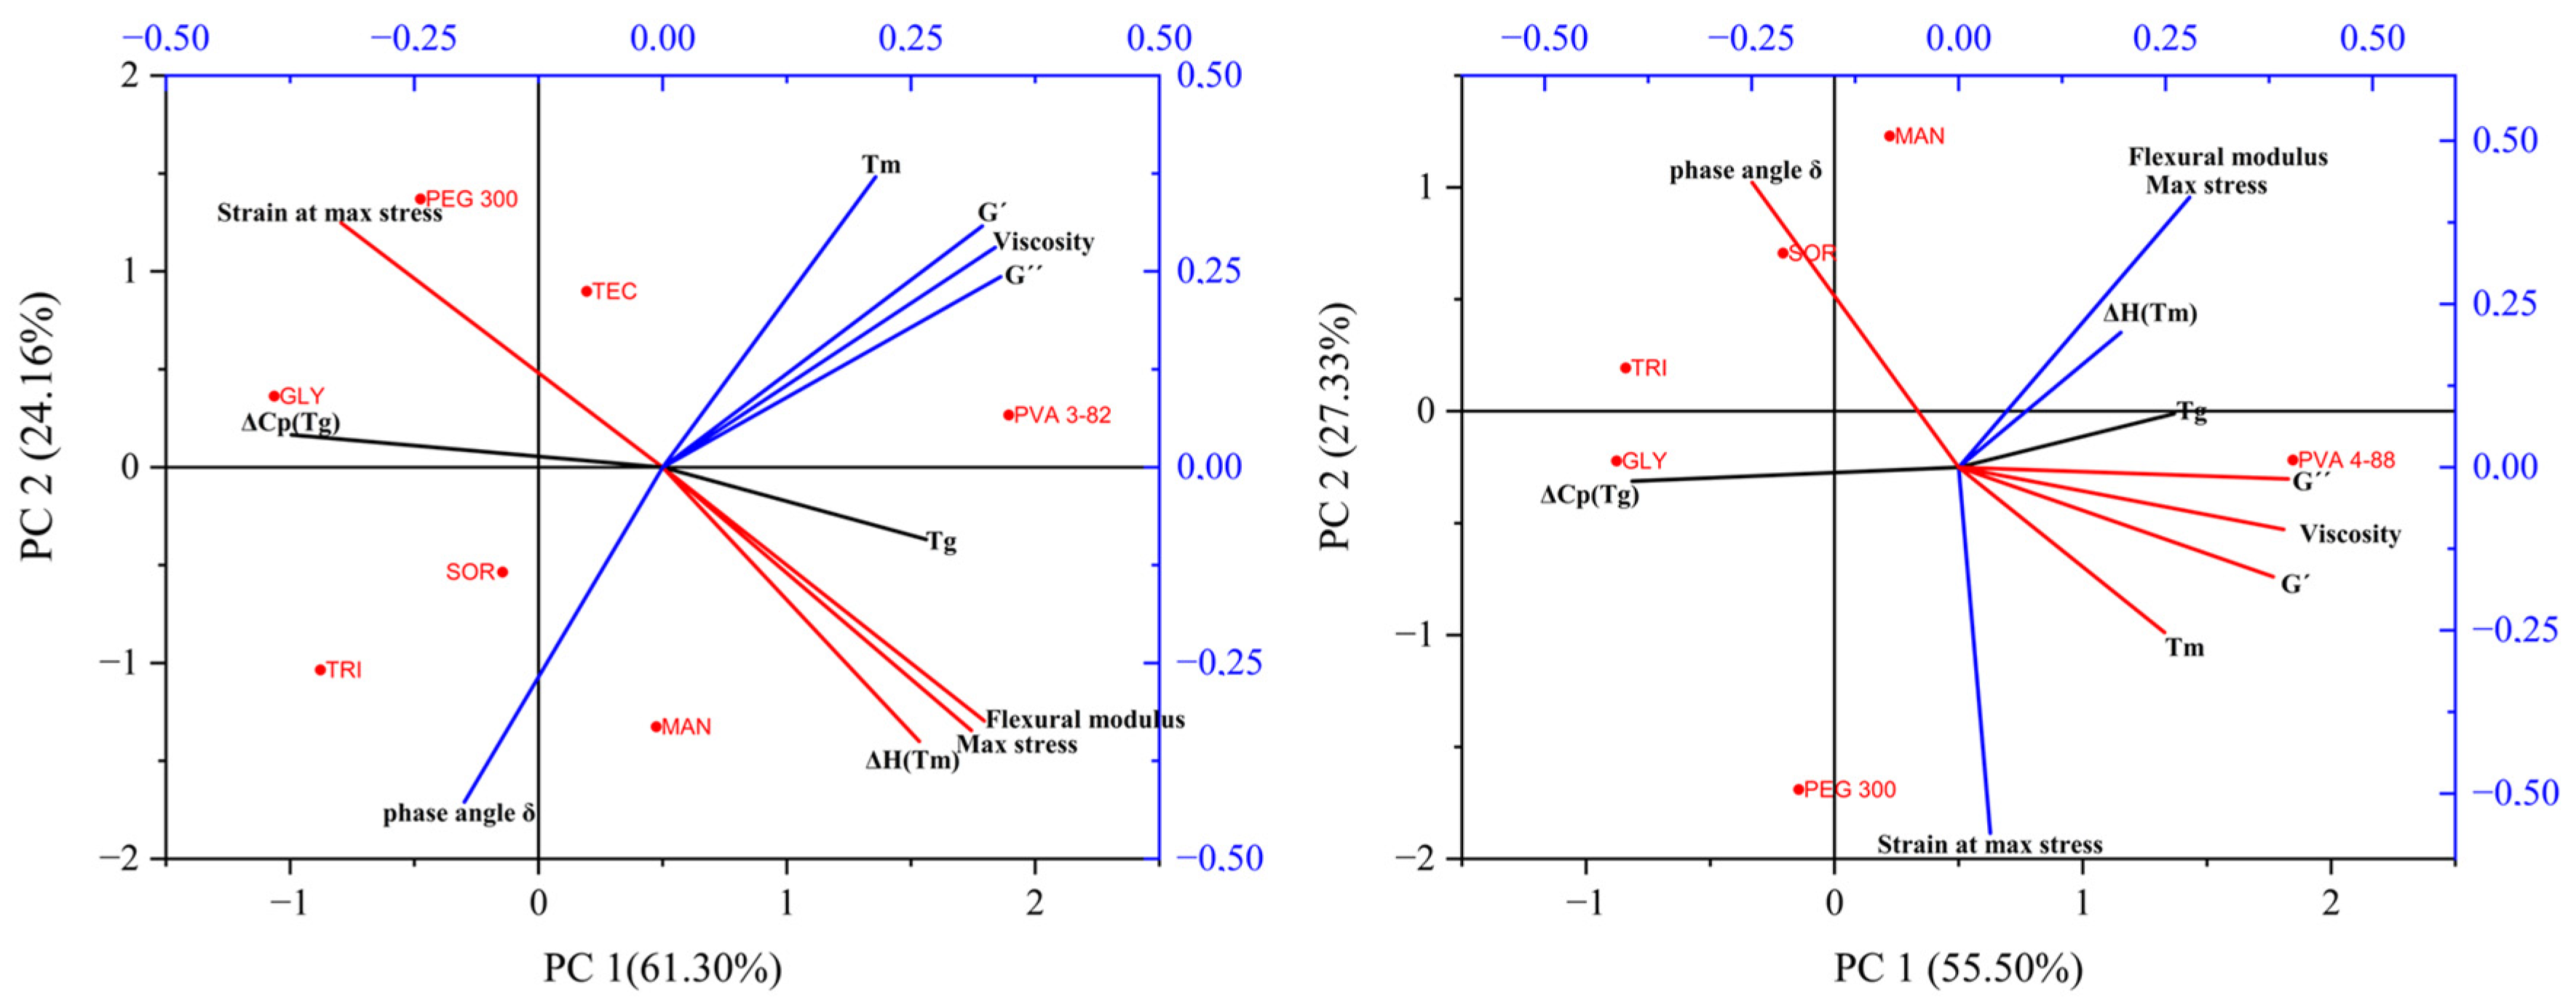
3.5. PCA
4. Discussion
4.1. Thermal Analysis
4.2. Rheological Analysis
4.3. Hot Melt Extrusion
4.4. Mechanical Testing of Filaments
5. Conclusions
Supplementary Materials
Author Contributions
Funding
Institutional Review Board Statement
Informed Consent Statement
Data Availability Statement
Conflicts of Interest
References
- Williams, H.D.; Trevaskis, N.L.; Charman, S.A.; Shanker, R.M.; Charman, W.N.; Pouton, C.W.; Porter, C.J. Strategies to address low drug solubility in discovery and development. Pharmacol. Rev. 2013, 65, 315–499. [Google Scholar] [PubMed]
- Ting, J.M.; Porter, W.W., III; Mecca, J.M.; Bates, F.S.; Reineke, T.M. Advances in polymer design for enhancing oral drug solubility and delivery. Bioconjug. Chem. 2018, 29, 939–952. [Google Scholar] [CrossRef] [PubMed]
- Amidon, G.L.; Lennernäs, H.; Shah, V.P.; Crison, J.R. A theoretical basis for a biopharmaceutic drug classification: The correlation of in vitro drug product dissolution and in vivo bioavailability. Pharm. Res. 1995, 12, 413–420. [Google Scholar] [CrossRef] [PubMed]
- Homayun, B.; Lin, X.; Choi, H.-J. Challenges and recent progress in oral drug delivery systems for biopharmaceuticals. Pharmaceutics 2019, 11, 129. [Google Scholar] [CrossRef]
- Hörter, D.; Dressman, J. Influence of physicochemical properties on dissolution of drugs in the gastrointestinal tract. Adv. Drug Deliv. Rev. 2001, 46, 75–87. [Google Scholar] [CrossRef] [PubMed]
- Deshmukh, A.S.; Tiwari, K.J.; Mahajan, V.R. Solubility enhancement techniques for poorly water-soluble drugs. Int. J. Pharm. Sci. Nanotechnol. 2017, 10, 3701–3708. [Google Scholar] [CrossRef]
- Fotaki, N.; Long, C.M.; Tang, K.; Chokshi, H. Dissolution of amorphous solid dispersions: Theory and practice. In Amorphous Solid Dispersions: Theory and Practice; Springer: Berlin/Heidelberg, Germany, 2014; pp. 487–514. [Google Scholar]
- Pandi, P.; Bulusu, R.; Kommineni, N.; Khan, W.; Singh, M. Amorphous solid dispersions: An update for preparation, characterization, mechanism on bioavailability, stability, regulatory considerations and marketed products. Int. J. Pharm. 2020, 586, 119560. [Google Scholar] [CrossRef]
- Pawar, J.; Tayade, A.; Gangurde, A.; Moravkar, K.; Amin, P. Solubility and dissolution enhancement of efavirenz hot melt extruded amorphous solid dispersions using combination of polymeric blends: A QbD approach. Eur. J. Pharm. Sci. 2016, 88, 37–49. [Google Scholar] [CrossRef] [PubMed]
- Sun, D.D.; Lee, P.I. Probing the mechanisms of drug release from amorphous solid dispersions in medium-soluble and medium-insoluble carriers. J. Control. Release 2015, 211, 85–93. [Google Scholar] [CrossRef]
- Dedroog, S.; Huygens, C.; Van den Mooter, G. Chemically identical but physically different: A comparison of spray drying, hot melt extrusion and cryo-milling for the formulation of high drug loaded amorphous solid dispersions of naproxen. Eur. J. Pharm. Biopharm. 2019, 135, 1–12. [Google Scholar] [CrossRef]
- Trasi, N.S.; Bhujbal, S.V.; Zemlyanov, D.Y.; Zhou, Q.T.; Taylor, L.S. Physical stability and release properties of lumefantrine amorphous solid dispersion granules prepared by a simple solvent evaporation approach. Int. J. Pharm. X 2020, 2, 100052. [Google Scholar] [CrossRef] [PubMed]
- Nora, G.-I.; Venkatasubramanian, R.; Strindberg, S.; Siqueira-Jørgensen, S.D.; Pagano, L.; Romanski, F.S.; Swarnakar, N.K.; Rades, T.; Müllertz, A. Combining lipid based drug delivery and amorphous solid dispersions for improved oral drug absorption of a poorly water-soluble drug. J. Control. Release 2022, 349, 206–212. [Google Scholar] [CrossRef] [PubMed]
- Palekar, S.; Mamidi, H.K.; Guo, Y.; Vartak, R.; Patel, K. Corroborating various material-sparing techniques with hot melt extrusion for the preparation of triclabendazole amorphous solid dispersions. Int. J. Pharm. 2023, 640, 122989. [Google Scholar] [CrossRef]
- Bhujbal, S.V.; Mitra, B.; Jain, U.; Gong, Y.; Agrawal, A.; Karki, S.; Taylor, L.S.; Kumar, S.; Zhou, Q.T. Pharmaceutical amorphous solid dispersion: A review of manufacturing strategies. Acta Pharm. Sin. B 2021, 11, 2505–2536. [Google Scholar] [CrossRef] [PubMed]
- Ashour, E.A.; Majumdar, S.; Alsheteli, A.; Alshehri, S.; Alsulays, B.; Feng, X.; Gryczke, A.; Kolter, K.; Langley, N.; Repka, M.A. Hot melt extrusion as an approach to improve solubility, permeability and oral absorption of a psychoactive natural product, piperine. J. Pharm. Pharmacol. 2016, 68, 989–998. [Google Scholar] [CrossRef]
- Kallakunta, V.R.; Sarabu, S.; Bandari, S.; Batra, A.; Bi, V.; Durig, T.; Repka, M.A. Stable amorphous solid dispersions of fenofibrate using hot melt extrusion technology: Effect of formulation and process parameters for a low glass transition temperature drug. J. Drug Deliv. Sci. Technol. 2020, 58, 101395. [Google Scholar] [CrossRef] [PubMed]
- Repka, M.A.; Bandari, S.; Kallakunta, V.R.; Vo, A.Q.; McFall, H.; Pimparade, M.B.; Bhagurkar, A.M. Melt extrusion with poorly soluble drugs–An integrated review. Int. J. Pharm. 2018, 535, 68–85. [Google Scholar] [CrossRef]
- Alzahrani, A.; Nyavanandi, D.; Mandati, P.; Youssef, A.A.A.; Narala, S.; Bandari, S.; Repka, M. A systematic and robust assessment of hot-melt extrusion-based amorphous solid dispersions: Theoretical prediction to practical implementation. Int. J. Pharm. 2022, 624, 121951. [Google Scholar] [CrossRef] [PubMed]
- Hörmann, T.; Jäger, N.; Funke, A.; Mürb, R.-K.; Khinast, J.G.; Paudel, A. Formulation performance and processability window for manufacturing a dual-polymer amorphous solid dispersion via hot-melt extrusion and strand pelletization. Int. J. Pharm. 2018, 553, 408–421. [Google Scholar] [CrossRef]
- Basit, A.; Trenfield, S. 3D printing of pharmaceuticals and the role of pharmacy. Pharm. J. 2022, 308, 7959. [Google Scholar]
- Seoane-Viaño, I.; Januskaite, P.; Alvarez-Lorenzo, C.; Basit, A.W.; Goyanes, A. Semi-solid extrusion 3D printing in drug delivery and biomedicine: Personalised solutions for healthcare challenges. J. Control. Release 2021, 332, 367–389. [Google Scholar] [CrossRef] [PubMed]
- Goyanes, A.; Allahham, N.; Trenfield, S.J.; Stoyanov, E.; Gaisford, S.; Basit, A.W. Direct powder extrusion 3D printing: Fabrication of drug products using a novel single-step process. Int. J. Pharm. 2019, 567, 118471. [Google Scholar] [CrossRef] [PubMed]
- Melocchi, A.; Parietti, F.; Loreti, G.; Maroni, A.; Gazzaniga, A.; Zema, L. 3D printing by fused deposition modeling (FDM) of a swellable/erodible capsular device for oral pulsatile release of drugs. J. Drug Deliv. Sci. Technol. 2015, 30, 360–367. [Google Scholar] [CrossRef]
- Gottschalk, N.; Bogdahn, M.; Harms, M.; Quodbach, J. Brittle polymers in Fused Deposition Modeling: An improved feeding approach to enable the printing of highly drug loaded filament. Int. J. Pharm. 2021, 597, 120216. [Google Scholar] [CrossRef] [PubMed]
- Patel, N.G.; Serajuddin, A.T. Development of FDM 3D-printed tablets with rapid drug release, high drug-polymer miscibility and reduced printing temperature by applying the acid-base supersolubilization (ABS) principle. Int. J. Pharm. 2021, 600, 120524. [Google Scholar] [CrossRef] [PubMed]
- Kallakunta, V.R.; Sarabu, S.; Bandari, S.; Tiwari, R.; Patil, H.; Repka, M.A. An update on the contribution of hot-melt extrusion technology to novel drug delivery in the twenty-first century: Part I. Expert Opin. Drug Deliv. 2019, 16, 539–550. [Google Scholar] [CrossRef] [PubMed]
- Shi, K.; Salvage, J.P.; Maniruzzaman, M.; Nokhodchi, A. Role of release modifiers to modulate drug release from fused deposition modelling (FDM) 3D printed tablets. Int. J. Pharm. 2021, 597, 120315. [Google Scholar] [CrossRef] [PubMed]
- Goyanes, A.; Fina, F.; Martorana, A.; Sedough, D.; Gaisford, S.; Basit, A.W. Development of modified release 3D printed tablets (printlets) with pharmaceutical excipients using additive manufacturing. Int. J. Pharm. 2017, 527, 21–30. [Google Scholar] [CrossRef] [PubMed]
- Kollamaram, G.; Croker, D.M.; Walker, G.M.; Goyanes, A.; Basit, A.W.; Gaisford, S. Low temperature fused deposition modeling (FDM) 3D printing of thermolabile drugs. Int. J. Pharm. 2018, 545, 144–152. [Google Scholar] [CrossRef]
- Krause, J.; Bogdahn, M.; Schneider, F.; Koziolek, M.; Weitschies, W. Design and characterization of a novel 3D printed pressure-controlled drug delivery system. Eur. J. Pharm. Sci. 2019, 140, 105060. [Google Scholar] [CrossRef]
- Yang, Y.; Wang, H.; Xu, X.; Yang, G. Strategies and mechanisms to improve the printability of pharmaceutical polymers Eudragit® EPO and Soluplus®. Int. J. Pharm. 2021, 599, 120410. [Google Scholar] [CrossRef] [PubMed]
- Goyanes, A.; Kobayashi, M.; Martínez-Pacheco, R.; Gaisford, S.; Basit, A.W. Fused-filament 3D printing of drug products: Microstructure analysis and drug release characteristics of PVA-based caplets. Int. J. Pharm. 2016, 514, 290–295. [Google Scholar] [CrossRef] [PubMed]
- Pereira, G.G.; Figueiredo, S.; Fernandes, A.I.; Pinto, J.F. Polymer selection for hot-melt extrusion coupled to fused deposition modelling in pharmaceutics. Pharmaceutics 2020, 12, 795. [Google Scholar] [CrossRef] [PubMed]
- Ditzinger, F.; Price, D.J.; Nair, A.; Becker-Baldus, J.; Glaubitz, C.; Dressman, J.B.; Saal, C.; Kuentz, M. Opportunities for successful stabilization of poor glass-forming drugs: A stability-based comparison of mesoporous silica versus hot melt extrusion technologies. Pharmaceutics 2019, 11, 577. [Google Scholar] [CrossRef] [PubMed]
- De Jaeghere, W.; De Beer, T.; Van Bocxlaer, J.; Remon, J.P.; Vervaet, C. Hot-melt extrusion of polyvinyl alcohol for oral immediate release applications. Int. J. Pharm. 2015, 492, 1–9. [Google Scholar] [CrossRef] [PubMed]
- Price, D.J.; Kipping, T.; Lubda, M.; Di Gallo, N.; Lamrabet, N.; Elia, A.G. Enhancing the Solubility of Active Pharmaceutical Ingredients Using Hot Melt Extrusion and Polyvinyl Alcohol. Available online: https://www.merckmillipore.com/DE/de/products/small-molecule-pharmaceuticals/formulation/solid-dosage-form/parteck-excipients/parteck-mxp/Ieyb.qB.lAcAAAFYLEQeWww_,nav (accessed on 25 March 2024).
- Rosenbaum, C.; Großmann, L.; Neumann, E.; Jungfleisch, P.; Türeli, E.; Weitschies, W. Development of a hot-melt-extrusion-based spinning process to produce pharmaceutical fibers and yarns. Pharmaceutics 2022, 14, 1229. [Google Scholar] [CrossRef] [PubMed]
- Zuber, S.A.; Rusli, A.; Ismail, H. Effectiveness of triacetin and triethyl citrate as plasticizer in polyvinyl alcohol. Mater. Today Proc. 2019, 17, 560–567. [Google Scholar] [CrossRef]
- Sofla, M.S.K.; Mortazavi, S.; Seyfi, J. Preparation and characterization of polyvinyl alcohol/chitosan blends plasticized and compatibilized by glycerol/polyethylene glycol. Carbohydr. Polym. 2020, 232, 115784. [Google Scholar] [CrossRef]
- Palekar, S.; Nukala, P.K.; Mishra, S.M.; Kipping, T.; Patel, K. Application of 3D printing technology and quality by design approach for development of age-appropriate pediatric formulation of baclofen. Int. J. Pharm. 2019, 556, 106–116. [Google Scholar] [CrossRef]
- Prasad, E.; Islam, M.T.; Goodwin, D.J.; Megarry, A.J.; Halbert, G.W.; Florence, A.J.; Robertson, J. Development of a hot-melt extrusion (HME) process to produce drug loaded Affinisol™ 15LV filaments for fused filament fabrication (FFF) 3D printing. Addit. Manuf. 2019, 29, 100776. [Google Scholar] [CrossRef]
- Kolter, K.; Karl, M.; Gryczke, A. Hot-Melt Extrusion with BASF Pharma Polymers; Pharma Ingredients & Services: Crawley, UK, 2012. [Google Scholar]
- Ferry, J.D. Viscoelastic Properties of Polymers; John Wiley & Sons, Inc.: Hoboken, NJ, USA, 1980; Volume 3. [Google Scholar]
- Brandner, S.; Becker, T.; Jekle, M. Classification of starch-gluten networks into a viscoelastic liquid or solid, based on rheological aspects—A review. Int. J. Biol. Macromol. 2019, 136, 1018–1025. [Google Scholar] [CrossRef] [PubMed]
- 178:2019-08, D.E.I.; Plastics-Determination of Flexural Properties. CEN: Bruxelle, Belgium, 2019.
- Bochmann, E.S.; Üstüner, E.E.; Gryczke, A.; Wagner, K.G. Predicting melt rheology for hot-melt extrusion by means of a simple Tg-measurement. Eur. J. Pharm. Biopharm. 2017, 119, 47–55. [Google Scholar] [CrossRef] [PubMed]
- Wlodarski, K.; Zhang, F.; Liu, T.; Sawicki, W.; Kipping, T. Synergistic effect of polyvinyl alcohol and copovidone in itraconazole amorphous solid dispersions. Pharm. Res. 2018, 35, 16. [Google Scholar] [CrossRef] [PubMed]
- Evgenii, T.; Valerie, L.; Michelle, Å.; Maria, S.; Thomas, K.; Julian, Q.; Jonas, L. Impact of polymer chemistry on critical quality attributes of selective laser sintering 3D printed solid oral dosage forms. Int. J. Pharm. X 2023, 6, 100203. [Google Scholar] [PubMed]
- Gombas, A.; Szabó-Révész, P.; Kata, M.; Regdon, G.; Erős, I. Quantitative determination of crystallinity of α-lactose monohydrate by DSC. J. Therm. Anal. Calorim. 2002, 68, 503–510. [Google Scholar] [CrossRef]
- Ricciardi, R.; Auriemma, F.; Gaillet, C.; De Rosa, C.; Lauprêtre, F. Investigation of the Crystallinity of Freeze/Thaw Poly(vinyl alcohol) Hydrogels by Different Techniques. Macromolecules 2004, 37, 9510–9516. [Google Scholar] [CrossRef]
- Pielichowski, K.; Flejtuch, K. Differential scanning calorimetry studies on poly (ethylene glycol) with different molecular weights for thermal energy storage materials. Polym. Adv. Technol. 2002, 13, 690–696. [Google Scholar] [CrossRef]
- Cassu, S.N.; Felisberti, M.I. Poly (vinyl alcohol) and poly (vinyl pyrrolidone) blends: Miscibility, microheterogeneity and free volume change. Polymer 1997, 38, 3907–3911. [Google Scholar] [CrossRef]
- TA TIP. Interpreting DSC Curves Part 1: Dynamic Measurements. Available online: https://www.eng.uc.edu/~beaucag/Classes/Characterization/DSCParts/Artifacts%20in%20DSC%20Usercom_11.pdf (accessed on 25 March 2024).
- Gupta, S.S.; Meena, A.; Parikh, T.; Serajuddin, A.T. Investigation of thermal and viscoelastic properties of polymers relevant to hot melt extrusion-I: Polyvinylpyrrolidone and related polymers. J. Excip. Food Chem. 2016, 5, 1001. [Google Scholar]
- Meena, A.; Parikh, T.; Gupta, S.S.; Serajuddin, A.T. Investigation of thermal and viscoelastic properties of polymers relevant to hot melt extrusion-II: Cellulosic polymers. J. Excip. Food Chem. 2016, 5, 46–55. [Google Scholar]
- Parikh, T.; Gupta, S.S.; Meena, A.; Serajuddin, A.T. Investigation of thermal and viscoelastic properties of polymers relevant to hot melt extrusion-III: Polymethacrylates and polymethacrylic acid based polymers. J. Excip. Food Chem. 2016, 5, 56–64. [Google Scholar]
- Boonsuk, P.; Sukolrat, A.; Kaewtatip, K.; Chantarak, S.; Kelarakis, A.; Chaibundit, C. Modified cassava starch/poly (vinyl alcohol) blend films plasticized by glycerol: Structure and properties. J. Appl. Polym. Sci. 2020, 137, 48848. [Google Scholar] [CrossRef]
- Lima, A.L.; Pires, F.Q.; Hilgert, L.A.; Sa-Barreto, L.L.; Gratieri, T.; Gelfuso, G.M.; Cunha-Filho, M. Oscillatory shear rheology as an in-process control tool for 3D printing medicines production by fused deposition modeling. J. Manuf. Process. 2022, 76, 850–862. [Google Scholar] [CrossRef]
- Fu, Z.-z.; Guo, S.-j.; Li, C.-x.; Wang, K.; Zhang, Q.; Fu, Q. Hydrogen-bond-dominated mechanical stretchability in PVA films: From phenomenological to numerical insights. Phys. Chem. Chem. Phys. 2022, 24, 1885–1895. [Google Scholar] [CrossRef]
- Suyatma, N.E.; Tighzert, L.; Copinet, A.; Coma, V. Effects of hydrophilic plasticizers on mechanical, thermal, and surface properties of chitosan films. J. Agric. Food Chem. 2005, 53, 3950–3957. [Google Scholar] [CrossRef] [PubMed]
- Ma, C.; Tan, C.; Xie, J.; Yuan, F.; Tao, H.; Guo, L.; Cui, B.; Yuan, C.; Gao, W.; Zou, F. Effects of different ratios of mannitol to sorbitol on the functional properties of sweet potato starch films. Int. J. Biol. Macromol. 2023, 242, 124914. [Google Scholar] [CrossRef]
- Grigera, J.R. Conformation of polyols in water. Molecular-dynamics simulation of mannitol and sorbitol. J. Chem. Soc. Faraday Trans. 1 Phys. Chem. Condens. Phases 1988, 84, 2603–2608. [Google Scholar] [CrossRef]


| Formulation | Feed Rate (GF) [kg/h] | Feed Rate (SP) [kg/h] | Zone 1 [°C] | Zone 2 [°C] | Zone 3 [°C] | Zone 4 [°C] | Zone 5 [°C] | Zone 6 [°C] | Zone 7 [°C] | Die [°C] |
|---|---|---|---|---|---|---|---|---|---|---|
| PVA 4-88 (S) | 0.2 | - | 80 | 150 | 200 | 200 | 200 | 200 | 200 | 210 |
| PVA 4-88 (L) | 0.18 | 0.02 | 80 | 150 | 200 | 200 | 200 | 200 | 200 | 210 |
| PVA 3-82 (S) | 0.2 | - | 80 | 150 | 190 | 190 | 190 | 190 | 190 | 190 |
| PVA 3-82 (L) | 0.18 | 0.02 | 80 | 150 | 190 | 190 | 190 | 190 | 190 | 190 |
| Plasticizer | PVA 3-82 | PVA 4-88 | ||||||
|---|---|---|---|---|---|---|---|---|
| Tg [°C] | ΔCp [K/Jg−1] | Tm [°C] | ΔH [Jg−1] | Tg [°C] | ΔCp [K/Jg−1] | Tm [°C] | ΔH [Jg−1] | |
| none | 62.6 (±0.3) | 0.659 (±0.099) | 170.3 (±23.0) | 5.450 (±0.453) | 67.3 (±0.4) | 0.628 (±0.038) | 176.7 (±0.4) | 11.620 (±0.511) |
| GLY | 38.2 (±2.6) | 0.938 (±0.106) | 150.3 (±3.2) | 3.550 (±0.427) | 44.3 (±1.3) | 0.774 (±0.034) | 166.2 (±1.1) | 10.067 (±0.891) |
| TRI | 56.3 (±1.2) | 0.912 (±0.023) | 129.4 (±1.6) | 3.153 (±0.244) | 61.9 (±0.9) | 0.791 (±0.015) | 148.5 (±2.8) | 5.4770 (±0.468) |
| TEC | 61.5 (±0.6) | 0.871 (±0.036) | 155.1 (±0.5) | 2.953 (±0.080) | 70.7 (±0.4) | 0.762 (±0.012) | 133.4 (±0.4) | 6.250 (±0.646) |
| PEG 300 | 44.0 (±0.5) | 0.896 (±0.041) | 174.0 (±2.5) | 2.917 (±0.759) | 48.8 (±1.0) | 0.725 (±0.045) | 178.6 (±0.4) | 9.973 (±0.264) |
| MAN | 52.1 (±0.1) | 0.801 (±0.013) | 157.1 (±0.3) | 5.983 (±0.278) | 53.3 (±0.5) | 0.695 (±0.019) | 168.4 (±0.2) | 13.603 (±0.146) |
| SOR | 49.9 (±0.1) | 0.895 (±0.024) | 153.9 (±0.5) | 4.745 (±0.106) | 50.3 (±0.5) | 0.728 (±0.036) | 166.9 (±0.7) | 12.730 (±0.495) |
| Plasticizer | PVA 3-82 | PVA 4-88 | ||||||||||
|---|---|---|---|---|---|---|---|---|---|---|---|---|
| Tg [°C] | ΔCp [K/Jg−1] | Tm(1) [°C] | ΔH(1) [Jg−1] | Tm(2) [°C] | ΔH(2) [Jg−1] | Tg [°C] | ΔCp [K/Jg−1] | Tm(1) [°C] | ΔH(1) [Jg−1] | Tm(2) [°C] | ΔH(2) [Jg−1] | |
| PLX 188 | 66.2 (±1.5) | 0.375 (±0.024) | 54.6 (±0.0) | 12.27 (±0.215) | 158.3 (±1.0) | 4.37 (±0.424) | 68.0 (±0.0) | 0.414 (±0.014) | 55.0 (±0.1) | 13.06 (±0.953) | 177.3 (±0.0) | 8.65 (±0.236) |
| PLX 407 | 65.0 (±0.2) | 0.393 (±0.022) | 54.8 (±0.2) | 11.82 (±1.764) | 158.78 (±1.5) | 4.35 (±0.367) | 68.0 (±0.3) | 0.386 (±0.023) | 54.6 (±0.1) | 11.34 (±0.520) | 178.68 (±0.0) | 8.79 (±0.191) |
| PEG 400 | N/A | N/A | N/A | N/A | N/A | N/A | 53.9 (±0.3) | 0.617 (±0.020) | N/A | N/A | 176.5 (±1.0) | 8.40 (±0.446) |
| PEG 600 | 51.9 (±0.6) | 0.813 (±0.069) | N/A | N/A | 173.2 (±2.7) | 3.43 (±0.719) | 60.9 (±0.3) | 0.488 (±0.031) | 19.3 (±0.1) | 1.13 (±0.225) | 175.6 (±0.6) | 9.11 (±0.284) |
| PEG 1000 | 55.7 (±1.7) | 0.490 (±0.058) | 37.7 (±0.3) | 0.65 (±0.093) | 169.0 (±2.2) | 3.87 (±0.823) | 65.5 (±0.5) | 0.557 (±0.071) | 37.3 (±0.0) | 6.26 (±1.927) | 173.5 (±0.4) | 10.3 (±0.277) |
| Plasticizer | PVA 3-82 | PVA 4-88 | ||
|---|---|---|---|---|
| 1. Crossover [°C] | 2. Crossover [°C] | 1. Crossover [°C] | 2. Crossover [°C] | |
| none | 180.1 | 228.3 | 192.3 | 237.1 |
| GLY | N/A | N/A | N/A | 225.9 |
| TRI | N/A | 226.4 | 173.6 | 231.9 |
| TEC | N/A | N/A | N/A | N/A |
| PEG 300 | 176.5 | 220.6 | 192.7 | 229.5 |
| MAN | 169.0 | N/A | 183.4 | 237.8 |
| SOR | 174.4 | N/A | 177.6 | 235.7 |
| Plasticizer | PVA 3-82 | PVA 4-88 | ||||
|---|---|---|---|---|---|---|
| Flexural Modulus [18] | Max. Stress [18] | Strain at Max Stress [%] | Flexural Modulus [18] | Max. Stress [18] | Strain at Max Stress [%] | |
| none | 59.0 | 137.8 | 2.701 | 64.8 | 196.0 | 5.693 |
| GLY | 11.1 | 29.8 | 6.396 | 34.0 | 95.3 | 5.464 |
| TRI | 25.3 | 74.5 | 5.500 | 39.0 | 122.4 | 5.385 |
| TEC | 26.4 | 76.4 | 5.428 | 41.1 | 127.0 | 5.258 |
| PEG 300 | 11.9 | 34.6 | 6.630 | 23.6 | 69.0 | 6.221 |
| MAN | 52.7 | 121.8 | 2.785 | 64.0 | 181.8 | 4.598 |
| SOR | 37.9 | 104.4 | 5.164 | 50.1 | 160.0 | 5.137 |
Disclaimer/Publisher’s Note: The statements, opinions and data contained in all publications are solely those of the individual author(s) and contributor(s) and not of MDPI and/or the editor(s). MDPI and/or the editor(s) disclaim responsibility for any injury to people or property resulting from any ideas, methods, instructions or products referred to in the content. |
© 2024 by the authors. Licensee MDPI, Basel, Switzerland. This article is an open access article distributed under the terms and conditions of the Creative Commons Attribution (CC BY) license (https://creativecommons.org/licenses/by/4.0/).
Share and Cite
Hess, F.; Kipping, T.; Weitschies, W.; Krause, J. Understanding the Interaction of Thermal, Rheological, and Mechanical Parameters Critical for the Processability of Polyvinyl Alcohol-Based Systems during Hot Melt Extrusion. Pharmaceutics 2024, 16, 472. https://doi.org/10.3390/pharmaceutics16040472
Hess F, Kipping T, Weitschies W, Krause J. Understanding the Interaction of Thermal, Rheological, and Mechanical Parameters Critical for the Processability of Polyvinyl Alcohol-Based Systems during Hot Melt Extrusion. Pharmaceutics. 2024; 16(4):472. https://doi.org/10.3390/pharmaceutics16040472
Chicago/Turabian StyleHess, Florian, Thomas Kipping, Werner Weitschies, and Julius Krause. 2024. "Understanding the Interaction of Thermal, Rheological, and Mechanical Parameters Critical for the Processability of Polyvinyl Alcohol-Based Systems during Hot Melt Extrusion" Pharmaceutics 16, no. 4: 472. https://doi.org/10.3390/pharmaceutics16040472
APA StyleHess, F., Kipping, T., Weitschies, W., & Krause, J. (2024). Understanding the Interaction of Thermal, Rheological, and Mechanical Parameters Critical for the Processability of Polyvinyl Alcohol-Based Systems during Hot Melt Extrusion. Pharmaceutics, 16(4), 472. https://doi.org/10.3390/pharmaceutics16040472