Neuroprotective Effect of Ropinirole Lipid Nanoparticles Enriched Hydrogel for Parkinson’s Disease: In Vitro, Ex Vivo, Pharmacokinetic and Pharmacodynamic Evaluation

Abstract
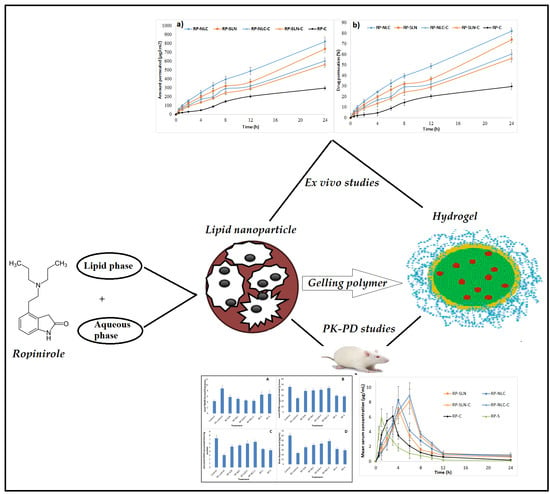
1. Introduction
2. Materials
2.1. Animals
2.2. HPLC Method for In Vitro Studies
2.3. Preparation of RP Loaded Lipid Nanocarriers
2.4. Preparation of RP Suspension (RP-S)
2.5. Preparation of RP-SLN-C and RP-NLC-C
2.6. Characterization of RP-SLN and RP-NLC
2.6.1. Particle Size, Polydispersity Index (PDI) and Zeta Potential (ZP)
2.6.2. Total Drug Content and Drug Loading (DL)
2.6.3. Entrapment Efficiency (EE)
2.7. Evaluation of RP-SLN-C and RP-NLC-C
2.7.1. Visual Examination, pH, Viscosity and In Vitro Release
2.7.2. Spreadability
2.7.3. Extrudability Test
2.7.4. Total Drug Content
2.7.5. Lyophilization of RP-SLN and RP-NLC Formulation
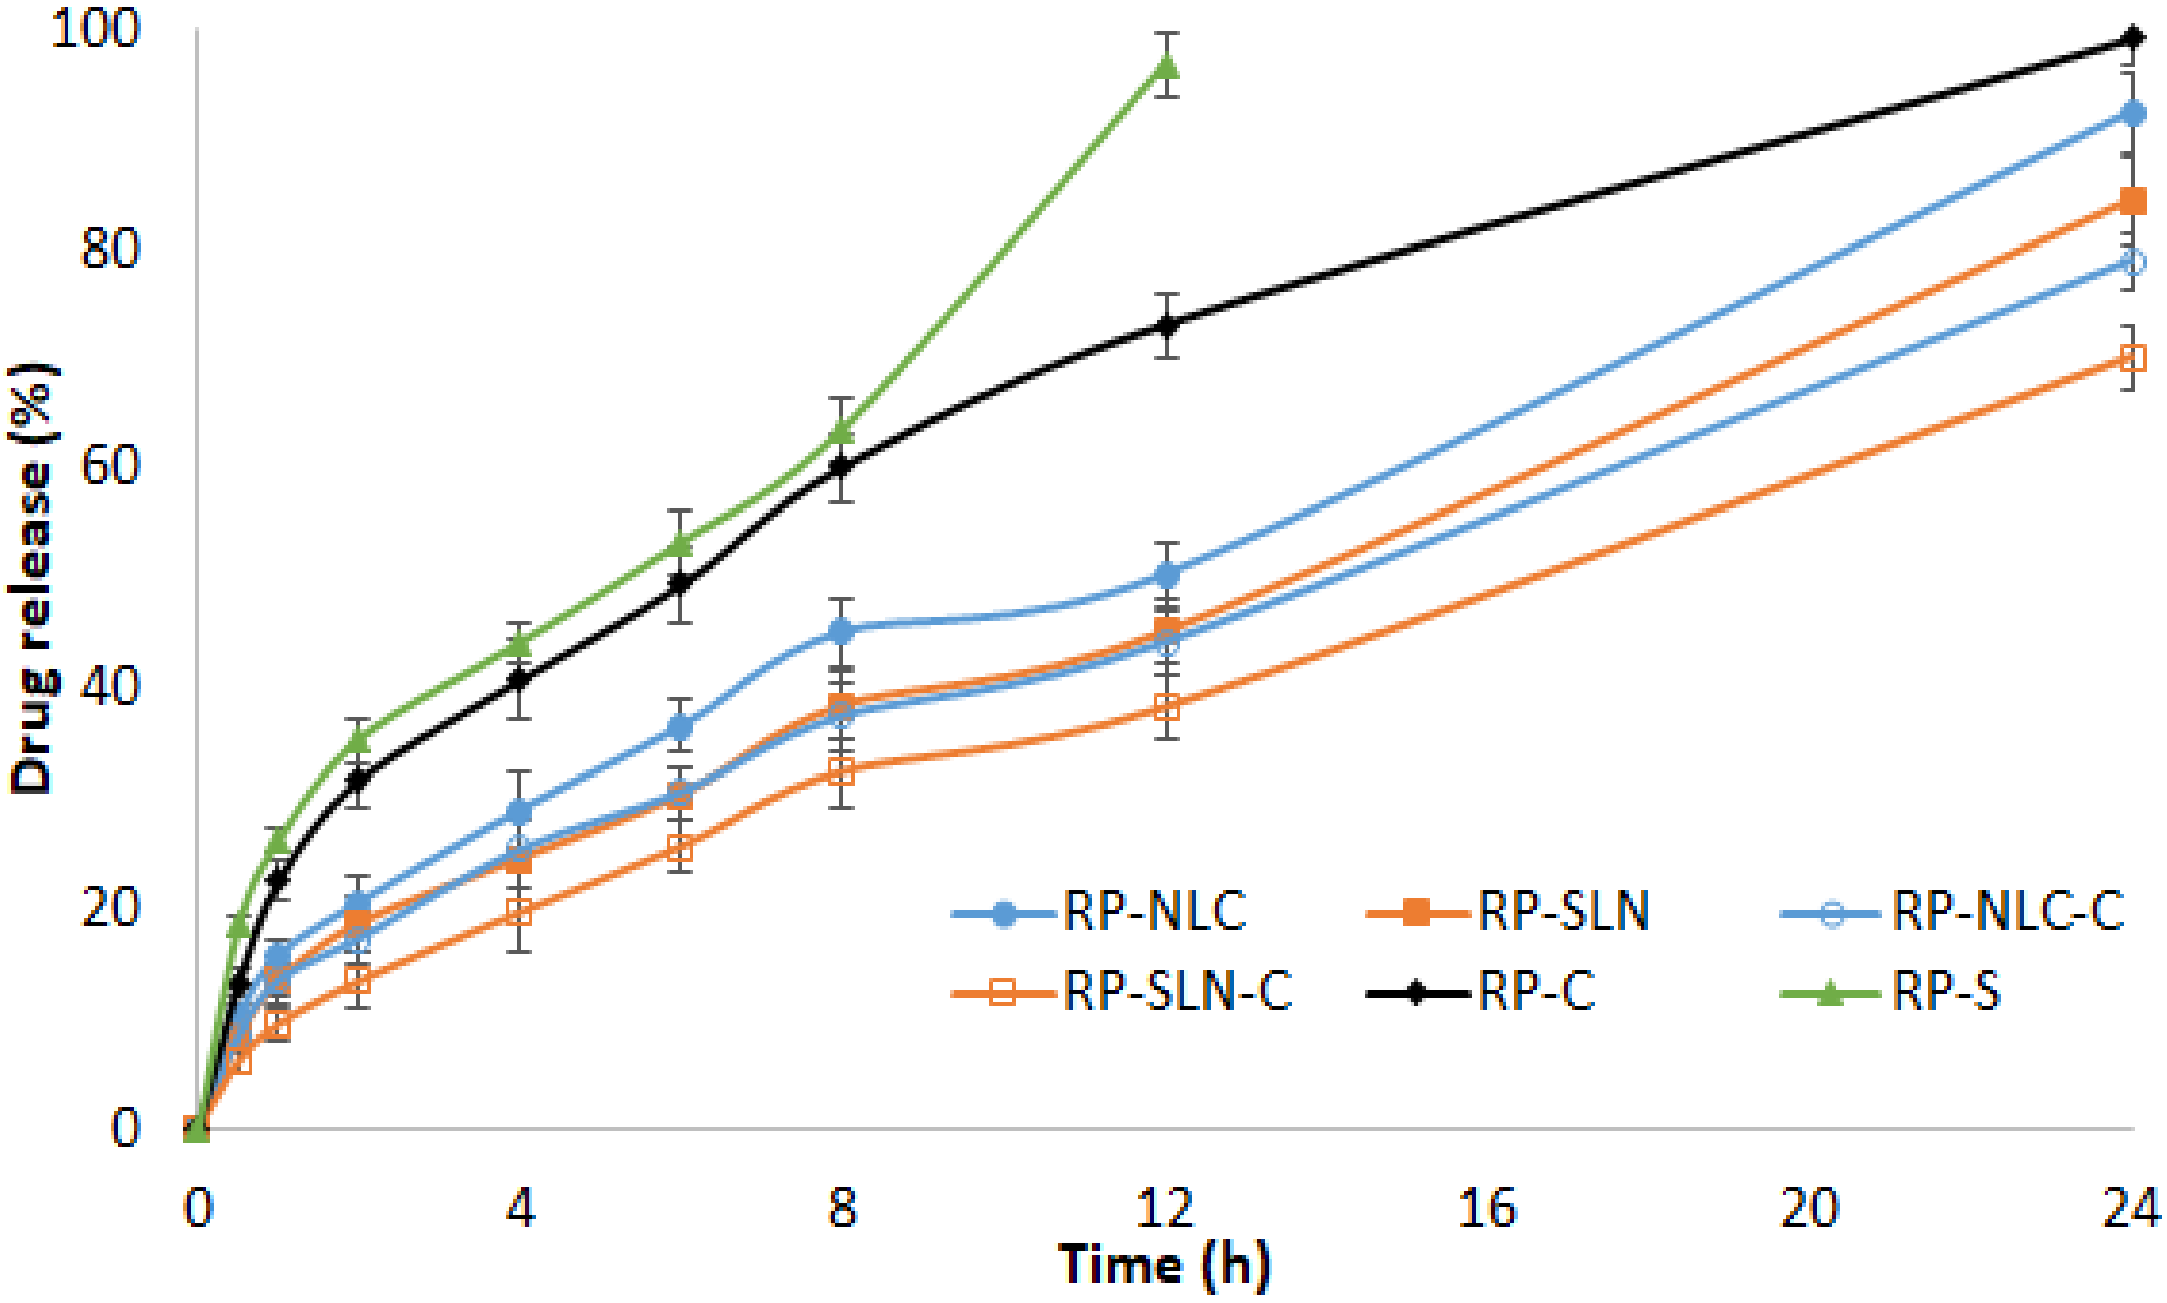
2.7.6. In Vitro Release Studies
2.8. Ex Vivo Permeation Studies
2.8.1. Preparation of Skin
2.8.2. Procedure
2.9. Stability Studies
2.10. Solid-State Characterization
2.10.1. Differential Scanning Calorimetry (DSC)
2.10.2. X-ray Diffraction (XRD)
2.10.3. Morphology of Lipid Nanoformulations and Hydrogels by Scanning Electron Microscopy (SEM)
2.11. In Vivo Studies
2.11.1. Pharmacokinetic (PK) Studies
Study Protocol
Study Design
Extraction and Quantification of RP from Rat Serum
Calculation of PK Parameters
2.11.2. Skin Irritation Studies
Statistical Treatment of Data
2.11.3. Pharmacodynamic Study
2.11.4. Biochemical Studies
Tissue Preparation
Lipid Peroxidation
Assay for Reduced Glutathione Content (GSH)
Determination of Catalase Activity
Dopamine Levels
3. Results and Discussion
3.1. Characterization of RP-SLN and RP-NLC
3.1.1. Size, PDI and ZP
3.1.2. Drug Content, DL and EE
3.1.3. Characterization of RP-SLN-C and RP-NLC-C
3.1.4. Visual, Rheological and pH Studies
3.2. In Vitro Release Studies
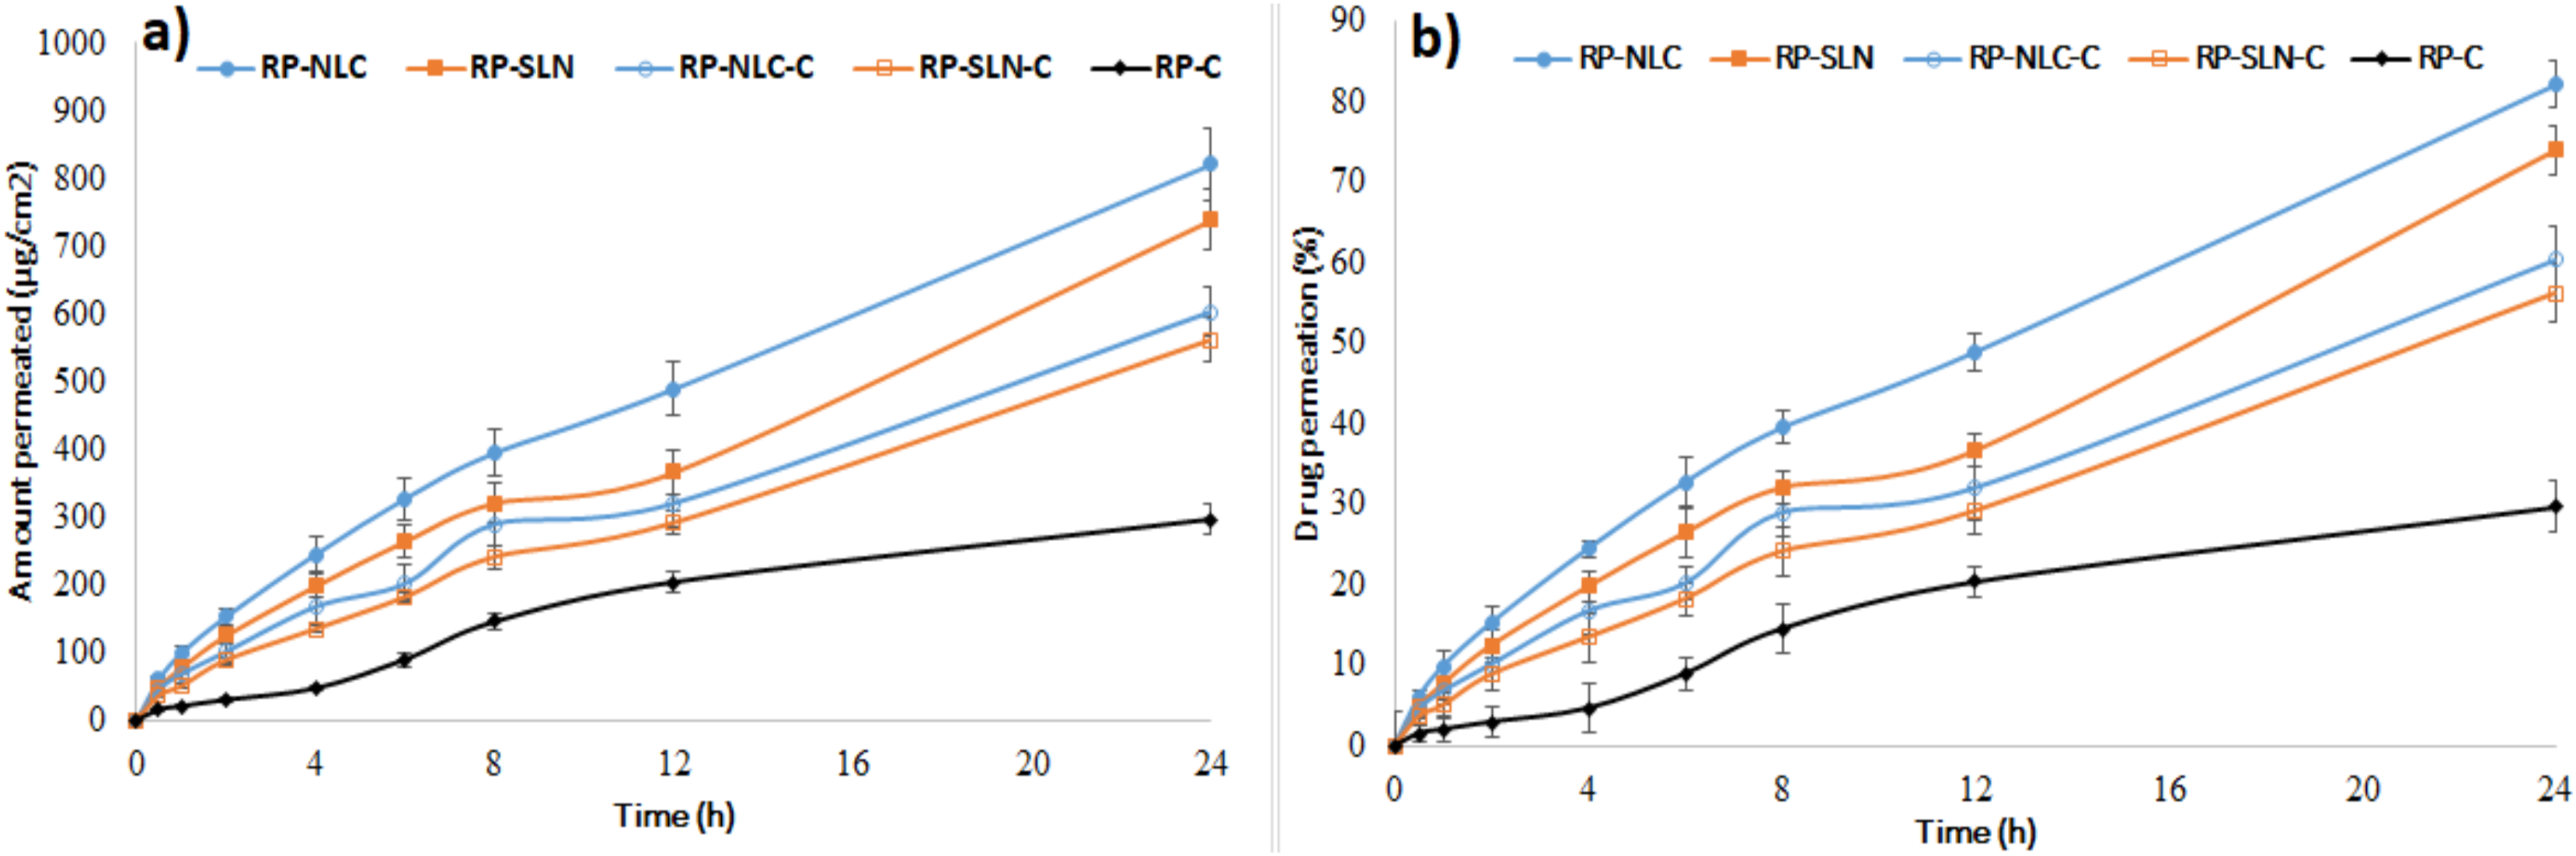
3.3. Ex Vivo Permeation Studies
3.4. Stability Studies
3.5. Lyophilization of KZ-SLN Formulation
3.6. Solid-State Characterization
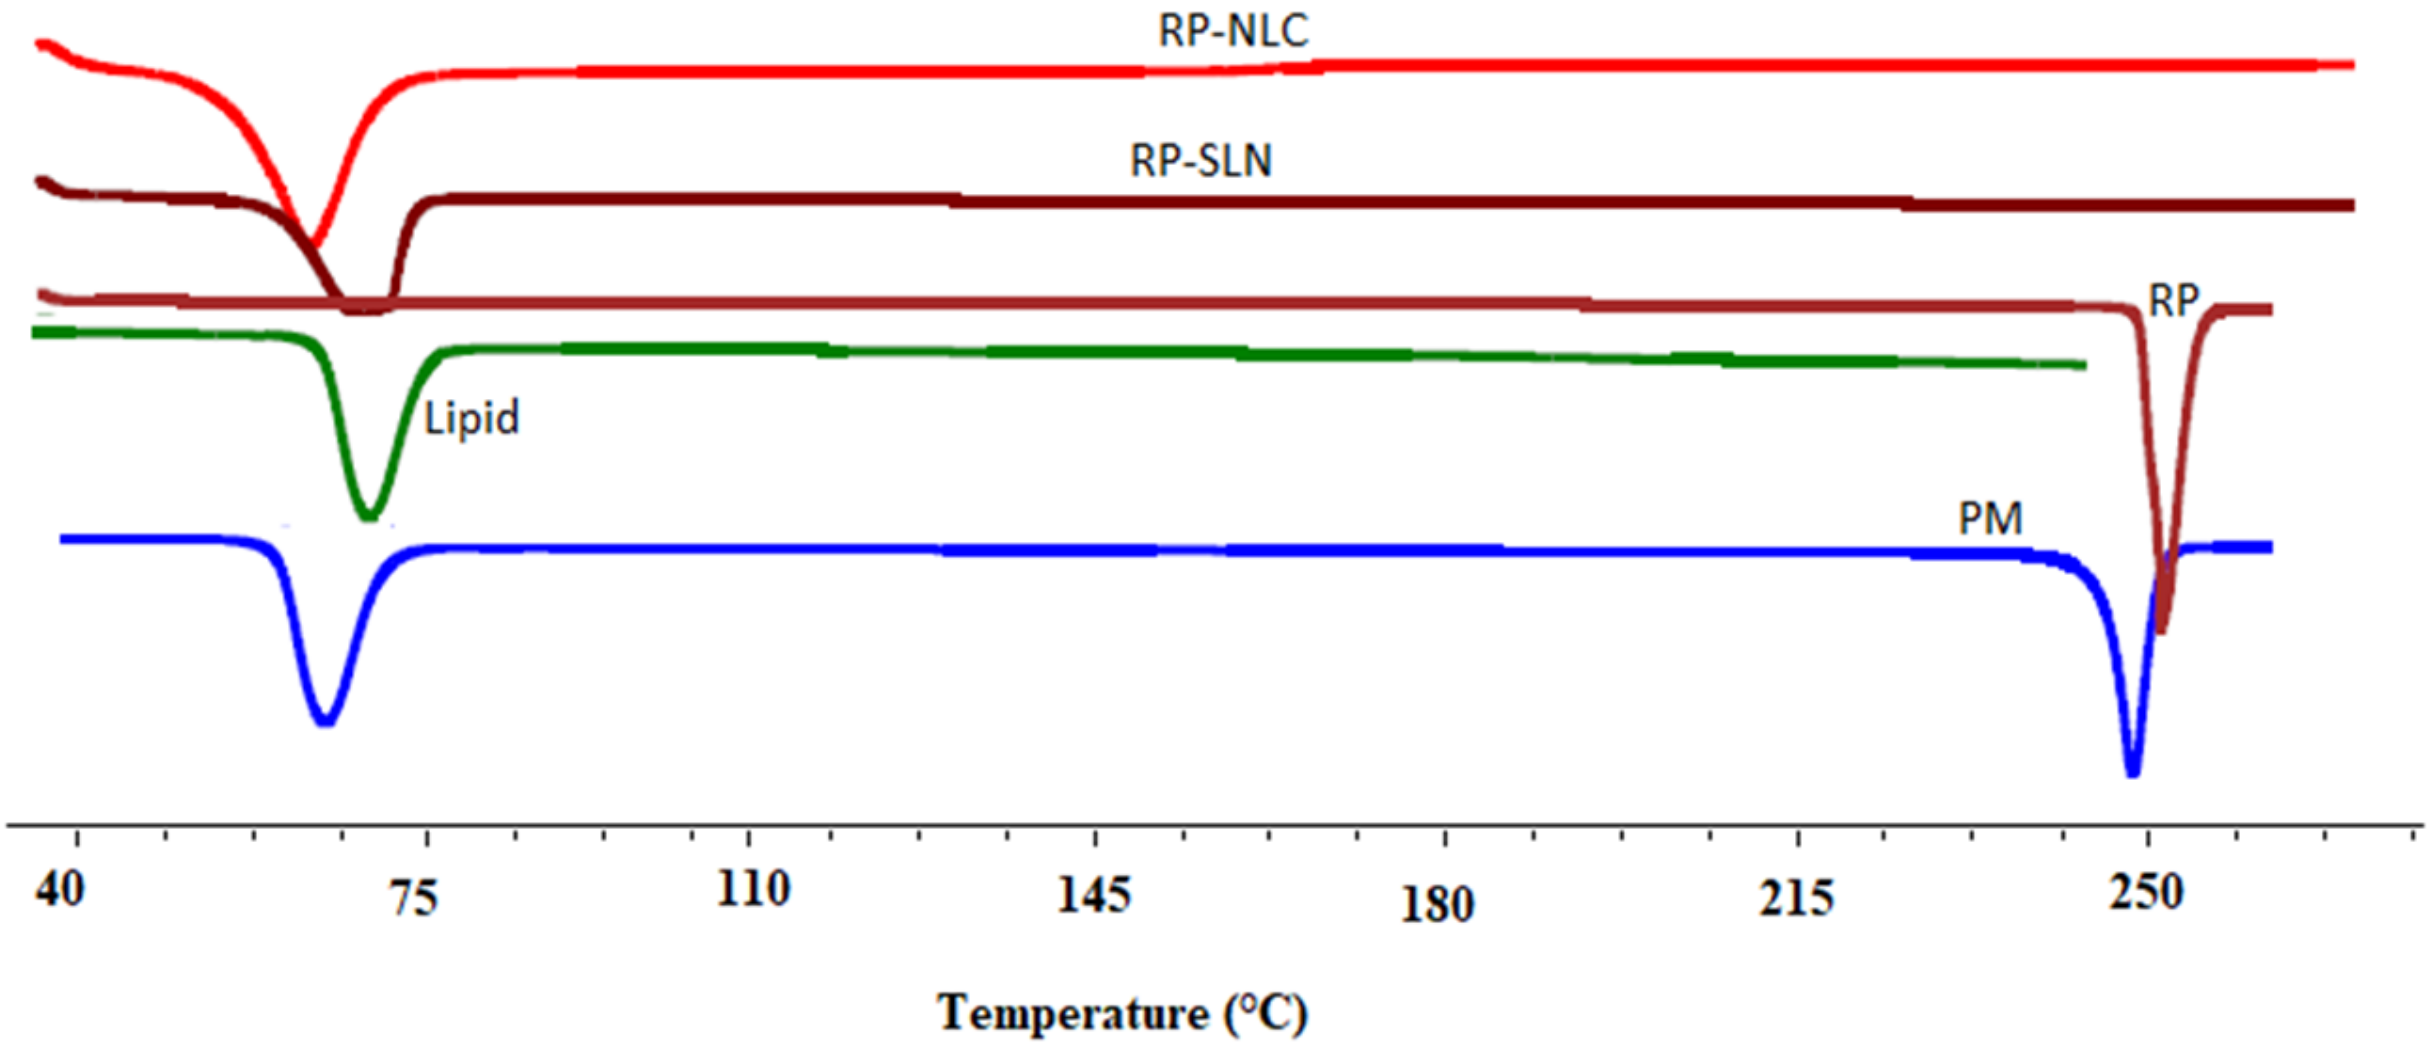
3.6.1. DSC
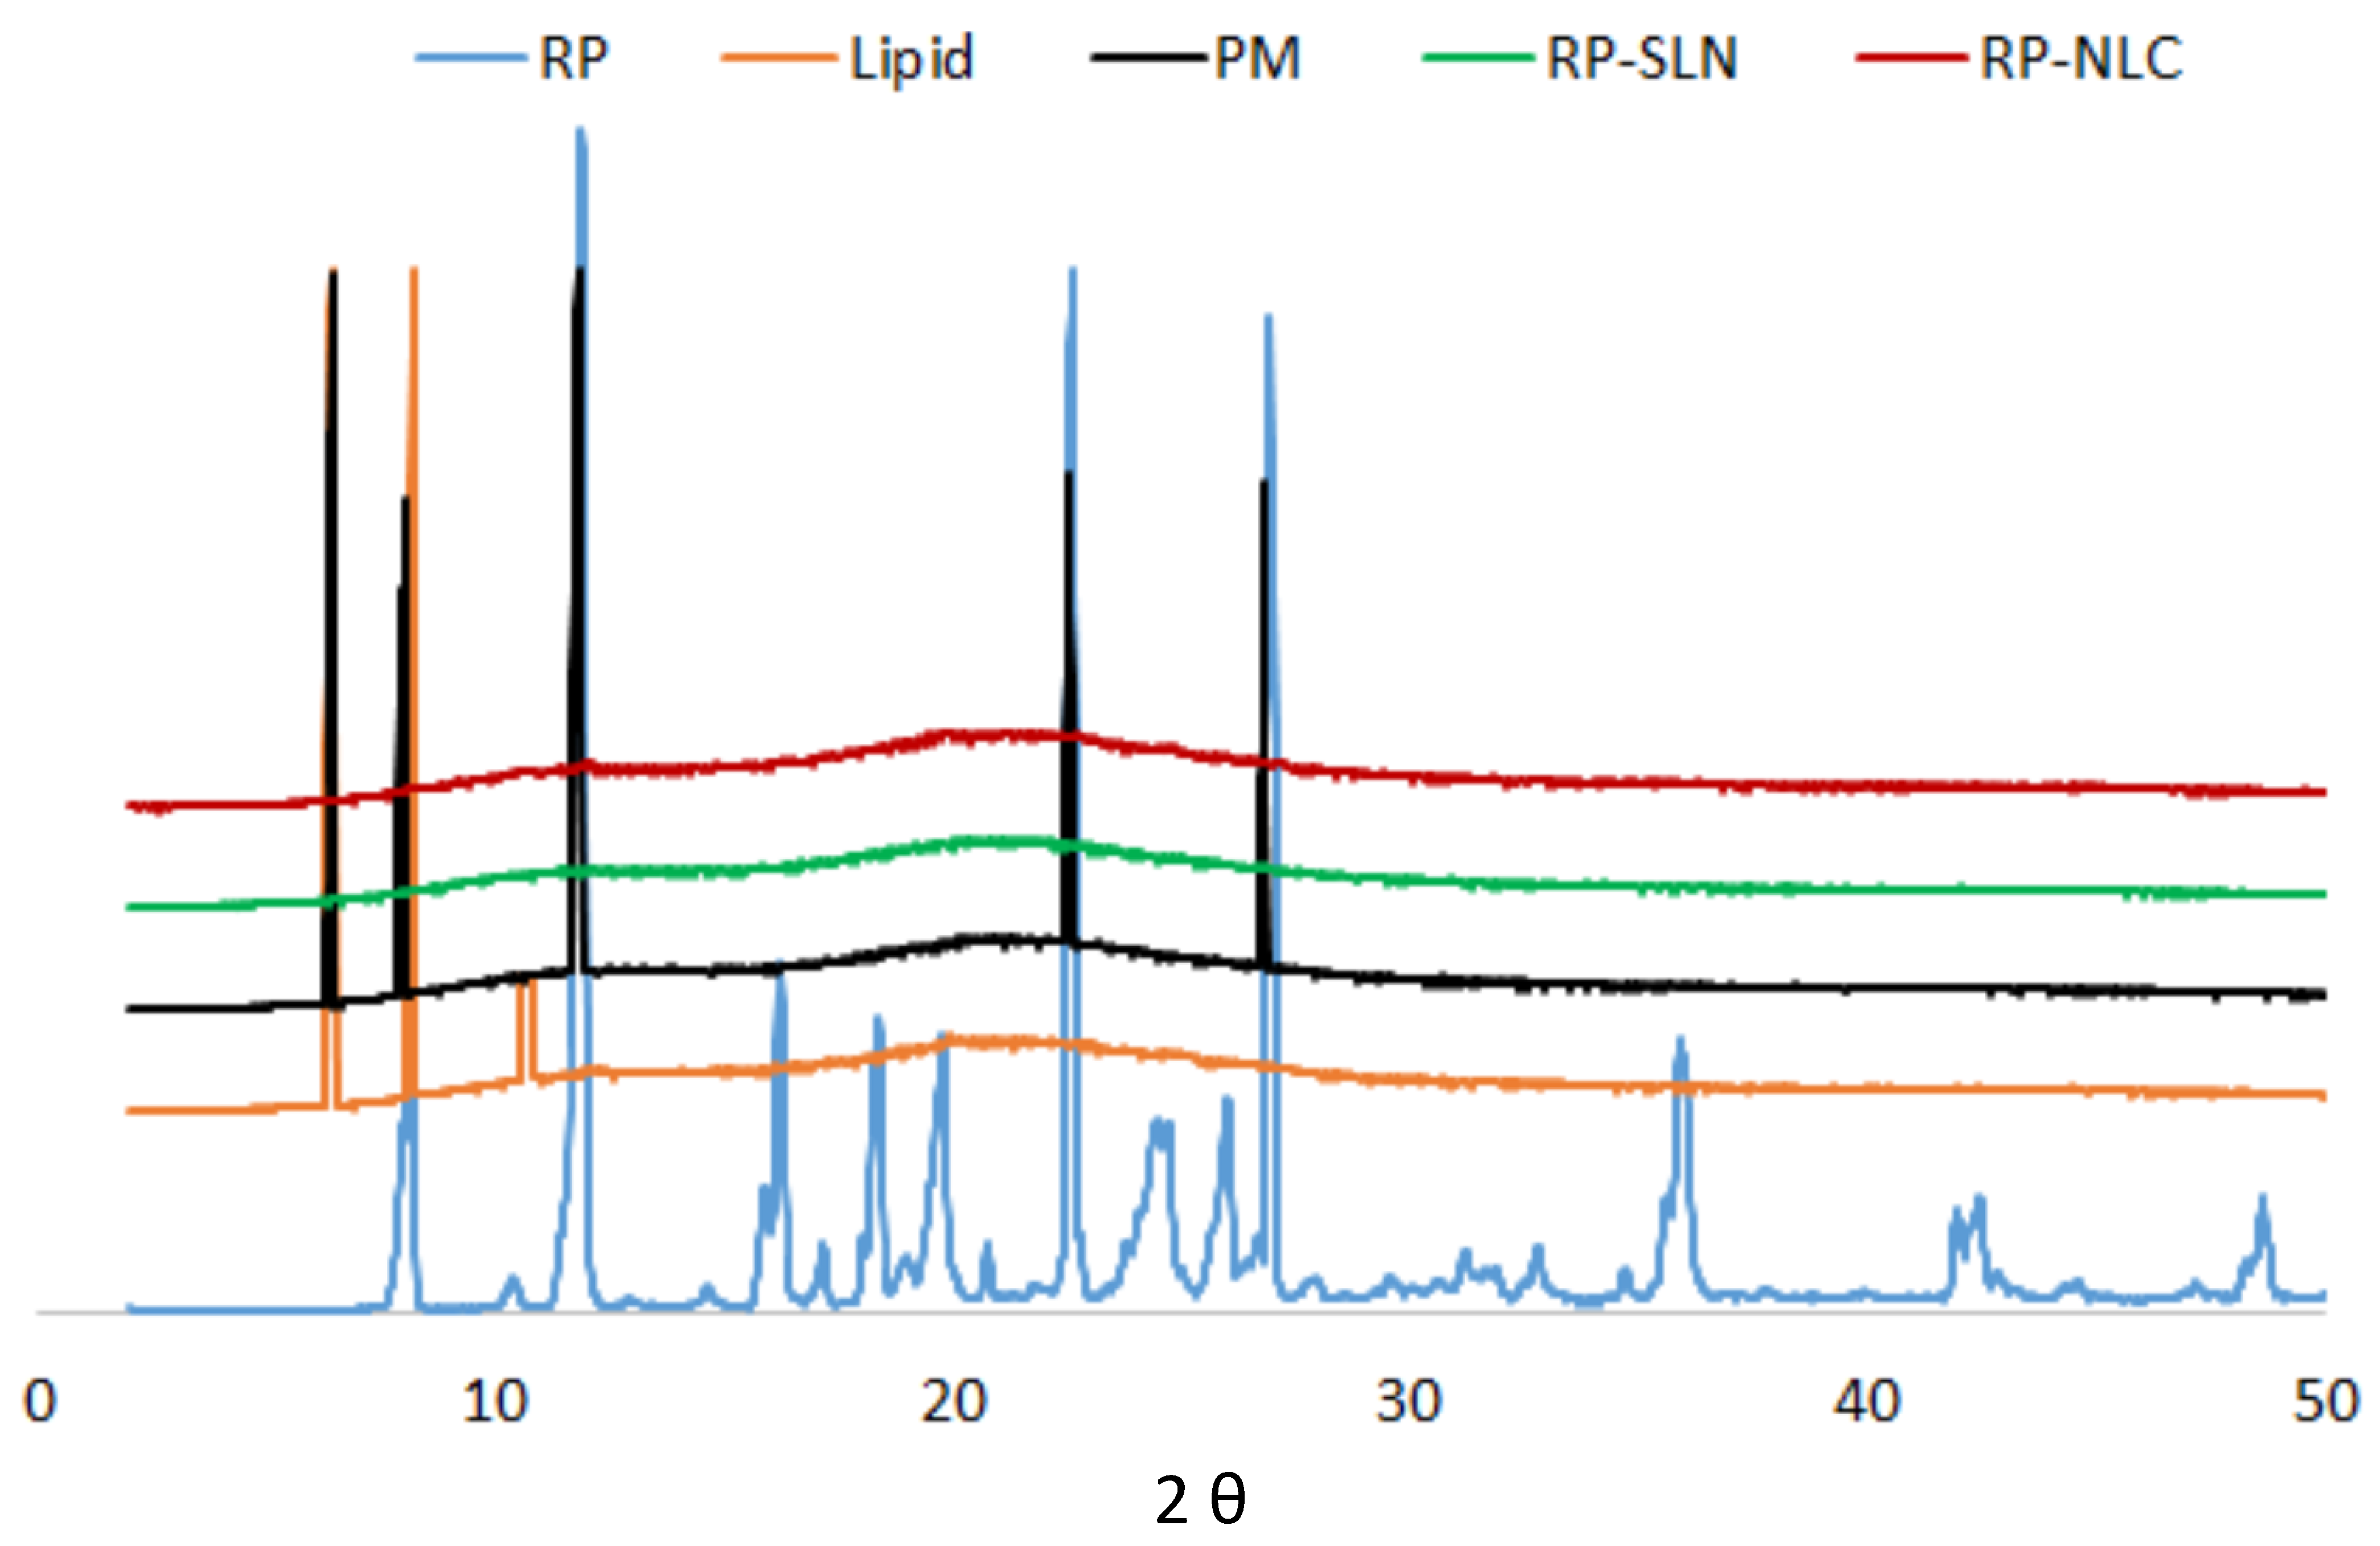
3.6.2. XRD
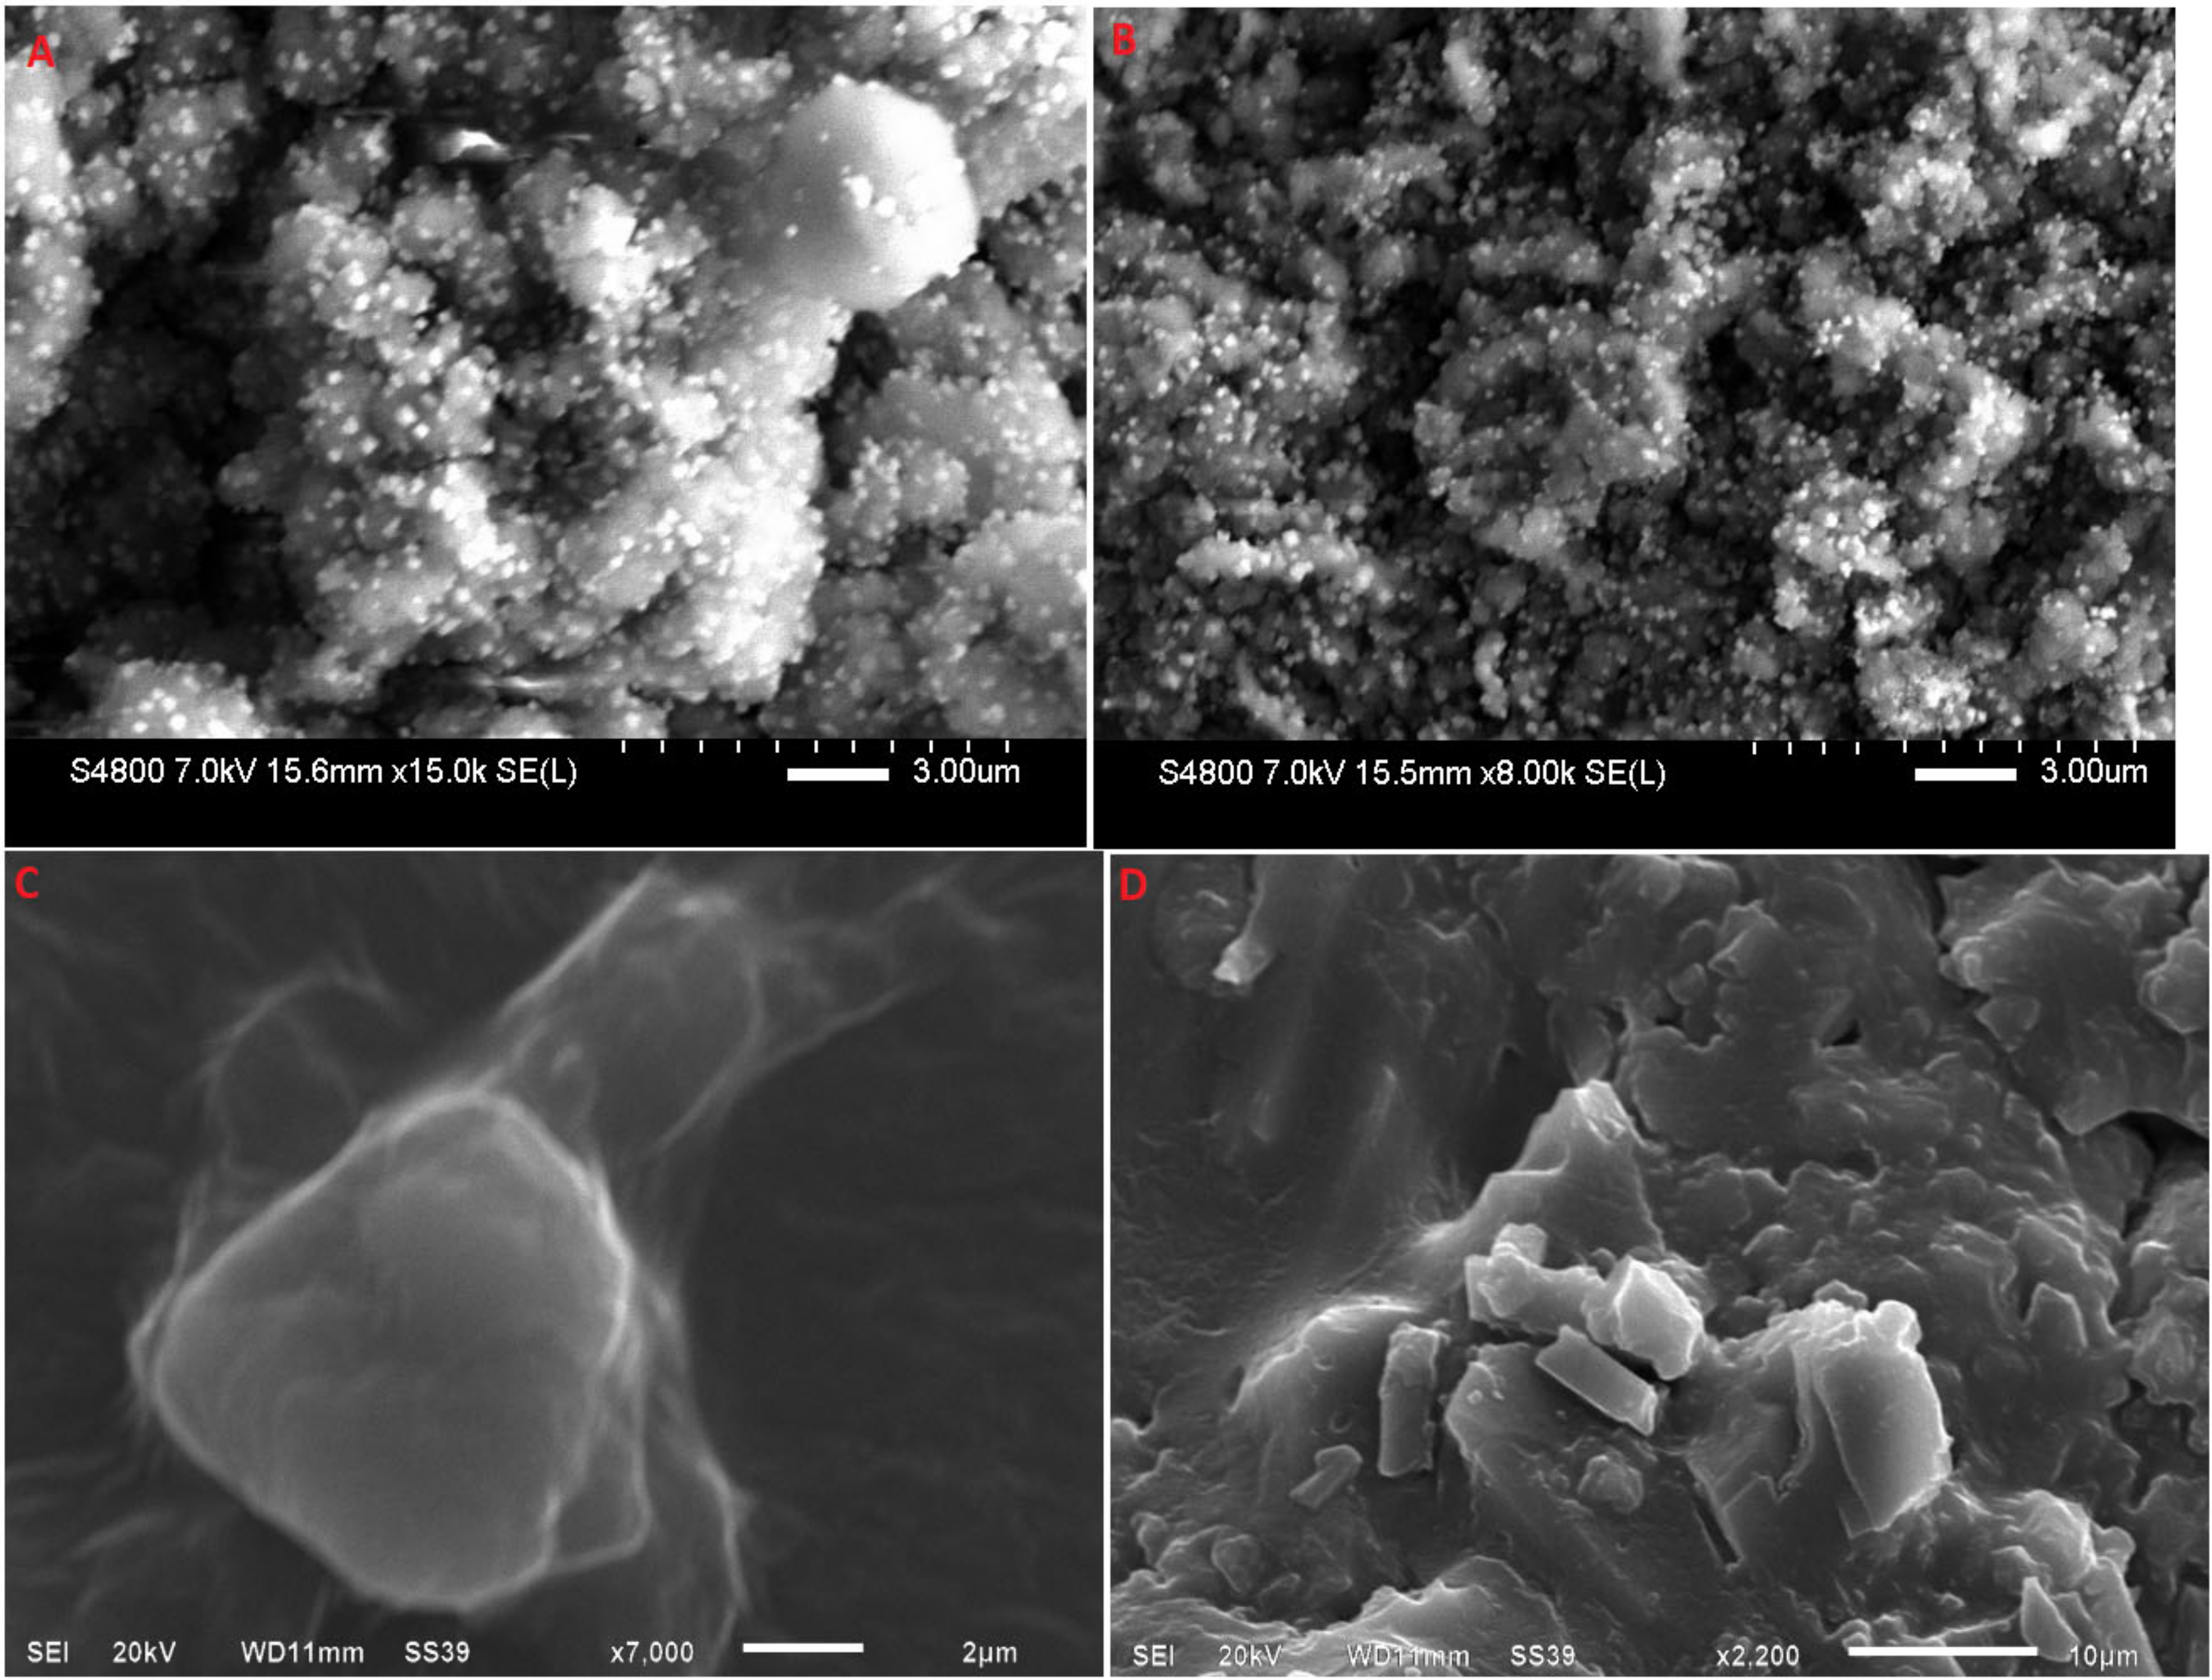
3.6.3. SEM
3.7. In Vivo Studies
3.7.1. Skin Irritation Studies
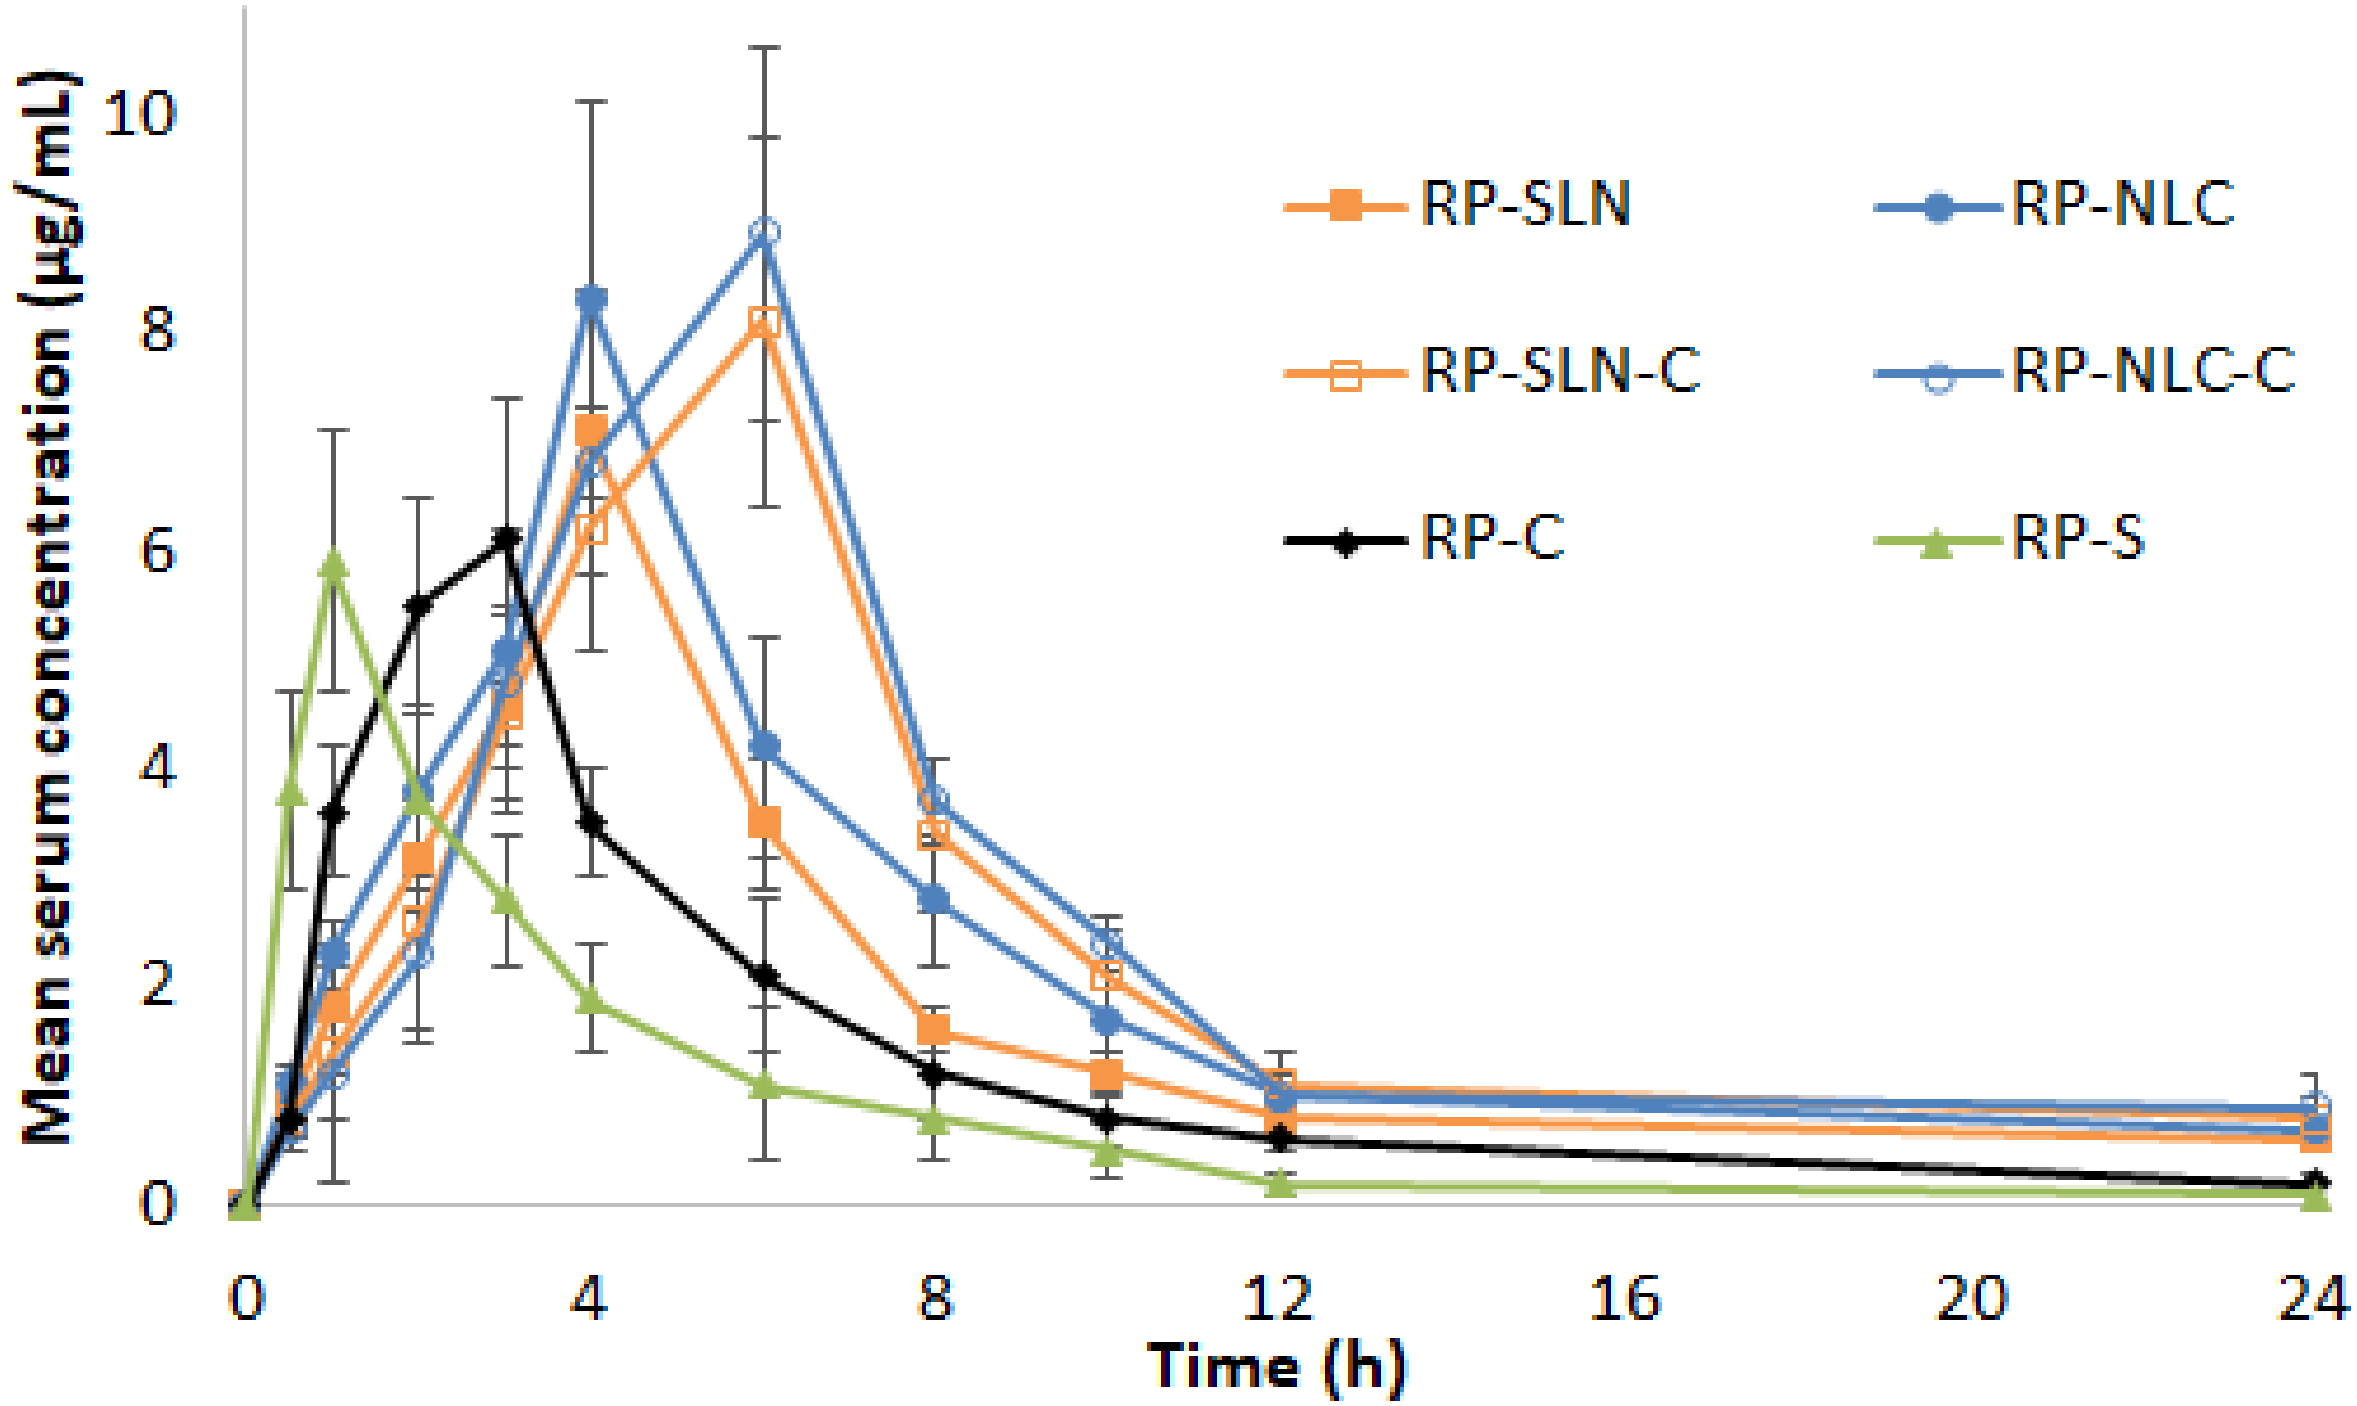
3.7.2. PK Studies
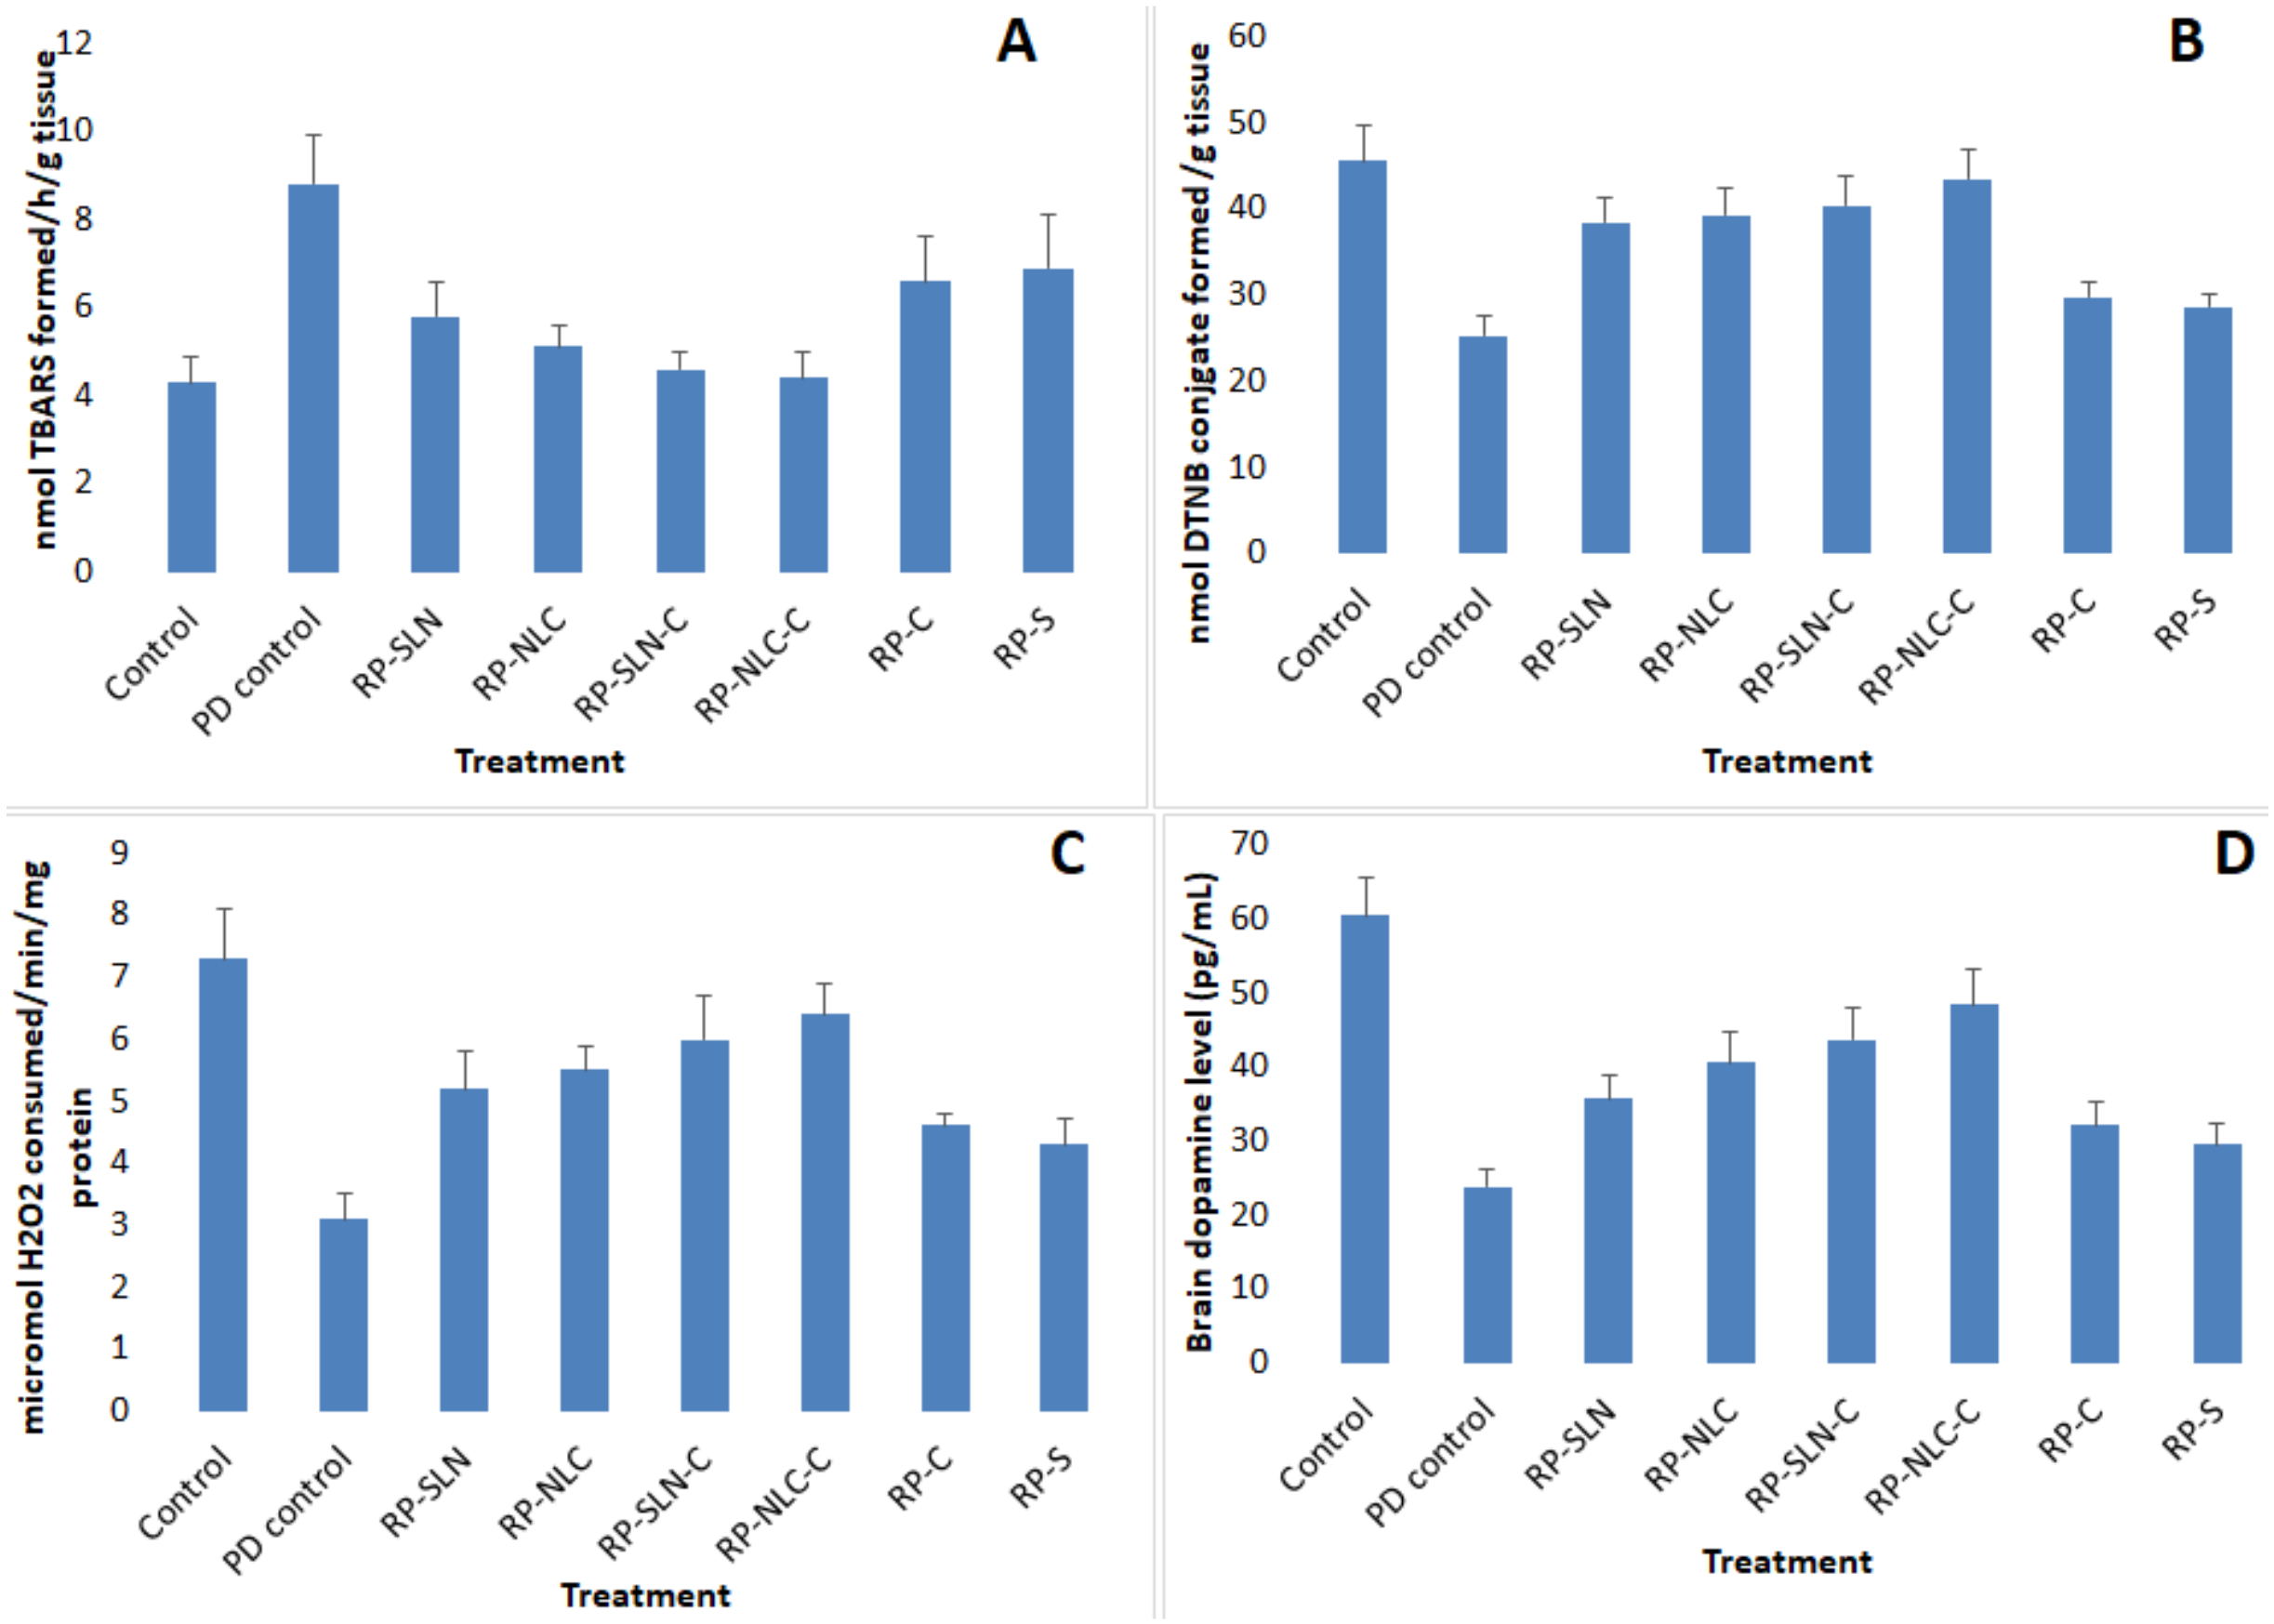
3.7.3. PCD Studies
Lipid Peroxidation Levels
GSH Levels
Catalase Activity
DA Levels
4. Conclusions
Author Contributions
Funding
Acknowledgments
Conflicts of Interest
References
- McGregor, M.M.; Nelson, A.B. Circuit Mechanisms of Parkinson’s Disease. Neuron 2019, 101, 1042–1056. [Google Scholar] [CrossRef] [PubMed]
- Kalia, L.V.; Lang, A.E. Parkinson’s disease. Lancet 2015, 386, 896–912. [Google Scholar] [CrossRef]
- De Lau, L.M.L.; Breteler, M.M.B. Epidemiology of Parkinson’s disease. Lancet Neurol. 2006, 5, 525–535. [Google Scholar] [CrossRef]
- Dauer, W.; Przedborski, S. Parkinson’s disease: Mechanisms and models. Neuron 2003, 39, 889–909. [Google Scholar] [CrossRef]
- Raza, C.; Anjum, R.; Shakeel, N.U.A. Parkinson’s disease: Mechanisms, translational models and management strategies. Life Sci. 2019, 226, 77–90. [Google Scholar] [CrossRef]
- Pahwa, R.; Lyons, K.E.; Hauser, R.A. Ropinirole therapy for Parkinson’s disease. Expert Rev. Neurother. 2004, 4, 581–588. [Google Scholar] [CrossRef]
- Shill, H.A.; Stacy, M. Update on ropinirole in the treatment of Parkinson’s disease. Neuropsychiatr. Dis. Treat. 2009, 5, 33–36. [Google Scholar]
- Matheson, A.J.; Spencer, C.M. Ropinirole. Drugs 2000, 60, 115–137. [Google Scholar] [CrossRef]
- Nashatizadeh, M.M.; Lyons, K.E.; Pahwa, R. A review of ropinirole prolonged release in Parkinson’s disease. Clin. Interv. Aging 2009, 4, 179–186. [Google Scholar]
- Prausnitz, M.R.; Mitragotri, S.; Langer, R. Current status and future potential of transdermal drug delivery. Nat. Rev. Drug Discov. 2004, 3, 115–124. [Google Scholar] [CrossRef]
- Wokovich, A.; Prodduturi, S.; Doub, W.; Hussain, A.; Buhse, L. Transdermal drug delivery system (TDDS) adhesion as a critical safety, efficacy and quality attribute. Eur. J. Pharm. Biopharm. 2006, 64, 1–8. [Google Scholar] [CrossRef] [PubMed]
- Benson, H. Transdermal Drug Delivery: Penetration Enhancement Techniques. Curr. Drug Deliv. 2005, 2, 23–33. [Google Scholar] [CrossRef] [PubMed]
- Fatima, T.; Ajjarapu, S.; Shankar, V.K.; Rangappa, S.; Shivakumar, H.N.; Biswas, S.K.; Hoque, M.; Murthy, S.N. Topical Pilocarpine Formulation for Diagnosis of Cystic Fibrosis. J. Pharm. Sci. 2020, 109, 1747–1751. [Google Scholar] [CrossRef] [PubMed]
- Maurya, A.; Rangappa, S.; Bae, J.; Dhawan, T.; Ajjarapu, S.S.; Murthy, S.N. Evaluation of soluble fentanyl microneedles for loco-regional anti-nociceptive activity. Int. J. Pharm. 2019, 564, 485–491. [Google Scholar] [CrossRef] [PubMed]
- Hua, S. Lipid-based nano-delivery systems for skin delivery of drugs and bioactives. Front. Pharmacol. 2015, 6. [Google Scholar] [CrossRef]
- Tatke, A.; Dudhipala, N.; Janga, K.Y.; Balguri, S.P.; Avula, B.; Jablonski, M.M.; Majumdar, S. In Situ Gel of Triamcinolone Acetonide-Loaded Solid Lipid Nanoparticles for Improved Topical Ocular Delivery: Tear Kinetics and Ocular Disposition Studies. Nanomaterials 2019, 9, 33. [Google Scholar] [CrossRef]
- Alam, S.; Aslam, M.; Khan, A.; Imam, S.S.; Aqil, M.; Sultana, Y.; Ali, A. Nanostructured lipid carriers of pioglitazone for transdermal application: From experimental design to bioactivity detail. Drug Deliv. 2016, 23, 601–609. [Google Scholar] [CrossRef]
- Janga, K.Y.; Tatke, A.; Dudhipala, N.; Balguri, S.P.; Ibrahim, M.M.; Maria, D.N.; Jablonski, M.M.; Majumdar, S. Gellan Gum Based Sol-to-Gel Transforming System of Natamycin Transfersomes Improves Topical Ocular Delivery. J. Pharmacol. Exp. Ther. 2019, 370, 814–822. [Google Scholar] [CrossRef]
- Shruthi, K.; Narendar, D.; Arjun, N.; Kishan, V. Development and Antimicrobial Evaluation of Binary Ethosomal Topical Gel of Terbinafine Hydrochloride for the Treatment of Onychomycosis. Int. J. Pharm. Sci. Nanotechnol. 2018, 11, 3998–4005. [Google Scholar]
- MuÈller, R.H.; MaÈder, K.; Gohla, S. Solid lipid nanoparticles (SLN) for controlled drug delivery—A review of the state of the art. Eur. J. Pharm. Biopharm. 2000, 50, 161–177. [Google Scholar] [CrossRef]
- Dudhipala, N. A Comprehensive Review on Solid Lipid Nanoparticles as Delivery Vehicle for Enhanced Pharmacokinetic and Pharmacodynamic Activity of Poorly Soluble Drugs. Int. J. Pharm. Sci. Nanotechnol. 2019, 12, 4421–4440. [Google Scholar]
- Muchow, M.; Maincent, P.; Müller, R.H. Lipid Nanoparticles with a Solid Matrix (SLN®, NLC®, LDC®) for Oral Drug Delivery. Drug Dev. Ind. Pharm. 2008, 34, 1394–1405. [Google Scholar] [CrossRef] [PubMed]
- Suvarna, G.; Narender, D.; Kishan, V. Preparation, Characterization and In Vivo Evaluation of Rosuvastatin Calcium Loaded Solid Lipid Nanoparticles. Int. J. Pharm. Sci. Nanotechnol. 2015, 8, 2779–2785. [Google Scholar]
- Dudhipala, N.; Veerabrahma, K. Candesartan cilexetil loaded solid lipid nanoparticles for oral delivery: Characterization, pharmacokinetic and pharmacodynamic evaluation. Drug Deliv. 2016, 23, 395–404. [Google Scholar] [CrossRef]
- Dudhipala, N.; Puchchakayala, G. Capecitabine lipid nanoparticles for anti-colon cancer activity in 1,2-dimethylhydrazine-induced colon cancer: Preparation, cytotoxic, pharmacokinetic, and pathological evaluation. Drug Dev. Ind. Pharm. 2018, 44, 1572–1582. [Google Scholar] [CrossRef]
- Muller, R.H.; Radtke, M.; Wissing, S.A. Solid lipid nanoparticles (SLN) and nanostructured lipid carriers (NLC) in cosmetic and dermatological preparations. Adv. Drug Deliv. Rev. 2002, 54, S131–S155. [Google Scholar] [CrossRef]
- Mei, Z.; Chen, H.; Weng, T.; Yang, Y.; Yang, X. Solid lipid nanoparticle and microemulsion for topical delivery of triptolide. Eur. J. Pharm. Biopharm. 2003, 56, 189–196. [Google Scholar] [CrossRef]
- Bhaskar, K.; Anbu, J.; Ravichandiran, V.; Venkateswarlu, V.; Rao, Y.M. Lipid nanoparticles for transdermal delivery of flurbiprofen: Formulation, in vitro, ex vivo and in vivo studies. Lipids Health Dis. 2009, 8, 6. [Google Scholar] [CrossRef]
- Azeem, A.; Talegaonkar, S.; Negi, L.M.; Ahmad, F.J.; Khar, R.K.; Iqbal, Z. Oil based nanocarrier system for transdermal delivery of ropinirole: A mechanistic, pharmacokinetic and biochemical investigation. Int. J. Pharm. 2012, 422, 436–444. [Google Scholar] [CrossRef]
- Fuster, J.; Negro, S.; Salama, A.; Fernández-Carballido, A.; Marcianes, P.; Boeva, L.; Barcia, E. HPLC-UV method development and validation for the quantification of ropinirole in new PLGA multiparticulate systems: Microspheres and nanoparticles. Int. J. Pharm. 2015, 491, 310–317. [Google Scholar] [CrossRef]
- Dudhipala, N.; Janga, K.Y.; Gorre, T. Comparative study of nisoldipine-loaded nanostructured lipid carriers and solid lipid nanoparticles for oral delivery: Preparation, characterization, permeation and pharmacokinetic evaluation. Artif. Cells Nanomed. Biotechnol. 2018, 46, 616–625. [Google Scholar] [CrossRef] [PubMed]
- Dudhipala, N.; Veerabrahma, K. Pharmacokinetic and pharmacodynamic studies of nisoldipine-loaded solid lipid nanoparticles developed by central composite design. Drug Dev. Ind. Pharm. 2015, 41, 1968–1977. [Google Scholar] [CrossRef] [PubMed]
- Gondrala, U.K.; Dudhipala, N.; Kishan, V. Preparation, Characterization and in vivo Evaluation of Felodipine Solid-Lipid Nanoparticles for Improved Oral Bioavailability. Int. J. Pharm. Sci. Nanotechnol. 2015, 8, 9. [Google Scholar]
- Dudhipala, N.; Janga, K.Y. Lipid nanoparticles of zaleplon for improved oral delivery by Box-Behnken design: Optimization, in vitro and in vivo evaluation. Drug Dev. Ind. Pharm. 2017, 43, 1205–1214. [Google Scholar] [CrossRef] [PubMed]
- Thirupathi, G.; Swetha, E.; Narendar, D. Role of Isradipine Loaded Solid Lipid Nanoparticles on the Pharmacodynamic Effect in Rats. Drug Res. 2017, 67, 163–169. [Google Scholar] [CrossRef]
- Abdellatif, A.A.H.; El-Telbany, D.F.A.; Zayed, G.; Al-Sawahli, M.M. Hydrogel Containing PEG-Coated Fluconazole Nanoparticles with Enhanced Solubility and Antifungal Activity. J. Pharm. Innov. 2019, 14, 112–122. [Google Scholar] [CrossRef]
- Mahtab, A.; Anwar, M.; Mallick, N.; Naz, Z.; Jain, G.K.; Ahmad, F.J. Transungual Delivery of Ketoconazole Nanoemulgel for the Effective Management of Onychomycosis. AAPS PharmSciTech 2016, 17, 1477–1490. [Google Scholar] [CrossRef]
- Ramasamy, T.; Khandasami, U.S.; Ruttala, H.; Shanmugam, S. Development of solid lipid nanoparticles enriched hydrogels for topical delivery of anti-fungal agent. Macromol. Res. 2012, 20, 682–692. [Google Scholar] [CrossRef]
- Nagaraj, K.; Narendar, D.; Kishan, V. Development of olmesartan medoxomil optimized nanosuspension using the Box-Behnken design to improve oral bioavailability. Drug Dev. Ind. Pharm. 2017, 43, 1186–1196. [Google Scholar] [CrossRef]
- Kakkar, S.; Pal Kaur, I. A novel nanovesicular carrier system to deliver drug topically. Pharm. Dev. Technol. 2013, 18, 673–685. [Google Scholar] [CrossRef]
- Abioye, A.O.; Issah, S.; Kola-Mustapha, A.T. Ex vivo skin permeation and retention studies on chitosan-Ibuprofen-gellan ternary nanogel prepared by in situ ionic gelation technique—A tool for controlled transdermal delivery of ibuprofen. Int. J. Pharm. 2015, 490, 112–130. [Google Scholar] [CrossRef] [PubMed]
- Arun, B.; Narendar, D.; Kishan, V. Development of Olmesartan Medoxomil Lipid-Based Nanoparticles and Nanosuspension: Preparation, Characterization and Comparative Pharmacokinetic Evaluation. Artif. Cells Nanomed. Biotechnol. 2018, 46, 126–137. [Google Scholar]
- Tirumales, H.C.; Suram, D.; Dudhipala, N.; Banala, N. Enhanced pharmacokinetic activity of Zotepine via nanostructured lipid carrier system in Wistar rats for oral application. Pharm. Nanotechnol. 2020. [Google Scholar] [CrossRef] [PubMed]
- Ghosh, M. Fundamentals of Experimental Pharmacology. Indian J. Pharmacol. 2007, 39, 216. [Google Scholar]
- Luzardo-Alvarez, A.; Delgado-Charro, M.B.; Blanco-Méndez, J. In vivo iontophoretic administration of ropinirole hydrochloride. J. Pharm. Sci. 2003, 92, 2441–2448. [Google Scholar] [CrossRef] [PubMed]
- Yu, A.; Guo, C.; Zhou, Y.; Cao, F.; Zhu, W.; Sun, M.; Zhai, G. Skin irritation and the inhibition effect on HSV-1 in vivo of penciclovir-loaded microemulsion. Int. Immunopharmacol. 2010, 10, 1305–1309. [Google Scholar] [CrossRef]
- Mohajjel Nayebi, A.A.; Sheidaei, H. Buspirone improves haloperidol-induced parkinson disease in mice through 5-HT1a receptors. Daru 2010, 18, 41–45. [Google Scholar]
- Utley, H.G.; Bernheim, F.; Hochstein, P. Effect of sulfhydryl reagents on peroxidation in microsomes. Arch. Biochem. Biophys. 1967, 118, 29–32. [Google Scholar] [CrossRef]
- Handbook Methods For Oxygen Radical Research. Available online: https://www.routledge.com/Handbook-Methods-For-Oxygen-Radical-Research-1st-Edition/Greenwald/p/book/9781315893822 (accessed on 20 April 2020).
- Müller, R.H.; Alexiev, U.; Sinambela, P.; Keck, C.M. Nanostructured Lipid Carriers (NLC): The Second Generation of Solid Lipid Nanoparticles. Percutaneous Penetration Enhanc. Chem. Methods Penetration Enhanc. 2016, 161–185. [Google Scholar] [CrossRef]
- Desfrançois, C.; Auzély, R.; Texier, I. Lipid Nanoparticles and Their Hydrogel Composites for Drug Delivery: A Review. Pharmaceuticals 2018, 11, 118. [Google Scholar] [CrossRef]
- Pitta, S.; Dudhipala, N.; Narala, A.; Veerabrahma, K. Development and evaluation of zolmitriptan transfersomes by Box-Behnken design for improved bioavailability by nasal delivery. Drug Dev. Ind. Pharm. 2018, 44, 484–492. [Google Scholar] [CrossRef]
- Dudhipala, N.; Veerabrahma, K. Improved anti-hyperlipidemic activity of Rosuvastatin Calcium via lipid nanoparticles: Pharmacokinetic and pharmacodynamic evaluation. Eur. J. Pharm. Biopharm. 2017, 110, 47–57. [Google Scholar] [CrossRef]
- Pardeshi, C.V.; Belgamwar, V.S. Ropinirole-dextran sulfate nanoplex for nasal administration against Parkinson’s disease: In silico molecular modeling and in vitro—Ex vivo evaluation. Artif. Cells Nanomed. Biotechnol. 2017, 45, 635–648. [Google Scholar] [CrossRef] [PubMed]
- Sandeep, V.; Narendar, D.; Arjun, N.; Kishan, V. Lacidipine Loaded Solid Lipid Nanoparticles for Oral Delivery: Preparation, Characterization and In vivo Evaluation. Int. J. Pharm. Sci. Nanotechnol. 2016, 9, 3524–3530. [Google Scholar]
- Ravi, P.R.; Aditya, N.; Kathuria, H.; Malekar, S.; Vats, R. Lipid nanoparticles for oral delivery of raloxifene: Optimization, stability, in vivo evaluation and uptake mechanism. Eur. J. Pharm. Biopharm. 2014, 87, 114–124. [Google Scholar] [CrossRef]
- Garcês, A.; Amaral, M.H.; Sousa Lobo, J.M.; Silva, A.C. Formulations based on solid lipid nanoparticles (SLN) and nanostructured lipid carriers (NLC) for cutaneous use: A review. Eur. J. Pharm. Sci. 2018, 112, 159–167. [Google Scholar] [CrossRef]
- Pardeike, J.; Hommoss, A.; Müller, R.H. Lipid nanoparticles (SLN, NLC) in cosmetic and pharmaceutical dermal products. Int. J. Pharm. 2009, 366, 170–184. [Google Scholar] [CrossRef] [PubMed]


| Ingredients (% w/v) | RP-SLN | RP-NLC | RP-SLN-C | RP-NLC-C | RP-C | RP-S |
|---|---|---|---|---|---|---|
| RP | 0.2 | 0.2 | 0.2 | 0.2 | 0.2 | 0.2 |
| Dynasan-114 | 2.0 | 1.25 | 2.0 | 1.25 | - | - |
| Caproyl 90 | - | 0.75 | - | 0.75 | - | - |
| Soylecithin | 1.5 | 1.5 | 1.5 | 1.5 | - | - |
| Poloxamer 188 | 1 | 1 | 1 | 1 | - | - |
| Cabopol 934 | - | - | 1 | 1 | 1 | - |
| Tween 20 | - | - | - | - | - | 1 |
| Water (mL) | 10 | 10 | 10 | 10 | 10 | 10 |
| Formulation | Size | PDI | ZP (mV) | Assay (%) | Drug Loading (DL) (%) | Entrapment Efficiency (EE) (%) |
|---|---|---|---|---|---|---|
| RP-SLN | 210.6 ± 3.6 | 0.21 ± 0.06 | −28.4 ± 0.9 | 97.5 ± 1.3 | 7.7 ± 0.5 | 76.8 ± 2.7 |
| RP-NLC | 193.2 ± 2.1 | 0.18 ± 0.03 | −30.5 ± 1.5 | 98.3 ± 2.0 | 8.4 ± 0.3 | 84.1 ± 2.3 |
| Parameter | Formulation | |
|---|---|---|
| RP-SLN-C | RP-NLC-C | |
| pH | 6.6 ± 0.3 | 6.5 ± 0.4 |
| Viscosity (cP) | 2678 ± 64.6 | 2352 ± 77.1 |
| Drug content | 98.2 ± 2.1 | 99.6 ± 2.4 |
| Spreadability (g cm/sec) | 6.3 ± 0.5 | 6.1 ± 0.2 |
| Extrudability (g/cm2) | 1.4 ± 0.3 | 1.2 ± 0.2 |
| Formulation | Regression Coefficient (r2) | ||||
|---|---|---|---|---|---|
| In Vitro Release | |||||
| Zero Order | First Order | Higuchi | Korsemeyer-Peppas | ||
| R2 | n Value | ||||
| RP-SLN | 0.974 | 0.957 | 0.960 | 0.985 | 0.559 |
| RP-NLC | 0.963 | 0.936 | 0.970 | 0.988 | 0.540 |
| RP-SLN-C | 0.977 | 0.984 | 0.964 | 0.993 | 0.610 |
| RP-NLC-C | 0.966 | 0.974 | 0.972 | 0.989 | 0.546 |
| Ex Vivo Permeation | |||||
| RP-SLN | 0.980 | 0.970 | 0.949 | 0.995 | 0.686 |
| RP-NLC | 0.968 | 0.985 | 0.979 | 0.999 | 0.668 |
| RP-SLN-C | 0.988 | 0.990 | 0.947 | 0.994 | 0.706 |
| RP-NLC-C | 0.977 | 0.987 | 0.958 | 0.993 | 0.661 |
| Formulation | Amount Permeated (µg/cm2) | Percentage Drug Permeation at End of 24 h | Flux (µg/cm2/h) | Permeability (Percent/cm2/h) |
|---|---|---|---|---|
| RP-SLN | 739.2 ± 34.1 * | 73.9 ± 3.1 * | 29.0 * | 2.9 * |
| RP-NLC | 820.7 ± 57.2 * | 82.0 ± 2.9 * | 32.8 * | 3.2 * |
| RP-SLN-C | 561.5 ± 28.9 * | 56.1 ± 3.6 * | 22.4 * | 2.2 * |
| RP-NLC-C | 603.2 ± 41.7 * | 60.3 ± 4.2 * | 23.9 * | 2.3 * |
| RP-C | 296.2 ± 23.5 | 29.6 ± 3.2 | 12.9 | 1.2 |
| Formulation | Time (Days) | Size (nm) | PDI | ZP (mV) | Assay (%) | EE (%) |
|---|---|---|---|---|---|---|
| 4 °C | ||||||
| RP-SLN | 1 | 211.5 ± 2.8 | 0.22 ± 0.04 | −29.6 ± 1.2 | 98.0 ± 1.7 | 77.5 ± 2.1 |
| 90 | 220.7 ± 4.7 | 0.23 ± 0.03 | −26.8 ± 1.5 | 95.8 ± 2.4 | 74.7 ± 3.2 | |
| RP-NLC | 1 | 192.7 ± 2.7 | 0.17 ± 0.04 | −31.6 ± 1.8 | 99.3 ± 2.2 | 85.6 ± 1.9 |
| 90 | 206.4 ± 3.6 | 0.19 ± 0.05 | −28.4 ± 1.6 | 96.9 ± 2.4 | 82.4 ± 2.6 | |
| 25 °C | ||||||
| RP-SLN | 1 | 211.5 ± 2.8 | 0.22 ± 0.04 | −29.6 ± 1.2 | 98.0 ± 1.7 | 77.5 ± 2.1 |
| 90 | 227.8 ± 3.5 | 0.24 ± 0.08 | −25.2 ± 1.3 | 94.1 ± 3.0 | 73.4 ± 2.4 | |
| RP-NLC | 1 | 192.7 ± 2.7 | 0.17 ± 0.04 | −31.6 ± 1.8 | 99.3 ± 2.2 | 85.6 ± 1.9 |
| 90 | 210.6 ± 5.3 | 0.19 ± 0.04 | −27.2 ± 2.7 | 95.8 ± 1.7 | 81.6 ± 3.1 | |
| Parameter | RP-SLN-C | |||
|---|---|---|---|---|
| 4 °C | 25 °C | |||
| Day 1 | Day 90 | Day 1 | Day 90 | |
| pH | 6.5 ± 0.4 | 6.4 ± 0.5 | 6.5 ± 0.4 | 6.2 ± 0.3 |
| Viscosity (cP) | 2688 ± 72.5 | 2703 ± 83.7 | 2688 ± 72.5 | 2734 ± 69.8 |
| Drug content (%) | 97.9 ± 1.8 | 96.2 ± 3.6 | 97.9 ± 1.8 | 95.8 ± 3.1 |
| Spreadability (g cm/s) | 6.4 ± 0.4 | 6.2 ± 0.3 | 6.4 ± 0.4 | 6.1 ± 0.6 |
| Extrudability (g/cm2) | 1.5 ± 0.4 | 1.3 ± 0.2 | 1.5 ± 0.4 | 1.6 ± 0.2 |
| RP-NLC-C | ||||
| pH | 6.5 ± 0.4 | 6.3 ± 0.3 | 6.5 ± 0.4 | 6.1 ± 0.3 |
| Viscosity (cP) | 2372 ± 69.0 | 2389 ± 80.5 | 2372 ± 69.0 | 2422 ± 66.8 |
| Drug content (%) | 99.1± 2.5 | 97.2 ± 2.1 | 99.1± 2.5 | 96.1 ± 3.6 |
| Spreadability (g cm/s) | 6.2 ± 0.3 | 6.3 ± 0.4 | 6.2 ± 0.3 | 6.2 ± 0.5 |
| Extrudability (g/cm2) | 1.3 ± 0.1 | 1.2 ± 0.4 | 1.3 ± 0.1 | 1.4 ± 0.3 |
| Parameter | RP-SLN | RP-NLC | ||
|---|---|---|---|---|
| Pre-Lyophilization | Post-Lyophilization | Pre-Lyophilization | Post-Lyophilization | |
| Size (nm) | 224.5 ± 4.2 | 479.7 ± 8.8 | 205.4 ± 3.1 | 434.6 ± 2.8 |
| PDI | 0.22 ± 0.05 | 0.35 ± 0.08 | 0.21 ± 0.04 | 0.33 ± 0.05 |
| ZP (mV) | −29.3 ± 1.2 | −28.3 ± 2.4 | −31.7 ± 2.4 | −29.6 ± 0.6 |
| Assay (%) | 98.2 ± 1.7 | 96.4 ± 2.1 | 99.3 ± 3.1 | 98.4 ± 1.4 |
| EE (%) | 77.5 ± 1.9 | 75.2 ± 1.5 | 83.5 ± 3.4 | 83.6 ± 1.8 |
| Group | Erythema | Edema | ||
|---|---|---|---|---|
| 24 | 48 | 24 | 48 | |
| I (negative control) | 0 | 0 | 0 | 0 |
| II (RP-C) | 0 | 1 | 0 | 1 |
| III (RP-SLN-C) | 0 | 0 | 0 | 0 |
| IV (RP-NLC-C) | 0 | 0 | 0 | 0 |
| V (Formalin) | 2 | 3 | 3 | 3 |
| Parameter | RP-SLN | RP-NLC | RP-SLN-C | RP-NLC-C | RP-C | RP-S |
|---|---|---|---|---|---|---|
| Cmax (µg/mL) | 7.1 ± 0.9 * | 8.3 ± 0.7 * | 8.1 ± 1.7 # | 8.9 ± 1.4 # | 6.1 ± 1.3 | 5.9 ± 1.2 |
| tmax (h) | 4.0 ± 0.0 * | 4.0 ± 0.0 * | 6 ± 0.0 # | 6 ± 0.0 # | 3 ± 0 @ | 1 ± 0 |
| AUCtot (µg/mL·h) | 49.8 ± 5.8 * | 62.7 ± 4.2 * | 69.8 ± 5.6 #, $ | 76.8 ± 4.8 #, $ | 34.8 ± 2.9 @ | 22. 8 ± 2.4 |
| thalf (h) | 10.1 ± 1.6 * | 10.3 ± 1.0 * | 10.4 ± 1.6 # | 11.6 ± 0.9 # | 7.1 ± 1.3 | 6.7 ± 1.1 |
| MRT (h) | 12.9 ± 1.3 * | 13.2 ± 1.7 * | 14 ± 2 # | 15.3 ± 2.5 # | 7.6 ± 1.1 | 5.5 ± 0.9 |
© 2020 by the authors. Licensee MDPI, Basel, Switzerland. This article is an open access article distributed under the terms and conditions of the Creative Commons Attribution (CC BY) license (http://creativecommons.org/licenses/by/4.0/).
Share and Cite
Dudhipala, N.; Gorre, T. Neuroprotective Effect of Ropinirole Lipid Nanoparticles Enriched Hydrogel for Parkinson’s Disease: In Vitro, Ex Vivo, Pharmacokinetic and Pharmacodynamic Evaluation. Pharmaceutics 2020, 12, 448. https://doi.org/10.3390/pharmaceutics12050448
Dudhipala N, Gorre T. Neuroprotective Effect of Ropinirole Lipid Nanoparticles Enriched Hydrogel for Parkinson’s Disease: In Vitro, Ex Vivo, Pharmacokinetic and Pharmacodynamic Evaluation. Pharmaceutics. 2020; 12(5):448. https://doi.org/10.3390/pharmaceutics12050448
Chicago/Turabian StyleDudhipala, Narendar, and Thirupathi Gorre. 2020. "Neuroprotective Effect of Ropinirole Lipid Nanoparticles Enriched Hydrogel for Parkinson’s Disease: In Vitro, Ex Vivo, Pharmacokinetic and Pharmacodynamic Evaluation" Pharmaceutics 12, no. 5: 448. https://doi.org/10.3390/pharmaceutics12050448
APA StyleDudhipala, N., & Gorre, T. (2020). Neuroprotective Effect of Ropinirole Lipid Nanoparticles Enriched Hydrogel for Parkinson’s Disease: In Vitro, Ex Vivo, Pharmacokinetic and Pharmacodynamic Evaluation. Pharmaceutics, 12(5), 448. https://doi.org/10.3390/pharmaceutics12050448