Abstract
Hepatitis C virus (HCV) eradication is usually associated with dyslipidemia. Most studies in this field have focused on genotype-specific direct-acting antivirals (DAAs), with research on pangenotypic DAAs being limited. This study examined how two pangenotypic DAA regimens, glecaprevir/pibrentasvir (GLE/PIB) and sofosbuvir/velpatasvir (SOF/VEL), affect lipid profiles and insulin resistance after viral eradication in chronic HCV patients. A total of 100 patients (57 with GLE/PIB and 43 with SOF/VEL) treated between September 2020 and January 2022 were included in the retrospective analysis. This study found a significant increase in LDL and TC levels after treatment (p < 0.001), but no significant changes in triglycerides, high-density lipoprotein, HbA1C, or the Homeostatic Model Assessment of Insulin Resistance. According to a logistic regression analysis, higher baseline LDL or TC and lower baseline glucose are predictors of the degree of increase in LDL or TC following a sustained virological response. Both pangenotypic DAA regimens significantly impact lipid profiles, particularly LDL and TC, but not insulin resistance. This study emphasizes the need for more research into the long-term metabolic effects of DAAs.
1. Introduction
Hepatitis C virus (HCV) infection can cause chronic hepatitis, cirrhosis, and hepatocellular carcinoma (HCC), affecting approximately 50 million people worldwide. This infection is a major public health concern, putting a heavy disease burden on both individuals and healthcare systems [1]. HCV infection is frequently asymptomatic and progresses to a chronic condition in most patients, with diagnosis usually occurring only after the disease has advanced to more severe stages of fibrosis.
The treatment of chronic HCV infection has dramatically improved with the introduction of new direct-acting antivirals (DAAs). These DAAs have higher efficacy across all genotypes and fewer side effects than previous interferon (IFN)-based therapies. While HCV eradication significantly reduces the risk of cirrhosis and HCC, patients with advanced liver fibrosis or cirrhosis must continue to undergo regular HCC screenings even after achieving a sustained virologic response (SVR) [2,3].
Several studies have found that HCV infection causes metabolic changes such as insulin resistance (IR), metabolic syndrome, and diabetes via complex pathways [4,5]. Chronic HCV infections have been linked to hepatic steatosis and dyslipidemia [6]. According to research, eradicating HCV can improve fasting glucose, HbA1C, and IR [7]. Furthermore, studies have reported varying effects on lipid profiles: some found a decrease in total cholesterol (TC) and low-density lipoprotein (LDL) levels with an increase in triglycerides (TG) during treatment, while others found an increase in LDL and TC levels post treatment but no significant changes in TG levels [8].
Most studies exploring the effect of lipid homeostasis and IR following viral eradication have focused on genotype-specific DAAs, particularly between subgroups treated with sofosbuvir (SOF)-based versus non-SOF-based DAAs [9,10]. However, limited research has investigated the impact of lipid profiles after treatment with new pangenotypic DAAs. This study aimed to evaluate the impact of viral eradication on lipid levels and IR in HCV patients after receiving pangenotypic DAA antiviral therapy.
2. Materials and Methods
We retrospectively included patients with chronic HCV infection who received DAA therapy between September 2020 and January 2022 at Changhua Christian Hospital in Taiwan. All patients had routine outpatient follow-ups during the treatment and none were discontinued due to adverse events. Exclusion criteria included the following: (1) patients who did not complete the lipid profile or had insufficient clinical data before and after DAA therapy; and (2) incomplete DAA therapy or a lack of sustained virological response 12 weeks after treatment. The DAA regimens consisted of glecaprevir/pibrentasvir (GLE/PIB) and sofosbuvir/velpatasvir (SOF/VEL). (Figure 1).
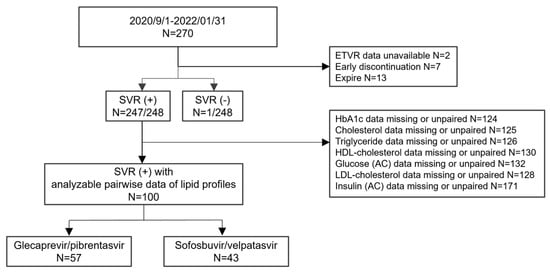
Figure 1.
The flowchart of participants included and excluded from the study.
Lipid profiles measured TC, LDL, and TG. HCV genotyping was performed on all patients. A complete blood count was taken, liver function tests were conducted, and HCV RNA levels were measured before and 12 weeks after treatment. The current study was authorized by the institutional review board (IRB No. 231011), and informed consent was waived due to the anonymization of all data.
Liver elastography, steatosis, lipid profile, fasting glucose, and insulin levels were measured before and 12 weeks after DAA therapy. The degree of liver fibrosis was determined using FibroScan® 530 compact (Echosens, Franceand) and the FIB-4 index, which was calculated from indirect serum markers. Advanced fibrosis was defined as an FIB-4 score above 3.25 [11]. Liver stiffness and steatosis were determined via transient elastography, with a measurement range of 2.5 kPa to 75 kPa, and the controlled attenuation parameter (CAP), which ranges from 100 to 400 decibels per meter (dB/m), with the FibroScan® compact 530 (Echosens, Paris, France). Insulin resistance was assessed using the Homeostatic Model Assessment of Insulin Resistance (HOMA-IR), which is calculated as (fasting glucose level × fasting serum insulin level)/405 [12]. The percentage change in LDL and TC was calculated by subtracting the pretreatment value from the post-treatment value and dividing by the pretreatment value.
Statistical Analysis
Demographic and other clinical data for continuous variables are given as mean ± standard deviation, while categorical variables are given as numbers and percentages. Baseline data comparisons between the GLE/PIB and SOF/VEL groups were made using the Chi-square test or Fisher’s exact test for categorical variables, and Student’s t-test for continuous variables. The paired samples t-test was used to compare the mean values of continuous data at two different time points: baseline (T0) and 12 weeks after the completion of DAA therapy (SVR). Pearson’s correlation coefficient was used for correlation analysis. Logistic regression models were used in both univariate and multivariate analyses. Factors that were significantly associated in univariate analyses were included in the multivariate model through backward elimination. All statistical analyses were carried out using PASW Statistics version 18 (formerly SPSS; IBM, Hong Kong). A p-value below 0.05 was deemed statistically significant.
3. Results
3.1. Baseline Characteristics of Total and Subgroup Patients
Our study included 100 patients: 57 treated with GLE/PIB and 43 treated with SOF/VEL. Table 1 shows the baseline characteristics in detail. Of the 100 patients, 50 (50%) were male, with an average age of 58.6 ± 12.7 years. The majority of patients (49%) had genotype 2 HCV. The average HCV RNA level was 5.53 ± 1.2 log10 IU/mL. Additionally, 36 patients (36%) had hypertension, 12 (12%) had diabetes mellitus, and 12 (12%) had cancer, including oral cancer (n = 3), colon cancer (n = 3), breast cancer (n = 2), lung cancer (n = 2), hepatoma (n = 1), and lymphoma (n = 1). Nineteen patients (19%) had an FIB-4 score ≥ 3.25. When comparing the two subgroups (GLE/PIB and SOF/VEL), the SOF/VEL group had a higher proportion of males, higher Aspartate Transaminase (AST) levels, lower LDL and TC levels, and greater liver stiffness.

Table 1.
The baseline characteristics of the patients in the study group.
3.2. Results Before and After DAA Treatment of the Total Patients
The laboratory tests and elastography results for the 100 patients before and after HCV treatment are shown in Table 2. Liver stiffness and FIB-4 scores significantly decreased (p < 0.001), whereas CAP increased after DAA therapy (p = 0.007). After treatment, LDL and TC levels were significantly higher than before (p < 0.001). There were no significant differences in fasting glucose, insulin, HOMA-IR, HbA1c, or HDL before and after treatment. The TG level was slightly higher after treatment than before, but the difference was not statistically significant (p = 0.088).
Table 2.
The results of 100 patients before and after HCV treatment with direct-acting antivirals. (Data are expressed as mean ± standard deviation.).
3.3. Results Before and After DAA Treatment for Subgroups of Two Pangenotypic DAAs
Table 3 shows the analysis of the two subgroups, separated by their DAA regimens: 57 patients received glecaprevir/pibrentasvir (GLE/PIB), while 43 received sofosbuvir/velpatasvir (SOF/VEL). TC and LDL levels were significantly higher after treatment in both subgroups than before treatment, with the GLE/PIB group showing a more pronounced increase. While liver stiffness measurements significantly decreased in both groups following treatment, the controlled CAP only increased in the GLE/PIB group.
Table 3.
Results before and after DAA treatment for subgroups of two pangenotypic DAAs (GLE/PIB and SOF/VEL).
3.4. Factors Associated with the Change in LDL and TC in Entire Population
Only pretreatment fasting glucose and LDL were found to be negatively associated with the percentage change in LDL after treatment in both univariate and multivariate analyses (p = 0.005 and p = 0.007, respectively). (Table 4) The findings were similar for TC, with pretreatment fasting glucose and TC being negatively associated with the percentage change in total cholesterol after treatment in both univariate and multivariate analyses (p = 0.001 and p = 0.009, respectively) (Table 5). Figure 2 shows a negative correlation between baseline LDL and the percentage change in LDL (r = −0.273), as well as between baseline TC and the percentage change in TC (r = −0.301).
Table 4.
Univariate and multivariate analyses of factors associated with the percentage of change in LDL-cholesterol.
Table 5.
Univariate and multivariate analyses of factors associated with the percentage change in total cholesterol.
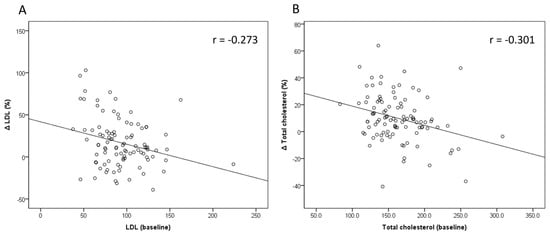
Figure 2.
The correlation between pretreatment LDL and TC levels and the percentage change of (A) LDL (ΔLDL(%)) and (B) TC (ΔTC(%)).
4. Discussion
This is the first study to look at the effects of two different pangenotypic DAA regimens, GLE/PIB and SOF/VEL, on lipid profiles and IR. Our results show that LDL and TC levels were increased after viral eradication by two pangenotypic DAAs, but there were no significant changes in fasting glucose, HbA1c, HOMA-IR, TG, or HDL.
HCV can increase lipid biosynthesis and lower the export of apolipoproteins via multiple mechanisms of lipid metabolism. This phenomenon is reversed after HCV is eradicated using DAAs [13]. There is some debate about which lipid profiles are affected by HCV infection. Most studies show that LDL and TC are the most commonly affected lipids following HCV eradication [6,7,8]. However, some studies show that HCV eradication by DAA therapy lowers triglycerides and raises HDL levels [14,15]. Our study found that LDL and TC levels increased after HCV eradication, which is consistent with most previous studies. Furthermore, the effects of various DAA regimens on lipid profiles have yielded inconsistent results. Inoue Takako et al. and Endo Daisuke et al. found that patients treated with sofosbuvir plus ledipasvir had higher LDL and TC levels than those treated with daclatasvir plus asunaprevir [10,16]. A review by YW Wang et al. discovered that SOF-based DAAs cause more significant increases in LDL than non-SOF-based DAAs [17]. However, our findings indicated that SOF-based (SOF/VEL) and non-SOF-based (GLE/PIB) DAAs have similar effects on lipid profiles after viral eradication. LDL and TC levels significantly increased following DAA therapy, while TG and HDL levels remained unchanged. This could be explained by the strong and comparable efficacy of both pangenotypic DAAs in eliminating HCV, resulting in similar effects on lipid profiles.
Several factors have been linked to increased levels of LDL and TC [7]. These include the absence of cirrhosis, hyperlipidemia, and a larger baseline waist circumference [18]. Additionally, higher HOMA-IR, lower AST, higher triglycerides, and a higher BMI at baseline were linked to changes in LDL levels [15,16]. In our study, the predictors of the degree of change in LDL and TC included fasting glucose and baseline LDL and TC levels. These findings are consistent with those of previous research, but more studies are needed to confirm them.
Previous research has shown that IR is closely associated with chronic hepatitis C infection, particularly in genotypes 1 and 4 [5]. DAA therapy can reverse IR in patients with chronic hepatitis C infection and improve hyperglycemia [19]. One mechanism linking HCV and IR is that the HCV core protein induces serine phosphorylation of the insulin receptor substrate protein. This process inhibits phosphatidylinositol-4,5-bisphosphate 3-kinase signaling, which is followed by a decrease in protein kinase B and tuberous sclerosis complex 1/2 signaling [20,21]. Our study found no significant difference in fasting glucose, HbA1C, or HOMA-IR levels between baseline and post-treatment. However, there was a trend of mild decreases in HbA1C and HOMA-IR following DAA treatment. One possible explanation is that our study’s baseline levels of fasting glucose, HbA1C, and HOMA-IR were lower than those in other studies, resulting in no significant differences [19,22].
This study has several limitations. First, the sample size was small because we only included patients who had complete data on fasting glucose, insulin, HbA1C, and lipid profiles before and after DAA treatment. Because this was a real-world retrospective study, less than half of the patients who were initially included were analyzed. Consequently, some older patients or those with multiple comorbidities were excluded, which could explain why some parameters showed no significant differences. Second, the follow-up period in our study was brief. Researchers discovered that LDL and TC levels remained elevated even two years after DAA therapy. However, most studies observed a reduction in carotid atherosclerosis after HCV eradication [7]. In addition, previous studies have shown that HCV infection can increase the risk of cardiovascular disease, while antiviral therapy can lower this risk [23,24]. The possible mechanism is multifactorial, involving lipid disturbances, vascular injury, oxidative stress, and endothelial dysfunction. Therefore, more research is needed to understand the long-term impact of pangenotypic DAAs and their influence on clinical outcomes.
5. Conclusions
Treatment with the two pangenotypic DAAs increased LDL and TC levels. Our study found no significant differences in glucose, HbA1c, HOMA-IR, or TG levels before or after DAA therapy. The only significant predictors of an increase in LDL or TC levels at SVR12 were lower baseline fasting glucose and lower LDL or TC levels.
Author Contributions
Conceptualization, H.-H.Y.; data curation, Y.-C.H.; formal analysis, Y.-C.H. and S.-P.H.; methodology, S.-P.H. and P.-Y.S.; supervision, P.-Y.S.; writing—original draft, M.-Y.K.; writing—review and editing, P.-Y.S. All authors have read and agreed to the published version of the manuscript.
Funding
This research was funded by Changhua Christian Hospital (113-CCH-IRP-016).
Institutional Review Board Statement
The study was conducted in accordance with the Declaration of Helsinki and approved by the Institutional Review Board of Changhua Christian Hospital (IRB No. 231011).
Informed Consent Statement
Patient consent was waived because all the data were anonymized.
Data Availability Statement
The data that support the findings of this study are available from the corresponding author (P.S) upon reasonable request.
Conflicts of Interest
The authors declare no conflicts of interest.
Abbreviations
| HCV | Hepatitis C virus |
| LDL | Low-density lipoprotein |
| TC | Total cholesterol |
| DAA | Direct-acting antiviral |
| GLE | Glecaprevir |
| PIB | Pibrentasvir |
| SOF | Sofosbuvir |
| VEL | Velpatasvir |
| HCC | Hepatocellular carcinoma |
| IFN | Interferon |
| SVR | Sustained virologic response |
| IR | Insulin resistance |
| TG | Triglycerides |
| HOMA-IR | Homeostatic model assessment of insulin resistance |
| AST | Aspartate transaminase |
| ALT | Alanine transferase |
| BMI | Body mass index |
| Hb | Hemoglobin |
| INR | International normalized ratio |
| FIB-4 | Fibrosis-4 |
| LSM | Liver stiffness measurement |
| CAP | Controlled Attenuation Parameter |
| HDL | High-density lipoprotein |
| GT | Genotype |
References
- Global Hepatitis Report 2024: Action for Access in Low- and Middle-Income Countries; World Health Organization: Geneva, Switzerland, 2024.
- Morgan, T.R.; Ghany, M.G.; Kim, H.Y.; Snow, K.K.; Shiffman, M.L.; De Santo, J.L.; Lee, W.M.; Di Bisceglie, A.M.; Bonkovsky, H.L.; Dienstag, J.L.; et al. Outcome of sustained virological responders with histologically advanced chronic hepatitis C. Hepatology 2010, 52, 833–844. [Google Scholar] [CrossRef] [PubMed]
- Morgan, R.L.; Baack, B.; Smith, B.D.; Yartel, A.; Pitasi, M.; Falck-Ytter, Y. Eradication of hepatitis C virus infection and the development of hepatocellular carcinoma: A meta-analysis of observational studies. Ann. Intern. Med. 2013, 158, 329–337. [Google Scholar] [CrossRef] [PubMed]
- Huang, J.F.; Yu, M.L.; Dai, C.Y.; Hsieh, M.Y.; Hwang, S.J.; Hsiao, P.J.; Lee, L.P.; Lin, Z.Y.; Chen, S.C.; Hsieh, M.Y.; et al. Reappraisal of the characteristics of glucose abnormalities in patients with chronic hepatitis C infection. Am. J. Gastroenterol. 2008, 103, 1933–1940. [Google Scholar] [CrossRef] [PubMed]
- Moucari, R.; Asselah, T.; Cazals-Hatem, D.; Voitot, H.; Boyer, N.; Ripault, M.P.; Sobesky, R.; Martinot-Peignoux, M.; Maylin, S.; Nicolas-Chanoine, M.; et al. Insulin Resistance in Chronic Hepatitis C: Association With Genotypes 1 and 4, Serum HCV RNA Level, and Liver Fibrosis. Gastroenterology 2008, 134, 416–423. [Google Scholar] [CrossRef]
- Villani, R.; Di Cosimo, F.; Romano, A.D.; Sangineto, M.; Serviddio, G. Serum lipid profile in HCV patients treated with direct-acting antivirals: A systematic review and meta-analysis. Sci. Rep. 2021, 11, 13944. [Google Scholar] [CrossRef]
- Cespiati, A.; Coelho Rodrigues, I.; Santos, I.; Policarpo, S.; Carvalhana, S.; Fracanzani, A.L.; Cortez-Pinto, H. Effect of HCV eradication by DAAs on liver steatosis, carotid atherosclerosis, and associated metabolic comorbidities: A systematic review. Liver Int. 2024, 44, 1075–1092. [Google Scholar] [CrossRef] [PubMed]
- Corey, K.E.; Kane, E.; Munroe, C.; Barlow, L.L.; Zheng, H.; Chung, R.T. Hepatitis C virus infection and its clearance alter circulating lipids: Implications for long-term follow-up. Hepatology 2009, 50, 1030–1037. [Google Scholar] [CrossRef] [PubMed]
- Iossa, D.; Vitrone, M.; Gagliardi, M.; Falco, E.; Ragone, E.; Zampino, R.; Durante-Mangoni, E. Anthropometric parameters and liver histology influence lipid metabolic changes in HCV chronic hepatitis on direct-acting antiviral treatment. Ann. Transl. Med. 2021, 9, 35. [Google Scholar] [CrossRef]
- Inoue, T.; Goto, T.; Iio, E.; Matsunami, K.; Fujiwara, K.; Shinkai, N.; Matsuura, K.; Matsui, T.; Nojiri, S.; Tanaka, Y. Changes in serum lipid profiles caused by three regimens of interferon-free direct-acting antivirals for patients infected with hepatitis C virus. Hepatol. Res. 2018, 48, E203–E212. [Google Scholar] [CrossRef]
- Vallet-Pichard, A.; Mallet, V.; Nalpas, B.; Verkarre, V.; Nalpas, A.; Dhalluin-Venier, V.; Fontaine, H.; Pol, S. FIB-4: An inexpensive and accurate marker of fibrosis in HCV infection. Comparison with liver biopsy and FibroTest. Hepatology 2007, 46, 32–36. [Google Scholar] [CrossRef]
- Lann, D.; LeRoith, D. Insulin Resistance as the Underlying Cause for the Metabolic Syndrome. Med. Clin. N. Am. 2007, 91, 1063–1077. [Google Scholar] [CrossRef] [PubMed]
- Elgretli, W.; Chen, T.; Kronfli, N.; Sebastiani, G. Hepatitis C Virus-Lipid Interplay: Pathogenesis and Clinical Impact. Biomedicines 2023, 11, 271. [Google Scholar] [CrossRef] [PubMed]
- Mei, T.; Huang, X.; Tang, S.; Liu, M.; Zhang, W.; Yu, H. Effects of sustained viral response on lipid in Hepatitis C: A systematic review and meta-analysis. Lipids Health Dis. 2024, 23, 74. [Google Scholar] [CrossRef] [PubMed]
- Abdo, M.; Rabiee, A.; Abdellatif, Z.; Abdel Alem, S.; Moustafa, A. Impact of sustained virological response on metabolic disorders in diabetic chronic hepatitis C virus patients after treatment with generic sofosbuvir and daclatasvir. Eur. J. Gastroenterol. Hepatol. 2021, 33, 1588–1594. [Google Scholar] [CrossRef]
- Endo, D.; Satoh, K.; Shimada, N.; Hokari, A.; Aizawa, Y. Impact of interferon-free antivirus therapy on lipid profiles in patients with chronic hepatitis C genotype 1b. World J. Gastroenterol. 2017, 23, 2355–2364. [Google Scholar] [CrossRef] [PubMed][Green Version]
- Wang, Y.W.; Lee, W.P.; Huang, Y.H.; Hou, M.C.; Lan, K.H. Effect of sofosbuvir-based DAAs on changes in lower-density lipoprotein in HCV patients: A systematic review and meta-analysis. BMC Infect. Dis. 2021, 21, 984. [Google Scholar] [CrossRef] [PubMed]
- Huang, C.F.; Dai, C.Y.; Yeh, M.L.; Huang, C.I.; Lee, H.C.; Lai, W.T.; Liang, P.; Lin, Y.; Hsieh, M.; Hou, N.; et al. Cure or curd: Modification of lipid profiles and cardio-cerebrovascular events after hepatitis C virus eradication. Kaohsiung J. Med. Sci. 2020, 36, 920–928. [Google Scholar] [CrossRef] [PubMed]
- Adinolfi, L.E.; Nevola, R.; Guerrera, B.; D’Alterio, G.; Marrone, A.; Giordano, M.; Rinaldi, L. Hepatitis C virus clearance by direct-acting antiviral treatments and impact on insulin resistance in chronic hepatitis C patients. J. Gastroenterol. Hepatol. 2018, 33, 1379–1382. [Google Scholar] [CrossRef] [PubMed]
- Ciardullo, S.; Mantovani, A.; Ciaccio, A.; Carbone, M.; Invernizzi, P.; Perseghin, G. Hepatitis C virus infection and diabetes: A complex bidirectional relationship. Diabetes Res. Clin. Pract. 2022, 187, 109870. [Google Scholar] [CrossRef] [PubMed]
- Alzahrani, N. Hepatitis C virus, insulin resistance, and diabetes: A review. Microbiol. Immunol. 2022, 66, 453–459. [Google Scholar] [CrossRef] [PubMed]
- Lee, H.; Chien, R.N.; Pao, L.H.; Kuo, C.J.; Huang, P.H.; Chang, M.L. Decoupled glucose and lipid metabolic recovery after viral clearance in direct-acting antiviral-treated hcv patients: A 3-year prospective cohort study. Cells 2021, 10, 2934. [Google Scholar] [CrossRef]
- Butt, A.A.; Yan, P.; Chew, K.W.; Currier, J.; Corey, K.; Chung, R.T.; Shuaib, A.; Abou-Samra, A.-B.; Butler, J.; Freiberg, M.S. Risk of Acute Myocardial Infarction Among Hepatitis C Virus (HCV)-Positive and HCV-Negative Men at Various Lipid Levels: Results From ERCHIVES. Clin. Infect. Dis. 2017, 65, 557–565. [Google Scholar] [CrossRef] [PubMed]
- Jaiswal, V.; Ang, S.P.; Hanif, M.; Jha, M.; Kumar, V.; Siddiq, A.; Vachhani, B.; Halder, A.; Koifman, M.; Jeanty, H.; et al. Cardioprotective effect of antiviral therapy among hepatitis C infected patients: A meta-analysis. Int. J. Cardiol. Heart Vasc. 2023, 49, 101270. [Google Scholar] [CrossRef] [PubMed]
Disclaimer/Publisher’s Note: The statements, opinions and data contained in all publications are solely those of the individual author(s) and contributor(s) and not of MDPI and/or the editor(s). MDPI and/or the editor(s) disclaim responsibility for any injury to people or property resulting from any ideas, methods, instructions or products referred to in the content. |
© 2025 by the authors. Licensee MDPI, Basel, Switzerland. This article is an open access article distributed under the terms and conditions of the Creative Commons Attribution (CC BY) license (https://creativecommons.org/licenses/by/4.0/).