

The Relationship between COVID-19 Severity in Children and Immunoregulatory Gene Polymorphism

 , ,
, ,  , , and
Abstract
:1. Introduction
2. Materials and Methods
3. Results
3.1. Study Group’s Characteristic
3.2. Correspondence to Hardy–Weinberg Equilibrium
3.3. Genotype and Allele Frequencies
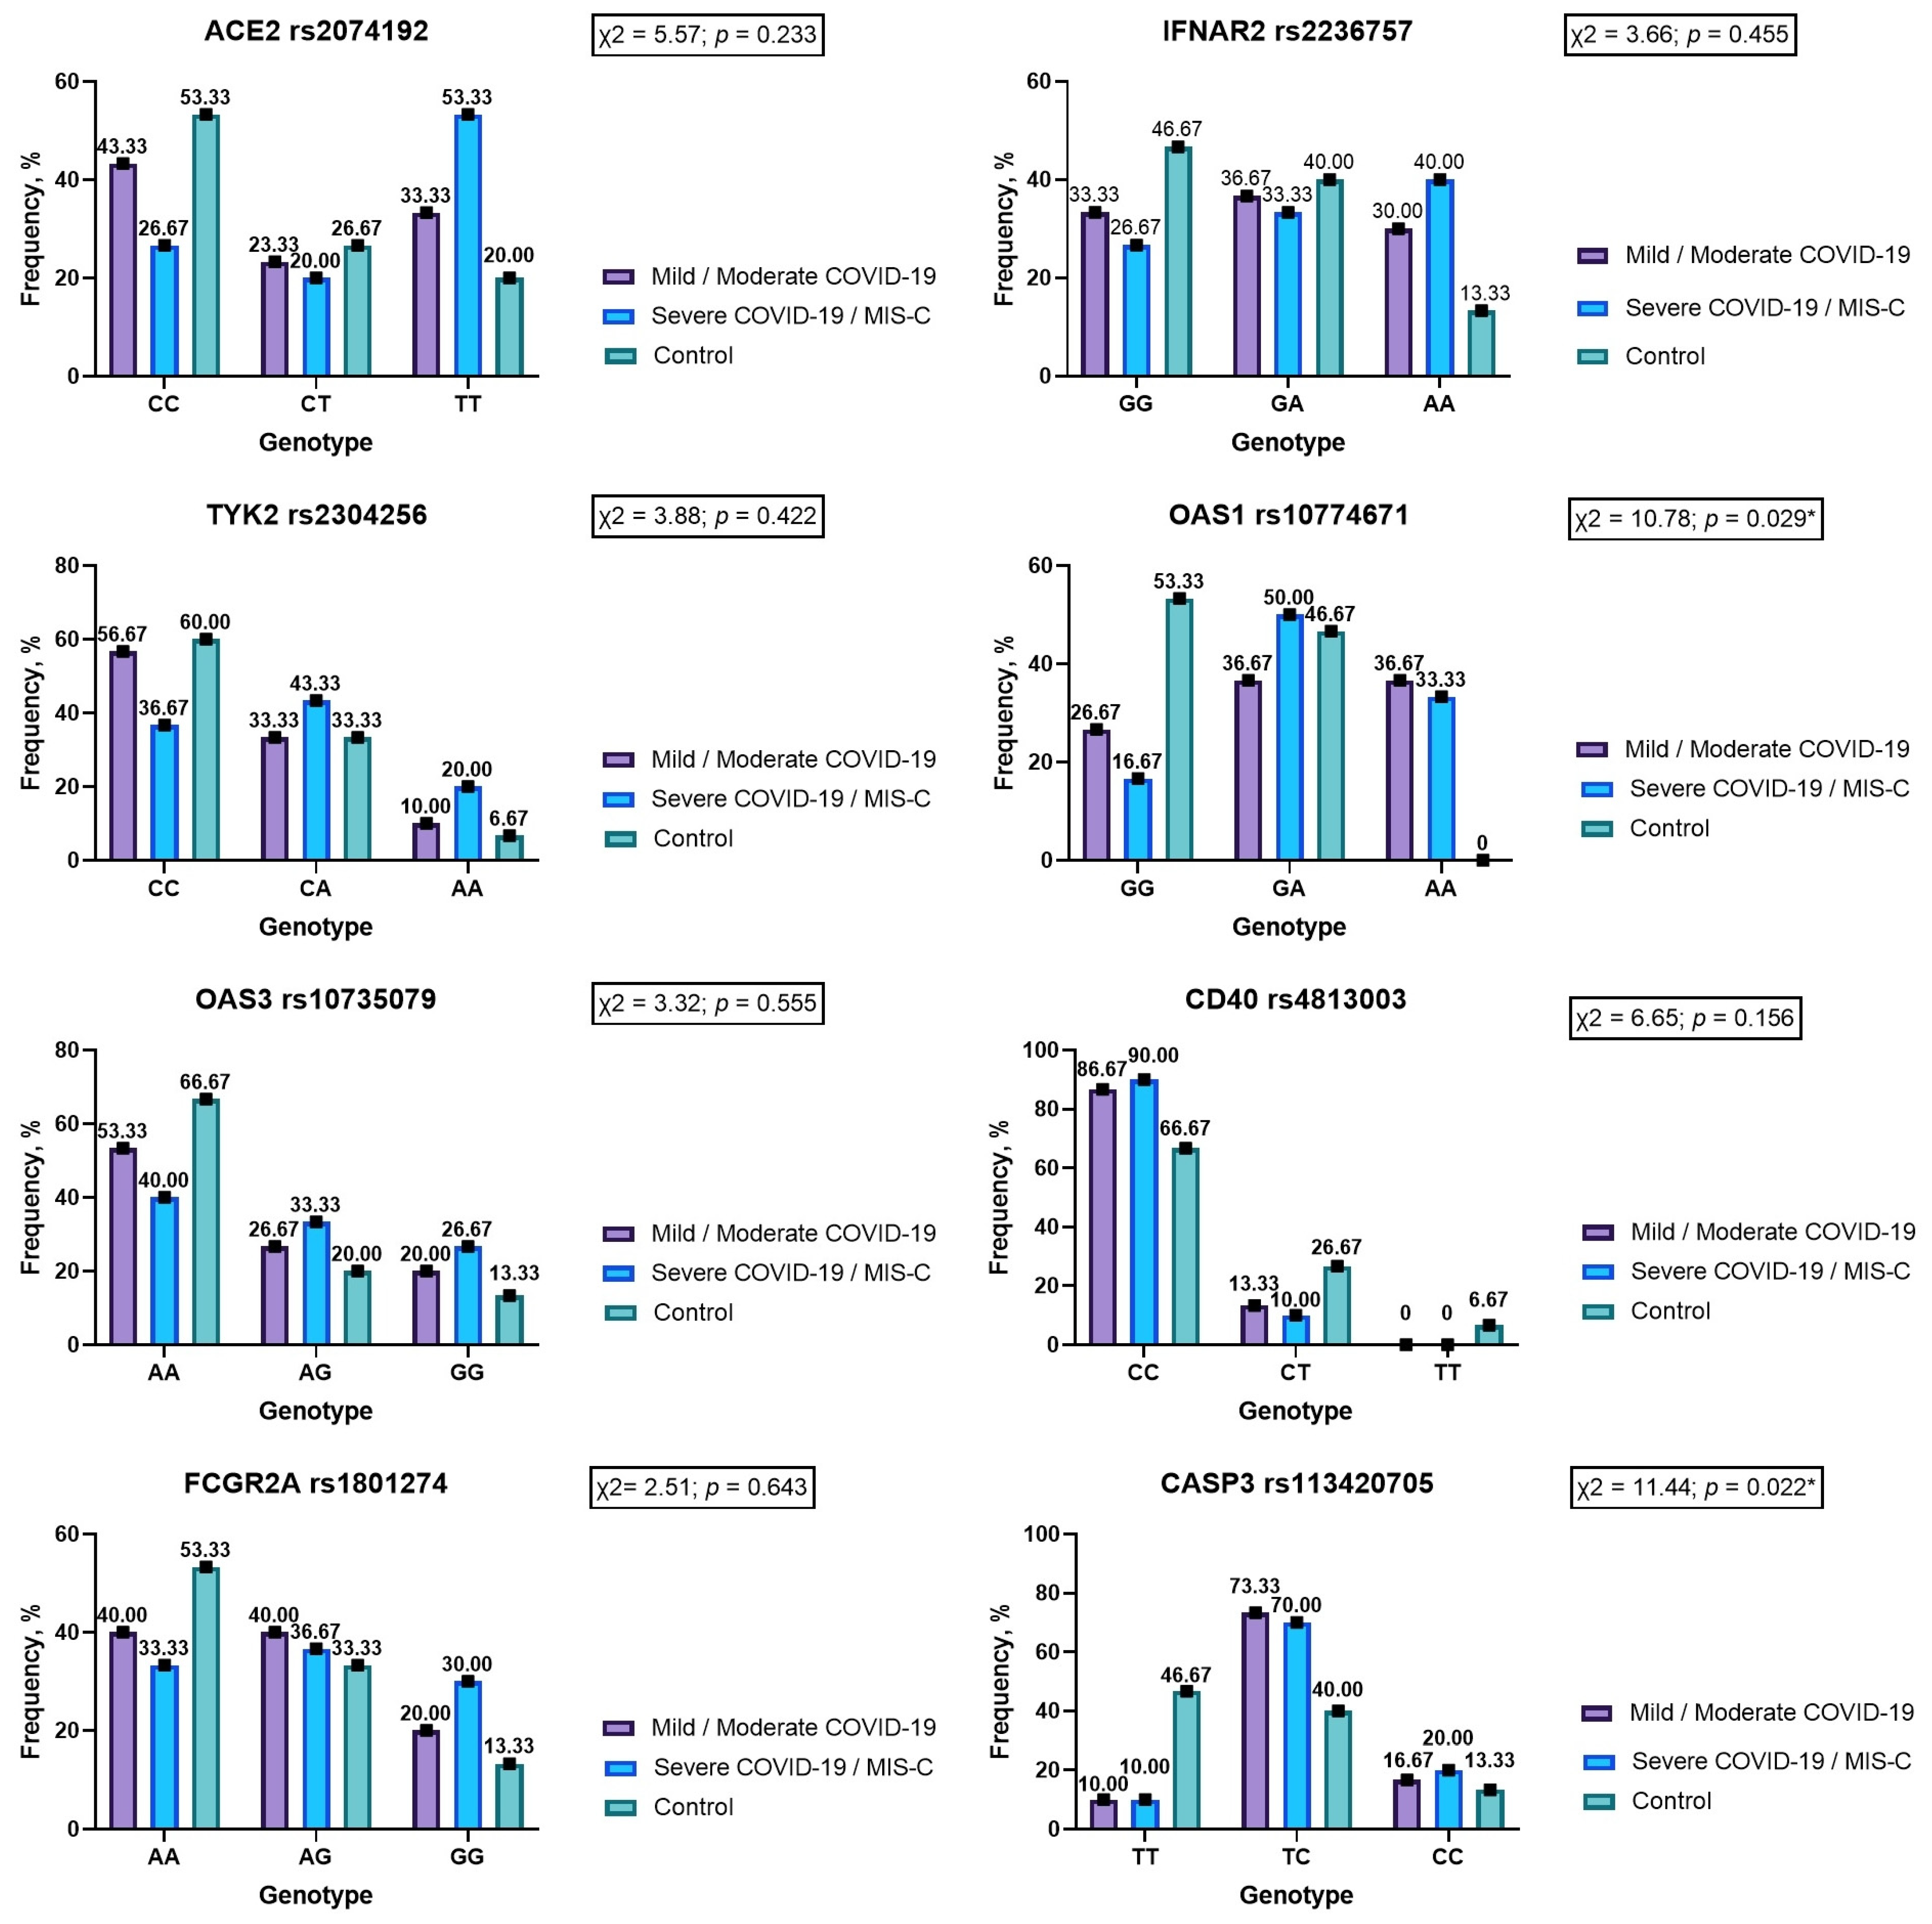
3.3.1. ACE2 rs2074192
3.3.2. IFNAR2 rs2236757
3.3.3. TYK2 rs2304256
3.3.4. OAS1 rs10774671
3.3.5. OAS3 rs10735079
3.3.6. CD40 rs4813003
3.3.7. FCGR2A rs1801274
3.3.8. CASP3 rs113420705
3.3.9. Allele Associations and Gene Interrelationships in Children with COVID-19
4. Discussion
5. Conclusions
Supplementary Materials
Author Contributions
Funding
Institutional Review Board Statement
Informed Consent Statement
Data Availability Statement
Acknowledgments
Conflicts of Interest
Limitations of the Study
References
- World Health Organization. Available online: https://covid19.who.int/ (accessed on 7 October 2023).
- UNICEF. Available online: https://data.unicef.org/resources/covid-19-confirmed-cases-and-deaths-dashboard/ (accessed on 7 October 2023).
- Nathanielsz, J.; Toh, Z.Q.; Do, L.A.H.; Mulholland, K.; Licciardi, P.V. SARS-CoV-2 Infection in Children and Implications for Vaccination. Pediatr. Res. 2023, 93, 1177–1187. [Google Scholar] [CrossRef] [PubMed]
- Kozak, K.V.; Pavlyshyn, H.A.; Avramenko, I.Y.; Dyvonyak, O.M.; Hlushko, K.T. SARS-CoV-2 Infection and Thyroid Dysfunction in Children. Ukr. Biochem. J. 2023, 95, 12–21. [Google Scholar] [CrossRef]
- Di Pietro, G.M.; Ronzoni, L.; Meschia, L.M.; Tagliabue, C.; Lombardi, A.; Pinzani, R.; Bosis, S.; Marchisio, P.G.; Valenti, L. SARS-CoV-2 Infection in Children: A 24 Months Experience with Focus on Risk Factors in a Pediatric Tertiary Care Hospital in Milan, Italy. Front. Pediatr. 2023, 11, 1082083. [Google Scholar] [CrossRef] [PubMed]
- Leonardi, L.; Rivalta, B.; Leone, F.; Cancrini, C.; Caffarelli, C.; Marseglia, G.L.; Cardinale, F. Host Defenses to Viruses: Lessons from Inborn Errors of Immunity. Medicina 2022, 58, 248. [Google Scholar] [CrossRef]
- Sánchez-González, M.T.; Cienfuegos-Jiménez, O.; Álvarez-Cuevas, S.; Pérez-Maya, A.A.; Borrego-Soto, G.; Marino-Martínez, I.A. Prevalence of the SNP Rs10774671 of the OAS1 Gene in Mexico as a Possible Predisposing Factor for RNA Virus Disease. Int. J. Mol. Epidemiol. Genet. 2021, 12, 52–60. [Google Scholar]
- Burrell, L.M.; Harrap, S.B.; Velkoska, E.; Patel, S.K. The ACE2 Gene: Its Potential as a Functional Candidate for Cardiovascular Disease. Clin. Sci. 2013, 124, 65–76. [Google Scholar] [CrossRef]
- Gintoni, I.; Adamopoulou, M.; Yapijakis, C. The Impact of ACE and ACE2 Gene Polymorphisms in Pulmonary Diseases Including COVID-19. In Vivo 2022, 36, 13–29. [Google Scholar] [CrossRef]
- Fernández-de-las-Peñas, C.; Arendt-Nielsen, L.; Díaz-Gil, G.; Gómez-Esquer, F.; Gil-Crujera, A.; Gómez-Sánchez, S.M.; Ambite-Quesada, S.; Palomar-Gallego, M.A.; Pellicer-Valero, O.J.; Giordano, R. Genetic Association between ACE2 (Rs2285666 and Rs2074192) and TMPRSS2 (Rs12329760 and Rs2070788) Polymorphisms with Post-COVID Symptoms in Previously Hospitalized COVID-19 Survivors. Genes 2022, 13, 1935. [Google Scholar] [CrossRef]
- Ong, S.Y.Q.; Flyamer, I.M.; Bickmore, W.A.; Biddie, S.C. From Bedside to Bench: Regulation of Host Factors in SARS-CoV-2 Infection. Exp. Mol. Med. 2021, 53, 483–494. [Google Scholar] [CrossRef]
- Pairo-Castineira, E.; Clohisey, S.; Klaric, L.; Bretherick, A.D.; Rawlik, K.; Pasko, D.; Walker, S.; Parkinson, N.; Fourman, M.H.; Russell, C.D.; et al. Genetic Mechanisms of Critical Illness in COVID-19. Nature 2021, 591, 92–98. [Google Scholar] [CrossRef]
- Fricke-Galindo, I.; Martínez-Morales, A.; Chávez-Galán, L.; Ocaña-Guzmán, R.; Buendía-Roldán, I.; Pérez-Rubio, G.; Hernández-Zenteno, R.d.J.; Verónica-Aguilar, A.; Alarcón-Dionet, A.; Aguilar-Duran, H.; et al. IFNAR2 Relevance in the Clinical Outcome of Individuals with Severe COVID-19. Front. Immunol. 2022, 13, 949413. [Google Scholar] [CrossRef] [PubMed]
- Rusiñol, L.; Puig, L. Tyk2 Targeting in Immune-Mediated Inflammatory Diseases. Int. J. Mol. Sci. 2023, 24, 3391. [Google Scholar] [CrossRef] [PubMed]
- Muromoto, R.; Oritani, K.; Matsuda, T. Current Understanding of the Role of Tyrosine Kinase 2 Signaling in Immune Responses. World J. Biol. Chem. 2022, 13, 1–14. [Google Scholar] [CrossRef] [PubMed]
- Dieter, C.; de Almeida Brondani, L.; Lemos, N.E.; Schaeffer, A.F.; Zanotto, C.; Ramos, D.T.; Girardi, E.; Pellenz, F.M.; Camargo, J.L.; Moresco, K.S.; et al. Polymorphisms in ACE1, TMPRSS2, IFIH1, IFNAR2, and TYK2 Genes Are Associated with Worse Clinical Outcomes in COVID-19. Genes 2023, 14, 29. [Google Scholar] [CrossRef]
- Benmansour, R.; Tagajdid, M.R.; Elkochri, S.; Aabi, R.; Elannaz, H.; Laraqui, A.; El Mchichi, B.; Touil, N.; Ennibi, K.; Amine, I.L. Genetic Susceptibility to Severe Forms of COVID-19: What We Learned in 2022. Saudi J. Pathol. Microbiol. 2023, 8, 90–98. [Google Scholar] [CrossRef]
- Zabihi Rizi, F.; Ghorbani, A.; Zahtab, P.; Darbaghshahi, N.N.; Ataee, N.; Pourhamzeh, P.; Hamzei, B.; Dolatabadi, N.F.; Zamani, A.; Hooshmand, M. TYK2 Single-Nucleotide Variants Associated with the Severity of COVID-19 Disease. Arch. Virol. 2023, 168, 119. [Google Scholar] [CrossRef]
- Rouf Banday, A.; Stanifer, M.L.; Florez-Vargas, O.; Onabajo, O.O.; Papenberg, B.W.; Zahoor, M.A.; Mirabello, L.; Ring, T.J.; Lee, C.-H.; Albert, P.S.; et al. Genetic Regulation of OAS1 Nonsense-Mediated Decay Underlies Association with COVID-19 Hospitalization in Patients of European and African Ancestries. Nat. Genet. 2022, 54, 1103–1116. [Google Scholar] [CrossRef]
- Raza, R.Z.; Abbasi, S.W. An Evolutionary Insight Into the Heterogeneous Severity Pattern of the SARS-CoV-2 Infection. Front. Genet. 2022, 13, 859508. [Google Scholar] [CrossRef]
- Steffen, B.T.; Pankow, J.S.; Lutsey, P.L.; Demmer, R.T.; Misialek, J.R.; Guan, W.; Cowan, L.T.; Coresh, J.; Norby, F.L.; Tang, W. Proteomic Profiling Identifies Novel Proteins for Genetic Risk of Severe COVID-19: The Atherosclerosis Risk in Communities Study. Hum. Mol. Genet. 2022, 31, 2452–2461. [Google Scholar] [CrossRef]
- Sancho-Shimizu, V.; Brodin, P.; Cobat, A.; Biggs, C.M.; Toubiana, J.; Lucas, C.L.; Henrikson, S.E.; Belot, A.; Tangye, S.G.; Milner, J.D.; et al. SARS-CoV-2-Related MIS-C: A Key to the Viral and Genetic Causes of Kawasaki Disease? J. Exp. Med. 2021, 218, e20210446. [Google Scholar] [CrossRef]
- Kumrah, R.; Vignesh, P.; Rawat, A.; Singh, S. Immunogenetics of Kawasaki Disease. Clin. Rev. Allergy Immunol. 2020, 59, 122–139. [Google Scholar] [CrossRef]
- Onouchi, Y. The Genetics of Kawasaki Disease. Int. J. Rheum. Dis. 2018, 21, 26–30. [Google Scholar] [CrossRef] [PubMed]
- Chaudhary, H.; Nameirakpam, J.; Kumrah, R.; Pandiarajan, V.; Suri, D.; Rawat, A.; Singh, S. Biomarkers for Kawasaki Disease: Clinical Utility and the Challenges Ahead. Front. Pediatr. 2019, 7, 242. [Google Scholar] [CrossRef] [PubMed]
- Elgueta, R.; Benson, M.J.; De Vries, V.C.; Wasiuk, A.; Guo, Y.; Noelle, R.J. Molecular Mechanism and Function of CD40/CD40L Engagement in the Immune System. Immunol. Rev. 2009, 229, 152–172. [Google Scholar] [CrossRef]
- Chen, M.R.; Chang, T.Y.; Chiu, N.C.; Chi, H.; Yang, K.D.; Chang, L.; Huang, D.T.N.; Huang, F.Y.; Lien, Y.P.; Lin, W.S.; et al. Validation of Genome-Wide Associated Variants for Kawasaki Disease in a Taiwanese Case–Control Sample. Sci. Rep. 2020, 10, 11756. [Google Scholar] [CrossRef] [PubMed]
- Lou, J.; Zhong, R.; Shen, N.; Lu, X.Z.; Ke, J.T.; Duan, J.Y.; Qi, Y.Q.; Wang, Y.J.; Zhang, Q.; Wang, W.; et al. Systematic Confirmation Study of GWAS-Identified Genetic Variants for Kawasaki Disease in A Chinese Population. Sci. Rep. 2015, 5, 8194. [Google Scholar] [CrossRef]
- Hara, T.; Yamamura, K.; Sakai, Y. The Up-to-Date Pathophysiology of Kawasaki Disease. Clin. Transl. Immunol. 2021, 10, 1–14. [Google Scholar] [CrossRef]
- Chatzikyriakidou, A.; Aidinidou, L.; Giannopoulos, A.; Papadopoulou-Legbelou, K.; Kalinderi, K.; Fidani, L. Absence of Association of FCGR2A Gene Polymorphism Rs1801274 with Kawasaki Disease in Greek Patients. Cardiol. Young 2015, 25, 681–683. [Google Scholar] [CrossRef]
- Uzuncakmak, S.K.; Dirican, E.; Naldan, M.E.; Can, F.K.; Halıcı, Z. Investigation of CYP2E1 and Caspase-3 Gene Expressions in COVID-19 Patients. Gene. Rep. 2022, 26, 101497. [Google Scholar] [CrossRef]
- Venturini, E.; Montagnani, C.; Garazzino, S.; Donà, D.; Pierantoni, L.; Lo Vecchio, A.; Krzysztofiak, A.; Nicolini, G.; Bianchini, S.; Galli, L.; et al. Treatment of Children with COVID-19: Update of the Italian Society of Pediatric Infectious Diseases Position Paper. Ital. J. Pediatr. 2021, 47, 199. [Google Scholar] [CrossRef]
- Dona’, D.; Montagnani, C.; Di Chiara, C.; Venturini, E.; Galli, L.; Lo Vecchio, A.; Denina, M.; Olivini, N.; Bruzzese, E.; Campana, A.; et al. COVID-19 in Infants Less than 3 Months: Severe or Not Severe Disease? Viruses 2022, 14, 2256. [Google Scholar] [CrossRef]
- National Institutes of Health. Available online: https://www.covid19treatmentguidelines.nih.gov/about-the-guidelines/ (accessed on 5 August 2023).
- World Health Organization. Available online: https://www.who.int/news-room/commentaries/detail/multisystem-inflammatory-syndrome-in-children-and-adolescents-with-covid-19 (accessed on 5 August 2023).
- Howie, S.R.C. Blood Sample Volumes in Child Health Research: Review of Safe Limits. Bull. World Health Organ. 2011, 89, 46–53. [Google Scholar] [CrossRef]
- GeneMANIA. Available online: https://genemania.org/ (accessed on 14 August 2023).
- Phan, L.; Jin, Y.; Zhang, H.; Qiang, W.; Shekhtman, E.; Shao, D.; Revoe, D.; Villamarin, R.; Ivanchenko, E.; Kimura, M.; et al. ALFA: Allele Frequency Aggregator; National Center for Biotechnology Information, U.S. National Library of Medicine: Bethesda, MD, USA, 2020.
- Gómez, J.; Albaiceta, G.M.; García-Clemente, M.; López-Larrea, C.; Amado-Rodríguez, L.; Lopez-Alonso, I.; Hermida, T.; Enriquez, A.I.; Herrero, P.; Melón, S.; et al. Angiotensin-Converting Enzymes (ACE, ACE2) Gene Variants and COVID-19 Outcome. Gene 2020, 762, 145102. [Google Scholar] [CrossRef] [PubMed]
- Sabater Molina, M.; Nicolás Rocamora, E.; Bendicho, A.I.; Vázquez, E.G.; Zorio, E.; Rodriguez, F.D.; Gil Ortuño, C.; Rodríguez, A.I.; Sánchez-López, A.J.; Jara Rubio, R.; et al. Polymorphisms in ACE, ACE2, AGTR1 Genes and Severity of COVID-19 Disease. PLoS ONE 2022, 17, e0263140. [Google Scholar] [CrossRef]
- Möhlendick, B.; Schönfelder, K.; Breuckmann, K.; Elsner, C.; Babel, N.; Balfanz, P.; Dahl, E.; Dreher, M.; Fistera, D.; Herbstreit, F.; et al. ACE2 Polymorphism and Susceptibility for SARS-CoV-2 Infection and Severity of COVID-19. Pharmacogenet. Genom. 2021, 31, 165–171. [Google Scholar] [CrossRef]
- Buchynskyi, M.; Oksenych, V.; Kamyshna, I.; Vari, S.G.; Kamyshnyi, A. Genetic Predictors of Comorbid Course of COVID-19 and MAFLD: A Comprehensive Analysis. Viruses 2023, 15, 1724. [Google Scholar] [CrossRef] [PubMed]
- Cafiero, C.; Rosapepe, F.; Palmirotta, R.; Re, A.; Ottaiano, M.P.; Benincasa, G.; Perone, R.; Varriale, E.; D’Amato, G.; Cacciamani, A.; et al. Angiotensin System Polymorphisms’ in SARS-CoV-2 Positive Patients: Assessment Between Symptomatic and Asymptomatic Patients: A Pilot Study. Pharmacogenom. Pers. Med. 2021, 14, 621–629. [Google Scholar] [CrossRef] [PubMed]
- Gupta, K.; Kaur, G.; Pathak, T.; Banerjee, I. Systematic Review and Meta-Analysis of Human Genetic Variants Contributing to COVID-19 Susceptibility and Severity. Gene 2022, 844, 146790. [Google Scholar] [CrossRef] [PubMed]
- Martínez-Gómez, L.E.; Herrera-López, B.; Martinez-Armenta, C.; Ortega-Peña, S.; del Carmen Camacho-Rea, M.; Suarez-Ahedo, C.; Vázquez-Cárdenas, P.; Vargas-Alarcón, G.; Rojas-Velasco, G.; Fragoso, J.M.; et al. ACE and ACE2 Gene Variants Are Associated with Severe Outcomes of COVID-19 in Men. Front. Immunol. 2022, 13, 812940. [Google Scholar] [CrossRef]
- Gao, L.J.; He, Z.M.; Li, Y.Y.; Yang, R.R.; Yan, M.; Shang, X.; Cao, J.M. Role of OAS Gene Family in COVID-19 Induced Heart Failure. J. Transl. Med. 2023, 21, 212. [Google Scholar] [CrossRef]
- Hadjadj, J.; Yatim, N.; Barnabei, L.; Corneau, A.; Boussier, J.; Smith, N.; Péré, H.; Charbit, B.; Bondet, V.; Chenevier-Gobeaux, C.; et al. Impaired Type I Interferon Activity and Inflammatory Responses in Severe COVID-19 Patients. Science 2020, 369, 718–724. [Google Scholar] [CrossRef] [PubMed]
- Buchynskyi, M.; Kamyshna, I.; Lyubomirskaya, K.; Moshynets, O.; Kobyliak, N.; Oksenych, V.; Kamyshnyi, A. Efficacy of Interferon Alpha for the Treatment of Hospitalized Patients with COVID-19: A Meta-Analysis. Front. Immunol. 2023, 14, 1069894. [Google Scholar] [CrossRef] [PubMed]
- Kamyshnyi, A.; Koval, H.; Kobevko, O.; Buchynskyi, M.; Oksenych, V.; Kainov, D.; Lyubomirskaya, K.; Kamyshna, I.; Potters, G.; Moshynets, O. Therapeutic Effectiveness of Interferon-α2b against COVID-19 with Community-Acquired Pneumonia: The Ukrainian Experience. Int. J. Mol. Sci. 2023, 24, 6887. [Google Scholar] [CrossRef] [PubMed]
- Jalkanen, J.; Khan, S.; Elima, K.; Huttunen, T.; Wang, N.; Hollmén, M.; Elo, L.L.; Jalkanen, S. Polymorphism in Interferon Alpha/Beta Receptor Contributes to Glucocorticoid Response and Outcome of ARDS and COVID-19. Crit. Care 2023, 27, 112. [Google Scholar] [CrossRef]
- Yang, L.; Xie, X.; Tu, Z.; Fu, J.; Xu, D.; Zhou, Y. The Signal Pathways and Treatment of Cytokine Storm in COVID-19. Sig. Transduct. Target. Ther. 2021, 6, 255. [Google Scholar] [CrossRef]
- Ghoreschi, K.; Augustin, M.; Baraliakos, X.; Krönke, G.; Schneider, M.; Schreiber, S.; Schulze-Koops, H.; Zeißig, S.; Thaçi, D. TYK2 Inhibition and Its Potential in the Treatment of Chronic Inflammatory Immune Diseases. J. Dtsch. Dermatol. Ges. 2021, 19, 1409–1420. [Google Scholar] [CrossRef]
- Li, Z.; Rotival, M.; Patin, E.; Michel, F.; Pellegrini, S. Two Common Disease-Associated TYK2 Variants Impact Exon Splicing and TYK2 Dosage. PLoS ONE 2020, 15, e0225289. [Google Scholar] [CrossRef]
- GeneCards. Available online: https://www.genecards.org/cgi-bin/carddisp.pl?gene=TYK2 (accessed on 1 August 2023).
- Gokul, A.; Arumugam, T.; Ramsuran, V. Genetic Ethnic Differences in Human 2′-5′-Oligoadenylate Synthetase and Disease Associations: A Systemic Review. Genes 2023, 14, 527. [Google Scholar] [CrossRef]
- Zhao, Y.; Kang, H.; Ji, Y.; Chen, X. Evaluate the Relationship between Polymorphisms of OAS1 Gene and Susceptibility to Chronic Hepatitis C with High Resolution Melting Analysis. Clin. Exp. Med. 2013, 13, 171–176. [Google Scholar] [CrossRef]
- Drappier, M.; Michiels, T. Inhibition of the OAS/RNase L Pathway by Viruses. Curr. Opin. Viral 2015, 15, 19–26. [Google Scholar] [CrossRef]
- Lee, D.; Le Pen, J.; Yatim, A.; Dong, B.; Aquino, Y.; Ogishi, M.; Pescarmona, R.; Talouarn, E.; Rinchai, D.; Zhang, P.; et al. Inborn Errors of OAS-RNase L in SARS-CoV-2-Related Multisystem Inflammatory Syndrome in Children. Science 2023, 379, eabo3627. [Google Scholar] [CrossRef] [PubMed]
- Horowitz, J.E.; Kosmicki, J.A.; Damask, A.; Sharma, D.; Roberts, G.H.L.; Justice, A.E.; Banerjee, N.; Coignet, M.V.; Yadav, A.; Leader, J.B.; et al. Genome-Wide Analysis Provides Genetic Evidence That ACE2 Influences COVID-19 Risk and Yields Risk Scores Associated with Severe Disease. Nat. Genet. 2022, 54, 382–392. [Google Scholar] [CrossRef] [PubMed]
- Marengo, M.; Migliori, M.; Merlotti, G.; Fabbrini, P.; Panichi, V.; Cantaluppi, V. Role of the CD40-CD40 Ligand Pathway in Cardiovascular Events, Neurological Alterations, and Other Clinical Complications of Chronic Hemodialysis Patients: Protective Role of Adsorptive Membranes. Blood Purif. 2023, 1–16. [Google Scholar]
- Ara, A.; Ahmed, K.A.; Xiang, J. Multiple Effects of CD40–CD40L Axis in Immunity against Infection and Cancer. Immunotargets Ther. 2018, 7, 55–61. [Google Scholar] [CrossRef] [PubMed]
- GWAS Catalog. Available online: https://www.ebi.ac.uk/gwas/home (accessed on 1 August 2023).
- Onouchi, Y.; Ozaki, K.; Burns, J.C.; Shimizu, C.; Terai, M.; Hamada, H.; Honda, T.; Suzuki, H.; Suenaga, T.; Takeuchi, T.; et al. A Genome-Wide Association Study Identifies Three New Risk Loci for Kawasaki Disease. Nat. Genet. 2012, 44, 517–521. [Google Scholar] [CrossRef]
- Petrey, A.C.; Qeadan, F.; Middleton, E.A.; Pinchuk, I.V.; Campbell, R.A.; Beswick, E.J. Cytokine Release Syndrome in COVID-19: Innate Immune, Vascular, and Platelet Pathogenic Factors Differ in Severity of Disease and Sex. J. Leukoc. Biol. 2021, 109, 55–66. [Google Scholar] [CrossRef] [PubMed]
- Wang, Z.; Geng, P.L. CD32a Polymorphism Rs1801274 Affects the Risk of Kawasaki Disease. Artif. Cells Nanomed. Biotechnol. 2020, 48, 620–626. [Google Scholar] [CrossRef]
- López-Martínez, R.; Albaiceta, G.M.; Amado-Rodríguez, L.; Cuesta-Llavona, E.; Gómez, J.; García-Clemente, M.; Vázquez-Coto, D.; Alvarez, V.; Coto, E. The FCGR2A Rs1801274 Polymorphism Was Associated with the Risk of Death among COVID-19 Patients. Clin. Immunol. 2022, 236, 108954. [Google Scholar] [CrossRef]
- Shi, X.; Ma, Y.; Li, H.; Yu, H. Association between FCGR2A Rs1801274 and MUC5B Rs35705950 Variations and Pneumonia Susceptibility. BMC Med. Genet. 2020, 21, 71. [Google Scholar] [CrossRef]
- Ferdosian, F.; Dastgheib, S.A.; Hosseini-Jangjou, S.H.; Nafei, Z.; Lookzadeh, M.H.; Noorishadkam, M.; Mirjalili, S.R.; Neamatzadeh, H. Association of TNF-α Rs1800629, CASP3 Rs72689236 and FCGR2A Rs1801274 Polymorphisms with Susceptibility to Kawasaki Disease: A Comprehensive Meta-Analysis. Fetal Pediatr. Pathol. 2021, 40, 320–336. [Google Scholar] [CrossRef]
- Zhang, C.; Wang, W.; Zhang, H.; Wei, L.; Guo, S. Association of FCGR2A Rs1801274 Polymorphism with Susceptibility to Autoimmune Diseases: A Meta-Analysis. Oncotarget 2016, 7, 39436–39443. [Google Scholar] [CrossRef] [PubMed]
- Ning, X.; Wang, Y.; Jing, M.; Sha, M.; Lv, M.; Gao, P.; Zhang, R.; Huang, X.; Feng, J.M.; Jiang, Z. Apoptotic Caspases Suppress Type I Interferon Production via the Cleavage of CGAS, MAVS, and IRF3. Mol. Cell 2019, 74, 19–31.e7. [Google Scholar] [CrossRef] [PubMed]
- Premeaux, T.A.; Yeung, S.T.; Bukhari, Z.; Bowler, S.; Alpan, O.; Gupta, R.; Ndhlovu, L.C.; Tincati, C. Emerging Insights on Caspases in COVID-19 Pathogenesis, Sequelae, and Directed Therapies. Front. Immunol. 2022, 13, 842740. [Google Scholar] [CrossRef]
- Yildiz Gulhan, P.; Eroz, R.; Ataoglu, O.; İnce, N.; Davran, F.; Öztürk, C.E.; Gamsızkan, Z.; Balbay, O.A. The Evaluation of Both the Expression and Serum Protein Levels of Caspase-3 Gene in Patients with Different Degrees of SARS-CoV2 Infection. J. Med. Virol. 2022, 94, 897–905. [Google Scholar] [CrossRef] [PubMed]
- Das, K.G.; Bhattarai, D.; Kaur, A.; Kaur, A.; Kumrah, R.; Srivastava, P.; Rawat, A.; Singh, S. Association of Single Nucleotide Polymorphism Rs113420705 of CASP3 in Children with Kawasaki Disease from North India. J. Family Med. Prim. Care 2022, 11, 5404–5409. [Google Scholar] [CrossRef]

| Characteristic | Mild/Moderate COVID-19 (1) | Severe COVID-19/MIS-C (2) | Control (3) | p | |
|---|---|---|---|---|---|
| Age, years | Median (Q25; Q75) | 2.5 (1.0; 7.0) | 7.0 (2.0; 14.0) | 8.0 (5.0; 13.0) | p1–2 = 0.059 p1–3 = 0.011 * p2–3 = 0.943 |
| Min/Max | 0.2/17.0 | 0.1/17.6 | 2.0/16.0 | — | |
| Sex | Boys | 19 (63.33) | 20 (66.67) | 7 (46.67) | χ2 = 1.77; p = 0.413 |
| Girls | 11 (36.67) | 10 (33.33) | 8 (53.33) | ||
| Model | Genotype | Mild/ Moderate COVID-19 | Severe COVID-19/MIS-C | Control | χ2, p-Value | OR (95% CI) | p-Value for OR |
|---|---|---|---|---|---|---|---|
| Dominant | CC | 13 (43.33) | 8 (26.67) | 8 (53.33) | χ2 = 3.46 p = 0.177 | 0.32 (0.09–1.16) | 0.084 |
| CT−TT | 17 (56.67) | 22 (73.33) | 7 (46.67) | 3.14 (0.86–11.50) | |||
| Recessive | CC−CT | 21 (70.00) | 14 (46.67) | 12 (80.00) | χ2 = 5.28 p = 0.071 | 0.22 (0.05–0.93) | 0.041 * |
| TT | 10 (33.33) | 16 (53.33) | 3 (20.00) | 4.57 (1.07–19.57) | |||
| Overdominant | CC−TT | 23 (76.67) | 24 (80.00) | 11 (73.33) | χ2 = 0.27 p = 0.875 | 1.45 (0.34–6.22) | 0.613 |
| CT | 7 (23.33) | 6 (20.00) | 4 (24.67) | 0.69 (0.16–2.94) |
| Gene | Allele | Mild/ Moderate COVID-19 | Severe COVID-19/MIS-C | Control | χ2, p-Value | OR (95% CI) | p-Value for OR |
|---|---|---|---|---|---|---|---|
| ACE2 rs2074192 | C | 33 (55.00) | 22 (36.67) | 20 (66.67) | χ2 = 8.20; p = 0.017 * | 0.29 (0.12–0.73) | 0.009 * |
| T | 27 (45.00) | 38 (63.33) | 10 (33.33) | 3.45 (1.37–8.69) | |||
| IFNAR2 rs2236757 | G | 31 (51.67) | 26 (43.33) | 20 (66.67) | χ2 = 4.36; p = 0.113 | 0.38 (0.15–0.95) | 0.039 * |
| A | 29 (48.33) | 34 (56.67) | 10 (33.33) | 2.62 (1.05–6.53) | |||
| TYK2 rs2304256 | C | 44 (73.33) | 35 (58.33) | 23 (76.67) | χ2 = 4.40; p = 0.111 | 0.43 (0.16–1.15) | 0.091 |
| A | 16 (26.67) | 25 (41.67) | 7 (23.33) | 2.35 (0.87–6.31) | |||
| OAS1 rs10774671 | G | 27 (45.00) | 25 (41.67) | 23 (76.67) | χ2 = 10.80; p = 0.005 * | 0.22 (0.08–0.58) | 0.003 * |
| A | 33 (55.00) | 35 (58.33) | 7 (23.33) | 4.60 (1.71–12.37) | |||
| OAS3 rs10735079 | A | 40 (66.67) | 34 (56.67) | 23 (76.67) | χ2 = 3.67; p = 0.159 | 0.40 (0.15–1.07) | 0.068 |
| G | 20 (33.33) | 26 (43.33) | 7 (23.33) | 2.51 (0.94–6.75) | |||
| CD40 rs4813003 | C | 56 (93.33) | 57 (95.00) | 24 (80.00) | χ2 = 6.19; p = 0.045 * | 4.75 (1.10–20.57) | 0.037 * |
| T | 4 (6.67) | 3 (5.00) | 6 (20.00) | 0.21 (0.05–0.91) | |||
| FCGR2A rs1801274 | A | 36 (60.00) | 31 (51.67) | 21 (70.00) | χ2 = 2.85; p = 0.241 | 0.46 (0.19–1.16) | 0.100 |
| G | 24 (40.00) | 29 (48.33) | 9 (30.00) | 2.18 (0.86–5.54) | |||
| CASP3 rs113420705 | T | 28 (46.67) | 27 (45.00) | 20 (66.67) | χ2 = 4.20; p = 0.122 | 0.41 (0.165–1.02) | 0.056 |
| C | 32 (53.33) | 33 (55.00) | 10 (33.33) | 2.44 (0.98–6.10) |
| Gene | Allele | Allele Frequency | pCOVID-19-EUR | pControl-EUR | ||
|---|---|---|---|---|---|---|
| Children with COVID-19 | Healthy Children | European Population | ||||
| ACE2 rs2074192 | C | 0.46 | 0.67 | 0.55 | 0.048 * | 0.061 |
| T | 0.54 | 0.33 | 0.45 | |||
| IFNAR2 rs2236757 | G | 0.48 | 0.67 | 0.71 | <0.001 * | 0.497 |
| A | 0.52 | 0.33 | 0.29 | |||
| TYK2 rs2304256 | C | 0.66 | 0.77 | 0.72 | 0.144 | 0.390 |
| A | 0.34 | 0.23 | 0.28 | |||
| OAS1 rs10774671 | G | 0.43 | 0.77 | 0.36 | 0.110 | <0.001 * |
| A | 0.57 | 0.23 | 0.64 | |||
| OAS3 rs10735079 | A | 0.62 | 0.77 | 0.63 | 0.818 | 0.024 * |
| G | 0.38 | 0.23 | 0.37 | |||
| CD40 rs4813003 | C | 0.94 | 0.80 | 0.86 | 0.011 * | 0.342 |
| T | 0.06 | 0.20 | 0.14 | |||
| FCGR2A rs1801274 | A | 0.56 | 0.70 | 0.51 | 0.271 | 0.039 * |
| G | 0.44 | 0.30 | 0.49 | |||
| CASP3 rs113420705 | T | 0.46 | 0.67 | 0.72 | <0.001 * | 0.542 |
| C | 0.54 | 0.33 | 0.28 | |||
| Gene | Genotype/Allele | COVID-19 (n = 60) | χ2, p/ pF | Control (n = 15) | χ2, p/ pF | ||
|---|---|---|---|---|---|---|---|
| Boys | Girls | Boys | Girls | ||||
| ACE2 rs2074192 | CC | 13 (39.13) | 8 (38.10) | χ2 = 6.95; p = 0.031 * | 5 (71.43) | 3 (37.50) | χ2 = 3.45; p = 0.178 |
| CT | 5 (12.82) | 8 (38.10) | 2 (28.57) | 2 (25.00) | |||
| TT | 21 (53.85) | 5 (23.81) | 0 | 3 (37.50) | |||
| C | 31 (39.74) | 24 (57.14) | pF = 0.085 | 12 (85.71) | 8 (50.00) | pF = 0.058 | |
| T | 47 (60.26) | 18 (42.86) | 2 (14.29) | 8 (50.00) | |||
| IFNAR2 rs2236757 | GG | 12 (30.77) | 6 (28.57) | χ2 = 0.97; p = 0.615 | 4 (57.14) | 3 (37.50) | χ2 = 2.09; p = 0.352 |
| GA | 15 (38.46) | 6 (28.57) | 3 (42.86) | 3 (37.50) | |||
| AA | 12 (30.77) | 9 (42.86) | 0 | 2 (25.00) | |||
| G | 39 (50.00) | 18 (42.86) | pF = 0.566 | 11 (78.57) | 9 (56.25) | pF = 0.260 | |
| A | 39 (50.00) | 24 (57.14) | 3 (21.43) | 7 (43.75) | |||
| TYK2 rs2304256 | CC | 20 (51.28) | 8 (38.10) | χ2 = 1.25; p = 0.536 | 5 (71.43) | 4 (50.00) | χ2 = 1.25; p = 0.535 |
| CA | 13 (33.33) | 10 (47.62) | 2 (28.57) | 3 (37.50) | |||
| AA | 6 (15.38) | 3 (14.29) | 0 | 1 (12.50) | |||
| C | 53 (67.95) | 26 (61.90) | pF = 0.548 | 12 (85.71) | 11 (68.75) | pF = 0.399 | |
| A | 25 (32.05) | 16 (38.10) | 2 (14.29) | 5 (31.25) | |||
| OAS1 rs10774671 | GG | 8 (20.51) | 5 (23.81) | χ2 = 0.10; p = 0.953 | 4 (57.14) | 4 (50.00) | pF = 1.000 |
| GA | 17 (43.59) | 9 (42.86) | 3 (42.86) | 4 (50.00) | |||
| AA | 14 (35.90) | 7 (33.33) | 0 | 0 | |||
| G | 33 (42.31) | 19 (45.24) | pF = 0.847 | 11 (78.57) | 12 (75.00) | pF = 1.000 | |
| A | 45 (57.69) | 23 (54.76) | 3 (21.43) | 4 (25.00) | |||
| OAS3 rs10735079 | AA | 19 (48.72) | 9 (42.86) | χ2 = 1.06; p = 0.588 | 4 (57.14) | 6 (75.00) | χ2 = 0.67; p = 0.715 |
| AG | 10 (25.64) | 8 (38.10) | 2 (28.57) | 1 (12.50) | |||
| GG | 10 (25.64) | 4 (19.05) | 1 (14.29) | 1 (12.50) | |||
| A | 48 (61.54) | 26 (61.90) | pF = 1.000 | 10 (71.43) | 13 (81.25) | pF = 0.675 | |
| G | 30 (38.46) | 16 (38.10) | 4 (28.57) | 3 (18.75) | |||
| CD40 rs4813003 | CC | 34 (87.18) | 19 (90.48) | pF = 1.000 | 5 (71.43) | 5 (62.50) | χ2 = 1.94; p = 0.379 |
| CT | 5 (12.82) | 2 (9.52) | 1 (14.29) | 3 (37.50) | |||
| TT | 0 | 0 | 1 (14.29) | 0 | |||
| C | 73 (93.59) | 40 (95.24) | pF = 1.000 | 11 (78.57) | 13 (81.25) | pF = 1.000 | |
| T | 5 (6.41) | 2 (4.76) | 3 (21.43) | 3 (18.75) | |||
| FCGR2A rs1801274 | AA | 12 (30.77) | 10 (47.62) | χ2 = 3.00; p = 0.223 | 5 (71.43) | 3 (37.50) | χ2 = 2.65; p = 0.266 |
| AG | 18 (46.15) | 5 (23.81) | 2 (28.57) | 3 (37.50) | |||
| GG | 9 (23.08) | 6 (28.57) | 0 | 2 (25.00) | |||
| A | 42 (53.85) | 25 (59.52) | pF = 0.570 | 12 (85.71) | 9 (56.25) | pF = 0.118 | |
| G | 36 (46.15) | 17 (40.48) | 2 (14.29) | 7 (43.75) | |||
| CASP3 rs113420705 | TT | 3 (7.69) | 3 (14.29) | χ2 = 2.05; p = 0.358 | 4 (57.14) | 3 (37.50) | χ2 = 0.75; p = 0.687 |
| TC | 27 (69.23) | 16 (76.19) | 2 (28.57) | 4 (50.00) | |||
| CC | 9 (23.08) | 2 (9.52) | 1 (14.29) | 1 (12.50) | |||
| T | 33 (42.31) | 22 (52.38) | pF = 0.339 | 10 (71.43) | 10 (62.50) | pF = 0.709 | |
| C | 45 (57.69) | 20 (47.62) | 4 (28.57) | 6 (37.50) | |||
| Model | Genotype | Mild/ Moderate COVID-19 | Severe COVID-19/MIS-C | Control | χ2, p-Value | OR (95% CI) | p-Value for OR |
|---|---|---|---|---|---|---|---|
| Dominant | GG | 10 (33.33) | 8 (26.67) | 7 (46.67) | χ2 = 1.80 p = 0.406 | 0.42 (0.11–1.52) | 0.185 |
| GA-AA | 20 (66.67) | 22 (73.33) | 8 (53.33) | 2.41 (0.66–8.81) | |||
| Recessive | GG-GA | 21 (70.00) | 18 (60.00) | 13 (86.67) | χ2 = 3.54 p = 0.187 | 0.23 (0.04–1.21) | 0.083 |
| AA | 9 (30.00) | 12 (40.00) | 2 (13.33) | 4.33 (0.83–22.75) | |||
| Overdominant | GG-AA | 19 (63.33) | 20 (66.67) | 9 (60.00) | χ2 = 0.20 p = 0.904 | 1.33 (0.37–4.80) | 0.660 |
| GA | 11 (36.67) | 10 (33.33) | 6 (40.00) | 0.75 (0.21–2.70) |
| Model | Genotype | Mild/ Moderate COVID-19 | Severe COVID-19/MIS-C | Control | χ2, p-Value | OR (95% CI) | p-Value for OR |
|---|---|---|---|---|---|---|---|
| Dominant | CC | 17 (56.67) | 11 (36.67) | 9 (60.00) | χ2 = 3.26 p = 0.197 | 0.39 (0.11–1.38) | 0.143 |
| CA−AA | 13 (43.33) | 19 (63.33) | 6 (40.00) | 2.59 (0.73–9.25) | |||
| Recessive | CC−CA | 27 (90.00) | 24 (80.00) | 14 (93.33) | χ2 = 2.02 p = 0.364 | 0.29 (0.03–2.62) | 0.268 |
| AA | 3 (10.00) | 6 (20.00) | 1 (6.67) | 3.50 (0.38–32.14) | |||
| Overdominant | CC−AA | 20 (66.67) | 17 (56.67) | 10 (66.67) | χ2 = 0.77 p = 0.681 | 0.65 (0.18–2.38) | 0.520 |
| CA | 10 (33.33) | 13 (43.33) | 5 (33.33) | 1.53 (0.42–5.58) |
| Model | Genotype | Mild/ Moderate COVID-19 | Severe COVID-19/MIS-C | Control | χ2, p-Value | OR (95% CI) | p-Value for OR |
|---|---|---|---|---|---|---|---|
| Dominant | GG | 8 (26.67) | 5 (16.67) | 8 (53.33) | χ2 = 6.71 p = 0.035 * | 0.18 (0.04–0.71) | 0.015 * |
| GA−AA | 22 (73.33) | 25 (83.33) | 7 (46.67) | 5.71 (1.41–23.10) | |||
| Recessive | GG−GA | 19 (63.33) | 20 (66.67) | 15 (100.00) | χ2 = 7.37 p = 0.025 * | 0.06 (0.01–1.16) | 0.063 |
| AA | 11 (36.67) | 10 (33.33) | 0 | 15.88 (0.86–292.28) | |||
| Overdominant | GG−AA | 19 (63.33) | 15 (50.00) | 8 (53.33) | χ2 = 1.14 p = 0.567 | 0.88 (0.25–3.03) | 0.833 |
| GA | 11 (36.67) | 15 (50.00) | 7 (46.67) | 1.14 (0.33–3.96) |
| Model | Genotype | Mild/ Moderate COVID-19 | Severe COVID-19/MIS-C | Control | χ2, p-Value | OR (95% CI) | p-Value for OR |
|---|---|---|---|---|---|---|---|
| Dominant | AA | 16 (53.33) | 12 (40.00) | 10 (66.67) | χ2 = 2.99 p = 0.225 | 0.33 (0.09–1.22) | 0.098 |
| AG−GG | 14 (46.67) | 18 (60.00) | 5 (33.33) | 3.00 (0.82–10.99) | |||
| Recessive | AA−AG | 24 (80.00) | 22 (73.33) | 13 (86.67) | χ2 = 1.11 p = 0.573 | 0.42 (0.08–2.30) | 0.320 |
| GG | 6 (20.00) | 8 (26.67) | 2 (13.33) | 2.36 (0.43–12.87) | |||
| Overdominant | AA−GG | 22 (73.33) | 20 (66.67) | 12 (80.00) | χ2 = 0.93 p = 0.629 | 0.50 (0.11–2.19) | 0.357 |
| AG | 8 (26.67) | 10 (33.33) | 3 (20.00) | 2.00 (0.46–8.75) |
| Model | Genotype | Mild/ Moderate COVID-19 | Severe COVID-19/MIS-C | Control | χ2, p-Value | OR (95% CI) | p-Value for OR |
|---|---|---|---|---|---|---|---|
| Dominant | CC | 26 (86.67) | 27 (90.00) | 10 (66.67) | χ2 = 4.32 p = 0.116 | 4.50 (0.90–22.40) | 0.066 |
| CT-TT | 4 (13.33) | 3 (10.00) | 5 (33.33) | 0.22 (0.04–1.11) | |||
| Recessive | CC-CT | 30 (100.00) | 30 (100.00) | 14 (93.33) | χ2 = 4.05 p = 0.132 | 6.31 (0.24–164.57) | 0.268 |
| TT | 0 | 0 | 1 (6.67) | 0.16 (0.01–4.13) | |||
| Overdominant | CC-TT | 26 (86.67) | 27 (90.00) | 11 (73.33) | χ2 = 2.29 p = 0.318 | 3.27 (0.63–17.09) | 0.160 |
| CT | 4 (13.33) | 3 (10.00) | 4 (26.67) | 0.31 (0.06–1.60) |
| Model | Genotype | Mild/ Moderate COVID-19 | Severe COVID-19/MIS-C | Control | χ2, p-Value | OR (95% CI) | p-Value for OR |
|---|---|---|---|---|---|---|---|
| Dominant | AA | 12 (40.00) | 10 (33.33) | 8 (53.33) | χ2 = 1.67 p = 0.435 | 0.44 (0.12–1.55) | 0.201 |
| AG + GG | 18 (60.00) | 20 (66.67) | 7 (46.67) | 2.29 (0.64–8.11) | |||
| Recessive | AA + AG | 24 (80.00) | 21 (70.00) | 13 (86.67) | χ2 = 1.79 p = 0.409 | 0.36 (0.07–1.93) | 0.232 |
| GG | 6 (20.00) | 9 (30.00) | 2 (13.33) | 2.79 (0.52–14.96) | |||
| Overdominant | AA + GG | 18 (60.00) | 19 (63.33) | 10 (66.67) | χ2 = 0.20 p = 0.905 | 0.86 (0.23–3.19) | 0.826 |
| AG | 12 (40.00) | 11 (36.67) | 5 (33.33) | 1.16 (0.31–4.27) |
| Model | Genotype | Mild/ Moderate COVID-19 | Severe COVID-19/MIS-C | Control | χ2, p-Value | OR (95% CI) | p-Value for OR |
|---|---|---|---|---|---|---|---|
| Dominant | TT | 3 (10.00) | 3 (10.00) | 7 (46.67) | χ2 = 11.26 p = 0.004 * | 0.13 (0.03–0.61) | 0.010 * |
| TC + CC | 27 (90.00) | 27 (90.00) | 8 (53.33) | 7.88 (1.65–37.69) | |||
| Recessive | TT + TC | 25 (83.33) | 24 (80.00) | 13 (86.67) | χ2 = 0.33 p = 0.850 | 0.62 (0.11–3.50) | 0.584 |
| CC | 5 (16.67) | 6 (20.00) | 2 (13.33) | 1.63 (0.29–9.23) | |||
| Overdominant | TT + CC | 8 (26.67) | 9 (30.00) | 9 (30.00) | χ2 = 5.39 p = 0.068 | 0.29 (0.08–1.04) | 0.058 |
| TC | 22 (73.33) | 21 (70.00) | 6 (40.00) | 3.50 (0.96–12.78) |
| Combination of Risk Alleles | COVID-19 | Control | p | χ2, p |
|---|---|---|---|---|
| 1 risk alleles | 0 | 0 | p < 0.001 * | χ2 = 24.40; p < 0.001 * |
| 2 risk alleles | 0 | 2 (13.33) | ||
| 3 risk alleles | 1 (1.67) | 4 (26.67) | ||
| 4 risk alleles | 10 (16.67) | 3 (20.00) | p = 0.750 | |
| 5 risk alleles | 14 (23.33) | 2 (13.33) | ||
| 6 risk alleles | 17 (28.33) | 4 (26.67) | ||
| 7 risk alleles | 14 (23.33) | 0 | p = 0.034 * | |
| 8 risk alleles | 4 (6.67) | 0 |
| Variable | B | S.E. | Wald | df | p | Exp (B) | 95% CI for Exp (B) | |
|---|---|---|---|---|---|---|---|---|
| Lower | Upper | |||||||
| Constant | 4.33 | 1.28 | 11.44 | 1 | 0.001 * | 75.77 | ||
| Sex Male/Female | 1.01 | 0.53 | 3.63 | 1 | 0.057 | 2.73 | 0.97 | 7.70 |
| ACE2 rs2074192 C/T | −1.05 | 0.54 | 3.73 | 1 | 0.053 | 0.35 | 0.12 | 1.02 |
| IFNAR2 rs2236757 G/A | −1.19 | 0.58 | 4.15 | 1 | 0.042 * | 0.31 | 0.10 | 0.96 |
| TYK2 rs2304256 C/A | −0.32 | 0.63 | 0.26 | 1 | 0.611 | 0.73 | 0.21 | 2.51 |
| OAS1 rs10774671 G/A | −2.14 | 0.62 | 12.02 | 1 | 0.001 * | 0.12 | 0.04 | 0.40 |
| OAS3 rs10735079 A/G | −1.26 | 0.63 | 4.00 | 1 | 0.046 * | 0.28 | 0.08 | 0.98 |
| CD40 rs4813003 C/T | 1.99 | 0.82 | 5.93 | 1 | 0.015 * | 7.30 | 1.47 | 36.14 |
| FCGR2A rs1801274 A/G | −0.40 | 0.55 | 0.51 | 1 | 0.475 | 0.67 | 0.23 | 1.99 |
| CASP3 rs113420705 T/C | −2.33 | 0.64 | 13.11 | 1 | <0.001 * | 0.10 | 0.03 | 0.34 |
| Variable | B | S.E. | Wald | df | p | Exp (B) | 95% CI for Exp (B) | |
|---|---|---|---|---|---|---|---|---|
| Lower | Upper | |||||||
| Constant | 2.54 | 1.61 | 2.51 | 1 | 0.113 | 12.71 | ||
| Sex Male/Female | 2.68 | 1.05 | 6.48 | 1 | 0.011 * | 14.59 | 1.85 | 114.80 |
| ACE2 rs2074192 C/T | −2.08 | 0.86 | 5.82 | 1 | 0.016 * | 0.13 | 0.02 | 0.68 |
| IFNAR2 rs2236757 G/A | −2.98 | 1.06 | 7.86 | 1 | 0.005 * | 0.05 | 0.01 | 0.41 |
| TYK2 rs2304256 C/A | −0.65 | 0.93 | 0.49 | 1 | 0.486 | 0.52 | 0.08 | 3.24 |
| OAS1 rs10774671 G/A | −2.47 | 0.98 | 6.33 | 1 | 0.012 * | 0.09 | 0.01 | 0.58 |
| OAS3 rs10735079 A/G | −1.20 | 0.82 | 2.15 | 1 | 0.143 | 0.30 | 0.06 | 1.50 |
| CD40 rs4813003 C/T | 5.58 | 1.93 | 8.36 | 1 | 0.004 * | 264.57 | 6.03 | 11,601.05 |
| FCGR2A rs1801274 A/G | −1.19 | 0.89 | 1.78 | 1 | 0.182 | 0.31 | 0.05 | 1.74 |
| CASP3 rs113420705 T/C | −3.72 | 1.11 | 11.31 | 1 | 0.001 * | 0.02 | 0.01 | 0.21 |
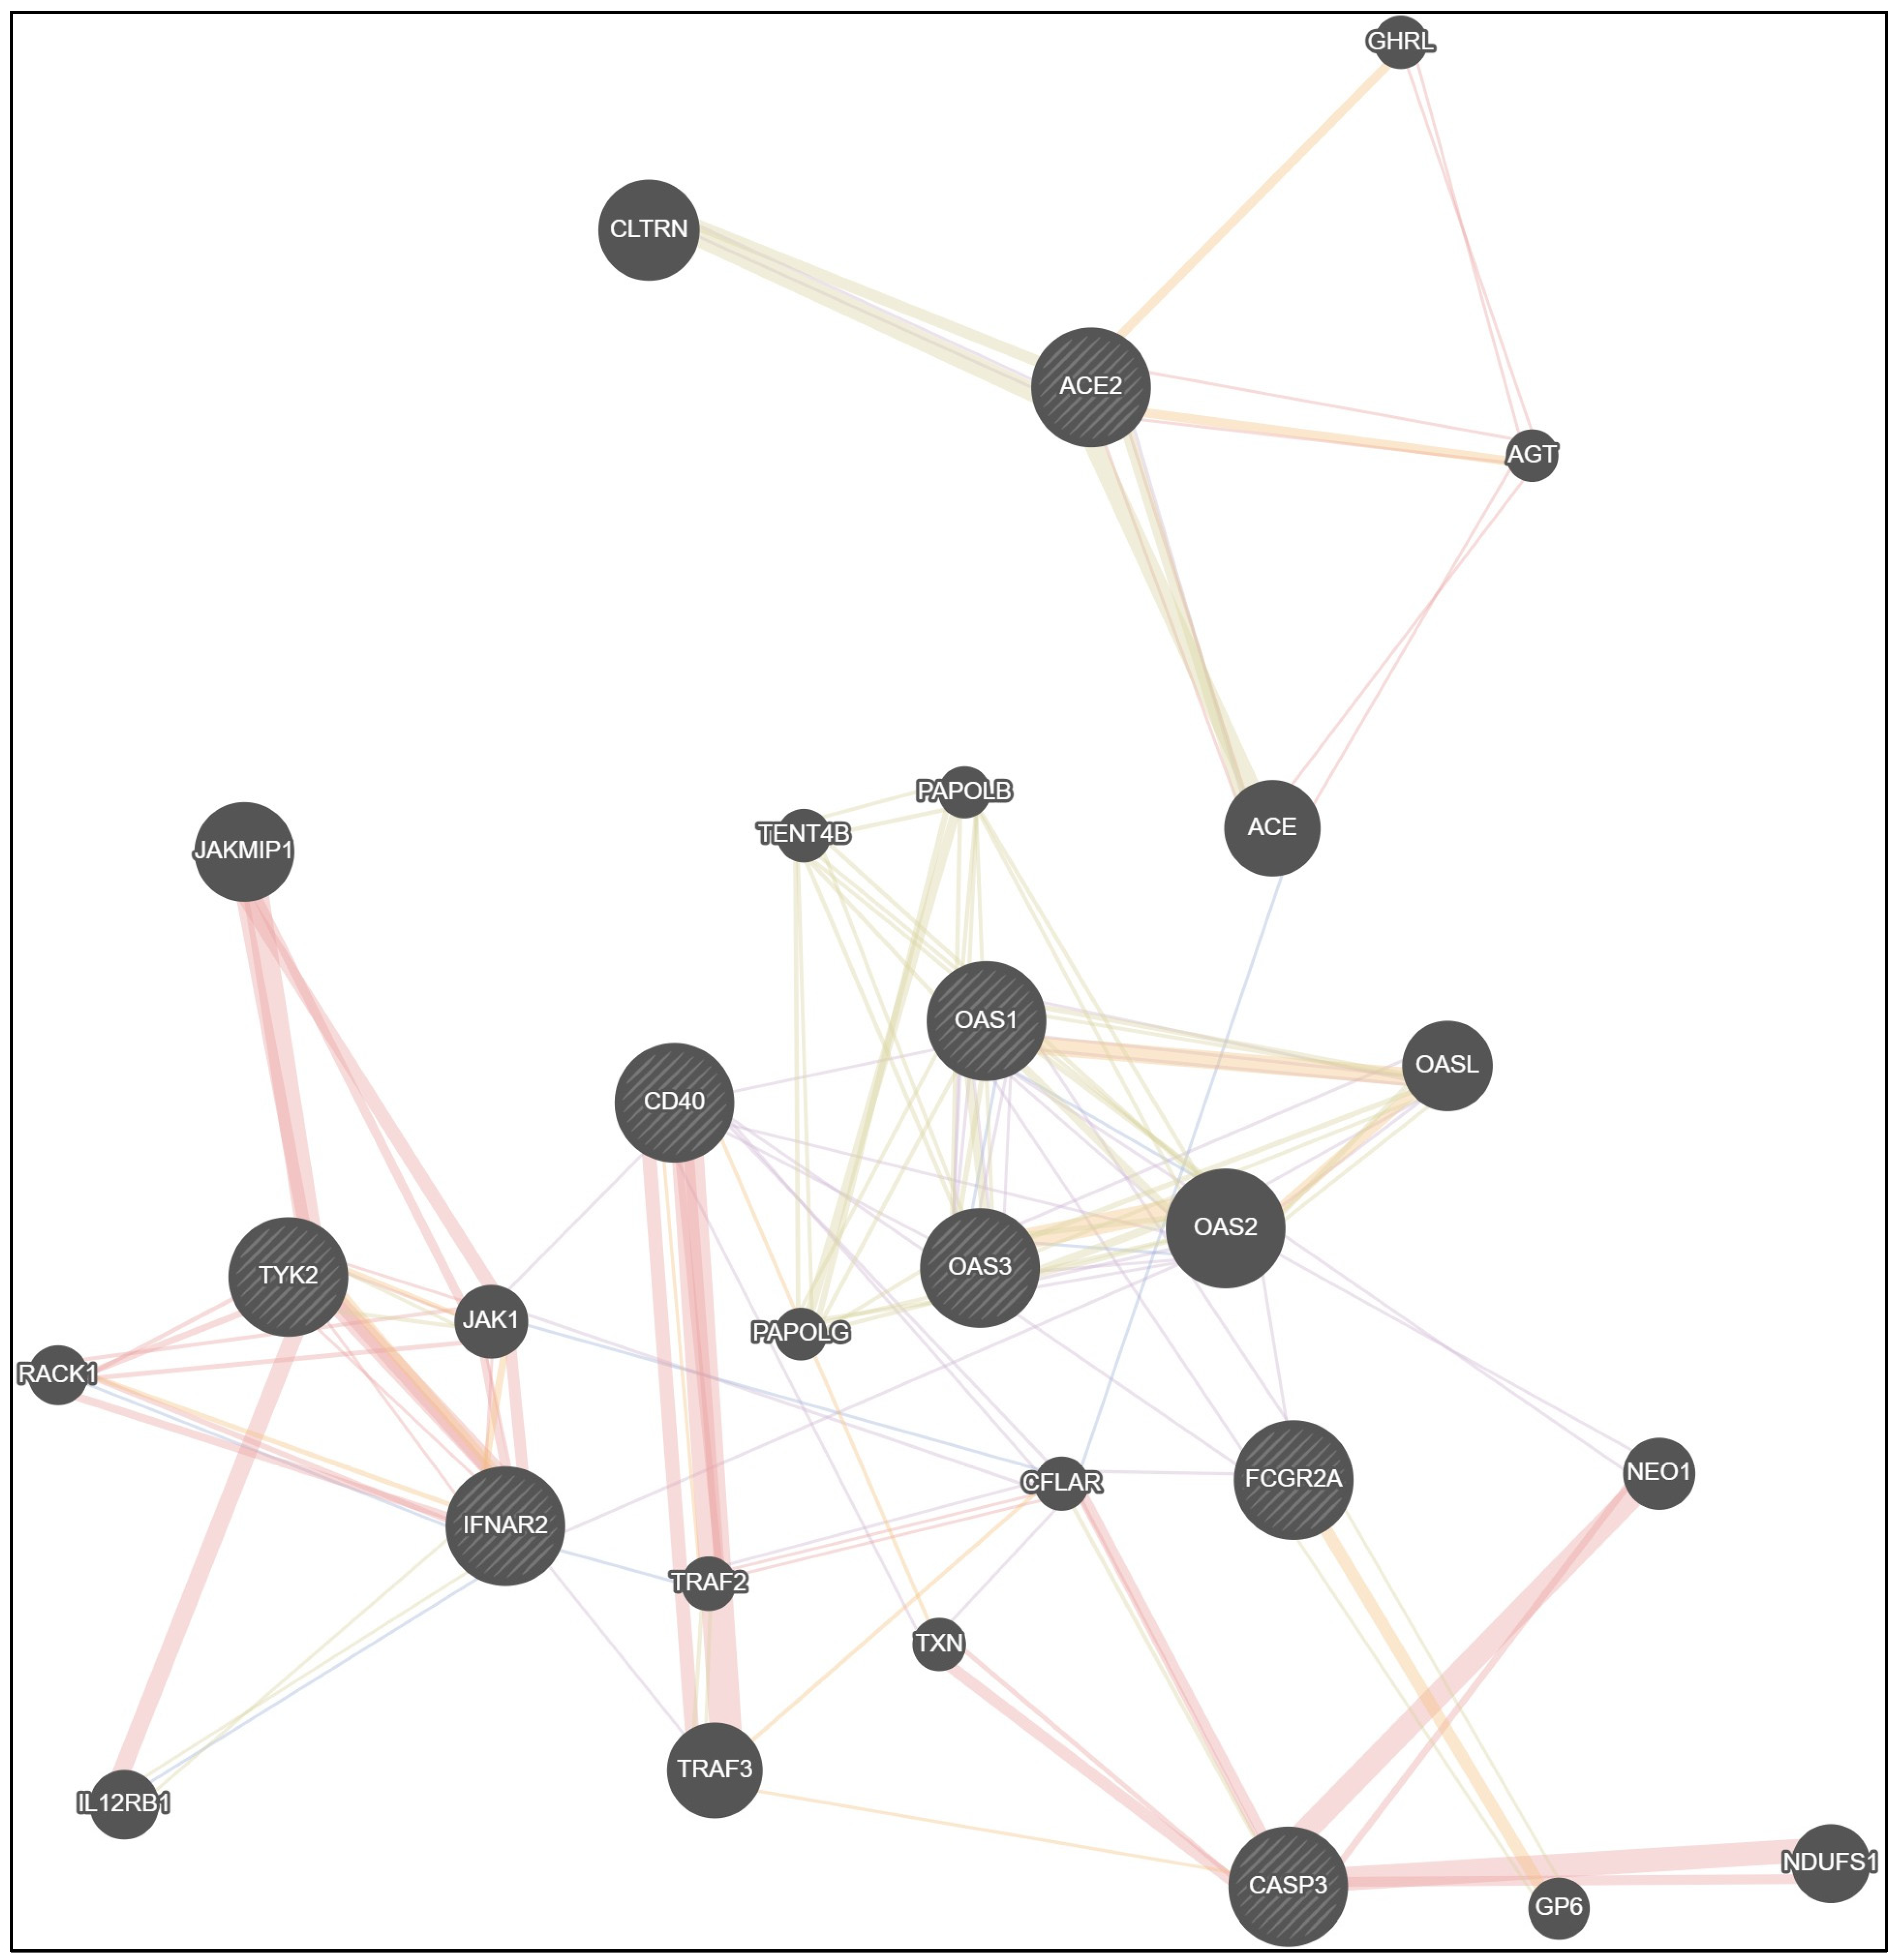
| Co-Expression | Physical Interactions | Shared Protein Domains | Co-Localization | Predicted Functional Relationships |
|---|---|---|---|---|
| ACE2—ACE | ACE2—ACE | ACE2—ACE | ACE—CFLAR | ACE2—AGT |
| ACE2—CLTRN | ACE2—AGT | ACE2—CLTRN | IFNAR2—IL12RB1 | ACE2—GHRL |
| IFNAR2—TRAF3 | AGT—ACE | IFNAR2—IL12RB1 | IFNAR2—RACK1 | IFNAR2—JAK1 |
| OAS1—OAS3 | IFNAR2—TYK2 | TYK2—JAK1 | IFNAR2—TRAF2 | IFNAR2—TYK2 |
| OAS1—OAS2 | IFNAR2—JAK1 | OAS1—OAS3 | OAS1—OAS3 | TYK2—JAK1 |
| OAS1—OASL | IFNAR2—RACK1 | OAS1—OAS2 | OAS1—OAS2 | IFNAR2—RACK1 |
| OAS1—FCGR2A | TYK2—JAK1 | OAS1—OASL | OAS3—OAS2 | OAS1—OASL |
| OAS2—OAS3 | TYK2—RACK1 | OAS2—OASL | JAK1—CFLAR | OAS3—OAS2 |
| OAS2—OASL | TYK2—IL12RB1 | OAS3—OASL | OAS2—OASL | |
| OAS2—IFNAR2 | TYK2—JAKMIP1 | OAS3—OAS2 | FCGR2A—GP6 | |
| OAS2—NEO1 | JAKMIP1—JAK1 | OAS1—TENT4B | CD40—TRAF2 | |
| OAS2—FCGR2A | RACK1—JAK1 | OAS2—TENT4B | CD40—TXN | |
| FCGR2A—CFLAR | CD40—TRAF2 | OAS3—TENT4B | CASP3—TRAF3 | |
| FCGR2A—CD40 | CD40—TRAF3 | OAS1—PAPOLG | TRAF3—CFLAR | |
| CD40—JAK1 | CASP3—NDUFS1 | OAS2—PAPOLG | ||
| CD40—TXN | CASP3—NEO1 | OAS3—PAPOLG | ||
| CD40—OAS1 | CASP3—TXN | OAS1—PAPOLB | ||
| CD40—OAS3 | CASP3—CFLAR | OAS2—PAPOLB | ||
| CD40—CFLAR | CFLAR—TRAF2 | OAS3—PAPOLB | ||
| CFLAR—JAK1 | PAPOLG—TENT4B | |||
| CFLAR—TXN | PAPOLB—TENT4B | |||
| CFLAR—TRAF2 | PAPOLB—PAPOLG | |||
| FCGR2A—GP6 | ||||
| CASP3—CFLAR | ||||
| TRAF2—TRAF3 |
Disclaimer/Publisher’s Note: The statements, opinions and data contained in all publications are solely those of the individual author(s) and contributor(s) and not of MDPI and/or the editor(s). MDPI and/or the editor(s) disclaim responsibility for any injury to people or property resulting from any ideas, methods, instructions or products referred to in the content. |
© 2023 by the authors. Licensee MDPI, Basel, Switzerland. This article is an open access article distributed under the terms and conditions of the Creative Commons Attribution (CC BY) license (https://creativecommons.org/licenses/by/4.0/).
Share and Cite
Kozak, K.; Pavlyshyn, H.; Kamyshnyi, O.; Shevchuk, O.; Korda, M.; Vari, S.G. The Relationship between COVID-19 Severity in Children and Immunoregulatory Gene Polymorphism. Viruses 2023, 15, 2093. https://doi.org/10.3390/v15102093
Kozak K, Pavlyshyn H, Kamyshnyi O, Shevchuk O, Korda M, Vari SG. The Relationship between COVID-19 Severity in Children and Immunoregulatory Gene Polymorphism. Viruses. 2023; 15(10):2093. https://doi.org/10.3390/v15102093
Chicago/Turabian StyleKozak, Kateryna, Halyna Pavlyshyn, Oleksandr Kamyshnyi, Oksana Shevchuk, Mykhaylo Korda, and Sandor G. Vari. 2023. "The Relationship between COVID-19 Severity in Children and Immunoregulatory Gene Polymorphism" Viruses 15, no. 10: 2093. https://doi.org/10.3390/v15102093
APA StyleKozak, K., Pavlyshyn, H., Kamyshnyi, O., Shevchuk, O., Korda, M., & Vari, S. G. (2023). The Relationship between COVID-19 Severity in Children and Immunoregulatory Gene Polymorphism. Viruses, 15(10), 2093. https://doi.org/10.3390/v15102093