


Expression of Toll-like Receptors on the Immune Cells in Patients with Common Variable Immune Deficiency after Different Schemes of Influenza Vaccination
 ,
, 
Abstract
1. Introduction
2. Materials and Methods
2.1. Participants
2.2. Inclusion Criteria
- Confirmed diagnosis of CVID in accordance with diagnostic criteria established by the European Society for Immunodeficiency Diseases and the American Academy of Allergy, Asthma and Immunology for the diagnosis and treatment of IEI.
- IVIG therapy no later than 28 days before vaccination and no earlier than 21 days after it; that is, there was a break between two subsequent administrations of immunoglobulins of at least 7 weeks.
- Signed informed consent.
- Excluded causes of secondary hypogammaglobulinemia.
- No symptoms of flu or flu-like illness in the past six months.
- No glucocorticosteroid or other immunosuppressive therapy admission at the time of the study and 3 months before the start.
- The absence of symptoms of protein-losing enteropathy as well as any suspicion of oncological or lymphoproliferative disease in patients with CVID at the time of the study.
- No level of specific antiviral antibodies in protective titers (>1:40) in pre-vaccination blood samples.
- Individuals with cognitive or behavioral impairments, psychiatric disorders, or alcohol abusers that could preclude participation in the study were excluded.
- Vaccination against any other infections within 1.5–2 months prior to enrollment in the study.
- All contraindications for use in accordance with the instructions (a history of allergy to egg whites or any component of the study vaccine, symptoms of acute infection at the time of vaccination, pregnancy, etc.) were followed.
2.3. Vaccination Schemes
2.4. Used Vaccines
2.5. Methods
2.6. Statistics
3. Results
3.1. Comparing the Content of TLR3, TLR8, and TLR9 in Patients with CVID after the Primary Vaccination and a Year Later with One Dose of the Quadrivalent Vaccine
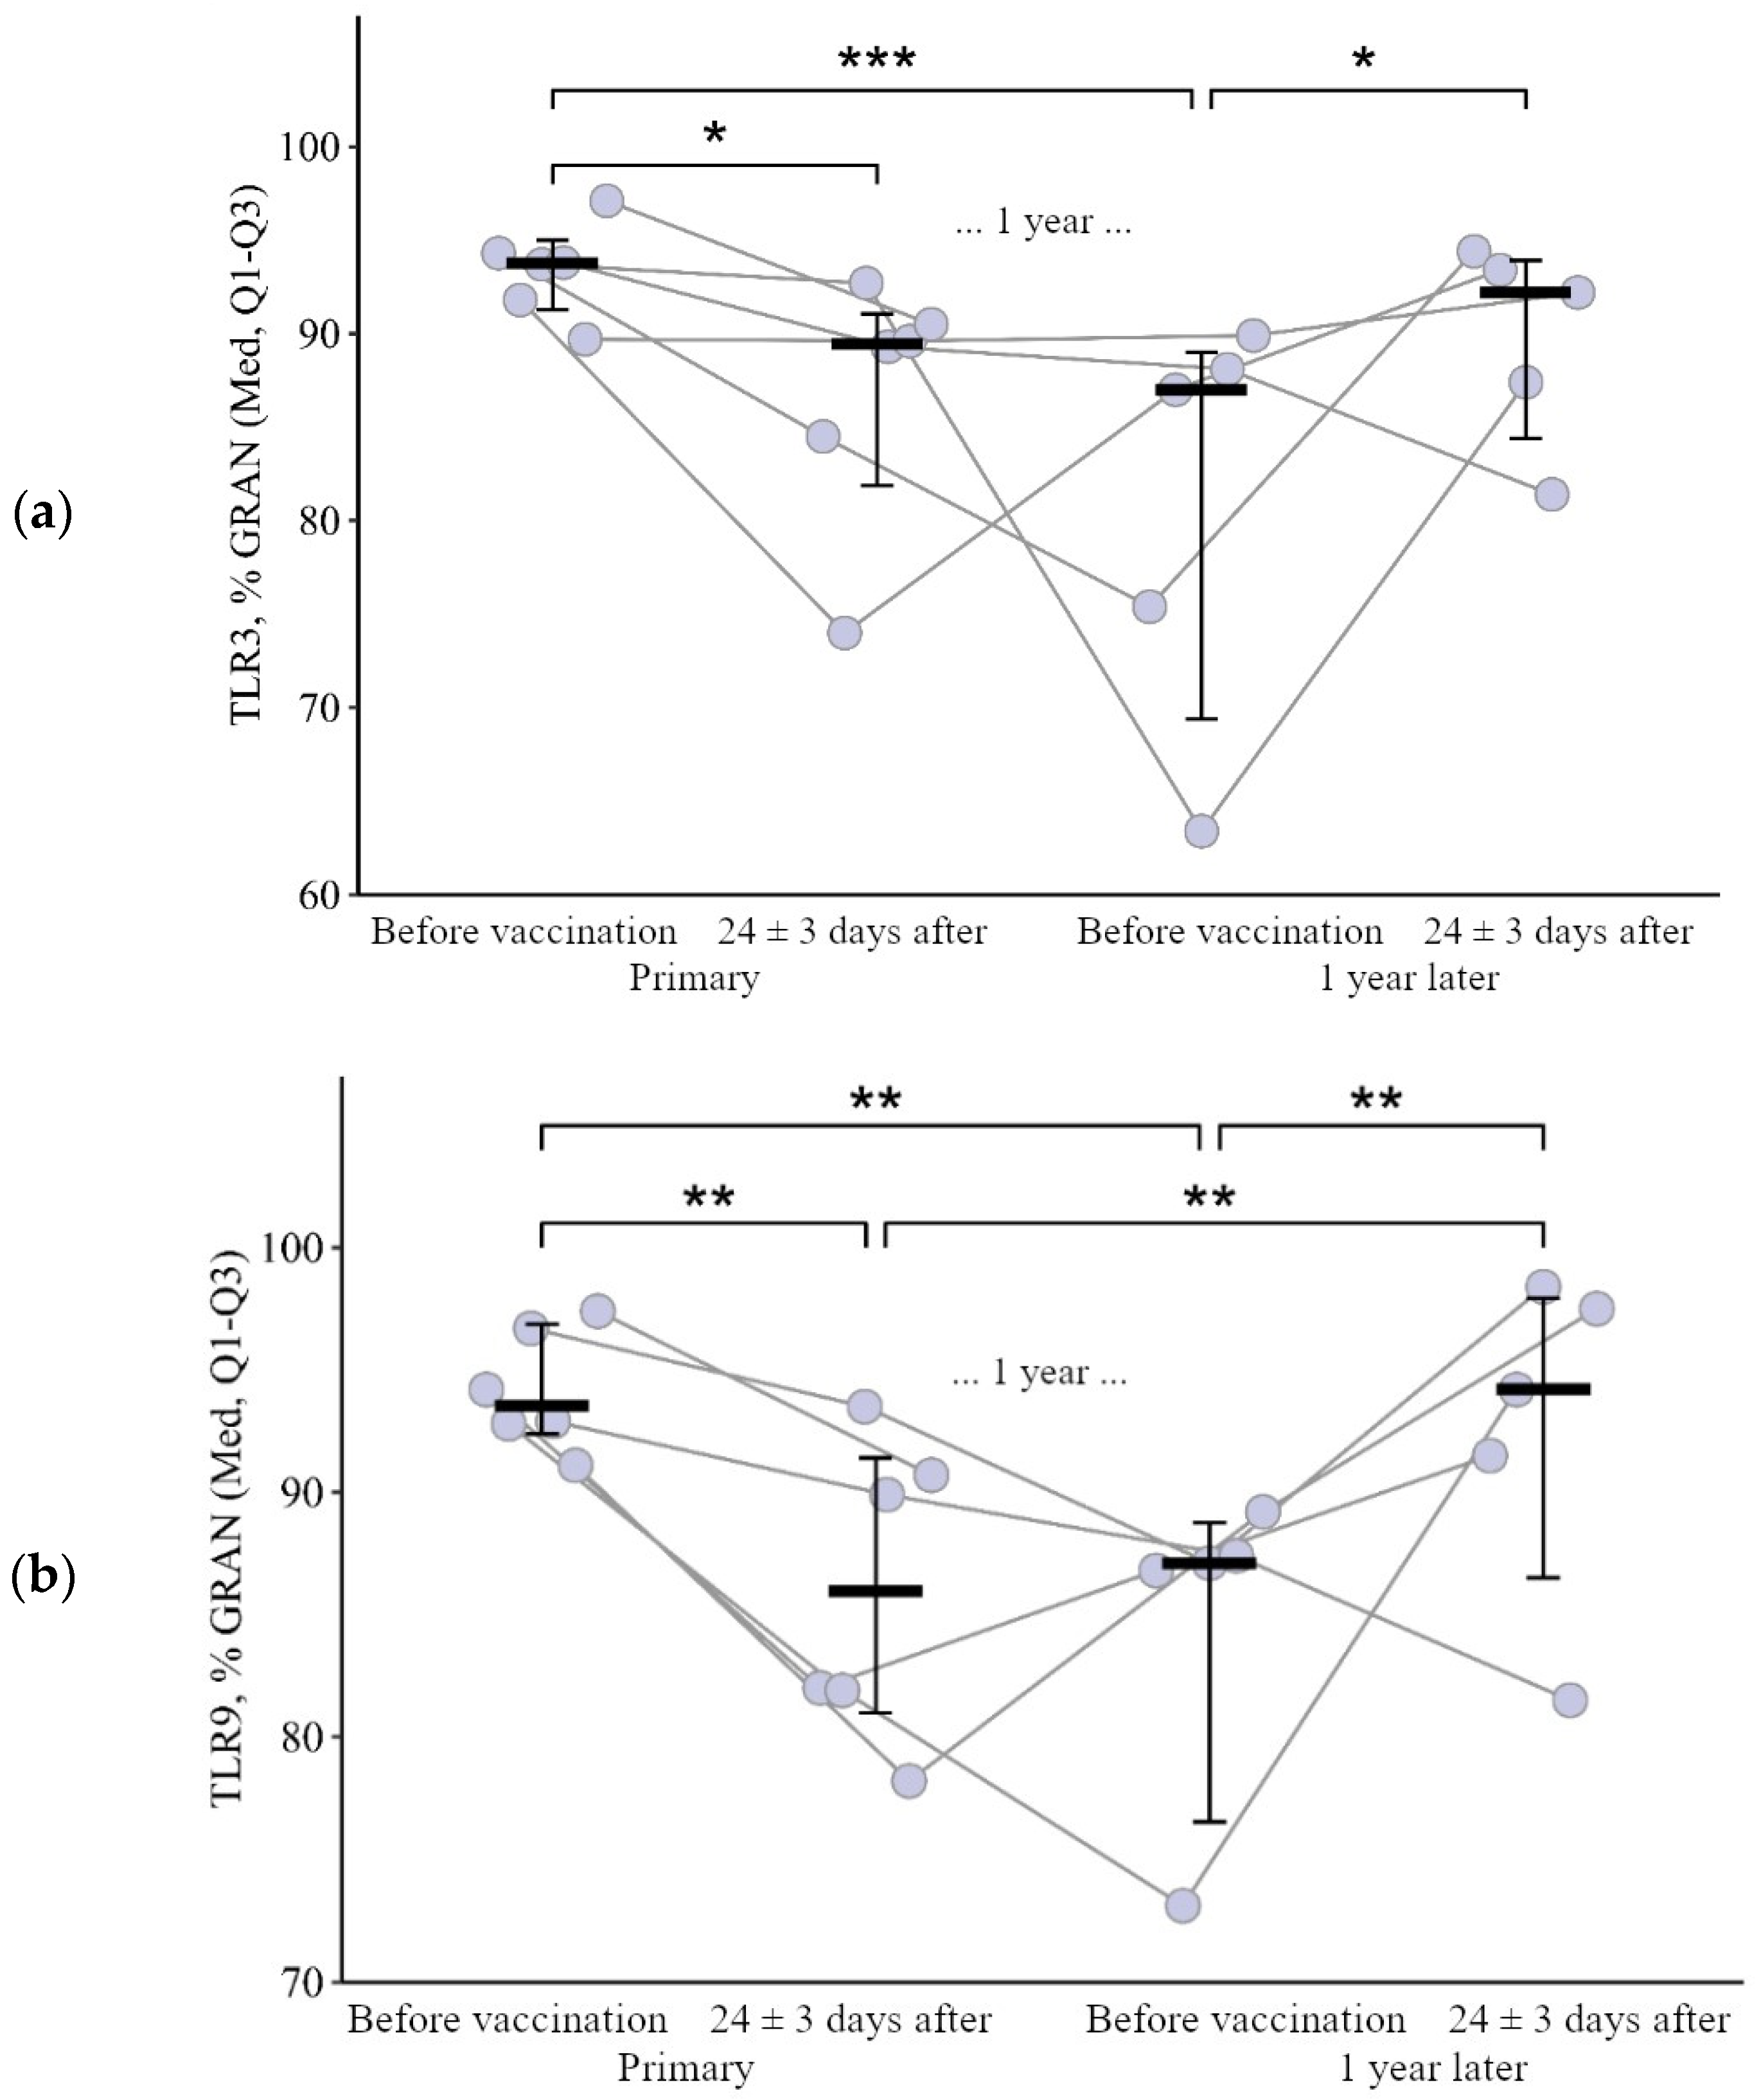
3.1.1. Granulocytes
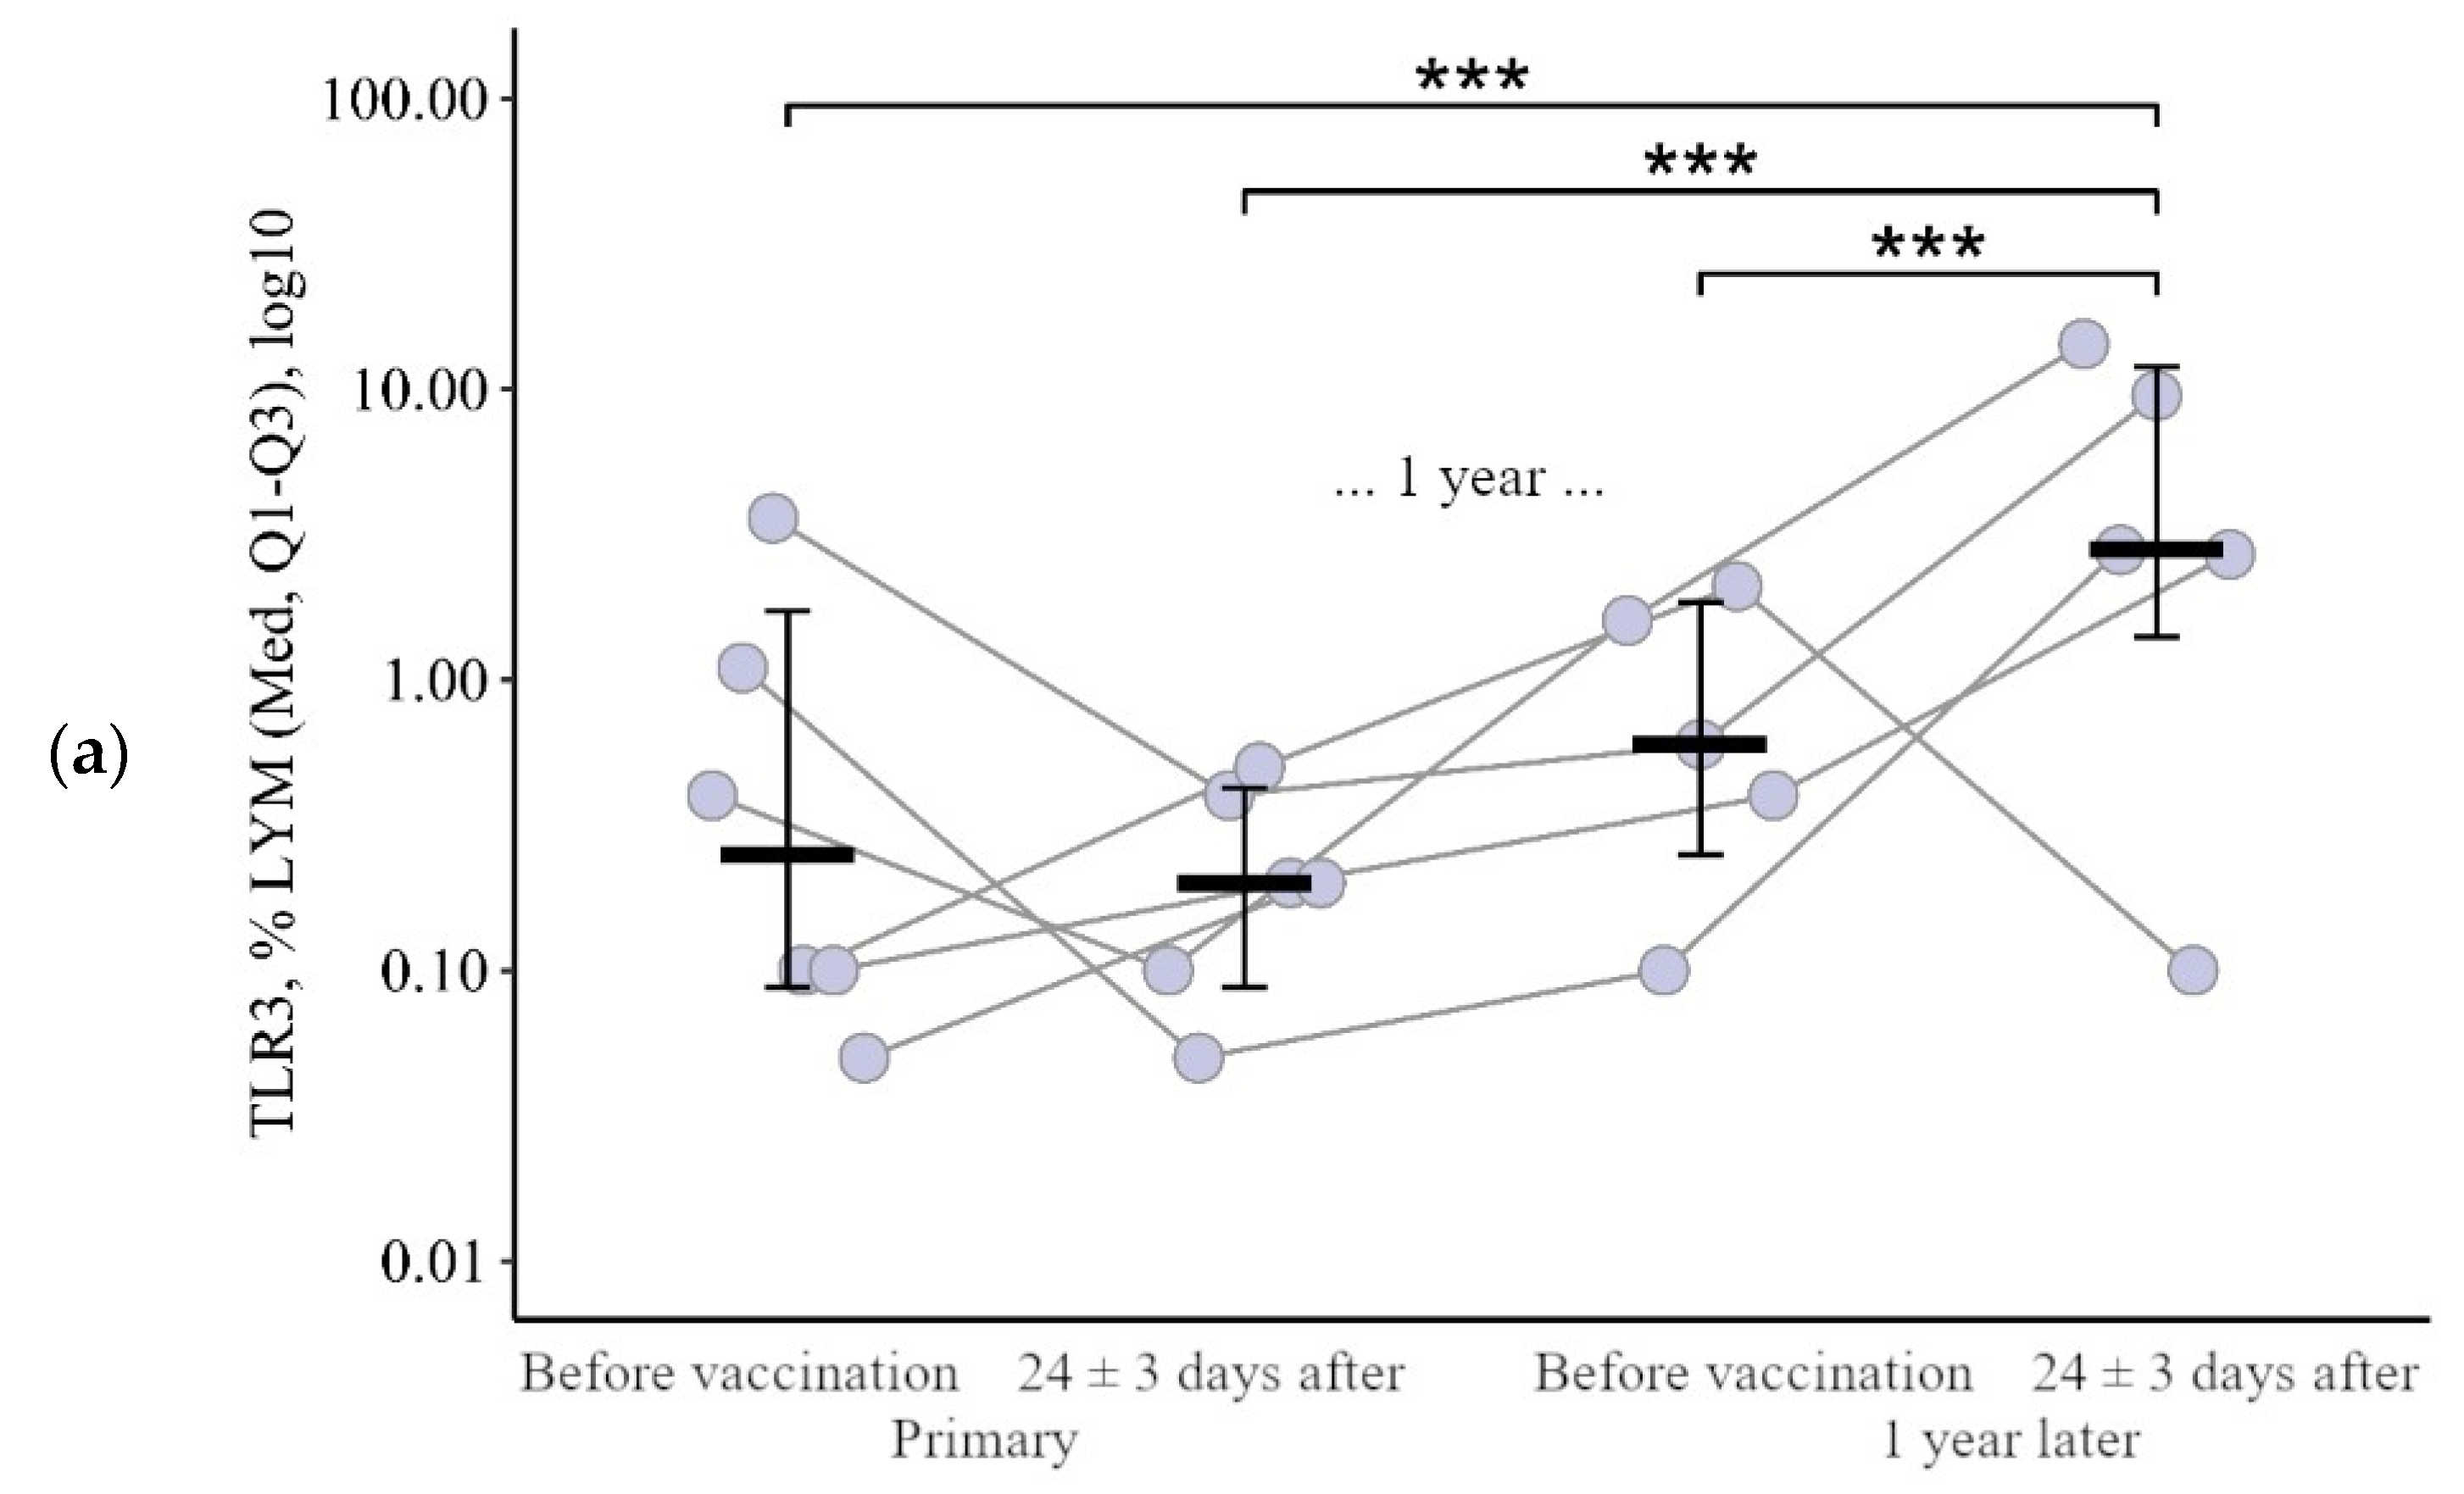
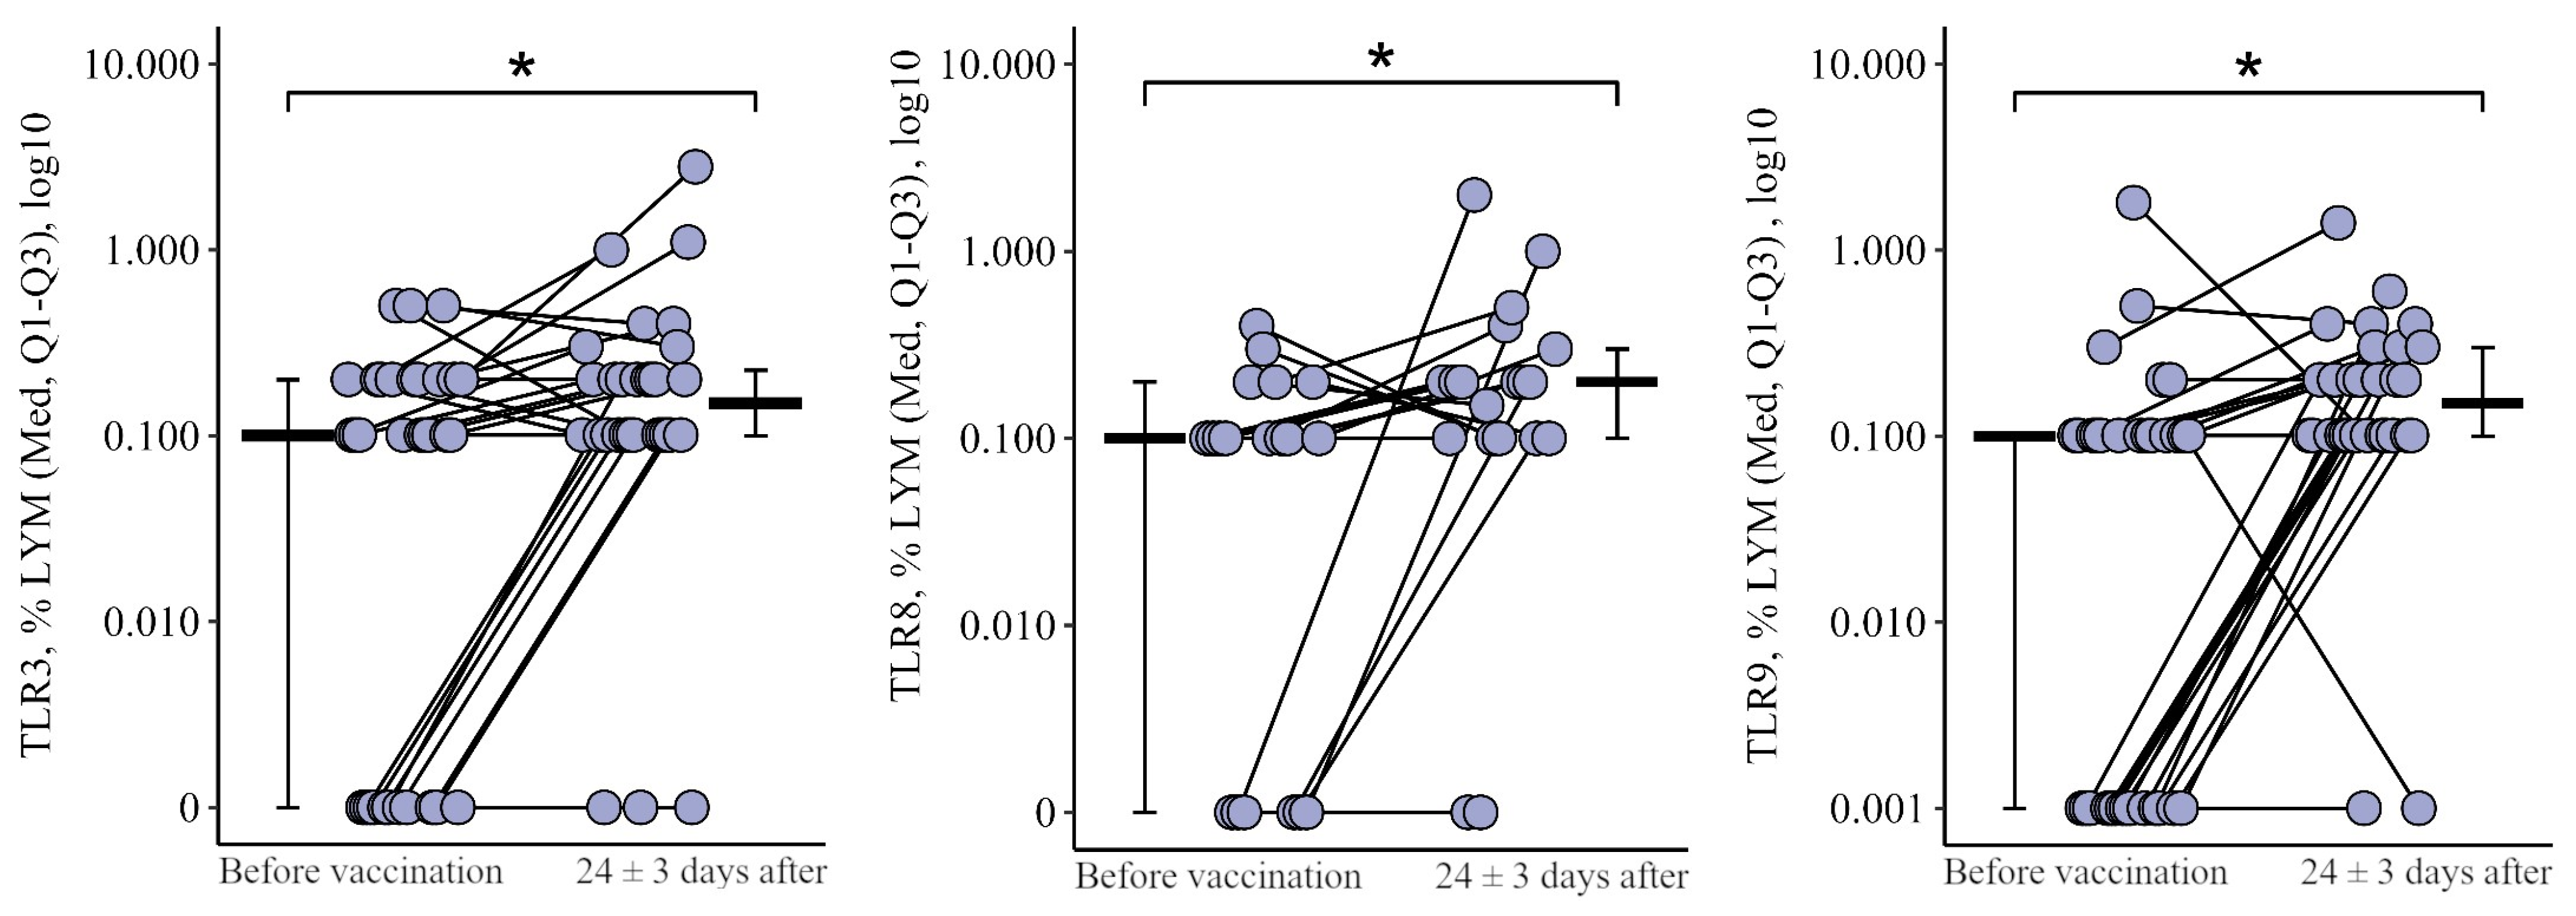
3.1.2. Lymphocytes
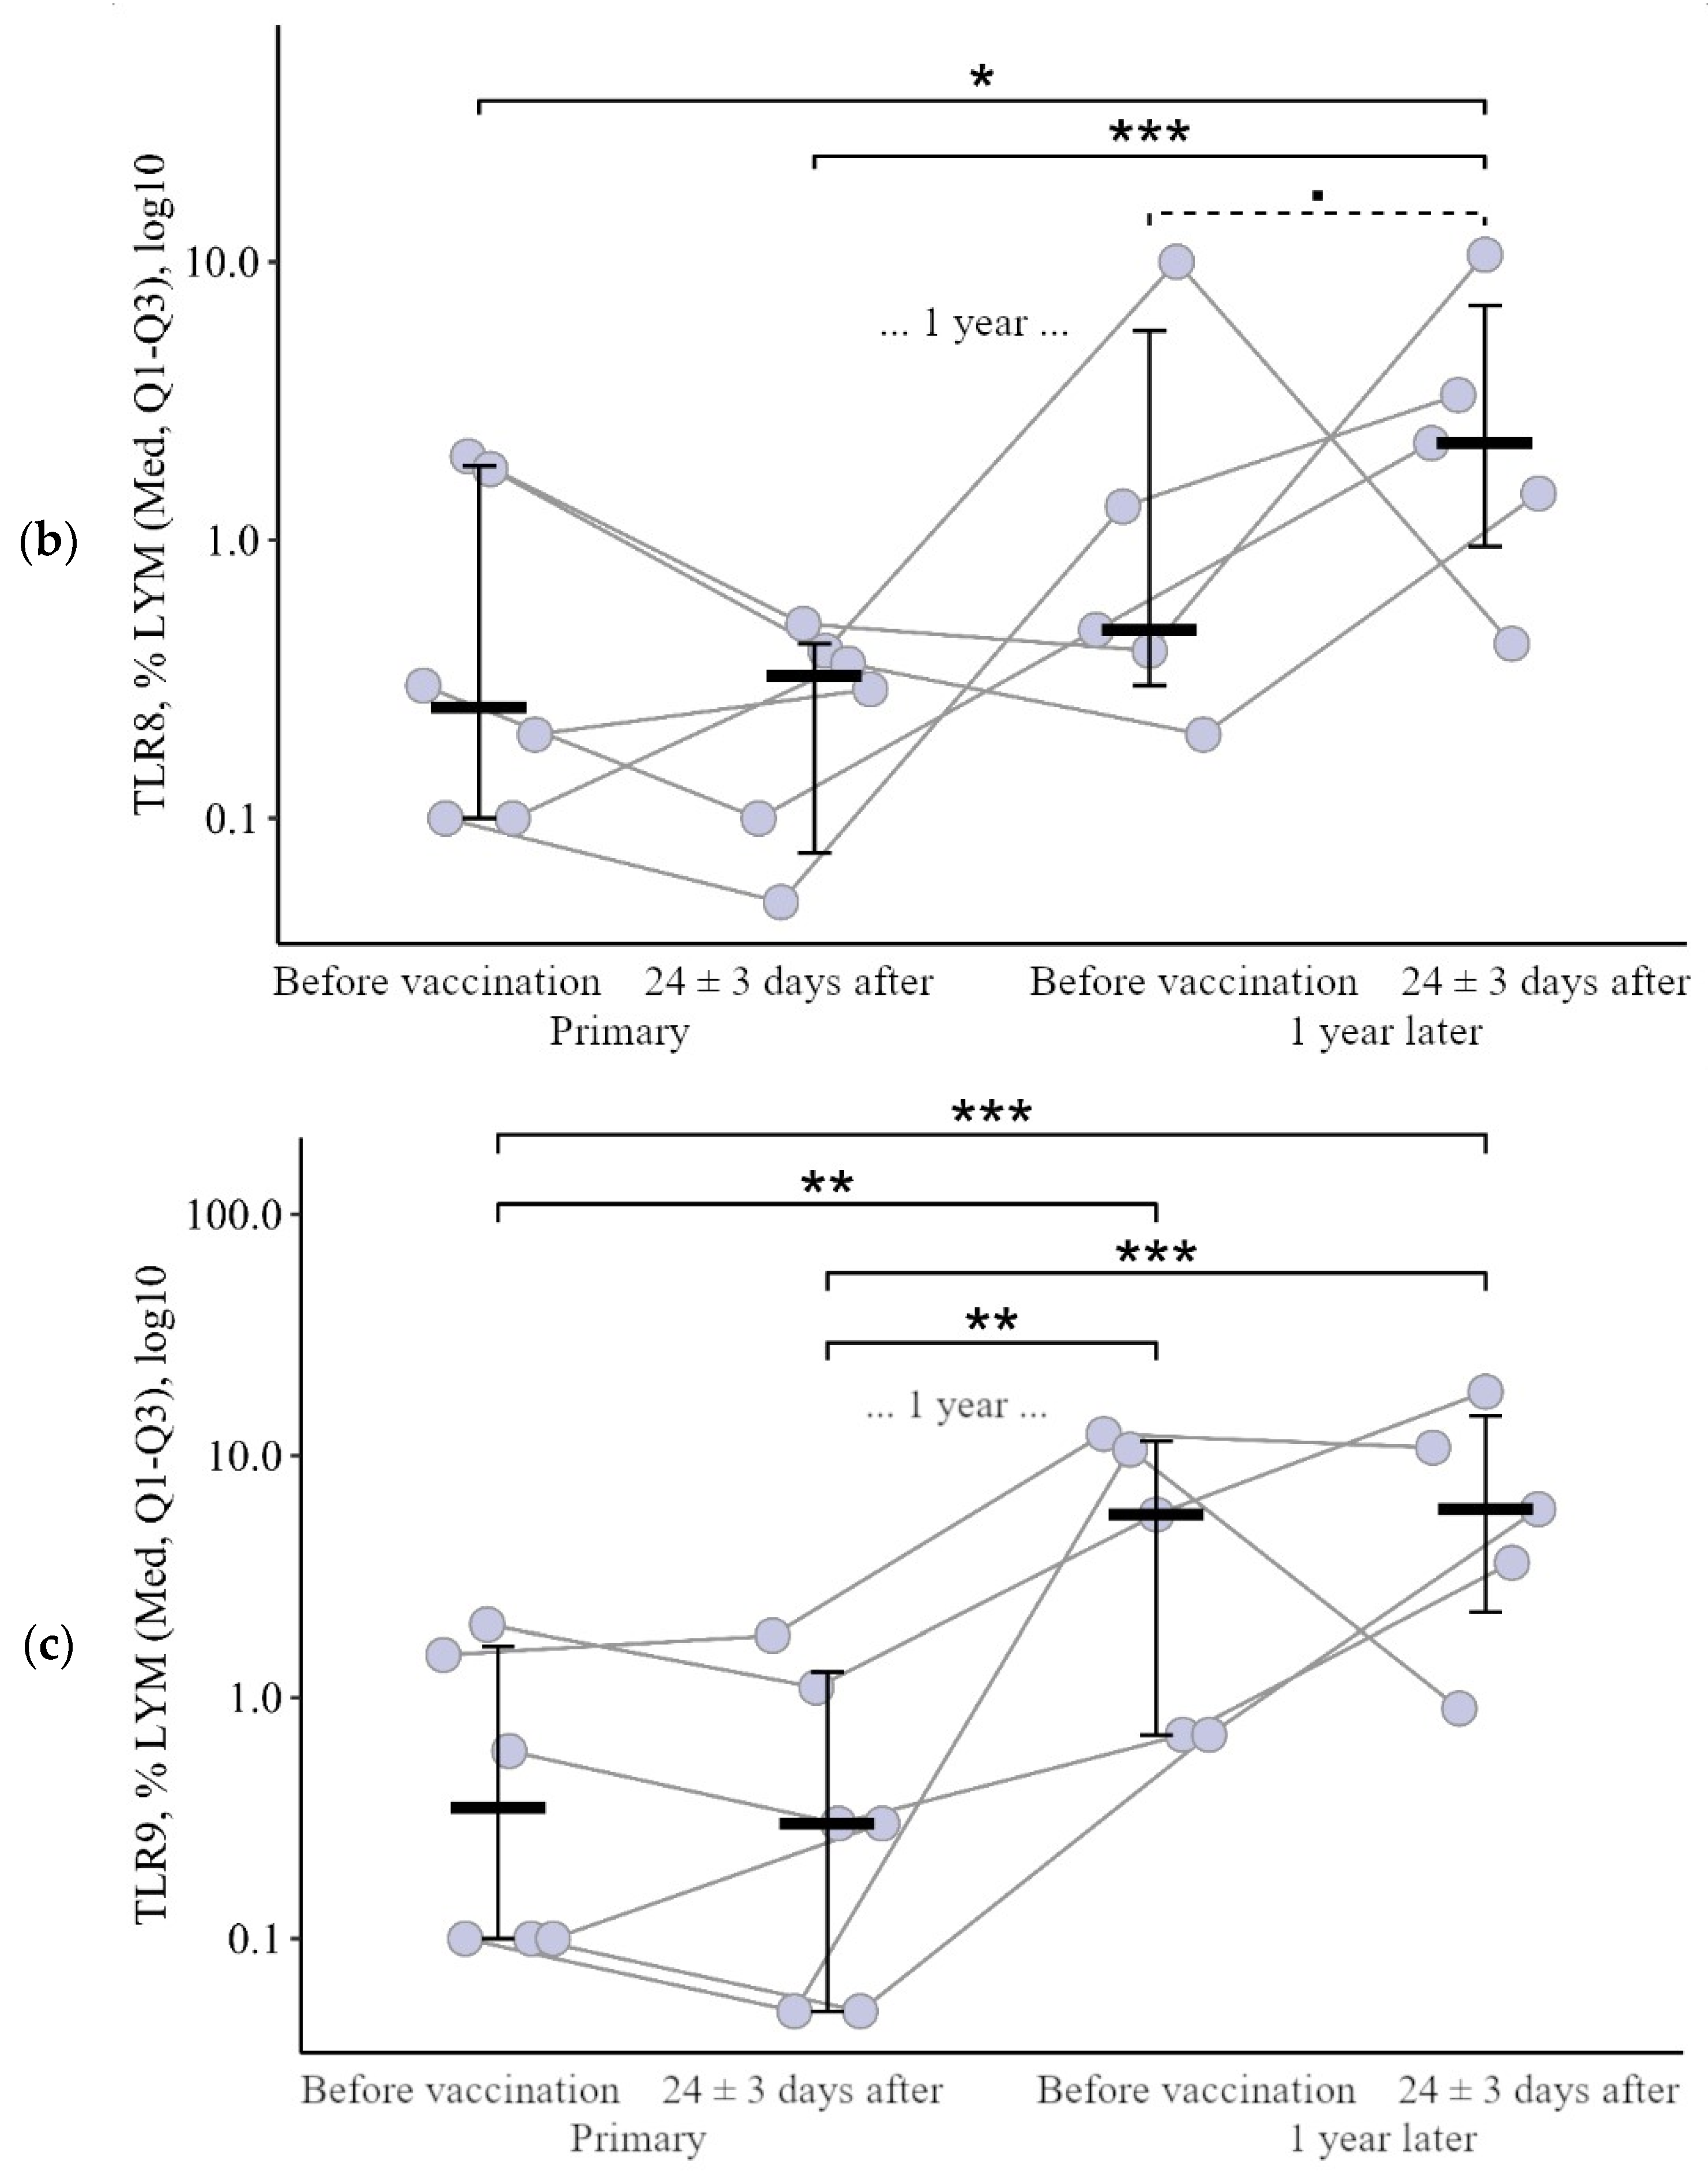
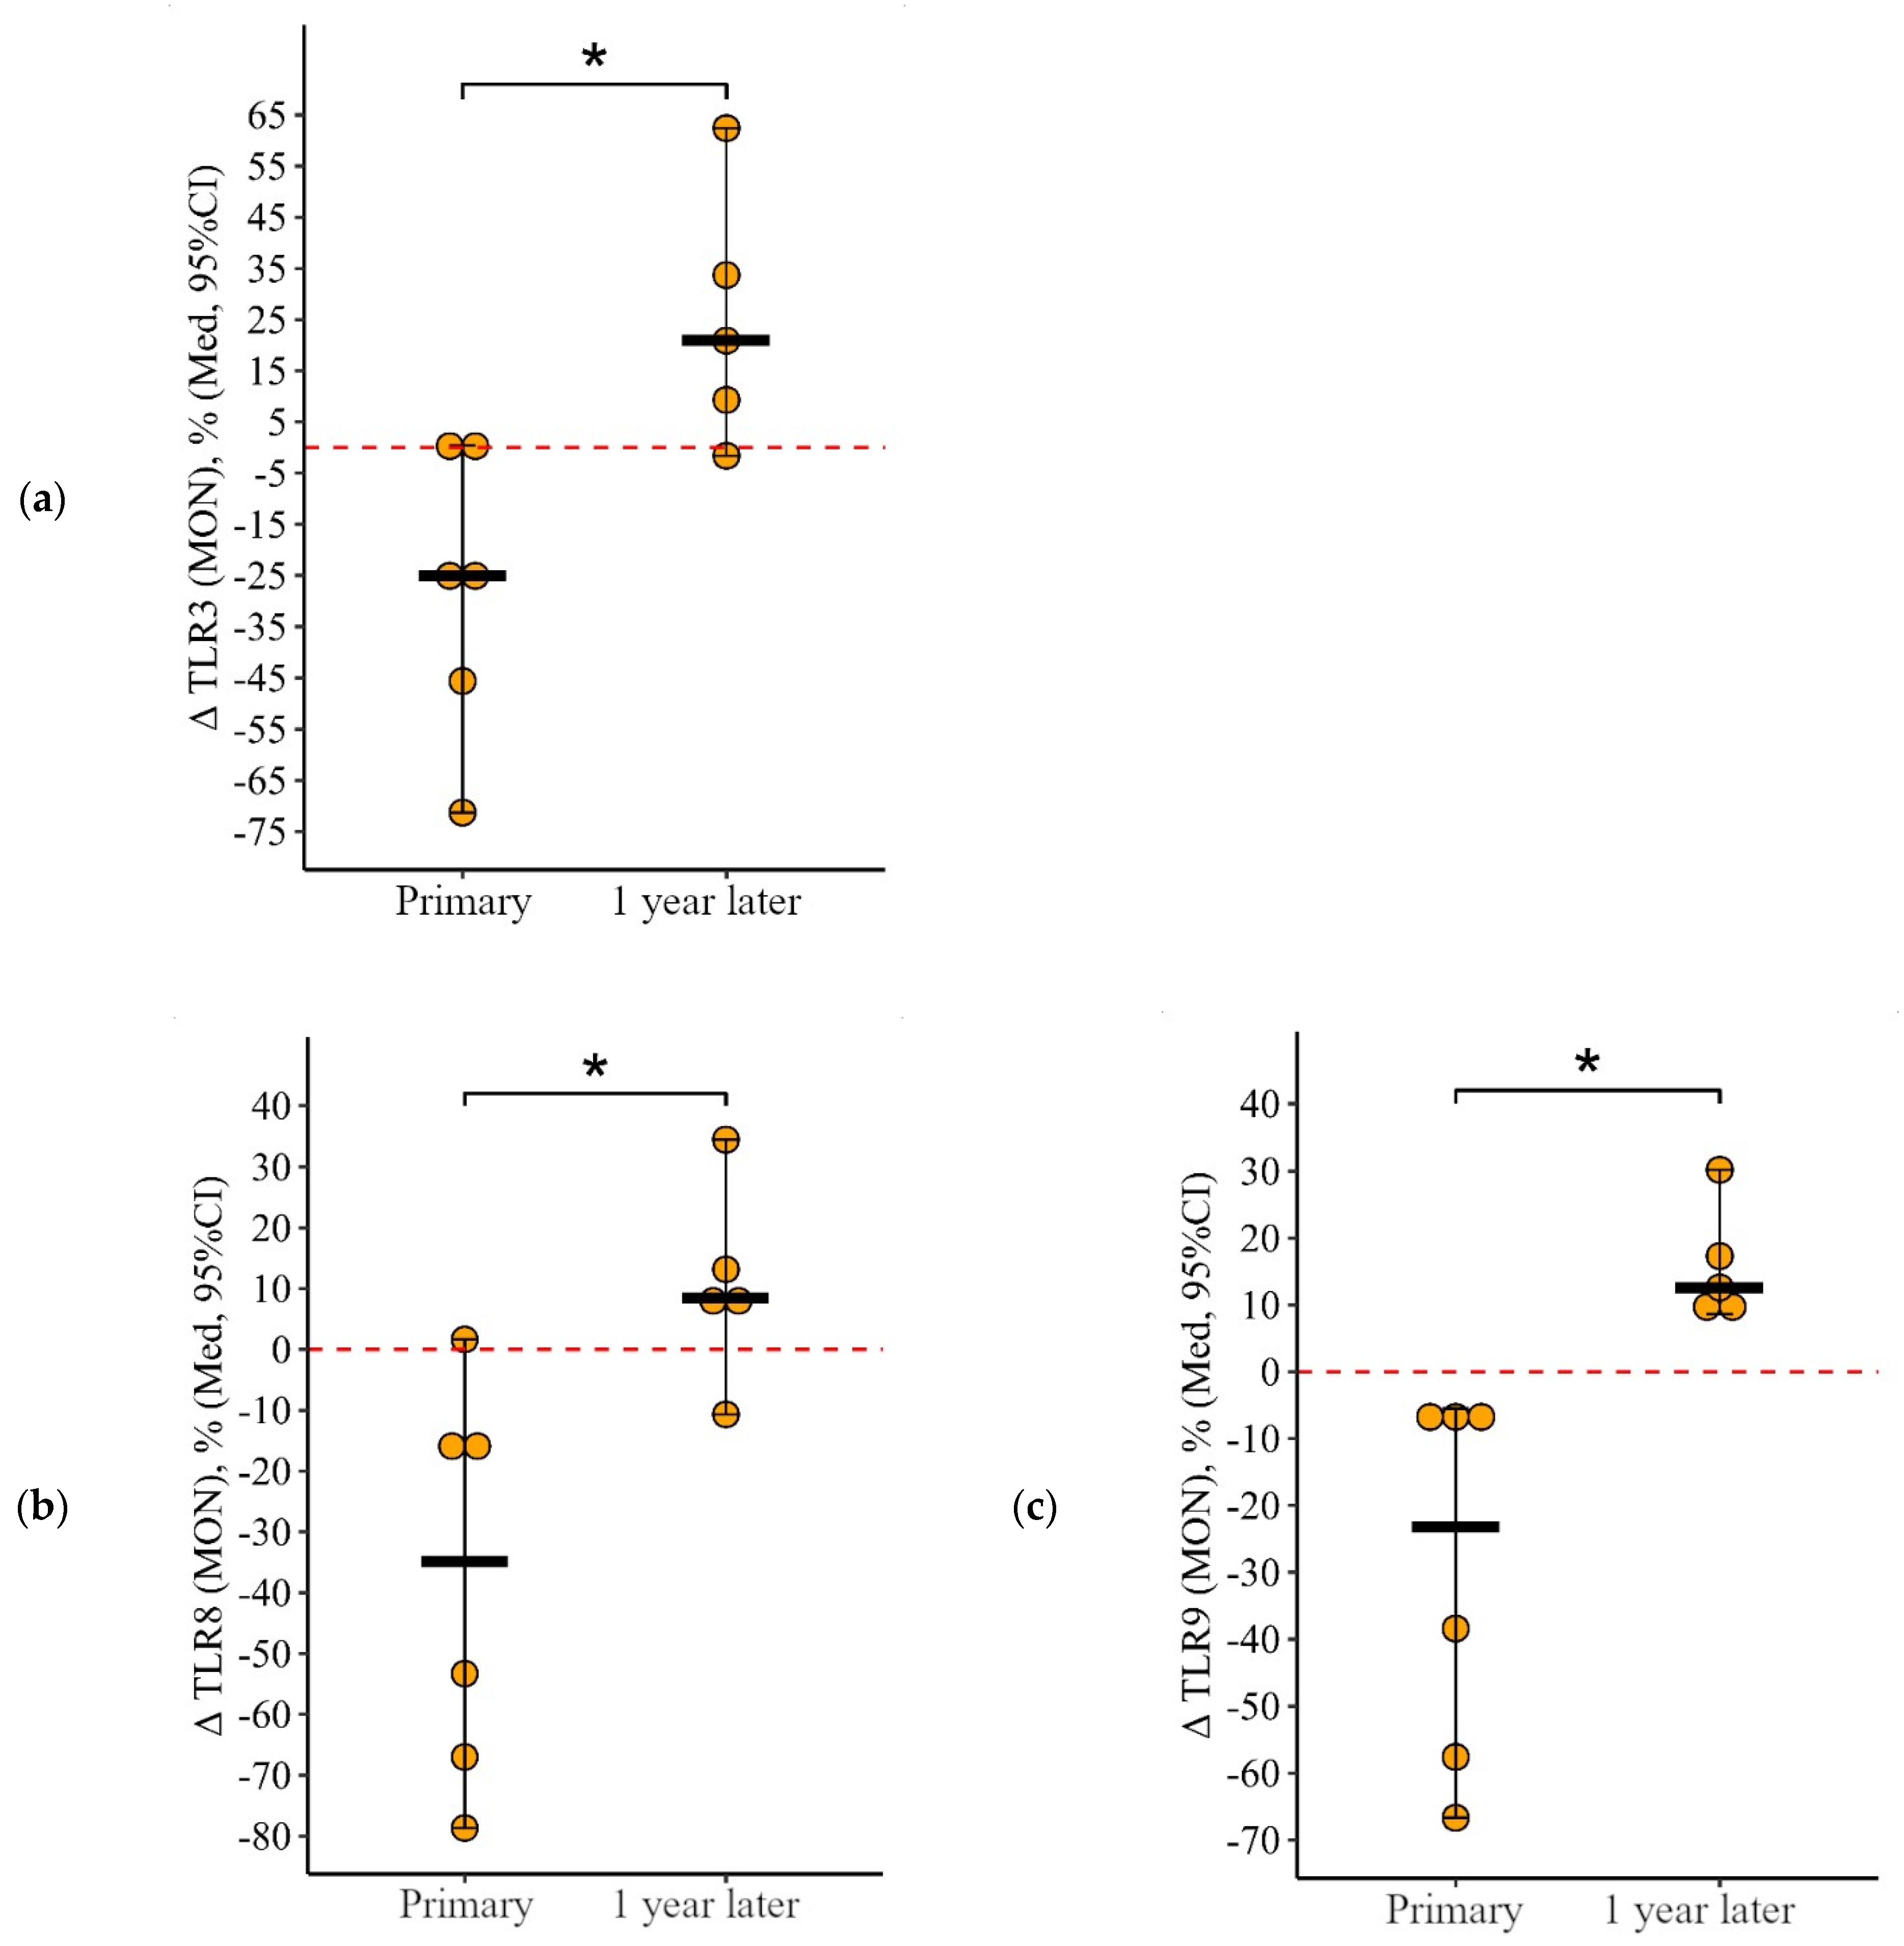
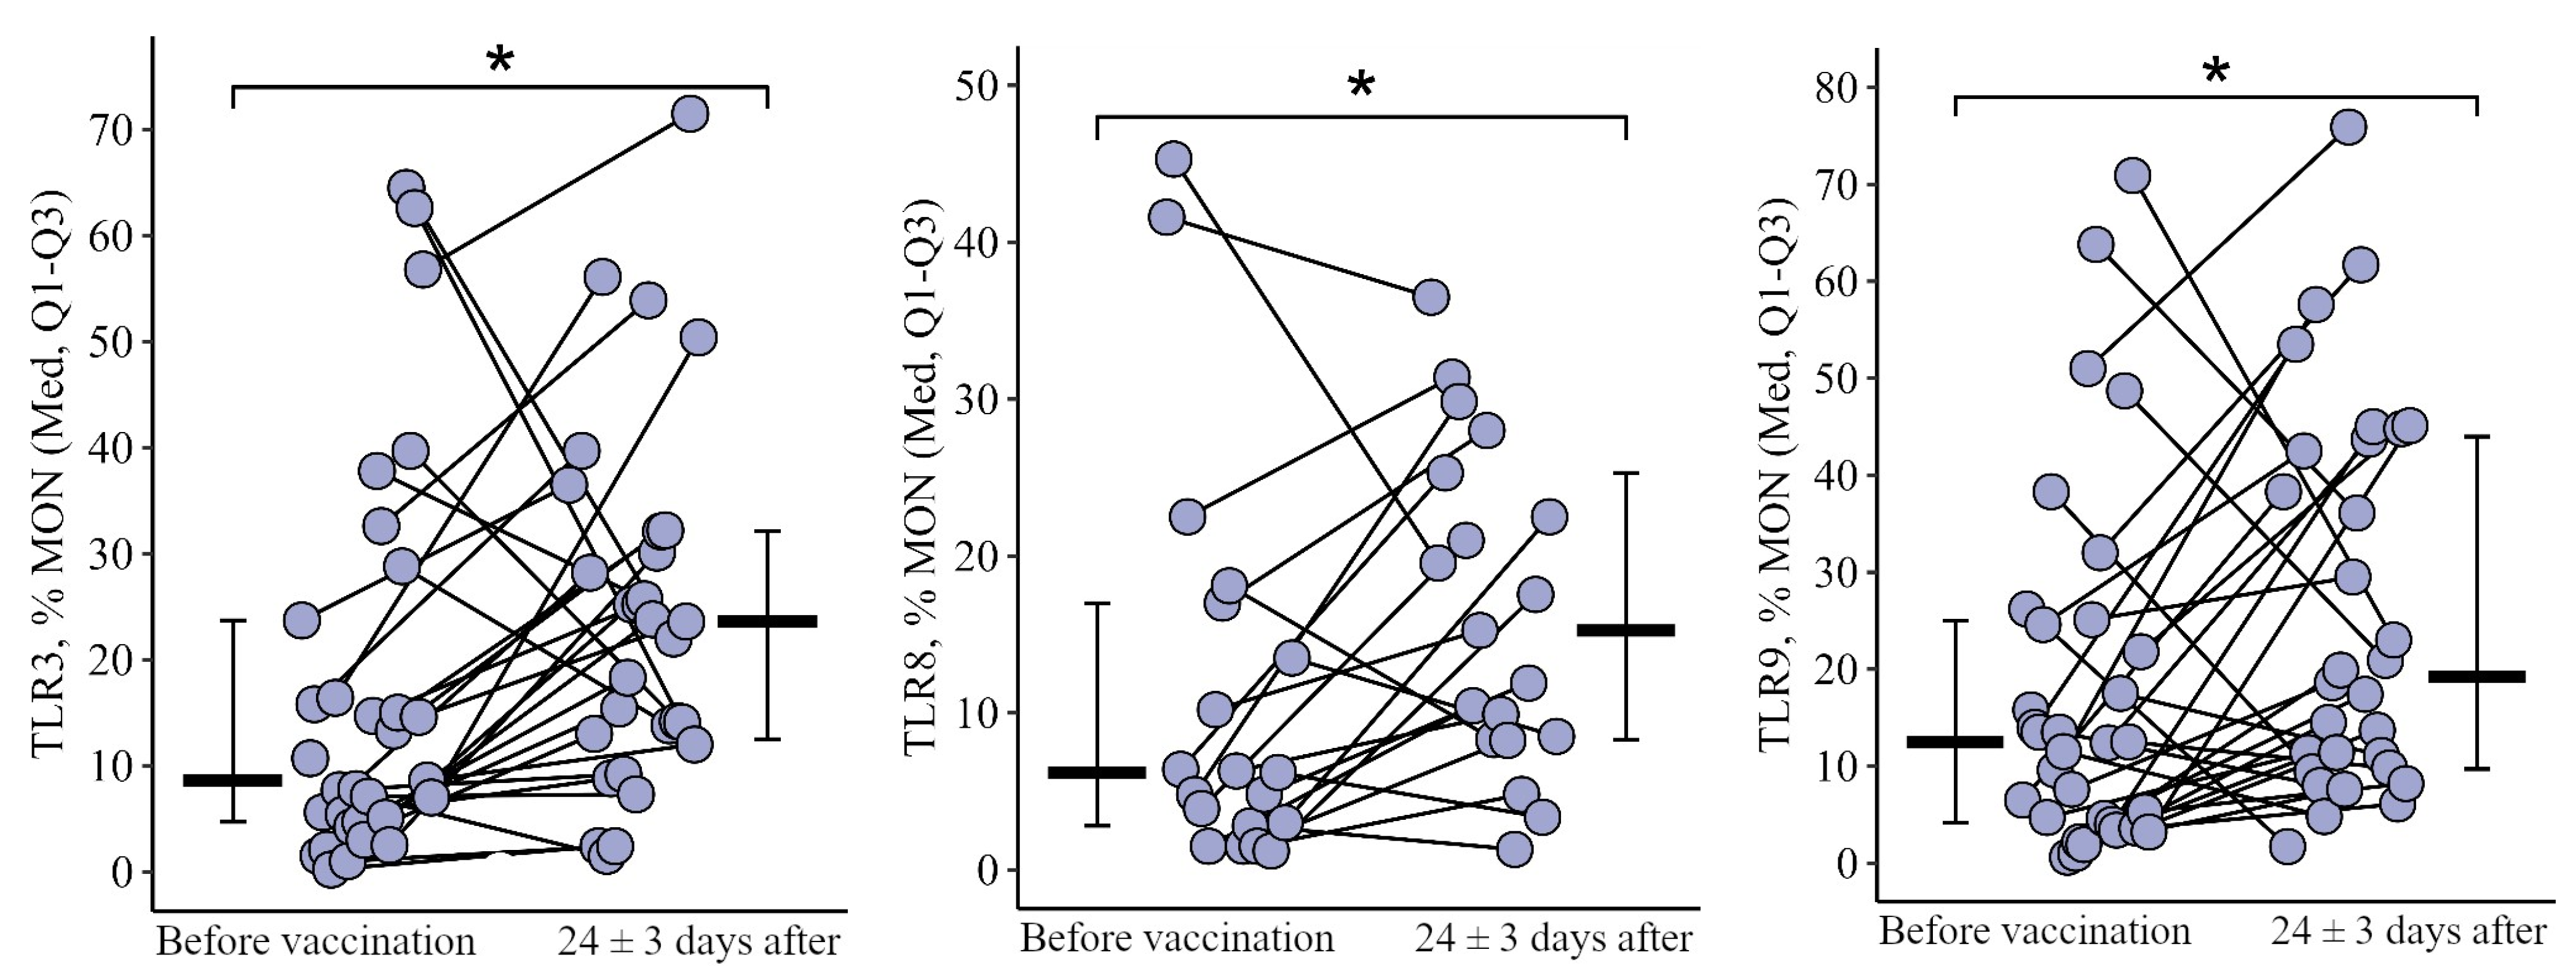
3.1.3. Monocytes
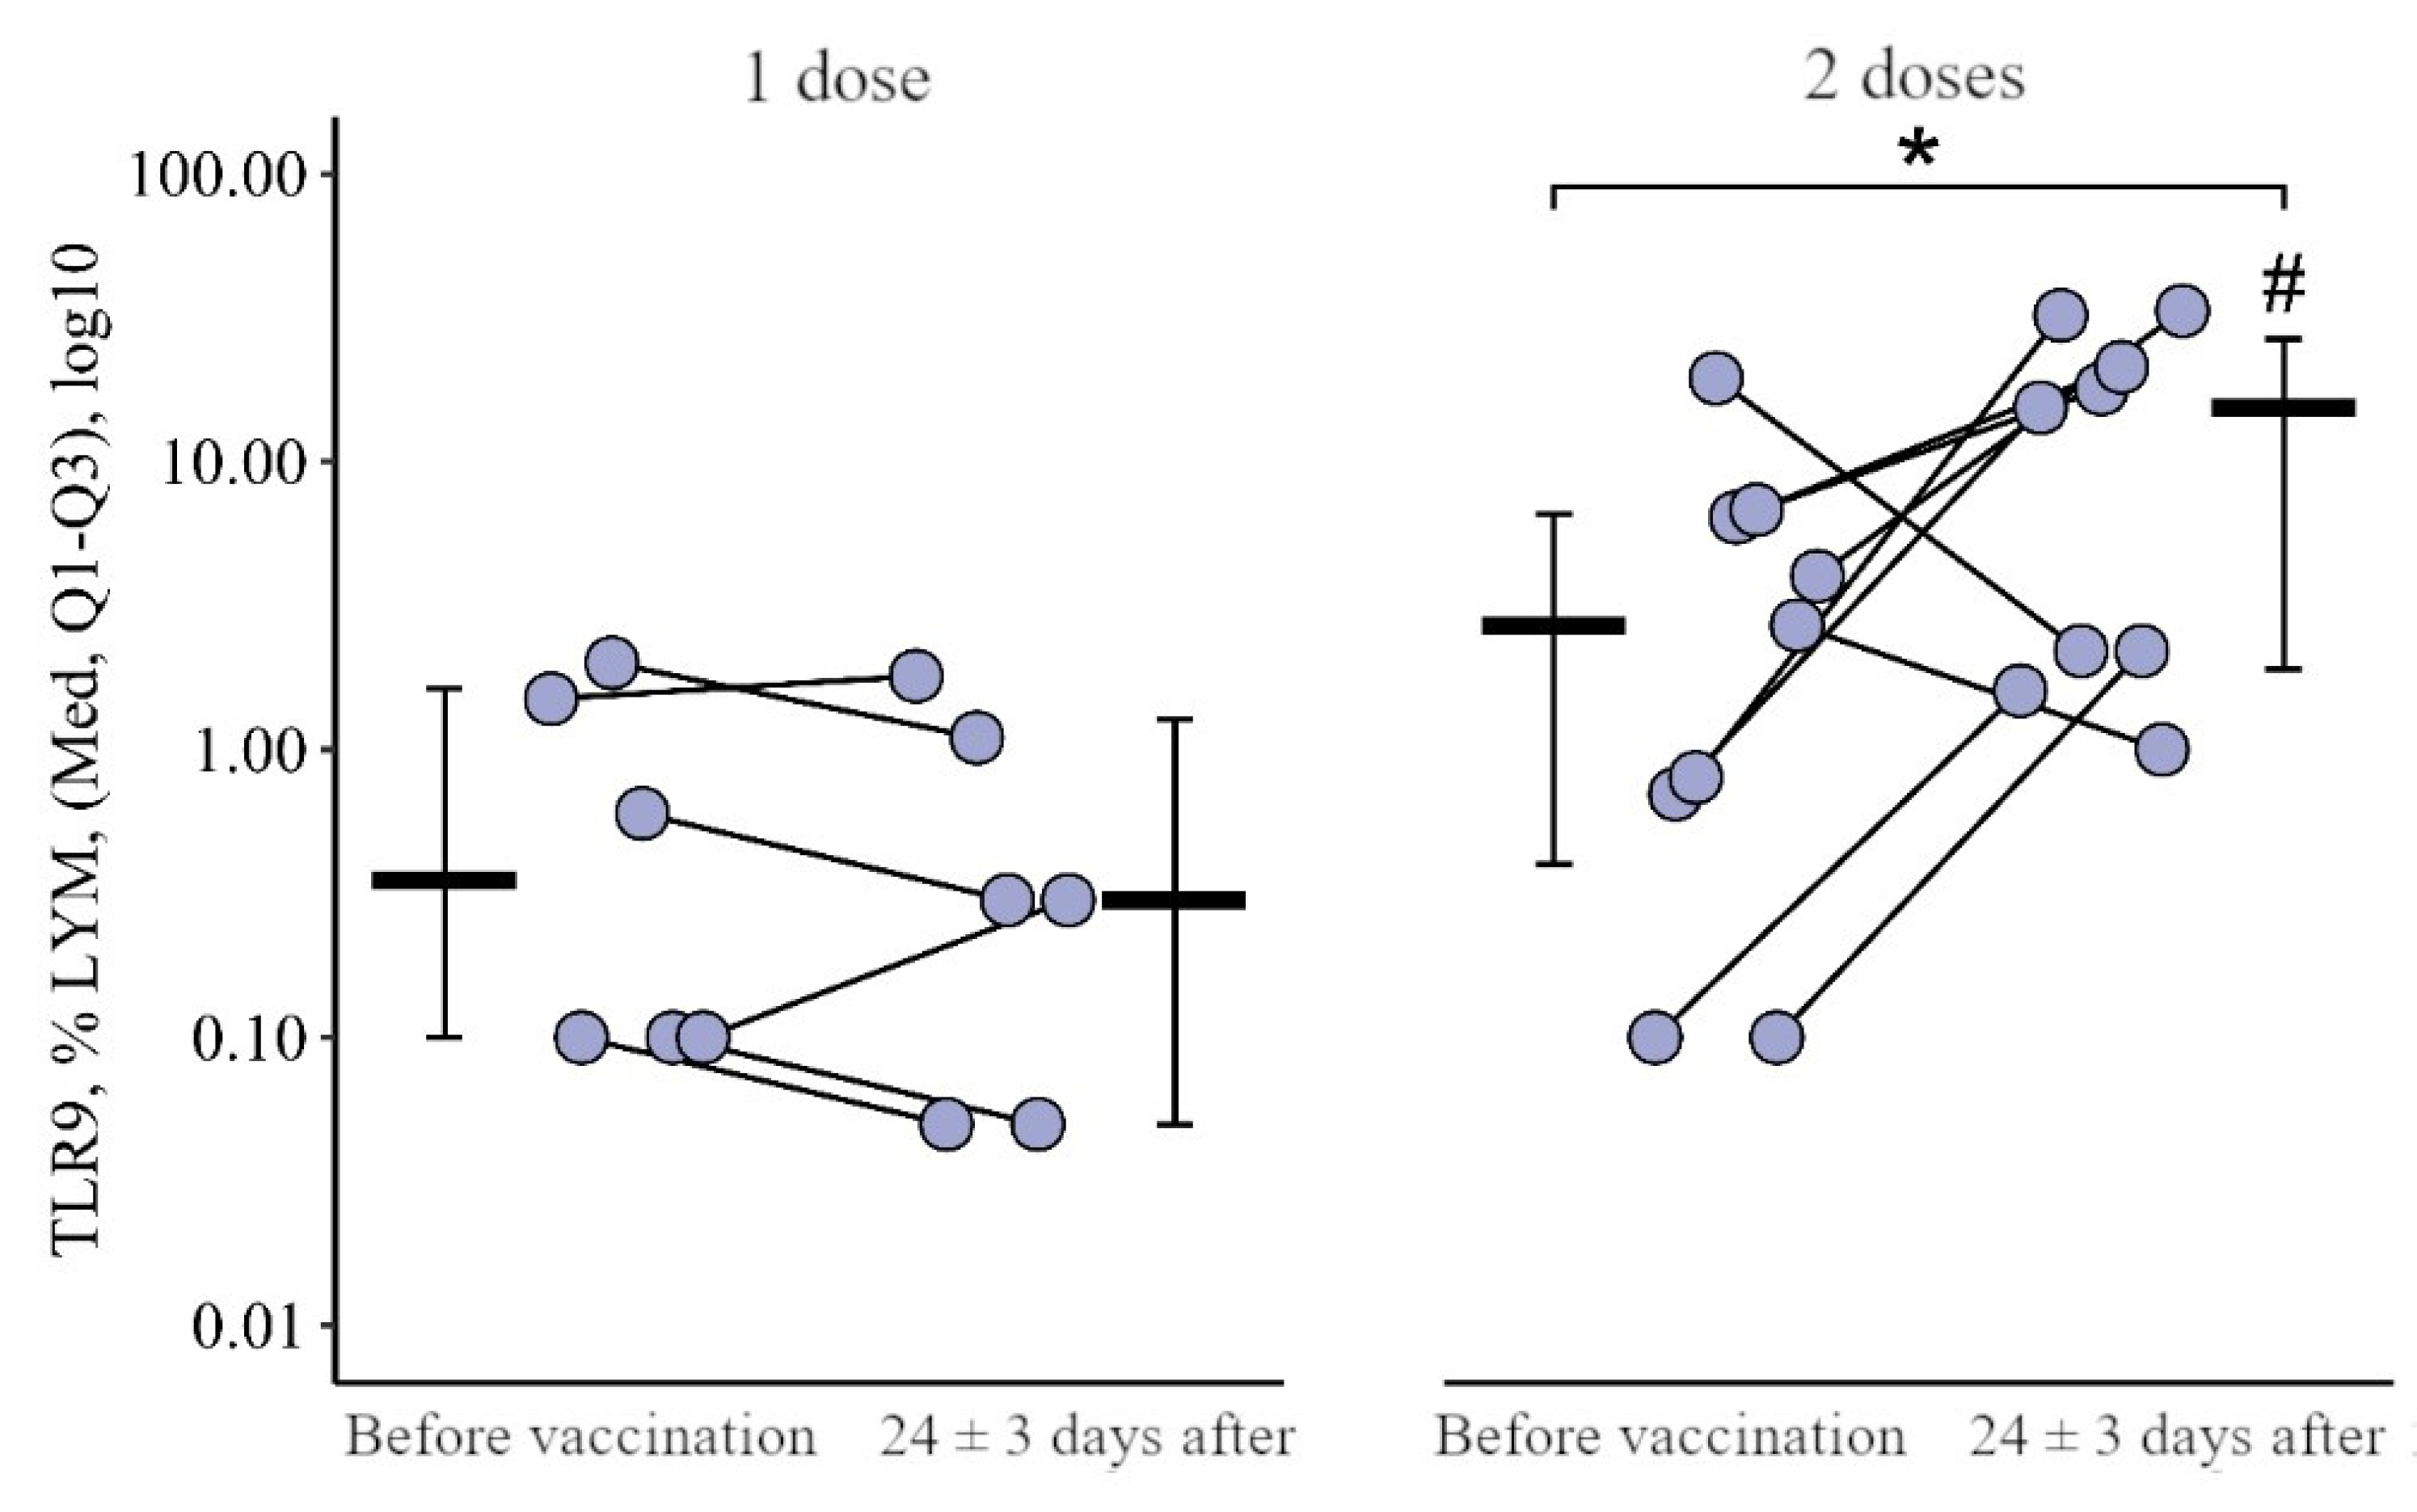
3.2. Comparing the Content of TLR3, TLR8, and TLR9 in Patients with CVID after Administration of One Dose and Simultaneously Two Doses of the Adjuvanted Influenza Vaccine
3.2.1. Granulocytes
3.2.2. Lymphocytes
3.2.3. Monocytes
3.3. Comparing the Content of TLR3, TLR8, and TLR9 in Healthy Volunteers after Vaccination with One Dose of the Quadrivalent Vaccine
4. Discussion
Author Contributions
Funding
Institutional Review Board Statement
Informed Consent Statement
Data Availability Statement
Conflicts of Interest
Abbreviations
| CVID | common variable immune deficiency |
| IEI | inborn errors of immunity |
| IVIG | intravenous immunoglobulin |
| PAMPs | pathogen associated molecular patterns |
| PBMC | peripheral blood mononuclear cell |
| PID | primary immune deficiency |
| PRRs | pattern recognition receptors |
| aQIV | adjuvant quadrivalent inactivated vaccine |
| aTIV | adjuvant trivalent inactivated vaccine |
| TLRs | toll-like receptors |
References
- Tangye, S.G.; Al-Herz, W.; Bousfiha, A.; Chatila, T.; Cunningham-Rundles, C.; Etzioni, A.; Franco, J.L.; Holland, S.M.; Klein, C.; Morio, T.; et al. Human Inborn Errors of Immunity: 2022 Update on the Classification from the International Union of Immunological Societies Expert Committee. J. Clin. Immunol. 2022, 42, 1473–1507. [Google Scholar] [CrossRef] [PubMed]
- Wasserman, R.L. Recombinant human hyaluronidase-facilitated subcutaneous immunoglobulin infusion in primary immuno-deficiency diseases. Immunotherapy 2017, 9, 1035–1050. [Google Scholar] [CrossRef] [PubMed]
- Eichner, M.; Schwehm, M.; Eichner, L.; Gerlier, L. Direct and indirect effects of influenza vaccination. BMC Infect. Dis. 2017, 17, 308. [Google Scholar] [CrossRef]
- World Health Organization. Global $ 2019–2030; World Health Organization: Geneva, Switzerland, 2019; 34p.
- Dubé, È.; Farrands, A.; Lemaitre, T.; Boulianne, N.; Sauvageau, C.; Boucher, F.D.; Tapiero, B.; Quach, C.; Ouakki, M.; Gosselin, V.; et al. Overview of knowledge, attitudes, beliefs, vaccine hesitancy and vaccine acceptance among mothers of infants in Quebec, Canada. Hum. Vaccines Immunother. 2019, 15, 113–120. [Google Scholar] [CrossRef] [PubMed]
- Krammer, F.; Smith, G.J.D.; Fouchier, R.A.M.; Peiris, M.; Kedzierska, K.; Doherty, P.C.; Palese, P.; Shaw, M.L.; Treanor, J.; Webster, R.G.; et al. Influenza. Nat. Rev. Dis. Primers 2018, 4, 4. [Google Scholar] [CrossRef] [PubMed]
- Eibl, M.M.; Wolf, H.M. Vaccination in patients with primary immune deficiency, secondary immune deficiency and autoimmunity with immune regulatory abnormalities. Immunotherapy 2015, 7, 1273–1292. [Google Scholar] [CrossRef] [PubMed]
- Rubin, L.G.; Levin, M.J.; Ljungman, P.; Davies, E.G.; Avery, R.; Tomblyn, M.; Bousvaros, A.; Dhanireddy, S.; Sung, L.; Keyserling, H.; et al. 2013 IDSA Clinical Practice Guideline for Vaccination of the Immunocompromised Host. Clin. Infect. Dis. 2013, 58, e44–e100. [Google Scholar] [CrossRef]
- Bonilla, F.A.; Barlan, I.; Chapel, H.; Costa-Carvalho, B.T.; Cunningham-Rundles, C.; de la Morena, M.T.; Espinosa-Rosales, F.J.; Hammarström, L.; Nonoyama, S.; Quinti, I.; et al. International Consensus Document (ICON): Common Variable Immunodeficiency Disorders. J. Allergy Clin. Immunol. Pr. 2015, 4, 38–59. [Google Scholar] [CrossRef]
- Sobh, A.; Bonilla, F.A. Vaccination in Primary Immunodeficiency Disorders. J. Allergy Clin. Immunol. Pr. 2016, 4, 1066–1075. [Google Scholar] [CrossRef]
- Janeway CA, Medzhitov, R. Introduction: The role of innate immunity in the adaptive immune response. Semin Immunol. 1998, 10, 349–350. [Google Scholar] [CrossRef]
- Dzhitov, R.; Janeway, C. Innate Immunity. N. Engl. J. Med. 2000, 343, 338–344. [Google Scholar] [CrossRef] [PubMed]
- Booth, J.; Wilson, H.; Jimbo, S.; Mutwiri, G. Modulation of B cell responses by Toll-like receptors. Cell Tissue Res. 2010, 343, 131–140. [Google Scholar] [CrossRef]
- Bernasconi, N.L.; Onai, N.; Lanzavecchia, A.; Cotta, C.V.; Zhang, Z.; Kim, H.-G.; Klug, C.A. A role for Toll-like receptors in acquired immunity: Up-regulation of TLR9 by BCR triggering in naive B cells and constitutive expression in memory B cells. Blood 2003, 101, 4500–4504. [Google Scholar] [CrossRef] [PubMed]
- Bourke, E.; Bosisio, D.; Golay, J.; Polentarutti, N.; Mantovani, A. The toll-like receptor repertoire of human B lymphocytes: Inducible and selective expression of TLR9 and TLR10 in normal and transformed cells. Blood 2003, 102, 956–963. [Google Scholar] [CrossRef] [PubMed]
- Trinchieri, G.; Sher, A. Cooperation of Toll-like receptor signals in innate immune defence. Nat. Rev. Immunol. 2007, 7, 179–190. [Google Scholar] [CrossRef]
- Yu, J.E.; Knight, A.K.; Radigan, L.; Marron, T.U.; Zhang, L.; Sanchez-Ramón, S.; Cunningham-Rundles, C. Toll-like receptor 7 and 9 defects in common variable immunodeficiency. J. Allergy Clin. Immunol. 2009, 124, 349–356e3. [Google Scholar] [CrossRef]
- Hannoun, C. The evolving history of influenza viruses and influenza vaccines. Expert Rev. Vaccines 2013, 12, 1085–1094. [Google Scholar] [CrossRef]
- Recommended composition of influenza virus vaccines for use in the 2018–2019 northern hemisphere influenza sea-son. REH 2018, 93, 133–141.
- Ambrose, C.S.; Levin, M.J. The rationale for quadrivalent influenza vaccines. Hum. Vaccines Immunother. 2012, 8, 81–88. [Google Scholar] [CrossRef]
- Caini, S.; Huang, Q.S.; Ciblak, M.A.; Kusznierz, G.; Owen, R.; Wangchuk, S.; Henriques, C.M.P.; Njouom, R.; Fasce, R.A.; Yu, H.; et al. Epidemiological and virological characteristics of influenza B: Results of the Global Influenza B Study. Influ. Other Respir. Viruses 2015, 9, 3–12. [Google Scholar] [CrossRef]
- Kharit, S.M.; Pyдаkobа, A.; Yckob, A.; Konovalova, L.N.; Lobzin, Y.V. The averted costs due to influenza vaccination with trivalent and quadrivalent vaccines. J. Infectology 2017, 9, 17–22. [Google Scholar] [CrossRef][Green Version]
- Eichner, M.; Schwehm, M.; Hain, J.; Uphoff, H.; Salzberger, B.; Knuf, M.; Schmidt-Ott, R. 4Flu-an individual based simulation tool to study the effects of quadrivalent vaccination on seasonal influenza in Germany. BMC Infect. Dis. 2014, 14, 365. [Google Scholar] [CrossRef] [PubMed]
- Crépey, P.; De Boer, P.T.; Postma, M.J.; Pitman, R. Retrospective public health impact of a quadrivalent influenza vaccine in the United States. Influenza Other Respir. Viruses 2015, 9 (Suppl. S1), 39–46. [Google Scholar] [CrossRef] [PubMed]
- Moa, A.M.; Chughtai, A.A.; Muscatello, D.J.; Turner, R.M.; MacIntyre, C.R. Immunogenicity and safety of inactivated quadrivalent influenza vaccine in adults: A systematic review and meta-analysis of randomised controlled trials. Vaccine 2016, 34, 4092–4102. [Google Scholar] [CrossRef] [PubMed]
- Guidance. Summary of Data to Support the Choice of Influenza Vaccination for Adults in Primary Care. Public Health England. Published 29 January 2018. Available online: https://www.gov.uk/government/publications/flu-vaccination-supporting-data-for-adult-vaccines/summary-of-data-to-support-the-choice-of-influenza-vaccination-for-adults-in-primary-care (accessed on 21 March 2022).
- Crampton, S.P.; Voynova, E.; Bolland, S. Innate pathways to B-cell activation and tolerance. Ann. N. Y. Acad. Sci. 2010, 1183, 58–68. [Google Scholar] [CrossRef]
- De Waure, C.; Boccalini, S.; Bonanni, P.; Amicizia, D.; Poscia, A.; Bechini, A.; Barbieri, M.; Capri, S.; Specchia, M.L.; Di Pietro, M.L.; et al. Adjuvanted influenza vaccine for the Italian elderly in the 2018/19 season: An updated health technology assessment. Eur. J. Public Health. 2019, 29, 900–905. [Google Scholar] [CrossRef]
- Heer, A.K.; Shamshiev, A.; Donda, A.; Uematsu, S.; Akira, S.; Kopf, M.; Marsland, B.J. TLR Signaling Fine-Tunes Anti-Influenza B Cell Responses without Regulating Effector T Cell Responses. J. Immunol. 2007, 178, 2182–2191. [Google Scholar] [CrossRef]
- Lanzavecchia, A.; Bernasconi, N.; Traggiai, E.; Ruprecht, C.R.; Corti, D.; Sallusto, F. Understanding and making use of human memory B cells. Immunol. Rev. 2006, 211, 303–309. [Google Scholar] [CrossRef]
- Ruprecht, C.R.; Lanzavecchia, A. Toll-like receptor stimulation as a third signal required for activation of human naive B cells. Eur. J. Immunol. 2006, 36, 810–816. [Google Scholar] [CrossRef]
- Bernasconi, N.L.; Traggiai, E.; Lanzavecchia, A. Maintenance of Serological Memory by Polyclonal Activation of Human Memory B Cells. Science 2002, 298, 2199–2202. [Google Scholar] [CrossRef]
- Pasare, C.; Medzhitov, R. Control of B-cell responses by Toll-like receptors. Nature 2005, 438, 364–368. [Google Scholar] [CrossRef] [PubMed]
- Good Clinical Practice. Russian Federation National Standard, GOSTR 52379-2005/Moscow. 2005. Available online: http://www.medtran.ru/rus/trials/gost/52379-2005.html (accessed on 1 April 2006).
- Koller, M. robustlmm: An R Package for Robust Estimation of Linear Mixed-Effects Models. J. Stat. Softw. 2016, 75, 1–24. [Google Scholar] [CrossRef]
- Luke, S.G. Evaluating significance in linear mixed-effects models in R. Behav. Res. Methods 2016, 49, 1494–1502. [Google Scholar] [CrossRef]
- Lenth Russell, V. Package ‘emmeans’: Estimated Marginal Means, aka Least Squares Means, Version 1.8.8.; CRAN. 2023. Available online: https://cran.r-project.org/web/packages/emmeans/emmeans.pdf (accessed on 1 April 2006).
- Nohrin, D.Y. Laboratory Workshop on Biostatistics; Publishing House of Chelyabinsk State University: Chelyabinsk, Russia, 2018; 289p. [Google Scholar]
- Kienzler, A.; Hargreaves, C.E.; Patel, S.Y. The role of genomics in common variable immunodeficiency disorders. Clin. Exp. Immunol. 2017, 188, 326–332. [Google Scholar] [CrossRef] [PubMed]
- Boileau, J.; Mouillot, G.; Gérard, L.; Carmagnat, M.; Rabian, C.; Oksenhendler, E.; Pasquali, J.-L.; Korganow, A.-S. Autoimmunity in common variable immunodeficiency: Correlation with lymphocyte phenotype in the French DEFI study. J. Autoimmun. 2011, 36, 25–32. [Google Scholar] [CrossRef]
- Hermans, P.E.; Diaz-Buxo, J.A.; Stobo, J.D. Idiopathic late-onset immunoglobulin deficiency: Clinical observations in 50 patients. Am. J. Med. 1976, 61, 221–237. [Google Scholar] [CrossRef]
- Hong, R.; Agrawal, S.; Gollapudi, S.; Gupta, S. Impaired Pneumovax-23-Induced Monocyte-Derived Cytokine Production in Patients with Common Variable Immunodeficiency. J. Clin. Immunol. 2010, 30, 435–441. [Google Scholar] [CrossRef]
- Gardulf, A.; Abolhassani, H.; Gustafson, R.; Eriksson, L.E.; Hammarström, L. Predictive markers for humoral influenza vaccine response in patients with common variable immunodeficiency. J. Allergy Clin. Immunol. 2018, 142, 1922–1931.e2. [Google Scholar] [CrossRef]
- Cunningham-Rundles, C.; Radigan, L.; Knight, A.K.; Zhang, L.; Bauer, L.; Nakazawa, A. TLR9 Activation Is Defective in Common Variable Immune Deficiency. J. Immunol. 2006, 176, 1978–1987. [Google Scholar] [CrossRef]
- Engel, A.L.; E Holt, G.; Lu, H. The pharmacokinetics of Toll-like receptor agonists and the impact on the immune system. Expert Rev. Clin. Pharmacol. 2011, 4, 275–289. [Google Scholar] [CrossRef]
- Schulz, O.; Diebold, S.S.; Chen, M.; Näslund, T.I.; Nolte, M.A.; Alexopoulou, L.; Azuma, Y.-T.; Flavell, R.A.; Liljestrom, P.; Reis E Sousa, C. Toll-like receptor 3 promotes cross-priming to virus-infected cells. Nature 2005, 433, 887–892. [Google Scholar] [CrossRef] [PubMed]
- Azuma, M.; Ebihara, T.; Oshiumi, H.; Matsumoto, M.; Seya, T. Cross-priming for antitumor CTL induced by soluble Ag + polyI:C depends on the TICAM-1 pathway in mouse CD11c+/CD8α+dendritic cells. OncoImmunology 2012, 1, 581–592. [Google Scholar] [CrossRef] [PubMed]
- Yoshimura, A.; Ohishi, H.M.M.; Aki, D.; Hanada, T. Regulation of TLR signaling and inflammation by SOCS family proteins. J. Leukoc. Biol. 2004, 75, 422–427. [Google Scholar] [CrossRef] [PubMed][Green Version]
- Hyang, L.T.; Paredes, C.J.; Papoutsakis, E.T.; Miller, W.M. Gene expression analysis illuminates the transcriptional programs un-derlying the functional activity of ex vivo-expanded granulocytes. Physiol. Genom. 2007, 31, 114–125. [Google Scholar] [CrossRef] [PubMed][Green Version]
- Kawai, T.; Akira, S. The role of pattern-recognition receptors in innate immunity: Update on Toll-like receptors. Nat. Immunol. 2010, 11, 373–384. [Google Scholar] [CrossRef]
- Kumagai, Y.; Takeuchi, O.; Kato, H.; Kumar, H.; Matsui, K.; Morii, E.; Aozasa, K.; Kawai, T.; Akira, S. Alveolar macrophages are the primary interferon-alpha producer in pulmonary infec-tion with RNA viruses. Immunity 2007, 27, 240–252. [Google Scholar] [CrossRef]
- Manicassamy, S.; Pulendran, B. Modulation of adaptive immunity with Toll-like receptors. Semin. Immunol. 2009, 21, 185–193. [Google Scholar] [CrossRef]
- Khromova, E.A.; Akhmatova, E.A.; Skhodova, S.A.; Semochkin, I.A.; Khomenkov, V.G.; Akhmatova, N.K.; Kostinov, M.P. Effect of in-fluenza vaccines on subpopulations of blood dendritic cells. J. Microbiol. Epidemiol. Immunobiol. 2016, 5, 23–28. (In Russian) [Google Scholar] [CrossRef]
- Committee for Proprietary Medicinal Products (CPMP). CPMP: Note for Guidance on Preclinical Pharmacological and Toxico-Logical Testing of Vaccines; CPMP/SWP/565/95 adopted December 97; CPMP: Amsterdam, The Netherlands, 1997. [Google Scholar]
- Kompier, R.; Neels, P.; Beyer, W.; Hardman, T.; Lioznov, D.; Kharit, S.; Kostinov, M. Analysis of the safety and immunogenicity profile of an azoximer bromide poly-mer-adjuvanted subunit influenza vaccine. F1000Research 2022, 11, 259. [Google Scholar] [CrossRef]
- Kostinov, M.P.; Akhmatova, N.K.; Khromova, E.A.; Skhodova, S.A.; Stolpnikova, V.N.; Cherdantsev, A.P.; Vlasenko, A.E. The Impact of Adjuvanted and Non-Adjuvanted Influenza Vaccines on the Innate and Adaptive Immunity Effectors. Infect. Dis. 2018, 1, 83–109. [Google Scholar]
- Kostinov, M.P.; Chuchalin, A.D. Guidance for Clinical Immunology in Respiratory Medicine, 2nd ed.; MDV Group: Moscow, Russia, 2018; p. 304. ISBN 978-5-906748-08-9. (In Russian) [Google Scholar]
- Pružinec, P.; Chirun, N.; Sveikata, A. The safety profile of Polyoxidonium in daily practice: Results from postauthorization safety study in Slovakia. Immunotherapy 2018, 10, 131–137. [Google Scholar] [CrossRef]
- Pinegin, B.V.; Ilyina, N.I.; Latysheva, T.V. Polyoxidonium in Clinical Practice; Karaulov, A.V., Ed.; GEOTAR–Media: Moscow, Russia, 2008; p. 136. (In Russian) [Google Scholar]
- Karaulov, A.V.; Bykov, A.S.; Volkova, N.V. Review of Grippol Family Vaccine Studies and Modern Adjuvant Development. Epidemiol. Vaccinal Prev. 2019, 18, 101–119. [Google Scholar] [CrossRef]
- Alexia, C.; Cren, M.; Louis-Plence, P.; Vo, D.-N.; El Ahmadi, Y.; Dufourcq-Lopez, E.; Lu, Z.-Y.; Hernandez, J.; Shamilov, F.; Chernysheva, O.; et al. Polyoxidonium® Activates Cytotoxic Lymphocyte Responses Through Dendritic Cell Maturation: Clinical Effects in Breast Cancer. Front. Immunol. 2019, 10, 2693. [Google Scholar] [CrossRef] [PubMed]
- Kostinov, M.P.; Akhmatova, N.K.; Khromova, E.A.; Skhodova, S.A.; Stolpnikova, V.N.; Cherdantsev, A.P.; Vlasenko, A.E. The impact of adjuvanted and non-adjuvanted influenza vaccines on in vitro lymphocyte immunophenotype. Russ. J. Infect. Immun. 2023, 13, 430–438. [Google Scholar] [CrossRef]
- Kostinov, M.P.; Cherdantsev, A.P.; Shmitko, A.D.; Akhmatova, N.K.; Kostinova, A.M.; Praulova, D.A.; Polyschuk, V.B.; Protasov, A.D.; Zhestkov, A.V.; Tezikov, Y.V. The efficacy of immunoadjuvant-containing influenza vaccines in pregnancy. In Vaccines; Afrin, F., Hemeg, H., Ozbak, H., Eds.; 2017; Section 3, Chapter 4; pp. 67–93. [Google Scholar] [CrossRef]
- Salem, M.L.; El-Hennawy, D. The possible beneficial adjuvant effect of influenza vaccine to minimize the severity of COVID-19. Med. Hypotheses 2020, 140, 109752. [Google Scholar] [CrossRef] [PubMed]


Disclaimer/Publisher’s Note: The statements, opinions and data contained in all publications are solely those of the individual author(s) and contributor(s) and not of MDPI and/or the editor(s). MDPI and/or the editor(s) disclaim responsibility for any injury to people or property resulting from any ideas, methods, instructions or products referred to in the content. |
© 2023 by the authors. Licensee MDPI, Basel, Switzerland. This article is an open access article distributed under the terms and conditions of the Creative Commons Attribution (CC BY) license (https://creativecommons.org/licenses/by/4.0/).
Share and Cite
Kostinova, A.M.; Latysheva, E.A.; Akhmatova, N.K.; Vlasenko, A.E.; Skhodova, S.A.; Khromova, E.A.; Linok, A.V.; Poddubikov, A.A.; Latysheva, T.V.; Kostinov, M.P. Expression of Toll-like Receptors on the Immune Cells in Patients with Common Variable Immune Deficiency after Different Schemes of Influenza Vaccination. Viruses 2023, 15, 2091. https://doi.org/10.3390/v15102091
Kostinova AM, Latysheva EA, Akhmatova NK, Vlasenko AE, Skhodova SA, Khromova EA, Linok AV, Poddubikov AA, Latysheva TV, Kostinov MP. Expression of Toll-like Receptors on the Immune Cells in Patients with Common Variable Immune Deficiency after Different Schemes of Influenza Vaccination. Viruses. 2023; 15(10):2091. https://doi.org/10.3390/v15102091
Chicago/Turabian StyleKostinova, Aristitsa Mikhailovna, Elena Alexandrovna Latysheva, Nelly Kimovna Akhmatova, Anna Egorovna Vlasenko, Svetlana Anatolyevna Skhodova, Ekaterina Alexandrovna Khromova, Andrey Viktorovich Linok, Arseniy Alexandrovich Poddubikov, Tatyana Vasilievna Latysheva, and Mikhail Petrovich Kostinov. 2023. "Expression of Toll-like Receptors on the Immune Cells in Patients with Common Variable Immune Deficiency after Different Schemes of Influenza Vaccination" Viruses 15, no. 10: 2091. https://doi.org/10.3390/v15102091
APA StyleKostinova, A. M., Latysheva, E. A., Akhmatova, N. K., Vlasenko, A. E., Skhodova, S. A., Khromova, E. A., Linok, A. V., Poddubikov, A. A., Latysheva, T. V., & Kostinov, M. P. (2023). Expression of Toll-like Receptors on the Immune Cells in Patients with Common Variable Immune Deficiency after Different Schemes of Influenza Vaccination. Viruses, 15(10), 2091. https://doi.org/10.3390/v15102091