Effects of Climate Change and Ozone Concentration on the Net Primary Productivity of Forests in South Korea

 ,
, 
Abstract
:1. Introduction
2. Materials and Methods
2.1. Study Site and Time Scope
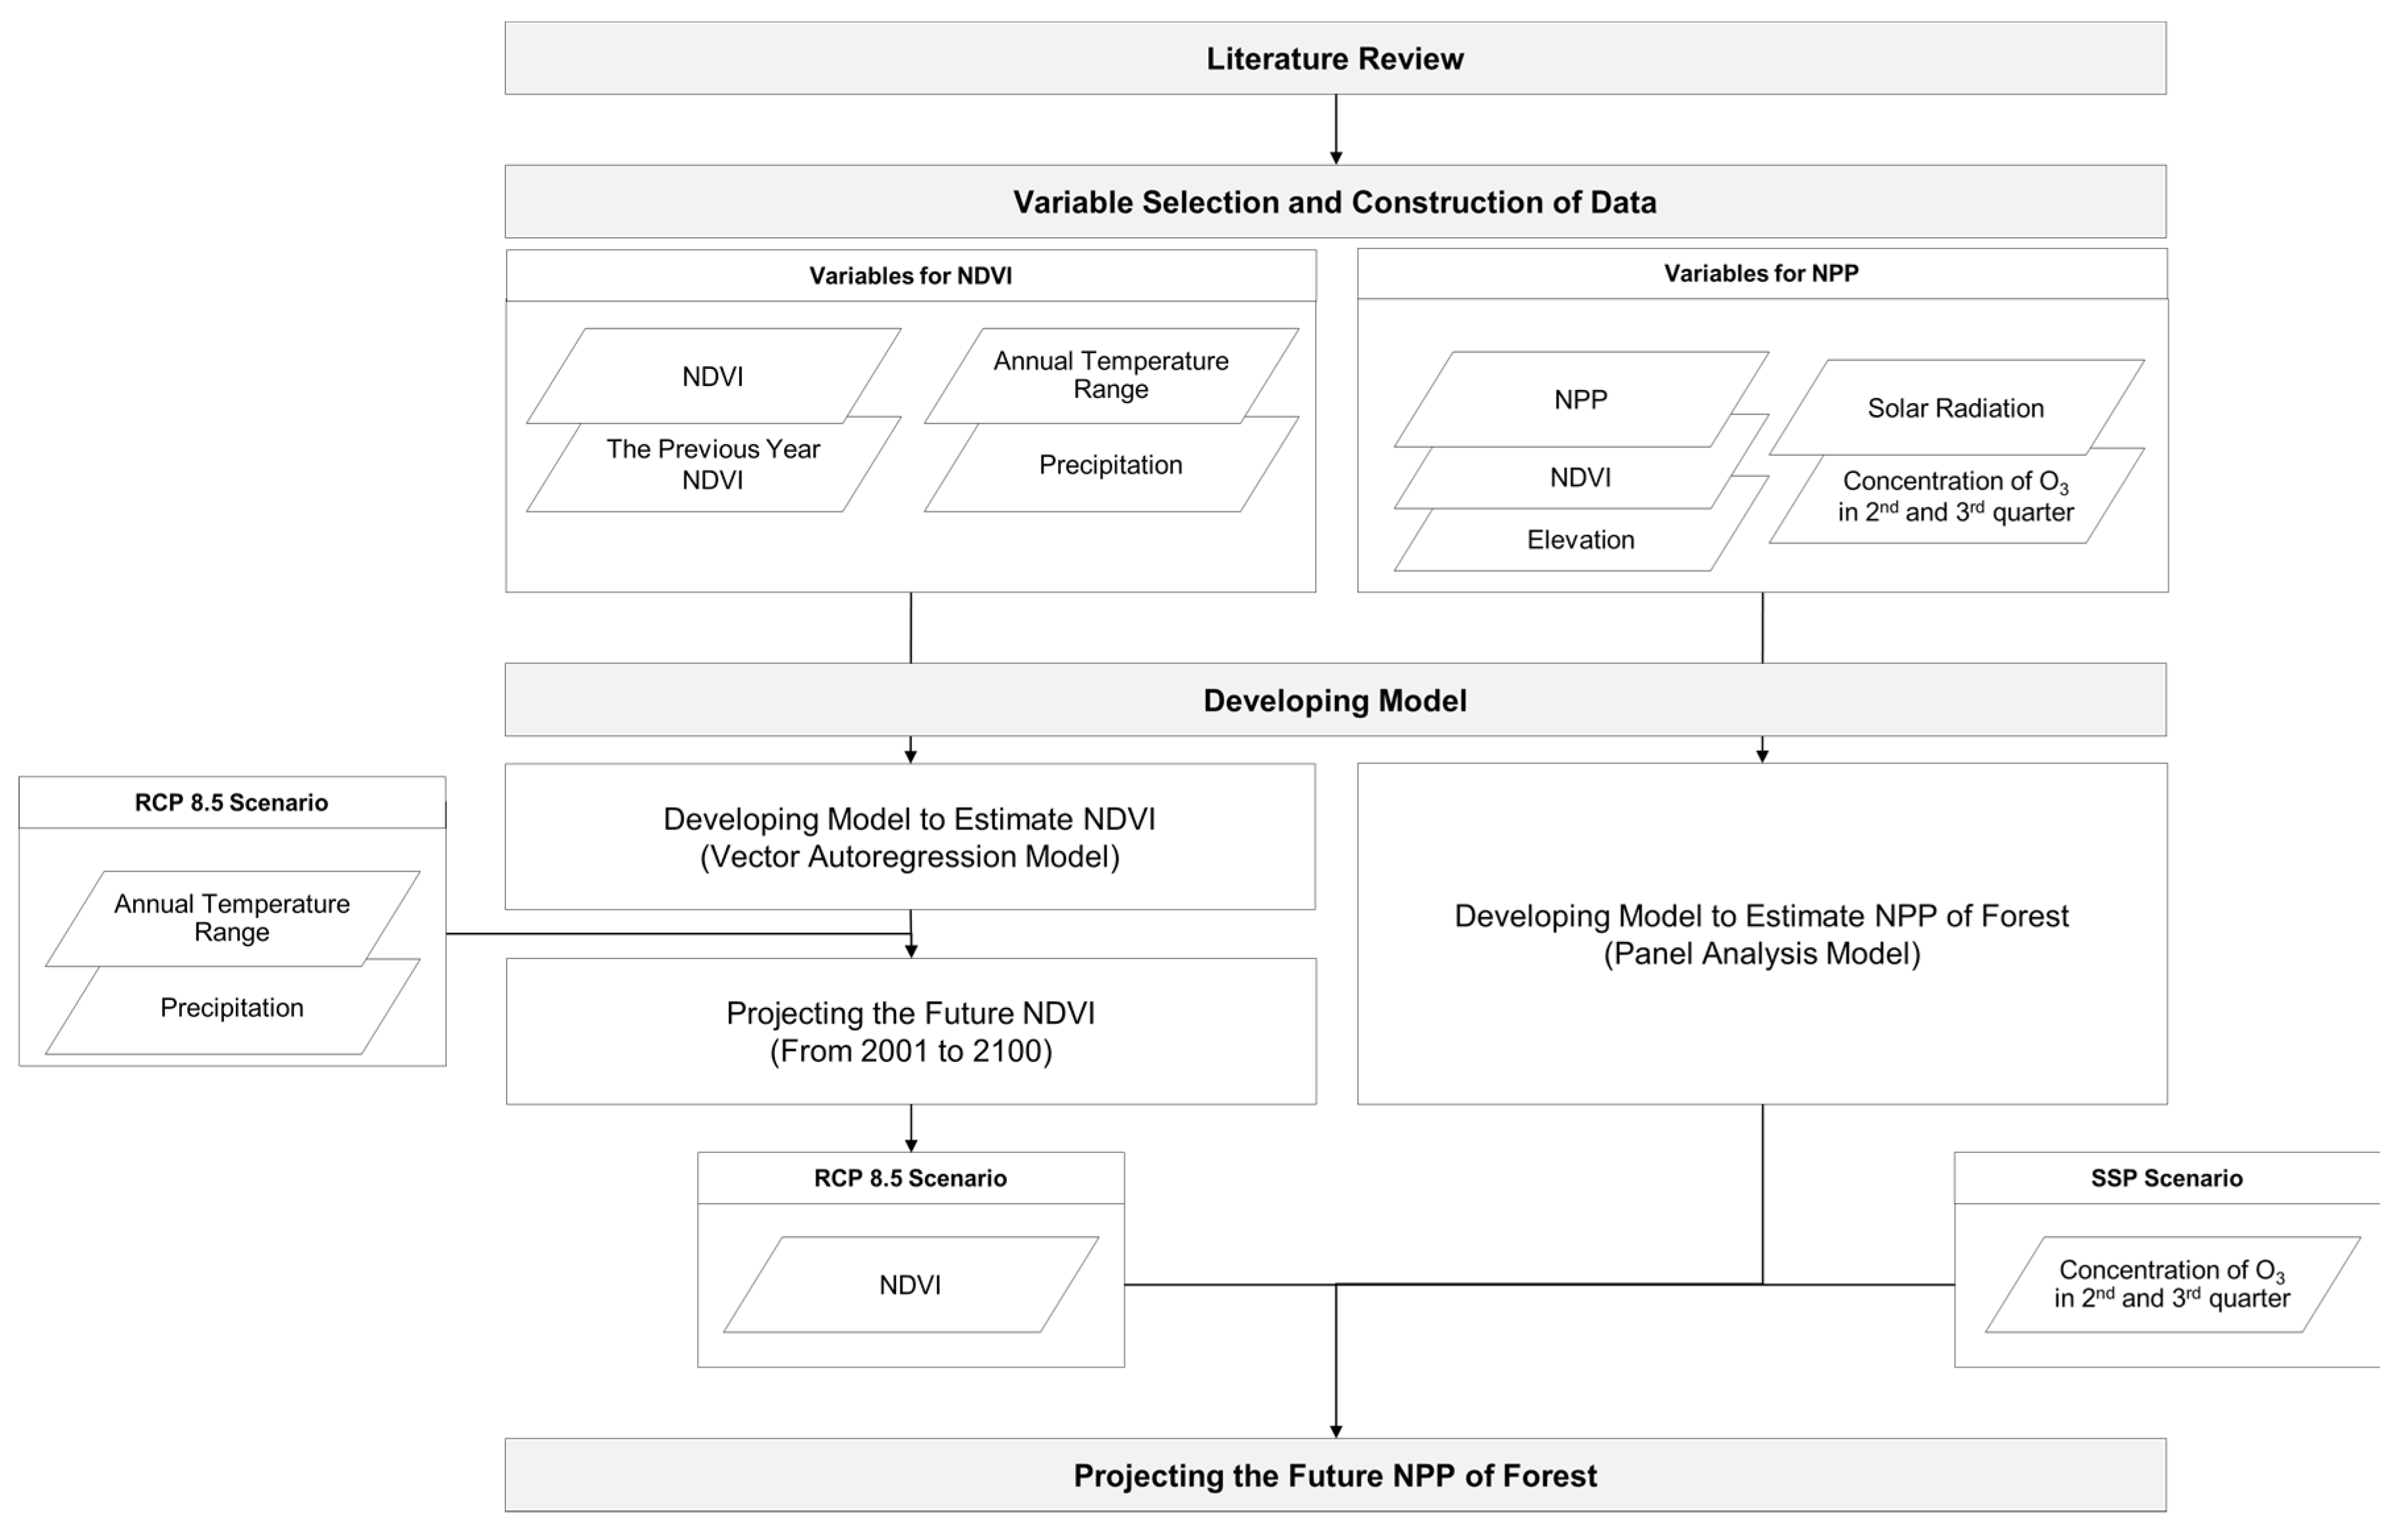
2.2. Estimation and Projection Models for the Net Primary Productivity
2.2.1. Variables Included in the Models for Estimating the Normal Distribution Vegetation Index and the Net Primary Productivity
2.2.2. Statistical Models for Estimating the Normal Distribution Vegetation Index and the Net Primary Productivity
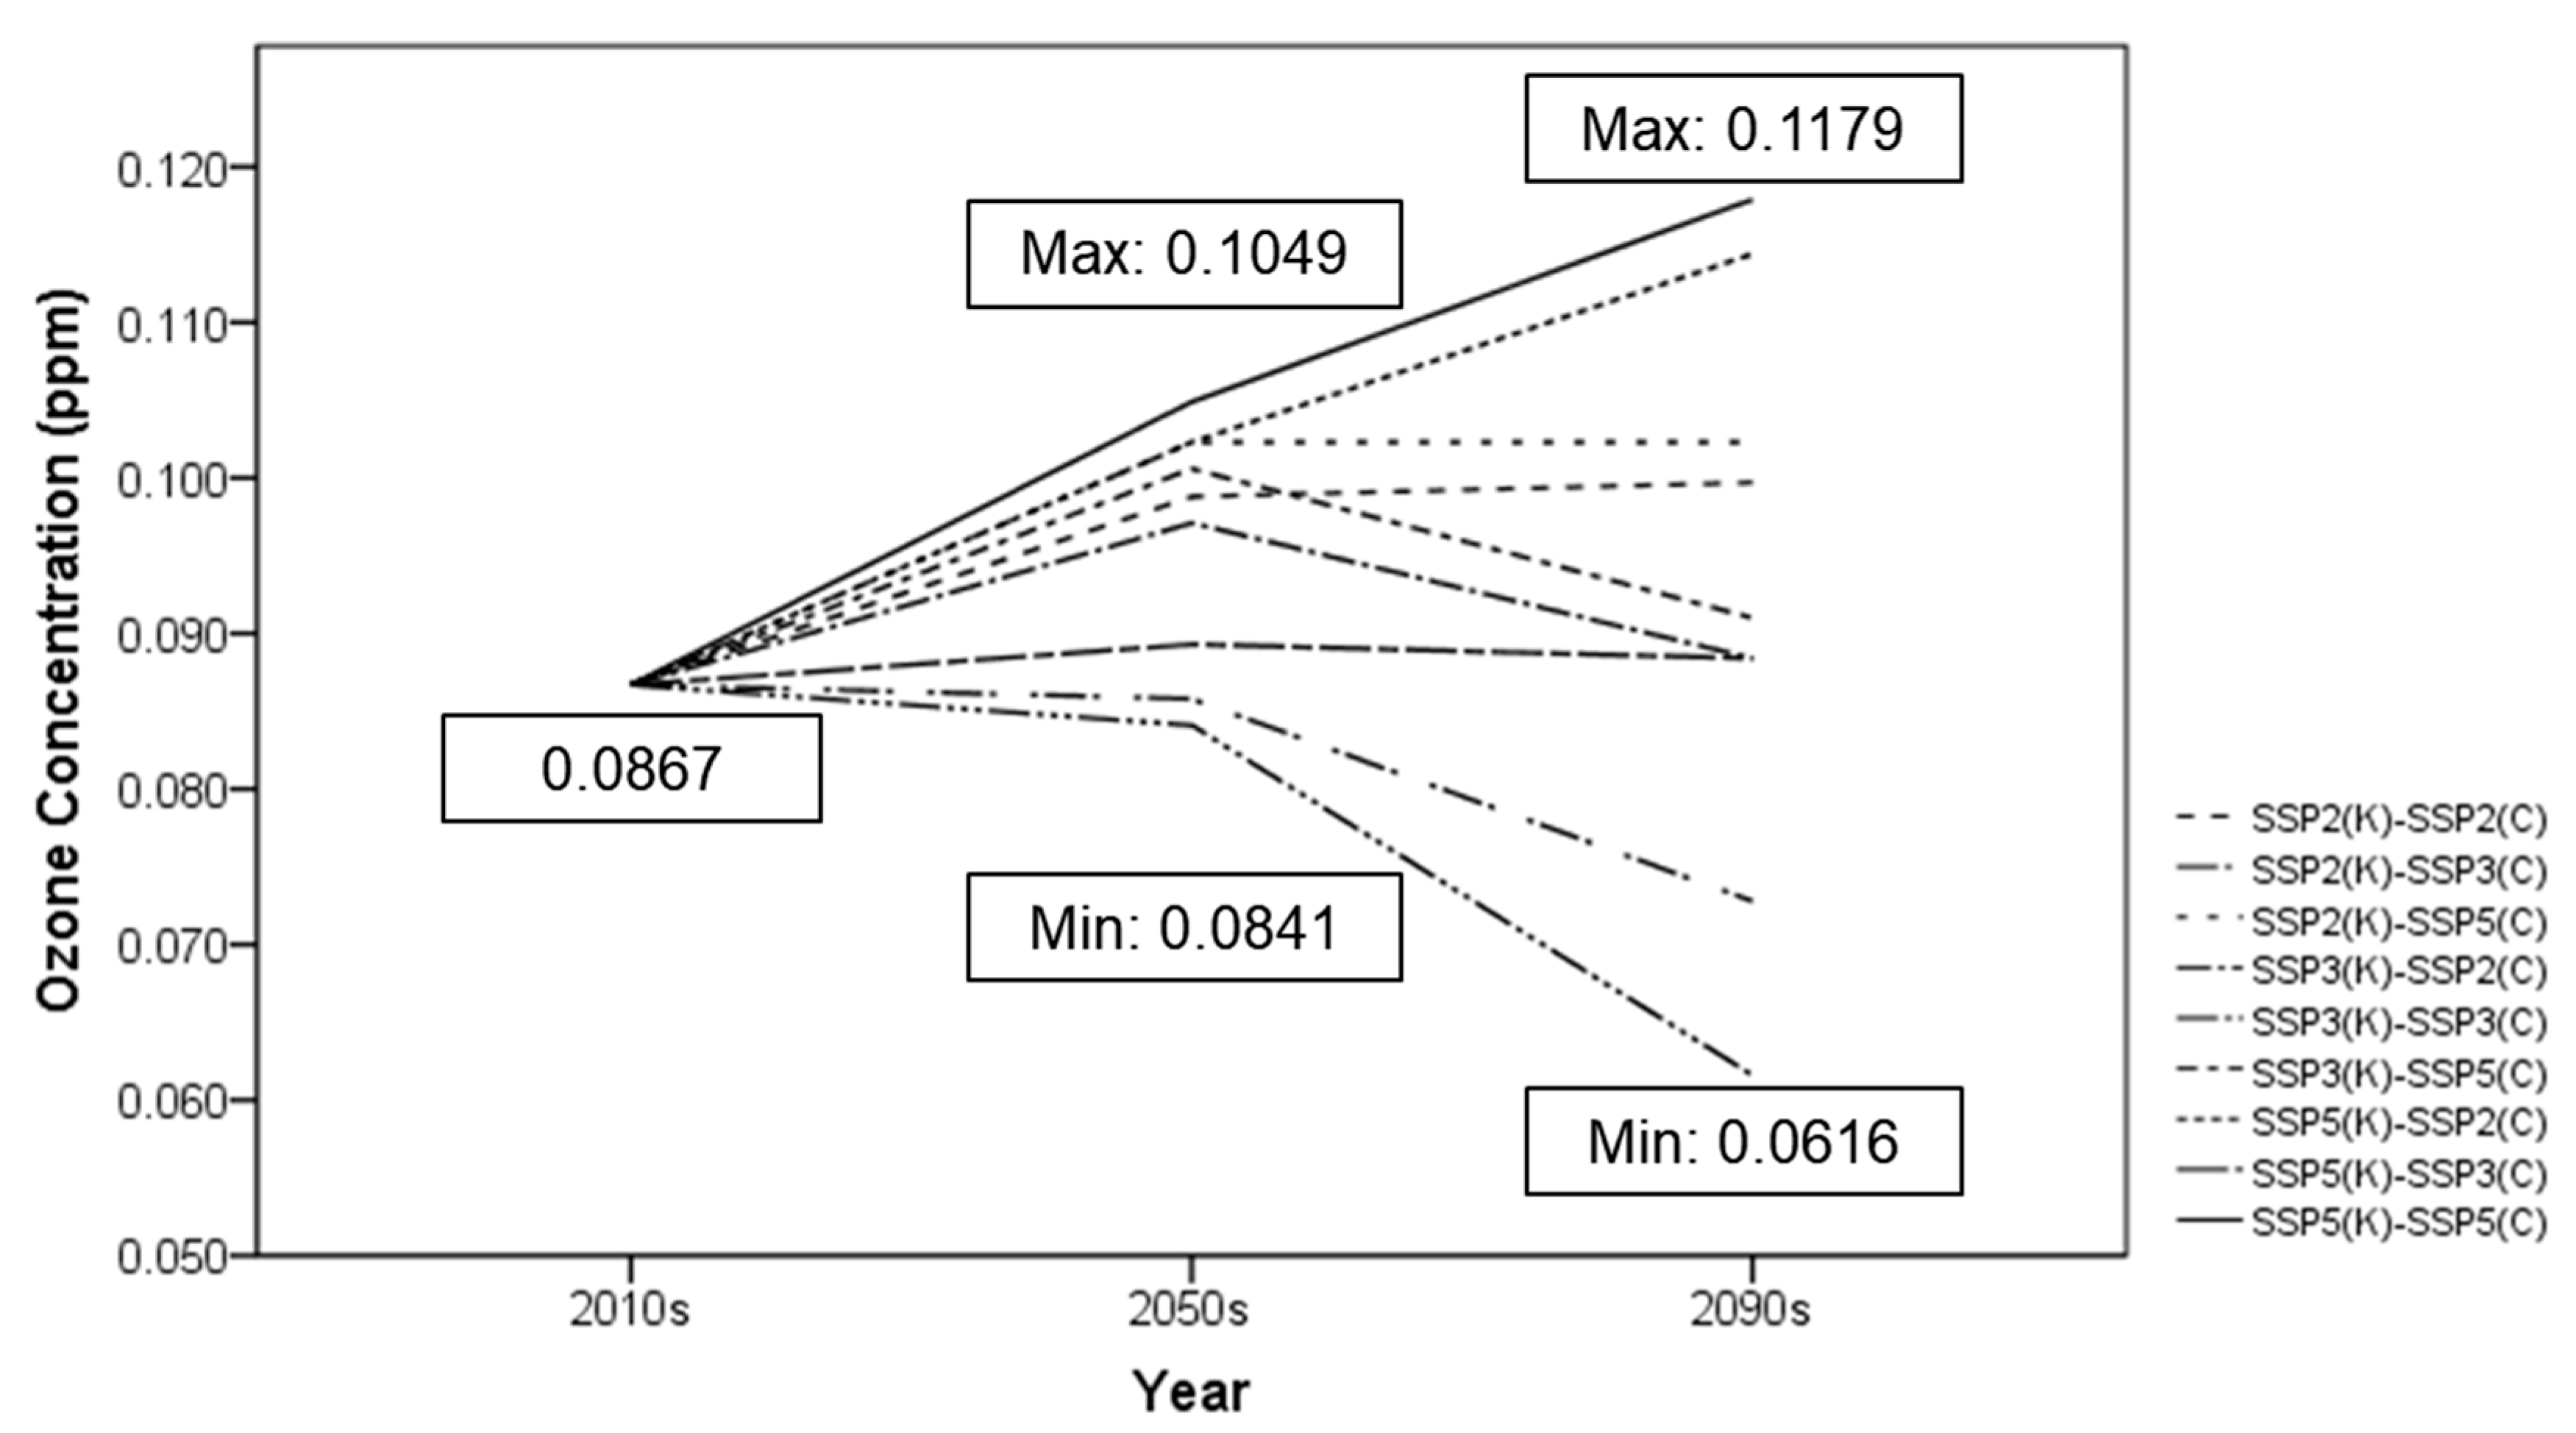
2.2.3. Projection of Climate Variables and Ozone Concentration
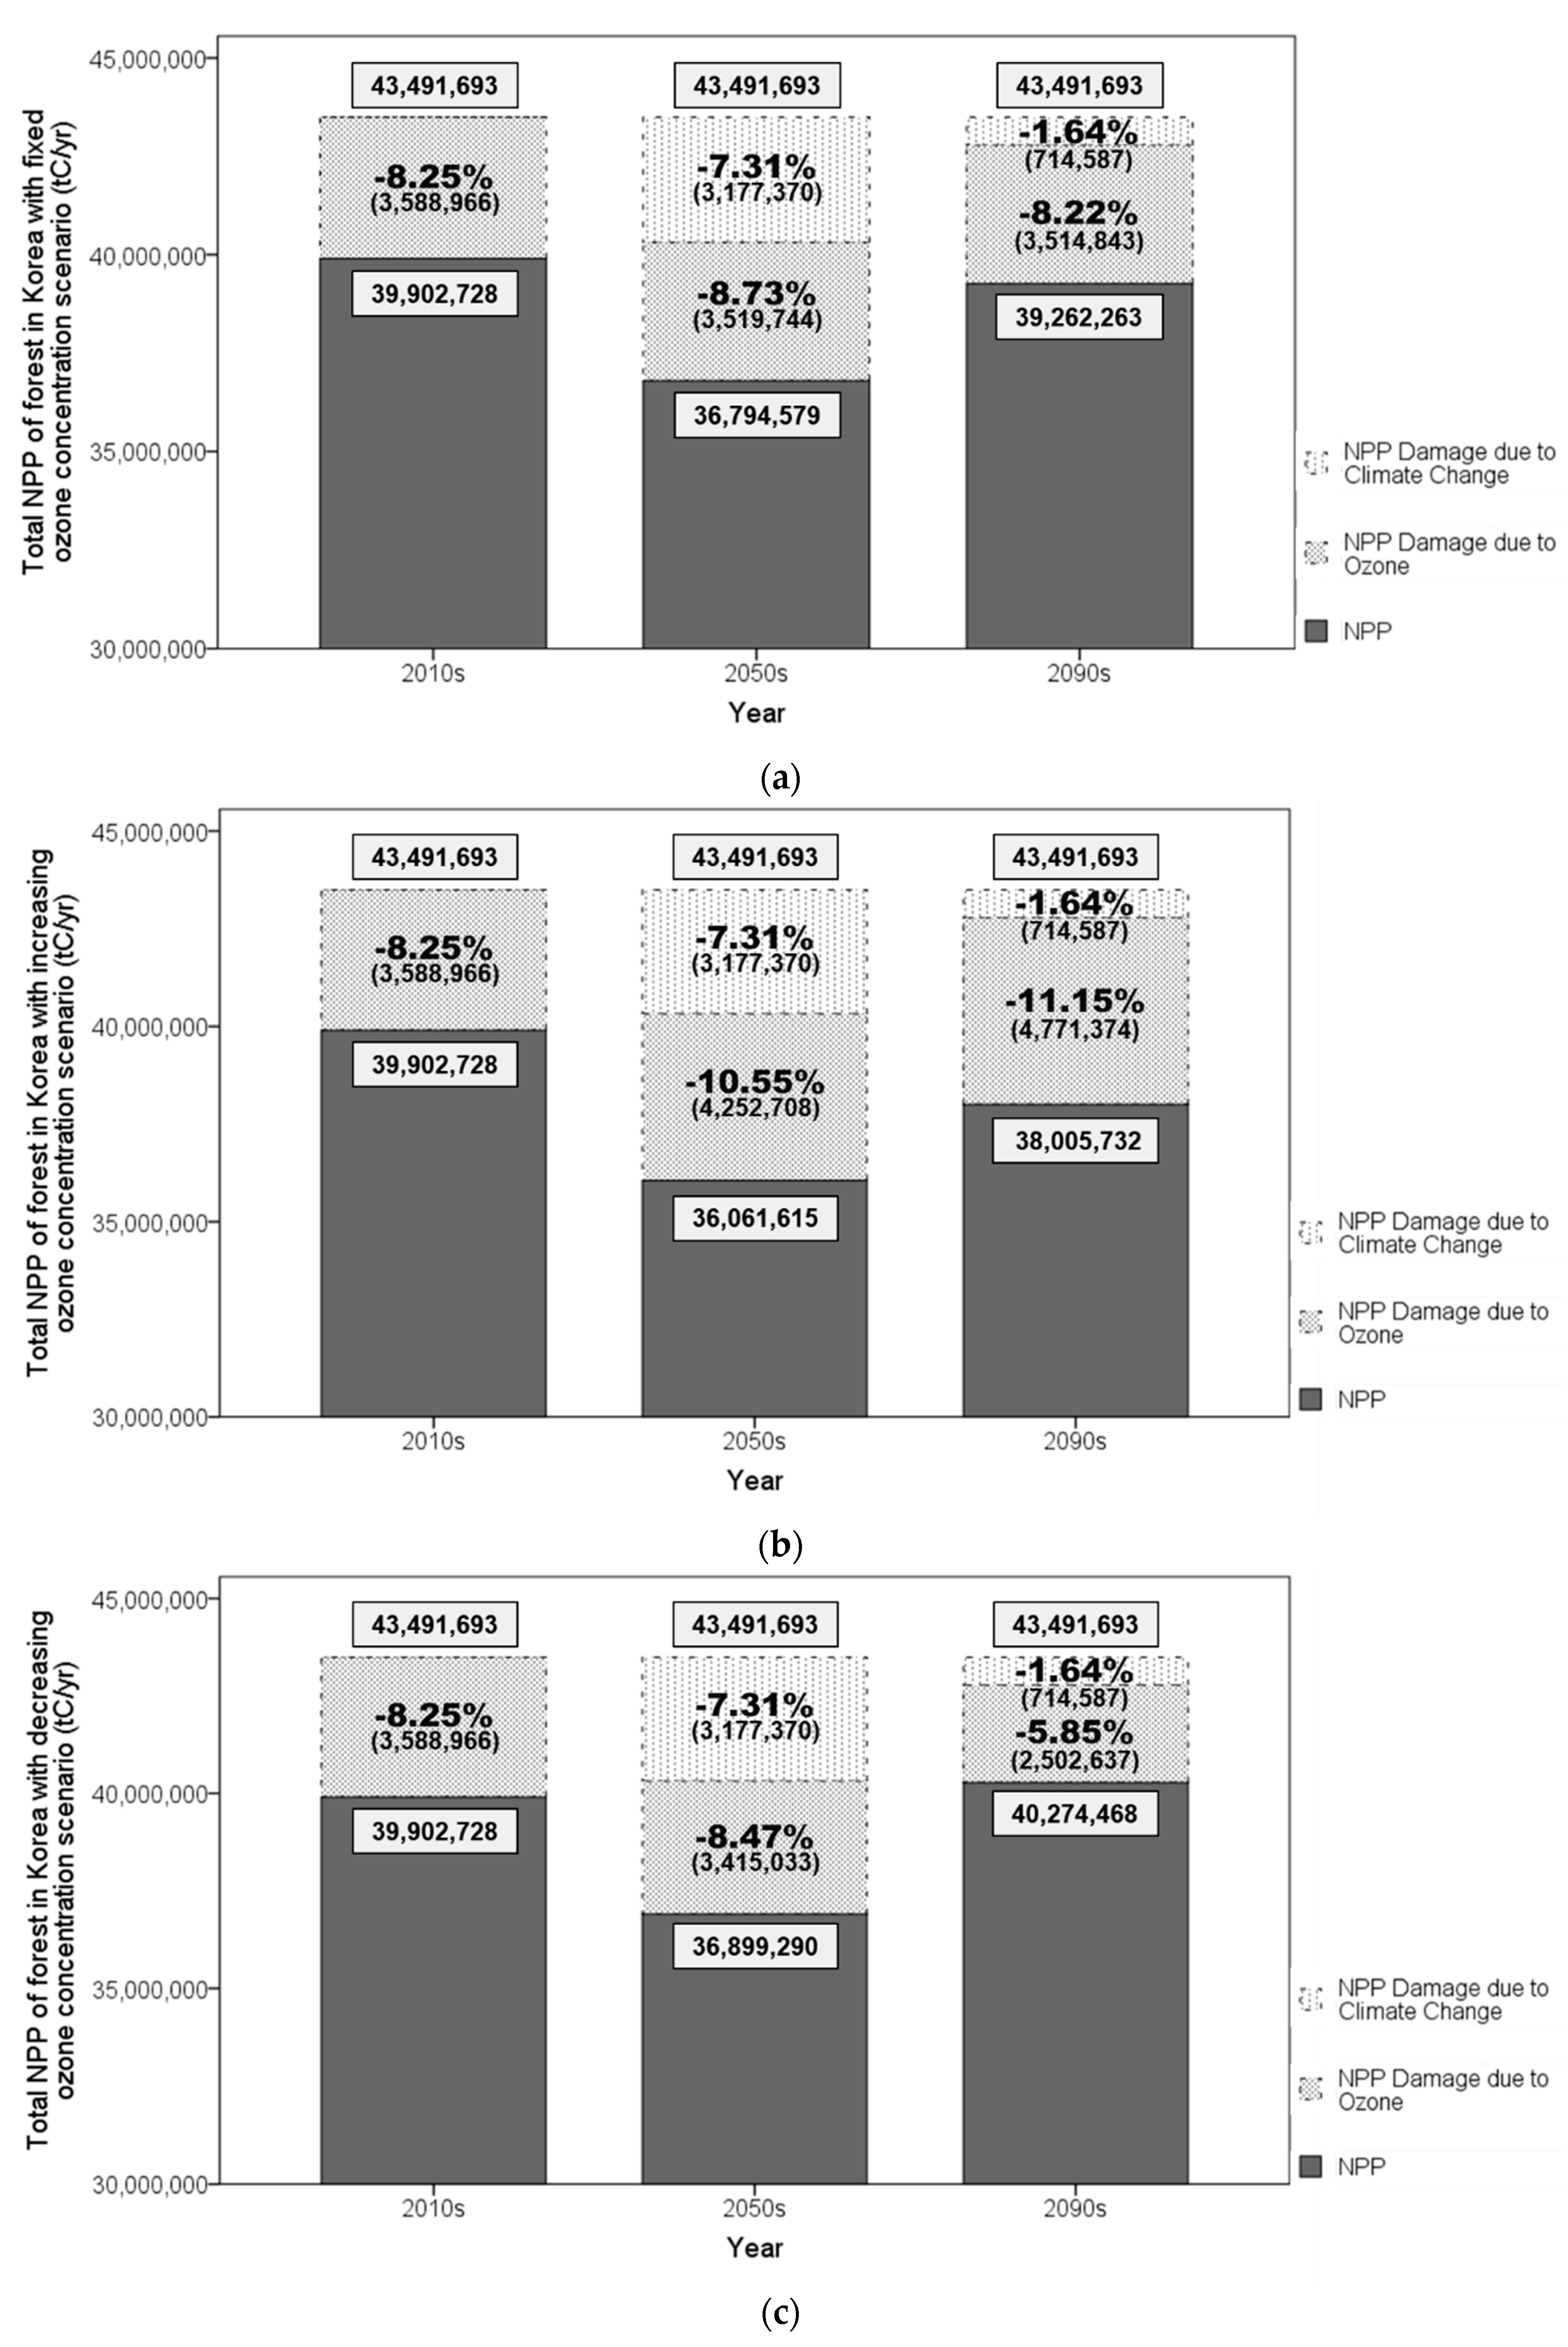
2.2.4. Estimation of Damage of Net Primary Productivity due to Climate Change and Ozone
3. Results and Discussion
3.1. Relationships between the Net Primary Productivity and Ozone Concentration
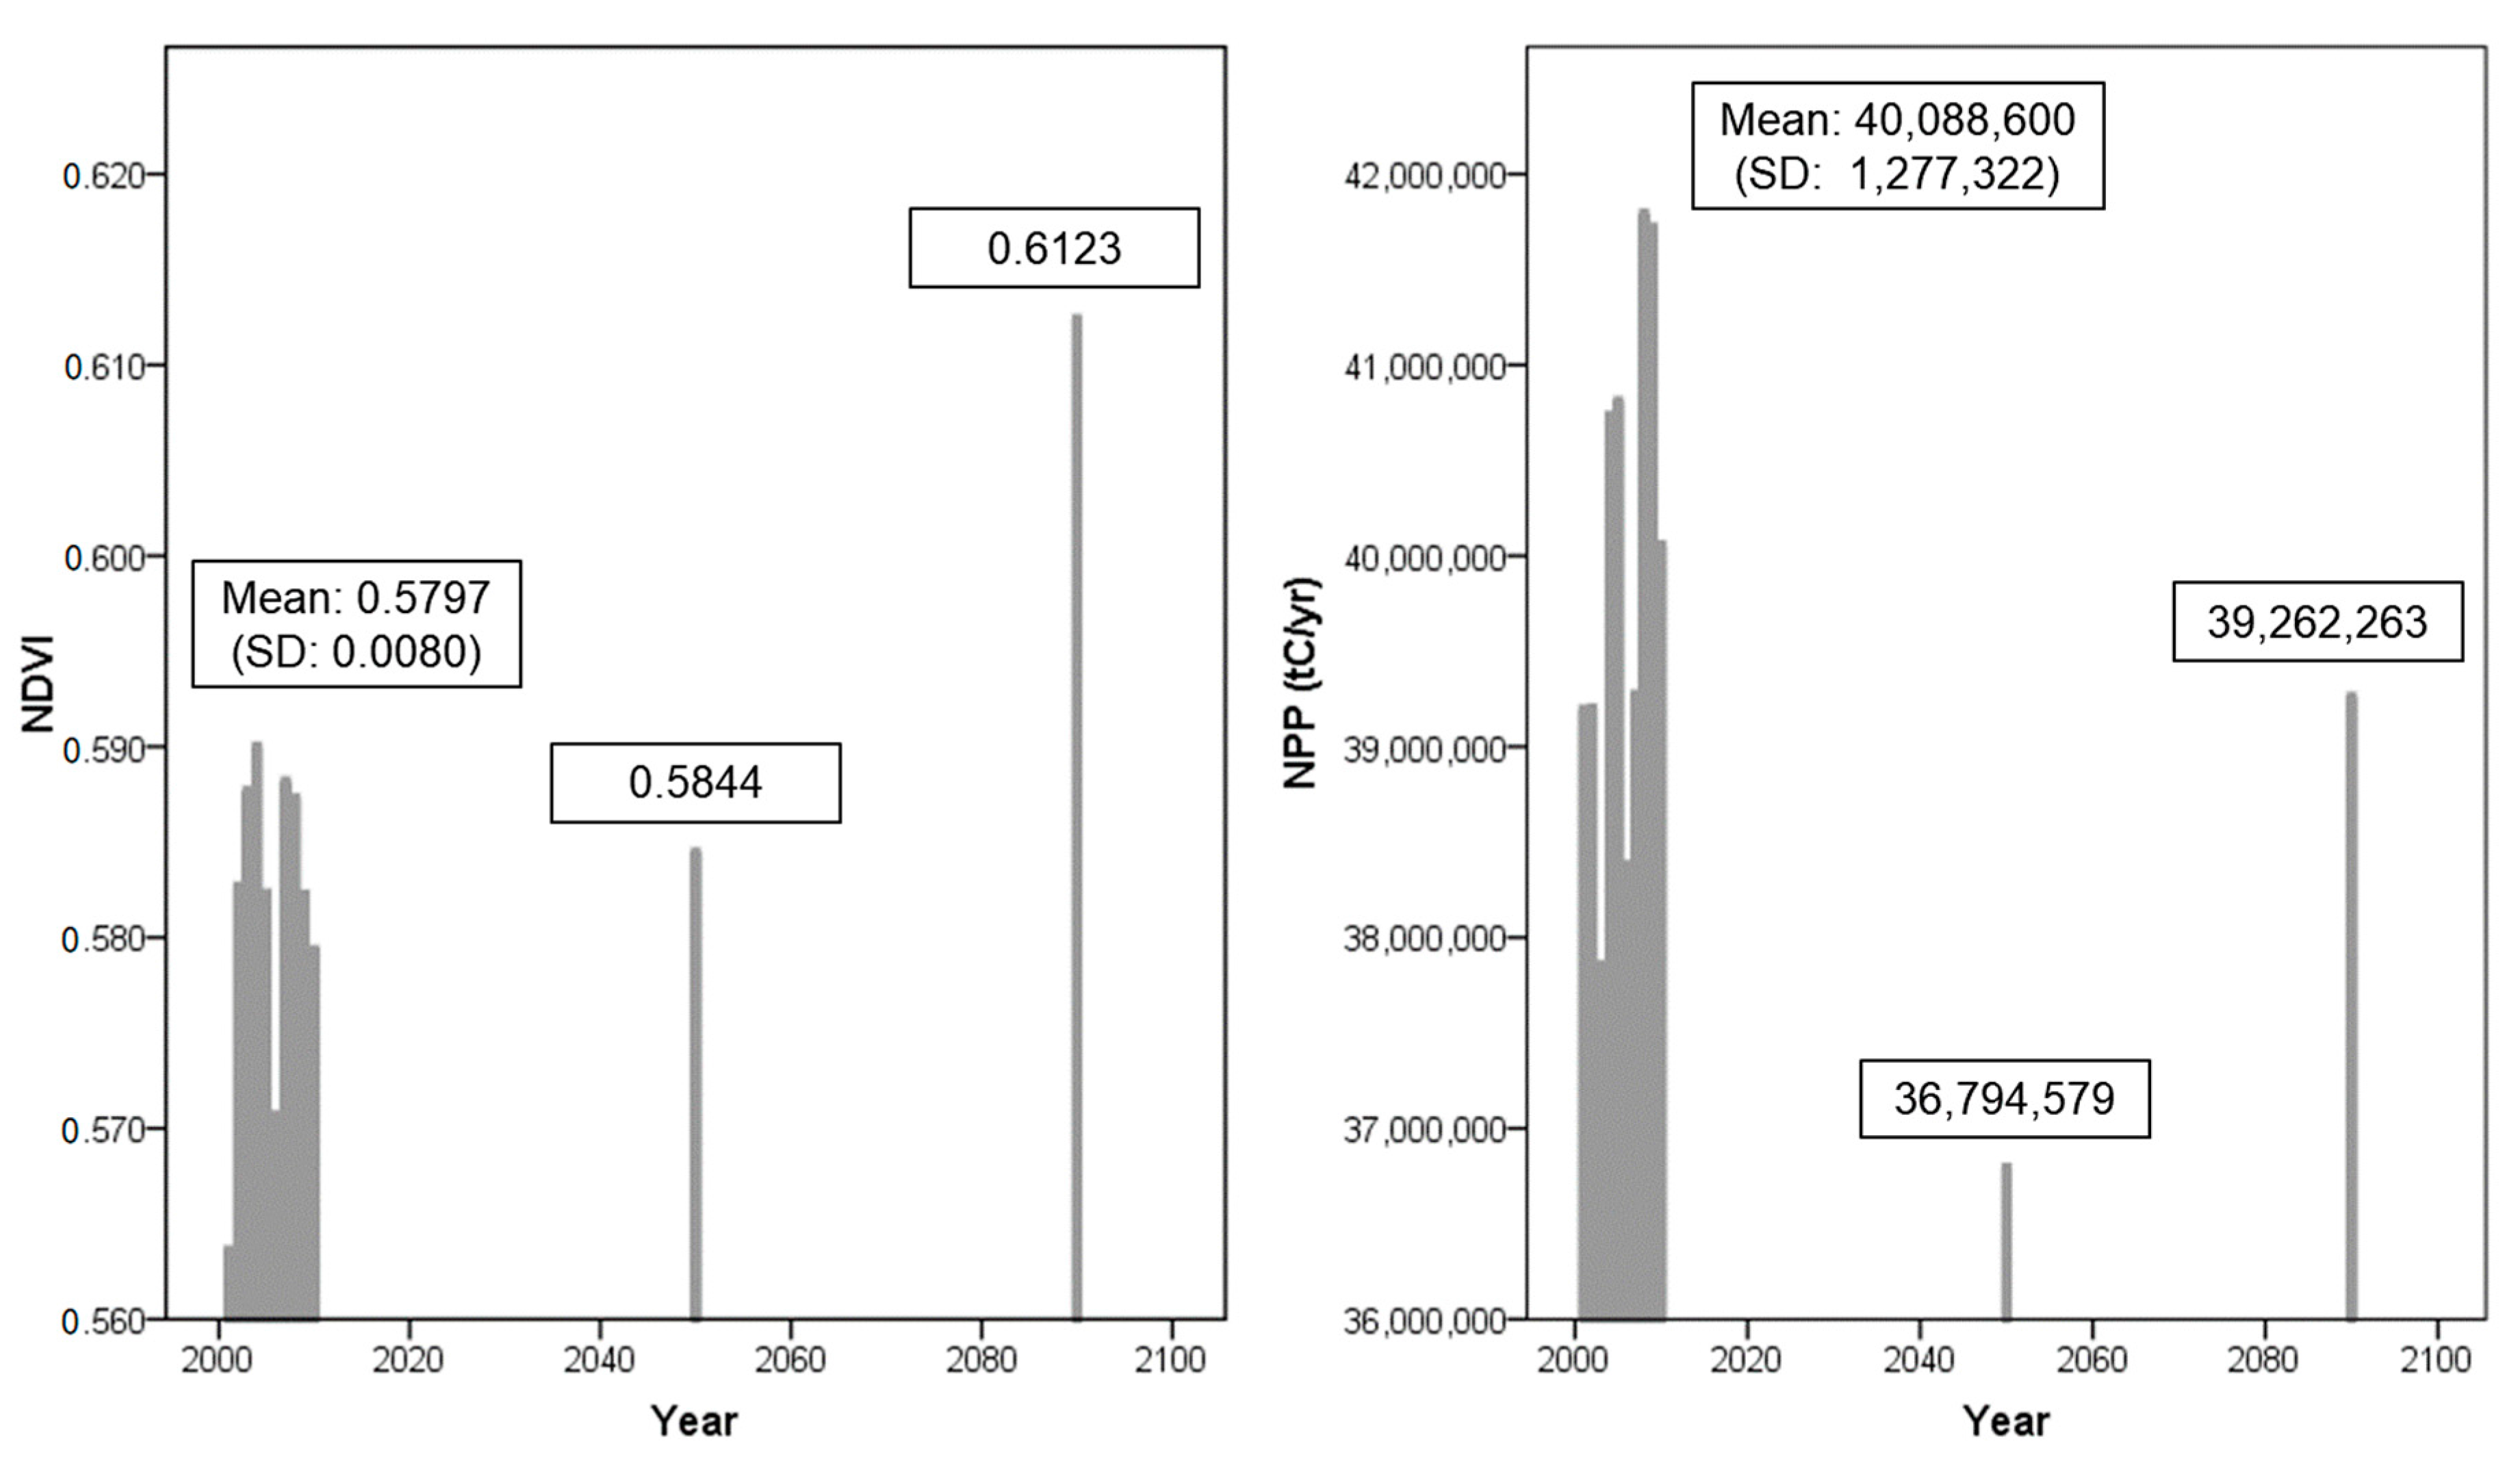
3.2. Relationships among Climate Change, Ozone Concentration and the Net Primary Productivity of Forest
4. Conclusions
Acknowledgments
Author Contributions
Conflicts of Interest
Appendix A

| Categories | Variables | NPP | ||
|---|---|---|---|---|
| Pearson Correlation | Sig. (2-Tailed) | n | ||
| Plants variable | NDVI | 0.641 ** | 0.000 | 630 |
| Previous year NDVI | 0.604 ** | 0.000 | 567 | |
| Evapotranspiration | 0.162 ** | 0.000 | 630 | |
| Potential evapotranspiration | 0.155 ** | 0.000 | 630 | |
| Climate variable | Mean temperature | 0.169 ** | 0.000 | 630 |
| Maximum temperature | 0.240 ** | 0.000 | 630 | |
| Minimum temperature | 0.170 ** | 0.000 | 630 | |
| The highest temperature of the warmest month | −0.023 | 0.561 | 630 | |
| The lowest temperature of the coldest month | 0.273 ** | 0.000 | 630 | |
| Annual temperature range | −0.280 ** | 0.000 | 630 | |
| Precipitation | 0.141 ** | 0.000 | 630 | |
| Solar radiation | 0.295 ** | 0.000 | 630 | |
| Topographical variable | Aspect | c | 630 | |
| Elevation | 0.099 * | 0.013 | 630 | |
| Slope | 0.258 ** | 0.000 | 630 | |
| Air pollutant variable | Ozone concentration in 2nd and 3rd quarters | −0.282 ** | 0.000 | 630 |
| Annual average of ozone concentration | −0.131 ** | 0.002 | 630 | |
Appendix B
| Var | Sd = Sqrt(Var) | |
|---|---|---|
| NPP | 4,567,952 | 2137.277 |
| e | 277,079.1 | 526.383 |
| u | 1,757,345 | 1325.649 |
| (b) id_fe | (B) id_re | (b-B) Difference | Sqrt (diag(V_b-V_B)) S.E. | |
|---|---|---|---|---|
| O3 Con. * | −5250.073 | −6810.416 | 1560.343 | 4354.144 |
| NDVI | 1.176851 | 1.174644 | 0.0022069 | 0.0291254 |
| Solar radiation | 1.036475 | 1.051382 | −0.0149071 | 0.0097422 |
References
- Costanza, R.; D’Arge, R.; De Groot, R.; Farber, S.; Grasso, M.; Hannon, B.; Limburg, K.; Naeem, S.; O’Neill, R.V.; Paruelo, J.; et al. The value of the world’s ecosystem services and natural capital. Nature 1997, 387, 253–260. [Google Scholar] [CrossRef]
- Daily, G.C. Nature’s Services; Island Press: Washington, DC, USA, 1997. [Google Scholar]
- Millennium Ecosystem Assessment. Ecosystems and Human Well-Being; Island Press: Washington, DC, USA, 2003. [Google Scholar]
- De Groot, R.S.; Wilson, M.A.; Boumans, R.M.J. A typology for the classification, description and valuation of ecosystem functions, goods and services. Ecol. Econ. 2002, 41, 393–408. [Google Scholar] [CrossRef]
- Johnson, D.W.; Turner, J.; Kelly, J.M. The Effects of Acid Rain on Forest Nutrient Status. Water Resour. Res. 1982, 18, 449–461. [Google Scholar] [CrossRef]
- Likens, G.E.; Bormann, F.H. Acid Rain: A Serious Regional Environmental Problem. Science 1974, 184, 1176–1179. [Google Scholar] [CrossRef] [PubMed]
- Lee, S.; Byun, J.; Chae, K.; Jeong, J.; Sung, J.; Kwon, T.; Cho, J.; Kim, Y.; Lee, C. Air Pollution and Forest Ecosystem Change; Korea Forest Research Institute: Seoul, Korea, 2011. [Google Scholar]
- Fuhrer, J.; Skarby, L.; Ashmore, M.R. Critical levels for ozone effects on vegetation in Europe. Environ. Pollut. 1997, 97, 91–106. [Google Scholar] [CrossRef]
- Bytnerowicz, A.; Omasa, K.; Paoletti, E. Integrated effects of air pollution and climate change on forests: A northern hemisphere perspective. Environ. Pollut. 2007, 147, 438–445. [Google Scholar] [CrossRef] [PubMed]
- Nowak, D.J.; Hoehn III, R. E.; Crane, D.E.; Stevens, J.C.; Walton, J.T. Assessing Urban Forest Effects and Values; United States Department of Agriculture: Washington, DC, USA, 2007. [Google Scholar]
- World Meteorological Organization; Global Ozone Research; Monitoring Project. Atmospheric Ozone 1985: Assessment of Our Understanding of the Processes Controlling Its Present Distribution and Change; National Aeronautics and Space Administration: Washington, DC, USA, 1985. [Google Scholar]
- Chameides, W.; Walker, J.C.C.G. A photochemical theory of tropospheric ozone. J. Gecophys. Res. 1973, 78, 8751–8760. [Google Scholar] [CrossRef]
- Logan, J.A.; Prather, M.J.; Wofsy, S.C.; Mcelroy, M.B. Tropospheric chemistry: A global perspective. J. Geophys. Res. 1981, 86, 7210–7254. [Google Scholar] [CrossRef]
- National Research Council. Ozone-Forming Potential of Reformulated Gasoline; National Academies Press: Washington, DC, USA, 1999; ISBN 978-0-309-06445-3. [Google Scholar]
- Sicard, P.; Anav, A.; De Marco, A.; Paoletti, E. Projected global ground-level ozone impacts on vegetation under different emission and climate scenarios. Atmos. Chem. Phys. 2017, 17, 12177–12196. [Google Scholar] [CrossRef]
- Sitch, S.; Cox, P.M.; Collins, W.J.; Huntingford, C. Indirect radiative forcing of climate change through ozone effects on the land-carbon sink. Nature 2007, 448, 791–794. [Google Scholar] [CrossRef] [PubMed]
- Han, S.; Lee, J.; Lee, G.; Oh, C. Ozone Tolerance Mechanism and Damage Symptoms of Forests; Korea Forest Research Institute: Seoul, Korea, 2006. [Google Scholar]
- Ainsworth, E.A.; Yendrek, C.R.; Sitch, S.; Collins, W.J.; Emberson, L.D. The effects of tropospheric ozone on net primary productivity and implications for climate change. Annu. Rev. Plant Biol. 2012, 63, 637–661. [Google Scholar] [CrossRef] [PubMed]
- Felzer, B.; Kicklighter, D.; Melillo, J.; Wang, C.; Zhuang, Q.; Prinn, R. Effects of ozone on net primary production and carbon sequestration in the conterminous United States using a biogeochemistry model. Tellus B 2004, 56, 230–248. [Google Scholar] [CrossRef]
- Krupa, S.V.; Manning, W.J. Atmospheric ozone: Formation and effects on vegetation. Environ. Pollut. 1988, 50, 101–137. [Google Scholar] [CrossRef]
- Lindroth, R.L.; Kopper, B.J.; Parsons, W.F.J.; Bockheim, J.G.; Karnosky, D.F.; Hendrey, G.R.; Pregitzer, K.S.; Isebrands, J.G.; Sober, J. Consequences of elevated carbon dioxide and ozone for foliar chemical composition and dynamics in trembling aspen (Populus tremuloides) and paper birch (Betula papyrifera). Environ. Pollut. 2001, 115, 395–404. [Google Scholar] [CrossRef]
- Noormets, A.; Sober, A.; Pell, E.J.; Dickson, R.E.; Podila, G.K.; Sober, J.; Isebrands, J.G.; Karnosky, D.F. Stomatal and non-stomatal limitation to photosynthesis in two trembling aspen (Populus tremuloides Michx.) clones exposed to elevated CO2 and/or O3. Plant Cell Environ. 2001, 24, 327–336. [Google Scholar] [CrossRef]
- D’Amato, G.; Cecchi, L. Effects of climate change on environmental factors in respiratory allergic diseases. Clin. Exp. Allergy 2008, 38, 1264–1274. [Google Scholar] [CrossRef] [PubMed]
- Jang, A.-S. Climate change and air pollution. J. Korean Med. Assoc. 2011, 54, 175. [Google Scholar] [CrossRef]
- Bernard, S.M.; Samet, J.M.; Grambsch, A.; Ebi, K.L.; Romieu, I. The potential impacts of climate variability and change on air pollution-related health effects in the United States. Environ. Health Perspect. 2001, 109 (Suppl. 2), 199–209. [Google Scholar] [CrossRef] [PubMed]
- Chen, K.-S.; Ho, Y.T.; Lai, C.H.; Tsai, Y.A.; Chen, S.-J. Trends in concentration of ground-level ozone and meteorological conditions during high ozone episodes in the Kao-Ping Airshed, Taiwan. J. Air Waste Manag. Assoc. 2004, 54, 36–48. [Google Scholar] [CrossRef] [PubMed]
- Grambsch, A. Climate change and air quality. Potential Impacts Clim. Chang. Transp. 2004, 23, 39–42. [Google Scholar]
- Prather, M.; Gauss, M.; Berntsen, T.; Isaksen, I.; Sundet, J.; Bey, I.; Brasseur, G.; Dentener, F.; Derwent, R.; Stevenson, D.; et al. Fresh air in the 21st century? Geophys. Res. Lett. 2003, 30, 2–5. [Google Scholar] [CrossRef]
- Zhang, M.; Xu, Y.; Itsushi, U.; Hajime, A. A numerical study of tropospheric ozone in the springtime in East Asia. Adv. Atmos. Sci. 2004, 21, 163–170. [Google Scholar] [CrossRef]
- Grygalashvyly, M.; Sonnemann, G.R.; Lübken, F.; Hartogh, P.; Berger, U.; Sonnemann, G.R.; Lübken, F.; Hartogh, P.; Berger, U. Transport of NOx in East Asia identified by satellite and in situ measurements and Lagrangian particle dispersion model simulations. J. Geophys. Res. Atmos. 2014, 1–29. [Google Scholar] [CrossRef]
- Li, J.; Yang, W.; Wang, Z.; Chen, H.; Hu, B.; Li, J.; Sun, Y.; Fu, P.; Zhang, Y. Modeling study of surface ozone source-receptor relationships in East Asia. Atmos. Res. 2016, 167, 77–88. [Google Scholar] [CrossRef]
- Choi, K.-C.; Lee, J.-J.; Bae, C.H.; Kim, C.-H.; Kim, S.; Chang, L.-S.; Ban, S.-J.; Lee, S.-J.; Kim, J.; Woo, J.-H. Assessment of transboundary ozone contribution toward South Korea using multiple source–receptor modeling techniques. Atmos. Environ. 2014, 92, 118–129. [Google Scholar] [CrossRef]
- Sim, C.S.; Seo, J.H. Air Quality Issues Associated with Future Domestic Coal Power Planning and Emission Projections of East Asia; Korea Environment Institute: Sejong, Korea, 2013. [Google Scholar]
- Nagashima, T.; Ohara, T.; Sudo, K.; Akimoto, H. The relative importance of various source regions on East Asian surface ozone. Atmos. Chem. Phys. 2010, 10, 11305–11322. [Google Scholar] [CrossRef]
- Kaitala, V.; Pohjola, M.; Tahvonen, O. Transboundary air pollution and soil acidification: A dynamic analysis of an acid rain game between Finland and the USSR. Environ. Resour. Econ. 1992, 2, 161–181. [Google Scholar] [CrossRef]
- Lam, K.S.; Wang, T.J.; Wu, C.L.; Li, Y.S. Study on an ozone episode in hot season in Hong Kong and transboundary air pollution over Pearl River Delta region of China. Atmos. Environ. 2005, 39, 1967–1977. [Google Scholar] [CrossRef]
- Dong, J.-I. Ambient Air Quality of China and Transboundary Transport of Air Pollutants. Korean J. Sanit. 1993, 8, 49–66. [Google Scholar]
- Gibbs, H.K.; Brown, S.; Niles, J.O.; Foley, J.A. Monitoring and estimating tropical forest carbon stocks: Making REDD a reality. Environ. Res. Lett. 2007, 2, 45023. [Google Scholar] [CrossRef]
- Adams, B.; White, A.; Lenton, T.M. An analysis of some diverse approaches to modelling terrestrial net primary productivity. Ecol. Modell. 2004, 177, 353–391. [Google Scholar] [CrossRef]
- Michaletz, S.T.; Cheng, D.; Kerkhoff, A.J.; Enquist, B.J. Convergence of terrestrial plant production across global climate gradients. Nature 2014, 512, 39–43. [Google Scholar] [CrossRef] [PubMed]
- Na, S., II; Hong, S.Y.; Kim, Y.H.; Lee, K.D.; Jang, S.Y. Prediction of Rice Yield in Korea using Paddy Rice NPP index-Application of MODIS data and CASA Model. Korean J. Remote Sens. 2013, 29, 461–476. [Google Scholar] [CrossRef]
- Ito, A. The regional carbon budget of East Asia simulated with a terrestrial ecosystem model and validated using AsiaFlux data. Agric. For. Meteorol. 2008, 148, 738–747. [Google Scholar] [CrossRef]
- Ollinger, S.V.; Aber, J.D.; Reich, P.B. Simulating ozone effects on forest productivity: Interactions among leaf-, canopy-, and stand-level processes. Ecol. Appl. 1997, 7, 1237–1251. [Google Scholar] [CrossRef]
- Running, S.W.; Zhao, M. User’s Guide Daily GPP and Annual NPP (MOD17A2/A3) Products NASA Earth Observing System MODIS Land Algorithm; NASA Press: Washington, DC, USA, 2015. [Google Scholar]
- Tol, R.S.J.; Fankhauser, S.; Richels, R.G.; Smith, J.B. How much damage will climate change do? Recent estimates. World Econ. Thames 2000, 1, 179–206. [Google Scholar]
- Yuan, J.; Niu, Z.; Wang, C. Vegetation NPP distribution based on MODIS data and CASA model—A case study of northern Hebei Province. Chinese Geogr. Sci. 2006, 16, 334–341. [Google Scholar] [CrossRef]
- Potter, C.; Klooster, S.; Myneni, R.; Genovese, V.; Tan, P.N.; Kumar, V. Continental-scale comparisons of terrestrial carbon sinks estimated from satellite data and ecosystem modeling 1982–1998. Glob. Planet. Chang. 2003, 39, 201–213. [Google Scholar] [CrossRef]
- Yu, Y.; Chen, J.M.; Yang, X.; Fan, W.; Li, M.; He, L. Influence of site index on the relationship between forest net primary productivity and stand age. PLoS ONE 2017, 12, 1–20. [Google Scholar] [CrossRef] [PubMed]
- Turner, D.P.; Cohen, W.B.; Kennedy, R.E.; Fassnacht, K.S.; Briggs, J.M. Relationships between leaf area index and Landsat TM spectral vegetation indices across three temperate zone sites. Remote Sens. Environ. 1999, 70, 52–68. [Google Scholar] [CrossRef]
- Wang, Q.; Adiku, S.; Tenhunen, J.; Granier, A. On the relationship of NDVI with leaf area index in a deciduous forest site. Remote Sens. Environ. 2005, 94, 244–255. [Google Scholar] [CrossRef]
- Fan, L.; Gao, Y.; Brück, H.; Bernhofer, C. Investigating the relationship between NDVI and LAI in semi-arid grassland in Inner Mongolia using in-situ measurements. Theor. Appl. Climatol. 2009, 95, 151–156. [Google Scholar] [CrossRef]
- Johnson, L.F. Temporal stability of an NDVI-LAI relationship in a Napa Valley vineyard. Aust. J. Grape Wine Res. 2003, 9, 96–101. [Google Scholar] [CrossRef]
- Goswami, S.; Gamon, J.; Vargas, S.; Tweedie, C. Relationships of NDVI, Biomass, and Leaf Area Index (LAI) for Six Key Plant Species in Barrow, Alaska; ProQuest Press: Ann Arbor, MI, USA, 2015. [Google Scholar]
- Lee, K. Change of Forest Ecosystem because of Air Pollution and Acid Rain. Envirion. Symp. Air Quility Manag. Busan 1996, 1996, 26–40. [Google Scholar]
- Woo, S.-Y.; Lee, S.H.; Kwan, K.W.; Lee, J.C.; Choi, J.H. Growth, Photosynthesis, and Ascorbate Peroxidase Activity of Several Species to the Ozone Exposure. J. Korean For. Soc. 2004, 93, 409–414. [Google Scholar]
- Lee, K.J.; Han, S.H.; Kim, G.B.; Kim, T.K. A study on the Correlation between Ambient Ozone Concentration and Tree Health of Zelkova serrata Makino Street Trees In Seoul. Bull. Arbor. SEOUL Natl. Univ. 1999, 19, 54–65. (In Korean) [Google Scholar]
- Reig-Armiñana, J.; Calatayud, V.; Cerveró, J.; Garcıa-Breijo, F.J.; Ibars, A.; Sanz, M.J. Effects of ozone on the foliar histology of the mastic plant (Pistacia lentiscus L.). Environ. Pollut. 2004, 132, 321–331. [Google Scholar] [CrossRef] [PubMed]
- Singh, H.B.; Ludwig, F.L.; Johnson, W.B. Tropospheric ozone: Concentrations and variabilities in clean remote atmospheres. Atmos. Environ. 1978, 12, 2185–2196. [Google Scholar] [CrossRef]
- Logan, J.A. Ozone in rural areas of the United States. J. Geophys. Res. Atmos. 1989, 94, 8511–8532. [Google Scholar] [CrossRef]
- Han, C. Lecture for Panel Data; PAKYOUNGSA: Seoul, Korea, 2017. [Google Scholar]
- Min, I.; Choi, P. STATA Panel Data Analysis; The Korean Association of STATA: Seoul, Korea, 2009. [Google Scholar]
- Lee, H.; No, S. Advanced Statistical Analysis; Moonwoosa: Goyang, Korea, 2012. [Google Scholar]
- Moon, G. Vector Autoregressive Model: VAR. J. Korean Off. Stat. 1997, 2, 23–56. [Google Scholar]
- Stock, J.H.; Watson, M.W.; Stock, J.H.; Watson, M.W. Vector Autoregressions. J. Econ. Perspect. 2001, 15, 101–115. [Google Scholar] [CrossRef]
- New, M.; Hulme, M.; Jones, P. Representing twentieth-century space-time climate variability. Part II: Development of 1901–1996 monthly grids of terrestrial surface climate. J. Clim. 2000, 13, 2217–2238. [Google Scholar] [CrossRef]
- Abrigo, M.R.M.; Love, I. Estimation of panel vector autoregression in Stata. Stata J. 2016, 16, 778–804. [Google Scholar] [CrossRef]
- Bierens, H.J. VAR Models with Exogenous Variables. Available online: http://www.personal.psu.edu/hxb11 /EasyRegTours/VAR_Tourfiles/VARX.PDF (accessed on 16 June 2017).
- Marquez, J.; Spanos, A.; Adams, F.G.; Balestra, P.; Dagenais, M.G.; Kendrick, D.; Pindyck, R.S.; Welfe, W. The Econometrics of Panel Data; Springer: Beilin, Germany, 2008; ISBN 9783540689201. [Google Scholar]
- Edwards, J.A. Building Better Econometric Models Using Cross Section and Panel Data; Business Expert Press: New York, NY, USA, 2014. [Google Scholar]
- Raj, B.; Baltagi, B.H. Panel Data Analysis; Springer Science & Business Media: Beilin, Germany, 2012; ISBN 9783642501296. [Google Scholar]
- Lee, C.; Kim, S.; Kim, J.-C. Detailed Investigation to Identify the Cuase of High Concentration of Ozone Generation (III); National Institute of Environmental Research: Incheon, Korea, 2011. [Google Scholar]
- Shin, H.; Son, J.; Roh, S.; Park, J.; Lee, M.; Kim, J. The Study on the Meteorology Adjusted Long Term Trend of Ozone Induced by the Statistical Model; National Institute of Environmental Research: Incheon, Korea, 2012. [Google Scholar]
- Park, J.H.; Lee, D.-K.; Lee, M.-J.; Park, C.; Jung, T.-Y.; Kim, S.-K.; Hong, S.-C.; Baek, S.-J.; Lee, J.-H. Estimating Climate Pollutants Emissions and Service Demands considering Socio-economic Change: Residential·Commercial Sector, Transportation Sector, Industrial Sector. J. Clim. Chang. Res. 2015, 6, 291. [Google Scholar] [CrossRef]
- Lunetta, R.S.; Knight, J.F.; Ediriwickrema, J.; Lyon, J.G.; Worthy, L.D. Land-cover change detection using multi-temporal MODIS NDVI data. Remote Sens. Environ. 2006, 105, 142–154. [Google Scholar] [CrossRef]
- Jin, Y.; Sung, S.; Lee, D.K.; Biging, G.S.; Jeong, S. Mapping deforestation in north korea using phenology-based multi-index and random forest. Remote Sens. 2016, 8, 997. [Google Scholar] [CrossRef]
- Becker-Reshef, I.; Vermote, E.; Lindeman, M.; Justice, C. A generalized regression-based model for forecasting winter wheat yields in Kansas and Ukraine using MODIS data. Remote Sens. Environ. 2010, 114, 1312–1323. [Google Scholar] [CrossRef]
- Mkhabela, M.S.; Bullock, P.; Raj, S.; Wang, S.; Yang, Y. Crop yield forecasting on the Canadian Prairies using MODIS NDVI data. Agric. For. Meteorol. 2011, 151, 385–393. [Google Scholar] [CrossRef]
- Kang, S.; Kim, Y.; Kim, Y. Errors of MODIS product of Gross Primary Production by using Data Assimilation Office Meteorological Data. Korean J. Agric. For. Meteorol. 2005, 7, 171–183. [Google Scholar]
- Zhang, J.; Yedlapalli, P.; Lee, J.W. Thermodynamic analysis of hydrate-based pre-combustion capture of CO2. Chem. Eng. Sci. 2009, 64, 4732–4736. [Google Scholar] [CrossRef]
- Lee, D.-K.; Park, C.; Oh, Y.-C. Projected Spatial-Temporal changes in carbon reductions of Soil and Vegetation in South Korea under Climate Change, 2000–2100. J. Korean Soc. Rural Plan. 2010, 16, 109–116. [Google Scholar]
- Zhu, Z.; Piao, S.; Myneni, R.B.; Huang, M.; Zeng, Z.; Canadell, J.G.; Ciais, P.; Sitch, S.; Friedlingstein, P.; Arneth, A.; et al. Greening of the Earth and its drivers. Nat. Clim. Chang. 2016, 6, 791–795. [Google Scholar] [CrossRef]
- Nemani, R.R.; Keeling, C.D.; Hashimoto, H.; Jolly, W.M.; Piper, S.C.; Tucker, C.J.B.; Myneni, R.; Running, S.W. Climate-Driven Increases in Global Terrestrial Net Primary Production from 192 to 1999. Science 2003, 300, 1560–1563. [Google Scholar] [CrossRef] [PubMed]
- Proietti, C.; Anav, A.; De Marco, A.; Sicard, P.; Vitale, M. A multi-sites analysis on the ozone effects on Gross Primary Production of European forests. Sci. Total Environ. 2016, 556, 1–11. [Google Scholar] [CrossRef] [PubMed]

| Year | Korea | China | ||||
|---|---|---|---|---|---|---|
| SSP2 | SSP3 | SSP5 | SSP2 | SSP3 | SSP5 | |
| 2010s | 1.06 | 1.06 | 1.06 | 21.21 | 21.21 | 21.21 |
| 2050s | 1.252 | 1.174 | 1.388 | 26.244 | 17.78 | 28.25 |
| 2090s | 1.23 | 0.754 | 1.868 | 26.95 | 9.638 | 28.984 |
| Variables | Coef. | Std. Error | Std. Coef. | t-Statistic | p-Value |
|---|---|---|---|---|---|
| (Constant) | −574.602 | 323.55 | −1.78 | 0.076 | |
| Previous year NDVI | 0.881 | 0.02 | 0.879 | 46.16 | 0.000 |
| Precipitation (mm) | 0.222 | 0.08 | 0.052 | 2.82 | 0.005 |
| Annual Temperature Range 1 (°C) | 248.263 | 82.74 | 0.057 | 3.00 | 0.003 |
| Variables | Coef. | Std. Error | Z | p-Value |
|---|---|---|---|---|
| (Constant) | −3548.925 | 569.91 | −6.23 | 0.000 |
| NVDI | 1.175 | 0.06 | 18.97 | 0.000 |
| Solar Radiation (MJ/m2) | 1.036 | 0.07 | 14.76 | 0.000 |
| Elevation (m) | −4.752 | 1.46 | −3.25 | 0.001 |
| Ozone concentration in 2nd and 3rd quarters (ppm) | −6810.416 | 3393.69 | −2.01 | 0.045 |
© 2018 by the authors. Licensee MDPI, Basel, Switzerland. This article is an open access article distributed under the terms and conditions of the Creative Commons Attribution (CC BY) license (http://creativecommons.org/licenses/by/4.0/).
Share and Cite
Park, J.H.; Lee, D.K.; Gan, J.; Park, C.; Kim, S.; Sung, S.; Jung, T.Y.; Hong, S.C. Effects of Climate Change and Ozone Concentration on the Net Primary Productivity of Forests in South Korea. Forests 2018, 9, 112. https://doi.org/10.3390/f9030112
Park JH, Lee DK, Gan J, Park C, Kim S, Sung S, Jung TY, Hong SC. Effects of Climate Change and Ozone Concentration on the Net Primary Productivity of Forests in South Korea. Forests. 2018; 9(3):112. https://doi.org/10.3390/f9030112
Chicago/Turabian StylePark, Jin Han, Dong Kun Lee, Jianbang Gan, Chan Park, Songyi Kim, Sunyong Sung, Tae Yong Jung, and Sung Chul Hong. 2018. "Effects of Climate Change and Ozone Concentration on the Net Primary Productivity of Forests in South Korea" Forests 9, no. 3: 112. https://doi.org/10.3390/f9030112
APA StylePark, J. H., Lee, D. K., Gan, J., Park, C., Kim, S., Sung, S., Jung, T. Y., & Hong, S. C. (2018). Effects of Climate Change and Ozone Concentration on the Net Primary Productivity of Forests in South Korea. Forests, 9(3), 112. https://doi.org/10.3390/f9030112