1. Introduction
Surface mining for coal and other resources is a major driver of land-use change around the world. In general, surface mining involves clearing existing landcover (forests, grasslands, etc.), removing overburden (layers of rock that lay over the target resource), extracting the target resource, replacing the overburden (often called spoil), and reclaiming the site to a designated post-mining land use. Reclamation represents a critical phase of this process—good reclamation can set a highly disturbed site on a trajectory toward near-native conditions, while poor reclamation can lock a site into an ecologically devastated state over long time periods. An especially important aspect of reclamation is soil selection. In many cases, native topsoil is not available for use during reclamation, and crushed overburden may be used as a substitute. When this is the case, the type of spoil selected may influence the long-term ecological development of the site, for better or for worse.
Mine spoils can exhibit differing suitability for restoration for a number of reasons, but especially due to the physical or chemical characteristics of soils derived from them. In a study on reclamation of coal mine waste in New Zealand, physical properties of spoil such as particle size and moisture holding capacity influenced reclamation success [
1]. In Mediterranean Spain, where moisture is often limited, spoil heaps can be poor candidates for naturally colonizing vegetation, especially if they are morphologically homogenous, lacking favorable microhabitats [
2]. Similarly, in Hambach, Germany, spoil placement approaches influenced species richness of ground beetle communities over time, with structurally diverse spoils associated with higher beetle richness [
3]. In Lusatia, Germany, pyrite-rich spoils formed acid-forming soils, which were associated with unique successional vegetative communities [
4]. In Alberta, Canada, reclamation of oil sand pits with different soil substitutes and subsequent fertilizer applications led to different developmental trajectories, with some treatment combinations reaching conditions similar to natural forests more quickly than others (e.g., 15 years vs. 20 years after reclamation) [
5]. Thus, effective surface mine reclamation is often tied to understanding of the suitability of local spoils for restoration goals.
Surface coal mining has impacted a large land area in the Appalachian region, and the type of reclamation performed on these mines does much to determine how they develop ecologically over time [
6,
7]. Early surface mining operations in Appalachia were not carefully regulated, and specific reclamation approaches or outcomes were not mandated. These early sites, while frequently capable of returning to a near-native forest over time, were often dangerous, with unstable soils prone to landslides. To address these issues, the Surface Mine Control and Reclamation Act (SMCRA) of 1977 was passed, establishing more intentional regulation of surface mine reclamation outcomes [
6]. Because one of the major concerns SMCRA sought to address was soil instability, regulators and industry professionals began to heavily compact mine soils and seed reclaimed sites with highly competitive plant species to reduce risk of erosion and instability [
6].
Over time, it became apparent that these reclamation practices rendered reclaimed sites unsuitable for native tree growth and succession to native forests. An interdisciplinary team of researchers, regulators, industry professionals, and others (the Appalachian Regional Reforestation Initiative—ARRI) was formed to address these concerns and develop recommendations to improve the success of reforestation efforts on reclaimed surface mines [
8]. This team developed the Forestry Reclamation Approach (FRA)—a series of recommendations demonstrated to improve forest restoration success: (1) select a favorable rooting medium, (2) minimize compaction, (3) minimize vegetative competition, (4) plant both early- and late-succession tree species, and (5) use proper planting techniques [
8].
The first recommendation, dealing with spoil selection, is especially important, because different spoil types can place sites on different soil development trajectories. SMCRA permits the use of a “soil substitute” if native soils are too shallow or slopes are too steep to allow for retention of native soils prior to mining—a common occurrence in Appalachia. However, this soil substitute was traditionally just mine-run spoil—a mix of the various overburden types disturbed during the mining process. A number of recent studies have concluded that brown sandstone is a more favorable soil substitute for tree growth than gray sandstone or mixed spoils, primarily due to soil chemical characteristics, making a strong argument for retention of this material during mining for placement on the surface during reclamation [
9,
10,
11]. The current study was initiated in 2007 to investigate the influence of spoil type (brown sandstone, gray sandstone, mixed spoils, and shale) on soil development and tree growth over time. Data from the first two years after plot construction supported brown sandstone as the most favorable spoil type for tree growth, with gray sandstone and mixed spoils being unfavorable [
12]. This paper reports on the 10-year results from this experiment.
2. Materials and Methods
This study was conducted on test plots constructed in February 2007 at the Bent Mountain surface mine in Pike County, KY. Plots (0.2 ha) were constructed in three replicates of four spoil types: brown sandstone (Brown), gray sandstone (Gray), mixed spoils (Mixed), and shale (Shale), for a total of 12 plots. Plots were constructed using the low-compaction technique known as “strike-off”—spoil piles were end-dumped in closely-abutted piles approximately 2.5 m deep, and then leveled slightly with one pass of a D-9 bulldozer. Plots were planted with a mix of the following native trees (1200 seedlings/ha): American chestnut (
Castanea dentata (
Marshall) Borkh.), American sycamore (
Platanus occidentalis L.), black locust (
Robinia pseudoacacia L.), chestnut oak (
Quercus montana Willd.), dogwood (
Cornus florida L.), northern red oak (
Quercus rubra L.), redbud (
Cercis canadensis L.), sugar maple (
Acer saccharum Marshall), white ash (
Fraxinus americana L.), and white oak (
Quercus alba L.). Species were selected based on their presence in pre-mining forests in the region, as well as their tendency to perform well in surface mine reclamation plantings. Plots were not fertilized or seeded with additional species. Soil and tree data were collected for the first two years after planting and reported in Miller et al. [
12].
In 2008, soils were sampled and analyzed as described in Miller et al. [
12]. Briefly, two sets of four random samples were collected at depths of 0 to 10 cm (to represent the surface) and 40 to 50 cm (to represent properties at depth) and combined into two separate composite samples per depth per plot. Soil samples were collected as part of the present study in summer 2017. Samples were collected in two depth increments (0–10 cm and 10–50 cm). Five subsamples were collected in each plot and composited in the field, for a total of one composite sample per depth per plot. Soils were analyzed for pH, P, K, Ca, Mg, Zn, total C and N, soluble salts, cation exchange capacity (CEC), base saturation, and texture. Soil pH was measured in a 1:1 soil:water paste, and soluble salts (soil electrical conductivity) was measured in a 1:3 soil:water solution with a conductivity bridge [
13]. Concentrations of P, K, Ca, Mg, and Zn were measured by Mehlich III extraction and analysis by ICP-MS (Inductively coupled plasma mass spectrometry) [
13]. Total C and N were quantified using a CHN (Carbon/Hydrogen/Nitrogen) Analyzer (LECO Corporation, St. Joseph, MI, USA) [
14]. Particle size distribution was evaluated by the micropipette method [
15]. Cation exchange capacity and base saturation were assessed using the ammonium acetate method at pH 3 [
13].
To better assess site differences not reflected by soil texture and chemistry, soil surface temperature was logged for 19 days using HOBO® temperature probes (Onset® Computer Corporation, Bourne, MA, USA) installed on one plot per treatment. Due to logger malfunctions, no data were collected for Brown, and only one logger per treatment collected usable data for the other spoil types. In addition, canopy cover was estimated using a method adapted from Barton and Karathanasis [
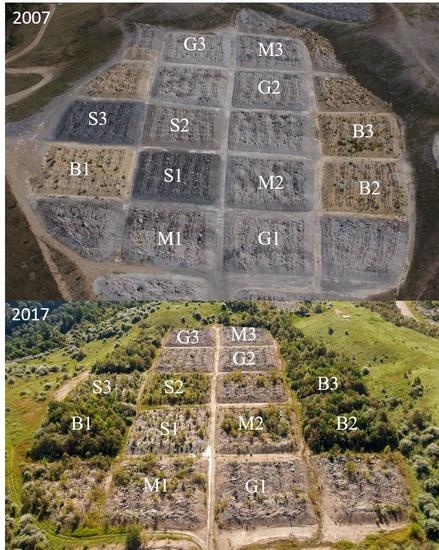
16]. Briefly, in August 2018, a 1.4-million-pixel aerial photo was captured using the standard 12-megapixel high-resolution digital camera mounted on a Phantom 4 drone (DJI, Shenzhen, China). The image was opened in Adobe
® Photoshop
® Creative Cloud 2018. Using the “crop” tool, the image was reduced in size to show an individual plot. On some plots, the “image rotation” tool was used to square the plot to allow for more precise cropping. Next, pixels were classified as “canopy” or “not canopy” based on color. An individual tree was selected using the “magic wand” tool, with tolerance level set to a low value (between 5 and 15) to minimize the over-selection of similar colors (if tolerance level was high, this function may select both grass and tree because both are green). Once pixels in an individual tree were selected, the “similar” tool was used to identify objects with the same color. The resulting selected area was visually assessed to verify that it was representative of tree foliage only, and the area was filled with a “foreground” color (i.e., green) by selecting the “fill” option. To account for additional trees with different shades of foliage, this step was repeated as needed. Similarly, bare soil or herbaceous vegetation could be identified and filled to a background color (i.e., white) (
Figure 1). Once the forest canopy was delineated accurately, the “histogram” function was used to quantify the pixels classified as forest canopy by selecting the foreground cover with the “magic wand” tool and using the “similar” function. The number of pixels delineated as forest canopy divided by the total number of pixels in the image was considered % canopy cover [
16].
Trees were measured in three 10 m × 10 m subplots per plot. Subplots were positioned so as not to overlap one another or be adjacent to one another or be adjacent to the edge. Height was measured for all planted species in each subplot. Tree data were collected from 31 May to 6 June (2017).
Soils data were analyzed by analysis of variance (ANOVA) using the general linear models procedure (PROC GLM, SAS 9.4, SAS Institute, Inc., Cary, NC, USA), with depth and spoil type and their interaction as the modeled effects. Because depth and the interactions were not significant for any measured parameter (p > 0.05), soils data are presented by spoil type only. Tree height data were also analyzed by ANOVA using the GLM procedure to assess differences in overall tree height across spoil type and differences in height by species within each spoil type. Mean height data were calculated for each species within each subplot, and plot means were calculated from subplot means. Plot means served as the experimental unit for ANOVA. Canopy cover was also analyzed by ANOVA, using PROC GLM (SAS 9.4), with estimated percent canopy cover for each plot considered the experimental unit. Significant ANOVA tests were followed up with pairwise comparisons using a Tukey’s test, given by the LSMEANS/pdiff function (SAS 9.4).
3. Results
Even 10 years after plot construction, spoil type significantly influenced soil chemical and physical characteristics. While pH was slightly acidic in Brown and Shale, soils from Gray and Mixed were slightly alkaline (
Table 1). In addition, P was higher in Brown and Shale than Gray and Mixed, which is consistent with observed differences in pH. Elevated Ca in Gray and Mixed relative to Brown and Shale may be related to weathering status. When compared to data from 2008, it was clear that fine-textured soil particles accumulated more rapidly in shale than in the other spoil types, with Brown representing the lowest percentage silt and clay and the highest percentage sand (
Figure 2).
Differences in tree growth across spoil types varied significantly. Tree height was greatest on Brown, followed by Shale, Mixed, and Gray (
Figure 3,
Table 2).
When individual species performance was evaluated just within Brown, American sycamore exhibited the greatest height growth (nearly 700 cm average), with black locust, chestnut oak, red oak, and white oak each averaging >500 cm (
Figure 4).
Canopy cover differed significantly across spoil types, following the same general trend as tree height—highest in Brown, followed by Shale, Mixed, and Gray (
Figure 1 and
Figure 5).
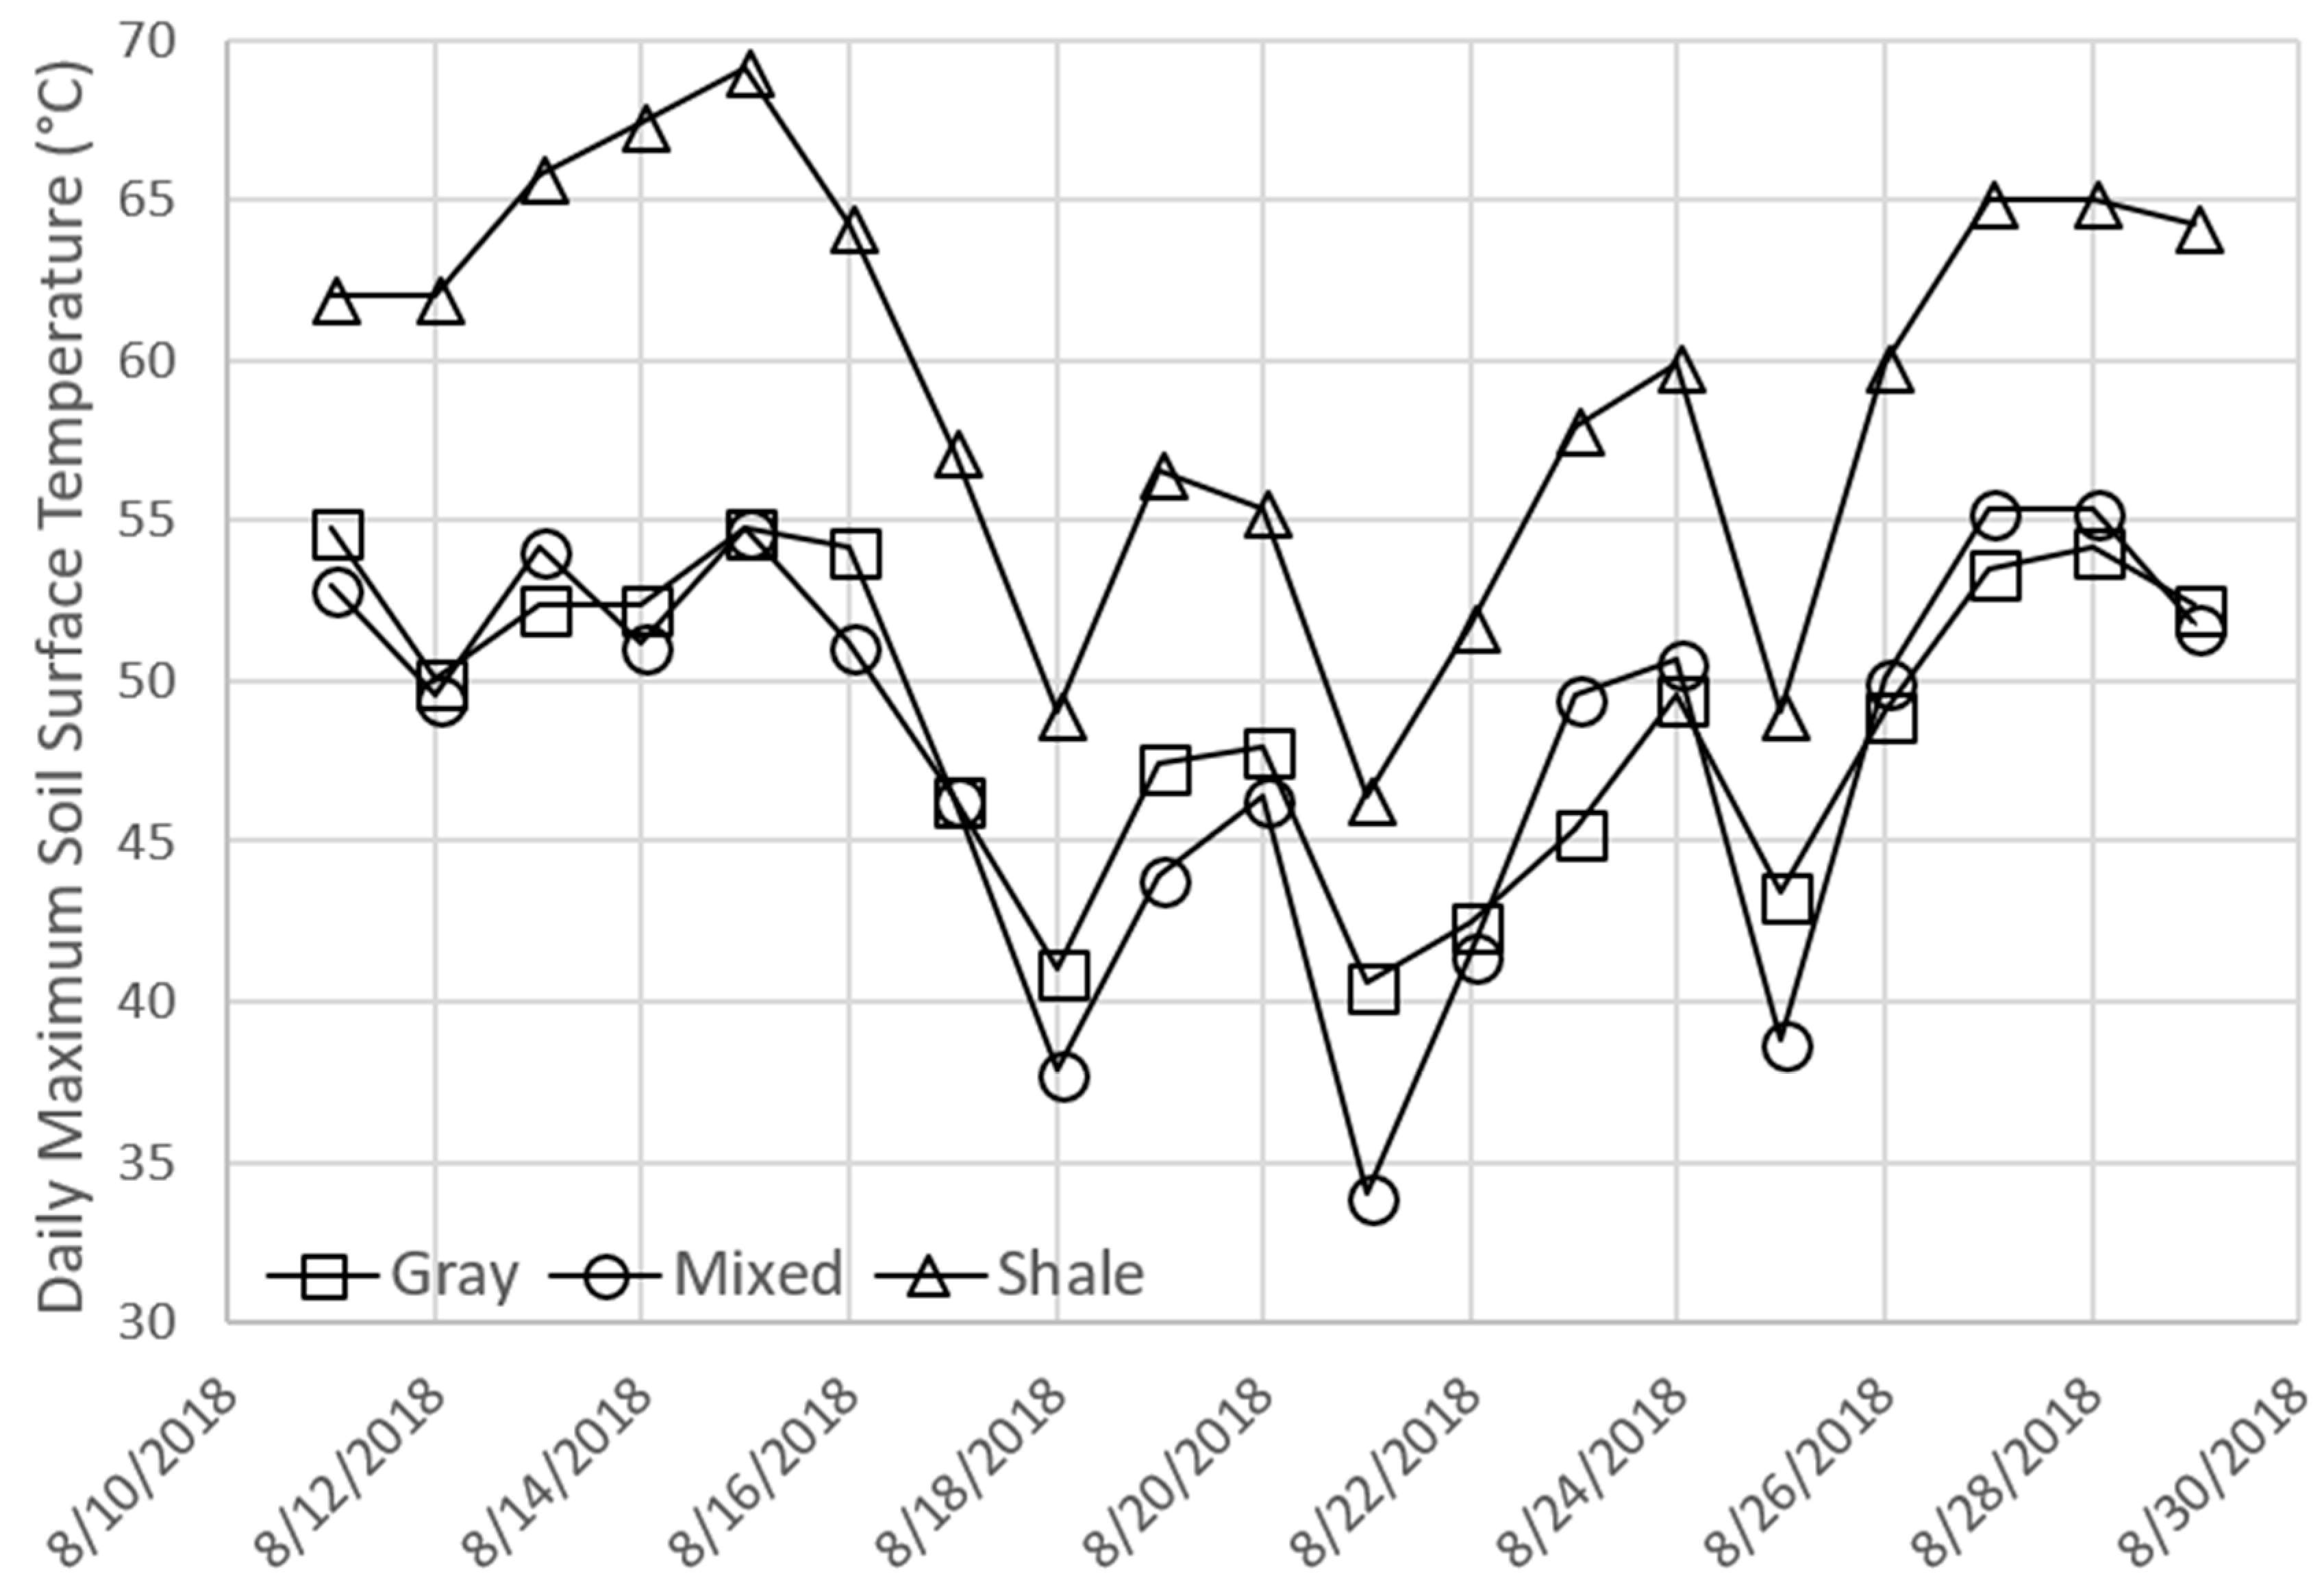
Finally, soil surface temperature for the period of record varied across spoils (
Figure 6), with daily maximum temperatures, on average, about 10 °C higher in Shale (59.4 °C) than in Mixed (48.2 °C) or Gray (49.0 °C). After field sampling, accuracy of loggers was validated by incubating them together for 24 hours in a refrigerator at 3 °C, followed by 24 hours in an oven at 50 °C. Data recorded by the loggers during this validation period were highly consistent (
R2 = 0.9999), confirming that observed temperature differences among spoils were not due to logger malfunction.
4. Discussion
Brown sandstone exhibited the best tree growth in this study, consistent with the literature thus far on the influence of spoil type on reforestation outcomes for Appalachian surface mines [
10,
11]. With an overall average tree height of about 5 m, average tree height on Brown was over twice as high as Shale, nearly four times higher than Mixed, and over five times higher than Gray. Five species (American sycamore, black locust, chestnut oak, red oak, and white oak) had average heights greater than 5 m on Brown, consistent with the literature documenting some of these species as competitive candidates for reforestation on similar sites [
10,
11,
17,
18]. Canopy cover follows trends similar to tree growth, with highest values in Brown and lowest in Gray. These results are consistent with cover (canopy plus understory) results reported by Sena et al. [
10]—highest in Brown (99%), but low in Mixed (20%) and Gray (10%).
Also consistent with the literature, the soil factors most likely related to these dramatic differences in growth were associated with soil chemistry, especially pH [
10]. Native Appalachian soils are acidic—a recent study in Robinson Forest (the University of Kentucky research forest, in nearby Breathitt and Perry Counties) reported soil pH ranging from 3.8 to 4.3 [
19]. In this study, while soils in Brown (<5) and Shale (<6) were acidic, Gray (>8) and Mixed (>7.5) were slightly alkaline. In other studies that evaluated soil development from similar spoils, gray sandstone-derived spoils (and gray-heavy mixed spoils) tend to have unfavorably high pH, and can inhibit growth of native trees [
10,
11]. pH is an important controller of soil chemistry, including solubility of phosphorus and certain metals, particularly those that serve as plant micronutrients. In this study, total P was higher in Shale and Brown, with available P likely much higher due to lower pH.
In this study, Shale, a sedimentary rock with finer particle sizes, demonstrated more active physical weathering than the other spoil types, accumulating higher percentages of silt and clay during the ten years after placement—these results represent a continuation of the patterns observed by Miller et al. [
12]. This weathering most likely led to the highest clay content (16%) of the spoil types, as well as the highest CEC (6.35 cmol kg
−1). In turn, the shale-derived soils can hold more carbon (2.06%) than any other spoil type and possibly more water than Mixed. Conversely, Brown exhibited the least ongoing weathering among the spoils, with lowest the percentage of fines and the highest percentage of sand. In addition, base saturation was lowest on Brown (84.6%), suggesting that Brown was already weathered sufficiently so that the release of exchangeable bases was balanced with the cation exchange capacity. In contrast, base oversaturation in Gray (340%) and Mixed (230%) suggests that ongoing weathering in these spoils continues to release more exchangeable bases than can be retained by the soil’s exchange sites. Elevated Ca in Gray and Mixed, relative to Brown and Shale, is related to weathering of calcium-rich carbonate minerals, such as calcite, which are abundant in these spoils [
20], and is consistent with observed weathering patterns. This finding supports generally held observations that brown sandstone is more well-weathered than material buried deeper in the geologic profile (gray sandstone, shales). Gray also had higher clay content than Brown (7.89% vs. 5.37%), but a similar CEC, which may also be related to the weathering of the materials.
While dramatic differences in tree growth and cover between Brown and Gray or Mixed are likely related to soil chemistry (especially pH), pH alone does not explain differences in tree growth and canopy cover between Brown and Shale. Anecdotal observations that surface soil on Shale was warmer than the other spoil types, likely due to its dark color, encouraged us to examine soil surface temperature for 19 days in August 2018. Data from Gray, Mixed, and Shale (no data were recoverable from Brown, due to logger damage) confirmed our observations that soil surface temperature was higher on Shale. Although these data were unreplicated (and merit further study), they suggest that high soil temperatures in Shale (through direct heat stress and/or reduced moisture availability) could have arrested natural colonization of wind- and animal-dispersed seed that has been observed at other locations with favorable soil chemistry [
10]. Additionally, we observed that understory plant recruitment on Shale appeared to be restricted to the shaded area under trees, suggesting that continued tree growth (and subsequent shade production) will ameliorate soil temperature conditions over time.
5. Conclusions
This study supports the use of brown sandstone as a soil substitute in the reclamation of Appalachian surface coal mines. Tree growth on brown sandstone is dramatically higher than on gray sandstone, shale, or mixed spoils, likely due to favorable soil chemistry on Brown. In contrast, while soil chemistry appears favorable on Shale, higher soil temperatures are likely responsible for reduced tree growth and groundcover. Additional surveys over the next several years will clarify to what extent tree growth (and associated shade) will ameliorate unfavorable soil temperature conditions over time.
Surface mining and subsequent reclamation is a global issue. While the current study, and other studies involved with aspects of the FRA, was conducted in Appalachia, USA, the underlying principles of the FRA are globally transferable. Currently, the FRA is being tested for implementation in Chile and Australia [
21], and could easily be tested in Europe and Asia. Further work is necessary in these and other regions of the world to continue to improve reclamation techniques for successful restoration of healthy ecosystems.


