Article

Assessing the Trade-Offs of SPOT7 Imagery for Monitoring Natural Forest Canopy Intactness

1
School of Life Sciences, University of KwaZulu-Natal, Private Bag X54001, Durban 4000, South Africa
2
School of Agricultural, Earth and Environmental Sciences, University of KwaZulu-Natal, Private Bag X01, Pietermaritzburg 3209, South Africa
*
Author to whom correspondence should be addressed.
Forests 2018, 9(12), 781; https://doi.org/10.3390/f9120781
Submission received: 30 October 2018 / Revised: 5 December 2018 / Accepted: 7 December 2018 / Published: 18 December 2018
(This article belongs to the Special Issue Mapping Forest Health Using Moderate Resolution Satellites)

Abstract

:
Natural and human-induced disturbances influence the biodiversity and functionality of forest ecosystems. Regular, repeated assessments of canopy intactness are essential to map site-specific forest disturbance and recovery patterns, an essential requirement for forest monitoring and management. However, accessibility to images required for this practice, uncertainty around the levels of accuracy achieved with images of different resolution, and the affordability of the practice challenges its application in many developing regions. This study aimed to compare the accuracy of forest gap detection (in subtropical forests) achieved with lower-resolution (SPOT7 5 m) and higher-resolution (SPOT7 1.5 m) pan-sharpened imagery. Additionally, the Normalised Difference Vegetation Index (NDVI) and Synthetic Aperture Radar (SAR) were compared in terms of their ability to increase the accuracy of this detection when used in conjunction with both high and low resolution imagery. Results indicate that the SPOT7 1.5 m imagery produced an overall accuracy of 77.78% and a ϰ coefficient of 0.66 compared with the 69.44% accuracy and the 0.59 ϰ coefficient achieved with the SPOT7 5 m imagery. Computing image texture analysis within the Random Forest classifier (RF) framework increased classification accuracies to 75.00% for the SPOT 5 m and 86.11% for the SPOT7 1.5 m imagery, validating the usefulness of texture analysis. Variable importance was used to identify wavebands and texture-derived variables that were the most effective in discriminating canopy gaps from intact canopy. In this regard, near infrared, NDVI, SAR, contrast, mean, entropy and second moment were the most important. Collectively the results indicate that the approach adopted in this study, i.e., the use of SPOT7 1.5 m imagery in conjunction with image texture analysis and variable importance, can be used to accurately discriminate between canopy gaps and intact canopy, making it a cost-effective spatial approach for monitoring and managing natural forests.

1. Introduction

Indigenous forests are recognised as important biodiversity and ecosystem hubs but are under increased pressure, namely from climate change and anthropogenic impacts. This has led to a significant decline in forest cover in recent years [1,2,3]. Canopy intactness, defined here as complete canopy cover, plays a crucial role in promoting plant species richness and diversity in indigenous forest systems [4]. Breaks in the canopy created by natural and anthropogenic disturbances creates opportunities for colonisation by both indigenous and invasive alien plant species [5]. Disturbance is, therefore, considered a definitive element affecting the shape, structural and spatial patterns of forests, necessitating the inclusion of spatial assessments of its effects on canopy intactness and regeneration patterns within indigenous forest monitoring and management programs [6].
During a disturbance, a forest canopy can be interrupted forming an opening or what is commonly referred to as a “gap” [7]. Disturbance events are the main determinants of gap size and structure. These disturbance events also affect the overall forest system, i.e., increased light penetration, changes in soil nutrient availability, increased evapotranspiration from underlying vegetation on the forest floor, exposure of the seed bank to excessive levels of light and higher temperatures and increased opportunities for alien plant invasions [1,8]. These abiotic and biotic changes to the status quo induced by gap formation will ultimately determine the future plant species composition within the gap and eventual recovery patterns of the canopy within it [9,10].
Gap characteristics such as size, shape, age and neighbouring canopy height have been shown to be useful parameters to measure given that they directly affect species recruitment and establishment [11]. Gap dynamics, including data on advanced regeneration and seedling recruitment, are fundamental to the community structure of forests and play a central role in species abundance and turnover in tropical/sub-tropical forests, such as the Northern Coastal Forests of KwaZulu-Natal (KZN) (in South Africa) [12,13,14,15].
Forest-canopy gaps also promote changes within the surrounding intact canopy area resulting in changes in microclimates and allowing higher levels of wind to reach the forest understory [15]. These impacts coupled with the unevenness of the canopy due to gap formation can result in increased mortality of trees surrounding gaps [15]. Changes in canopy cover over time have been used to determine site-specific histories of forest disturbances and degradation [16]. Furthermore, the spatial patterning of canopy gaps may indicate the vulnerability of neighbouring forest patches to further disturbance effects and to predict future loss of forest integrity and/or cover [6].
In order to gain a thorough understanding of forest’s gap dynamics, extensive analysis of its spatial and temporal characteristics is required [16,17]. Time-series based assessment of tree cover is regularly used to map and quantify disturbance levels for long-term forest monitoring programs [18] but in many developing parts of the world gap studies are often based on ground surveys that are limited in temporal and spatial extent [10,19]. Furthermore, comparative studies on the accuracy achieved with different resolutions of multispectral imagery for assessing forest gap size, frequency and distribution, particularly in tropical and subtropical regions, are limited [10]. This lack of knowledge is attributed to limited time and resource constraints associated with field studies [16,17]. Field studies are also inadequate for large areas of land and areas with inaccessible terrain which is common in natural systems [20]. One possible solution is to use remotely sensed spatial technologies to survey larger areas relatively quicker, more frequently and more accurately than manual field-based methods.
In this regard, the past and present canopy intactness of forests in Slovenia were assessed using aerial imagery for 1986 to 2006 and 1998 to 2009, respectively [21]. Results suggested that small scale disturbances were a major driving force of forest dynamics attributed to the high occurrence of small gaps. More recently, Hobi et al. [18] also analysed gap size frequency distribution in Ukrainian forest using high-resolution WorldView-2 satellite images (0.5 m to 1.84 m), showing that the forest was comprised mainly of smaller as opposed to larger gaps due to small scale disturbance patterns experienced. These disturbances were mainly attributed to the death of single and smaller groups of trees. The study concluded that remote-sensing technologies can be successfully used to characterize both large and small-scale disturbance regimes, and the gap dynamics of forest systems.
However, comparative studies such as Malahlela et al. [22] who assessed the suitability of 8-band WorldView-2 imagery (2 m) versus conventional 4-band imagery in delineating canopy gaps in the Dukuduku Forest of KZN (South Africa) have suggested that the accuracy achieved with these spatial technologies depends on the types of images and wavebands used. For example, Malahlela et al.’s [22] analyses yielded an overall accuracy of 86.90% and 74.64% for WorldView-2, 8-band and 4-band imagery, respectively, suggesting that high-resolution data can improve the delineation of forest canopy gaps. In a subsequent study, Malahlela et al. [20] mapped the occurrence of the invasive species Chromolaena odorata (L.) R.M.King and H.Rob. in canopy gaps in the Dukuduku Forest with WorldView-2 imagery (2 m) using an integrated remote sensed modelling approach. As alluded to earlier, canopy gaps are often rapidly revegetated by grasses and shrubs that may include invasive alien species potentially reducing the accuracy of using multispectral imagery to discriminate between intact canopy and canopy gaps. Malahlela et al. [20] showed that canopy gaps containing C. odorata could be mapped with 87% accuracy, indicating the robustness of the model used. This study provided a basis for mapping forest patches vulnerable to invasions, suggesting yet another benefit of using such an approach to forest management and conservation planning. Asner et al. [10] assessed canopy gap size frequency distributions in Peruvian forests using airborne Light Detection and Ranging (LiDAR) technology. This approach allowed the authors to assess a wide range of topographic conditions and areas that are inaccessible by foot. Results indicated a high degree of similarity in gap size frequency distributions across forests, suggesting that forests in this region share similar structural responses to canopy disturbance.
The literature reviewed above suggests that easily accessible, multispectral datasets, such as those provided by Earth Observation (EO) satellites, can provide a high-quality, time efficient and cost beneficial alternative for identifying and mapping forest canopy gaps. Despite its present under-usage in research, the temporal resolution provided by EO satellites, allows for accurate detection of canopy gaps on a pixel level while maintaining high levels of pixel detail [22,23]. The objectives of the present study were to (1) assess the suitability of SPOT7 imagery to delineate between canopy gaps and intact canopy in sub-tropical forests; (2) evaluate and compare the accuracy levels achieved with SPOT7 5 m versus 1.5 m resolution imagery in conjunction with the Normalised Difference Vegetation Index (NDVI) and Synthetic Aperture Radar (SAR), and to determine the significance of individual wavebands based on variable importance that are the most reliable in classifying intact canopy versus canopy gaps. This study was conducted on three patches of sub-tropical Northern Coastal Forest, a vegetation type that is susceptible to disturbance induced changes in plant species composition in KZN [24].

2. Materials and Methods

2.1. Study Area

Three patches of Northern Coastal Forest [25], all along the KZN Coastal Belt, were selected for investigation following initial site visits which confirmed the presence of gaps. The KZN Coastal Belt is comprised of highly dissected undulating coastal plains that were historically covered with sub-tropical coastal forest [26]. Currently, this region has been heavily transformed and comprised of a mosaic of sugarcane and timber plantations, urban areas, secondary Aristida junciformis Trin. and Rupr. grasslands, thicket, coastal thornveld and patches of coastal forest [26]. The three forests chosen for investigation were Hawaan Forest situated in Umhlanga, uMdloti Forest situated in uMdloti and the uMdoni Forest situated in uMdoni, and these differ in terms of environmental and site characteristics (Table 1; Figure 1).

2.2. Field Data Collection

At each forest, 12 gaps defined as an opening in the canopy due to complete or partial loss of a tree/s extending to the forest undergrowth [13] of varying size classes were first identified by walking random parallel transects within the physiognomically mature part of each forest. After initial screening of the study sites, the minimum accepted gap size was set at 8 m2, to minimise the chances of a gap being confused with the natural variability in tree canopy. These transects were at least 50 m from the edge of the forest and always >30 m apart. All study sites were surveyed during summer (November–December 2016). The boundary of each gap, as well as the centre point of each gap was recorded using a Global Positioning System (GPS) with sub-meter accuracy. In addition, an equal number of field samples representing intact forest (n = 36) were demarcated using a GPS with each sample corresponding in size to each gap sample. Each gap boundary and subsequent intact forest canopy sample was then used to extract information from the various image datasets to create training and test datasets. Figure 2 illustrates field photographs and corresponding satellite image of representative gaps within each forest.
Gaps were categorised into different size classes based on area (Figure 3). Gaps with an area of less than 25 m2 were considered small gaps (n = 13). Gaps with an area between 25–45 m2 were considered medium sized gaps (n = 13) and gaps with an area greater than 45 m2 were classified as large gaps (n = 10). Following Runkle [27], the area (A) of an individual gap was calculated as A = πLW/4, where L = gap length (longest distance between two edges of a gap) and W = gap width (longest distance perpendicular to length).

2.3. Image Acquisition and Pre-Processing

Multispectral SPOT7 5 m resolution imagery (dated 2016) were acquired from the South African National Space Agency (SANSA) and projected using the Universal Transverse Mercator (36S) and WGS84 datum. SPOT7 has four spectral wavebands ranging from 0.455–0.890 µm. The sensor has a daily revisit cycle and an imaging swath width of 60 km at nadir. The images were atmospherically corrected and geo-rectified using 36 ground control points and pan-sharpened to 1.5 m resolution imagery by the vendor. The Normalized Difference Vegetation Index (NDVI) was then computed from the 5 m and 1.5 m SPOT7 images given its usefulness in measuring vegetation health, mapping forest types and monitoring studies, and its application in forest type mapping and monitoring studies [28,29]. Furthermore, as NDVI accounts for vegetation on a pixel by pixel basis, as opposed to wavelengths accounted for by the red and near infrared bands present in multispectral imagery, previous studies have determined that NDVI is a suitable predictor of vegetation greenness and canopy structure in forest systems [30,31,32,33]. Therefore, it was added to this study as it could improve the accuracy of discriminating between intact canopy (high NDVI) and forest gaps (low NDVI). The Synthetic Aperture Radar (SAR) actively transmits pulses of electromagnetic energy and receives the responses as backscatter [34]. It is characterised by its long wavelengths that can penetrate through cloud cover, top layers of vegetation and are insensitive to daylight, which allows observations to continue throughout day/night and through varying weather conditions [34,35]. This makes it particularly advantageous for imaging forests in coastal regions as the complex geomorphology and land cover of coastal regions can be difficult to capture accurately [36]. SAR was therefore used in conjunction with NDVI and the SPOT7 5 m and 1.5 m imagery to determine its usefulness in discriminating between canopy gaps and intact canopy.

2.4. Statistical Analyses

2.4.1. Random Forest Classification (RF)

The Random Forest classifier (RF) approach was used in this study. It is a highly accurate classification technique that uses predictions derived from an ensemble of classification and regression trees (CART) to yield accurate classification results [37]. Random Forest grows multiple regression trees by repeatedly taking a different bootstrap sample of the training dataset [33,34]. A final prediction is generated based on the average outputs of all trees [29,38]. During the bootstrapping process, approximately 30% of the samples are excluded (referred to as out-of-bag (OOB) samples). Out-of-Bag samples are used to determine the OOB error, often referred to as predictive accuracy, as well as for variable importance which is used to generate the final prediction [28,32,34,35].
Random Forest uses ntree and mtry parameters. Ntree refers to the number of decision trees that must be generated to grow the “forest” and mtry refers to the number of randomly selected variables that must be tested to determine the best split at each node when developing the trees [29,37]. Ntree and mtry are both user-defined variables which allows for high variance and low bias [37]. The final prediction is an average of all individual tree outputs [38]. The default parameter values for ntree and mtry consistently produce accurate results [28,34,35]. In this study, RF was used due to its robustness, accuracy and its ability to correctly select wavebands as it does not overfit the data [28,32,34,35]. Random Forest has also been proven to successfully handle data with high dimensionality and multicollinearity, without overfitting the data [36,37]. Random Forest was implemented using the “randomForest” package in R [39] to compare accuracy predictions between SPOT7 5 m versus 1.5 m resolution imagery.

2.4.2. Accuracy Assessment

This study utilised a confusion error matrix to evaluate the performance of SPOT7 imagery at 5 m and 1.5 m resolutions. The confusion matrix was calculated by dividing the total dataset (n = 72) into training data (70%; n = 50) and test data (30%; n = 22) using a repeated holdout sample with 100 repetitions thereby accounting for the variation in classification accuracy due to differing compositions between the datasets. Accuracies for intact canopy samples and canopy gap samples were compared by examining the user’s and producer’s accuracies. Producer’s accuracy was calculated by dividing the number of correctly classified samples by the size of the training samples (expressed by the column total in the confusion matrix). User’s accuracy was calculated by dividing the number of correctly classified samples by the total number of samples that were classified (expressed by the row total in the confusion matrix). Kappa analysis [KHAT (ϰ) statistic] was also calculated to determine the significant difference between error matrices. Perfect agreement is assumed when the KHAT value is equal to 1 [40].

2.4.3. Variable Importance

It is crucial to understand the interaction of variables that contribute to the classification accuracy of the projection, referred to as variable importance (VI). Variable importance is assessed by OOB data that are verified by running the assessment repeatedly using selected variables [37]. Pre-selecting wavebands based on variable importance helps determine the significance of individual wavebands in the classification model [41]. Variable importance was estimated using mean decrease in accuracy (MDA), i.e., the difference in the increase in classification error when OOB data for selected variables are permuted while all other variables remain unchanged compared with the OOB error from the original, complete data set [32,33,42].

3. Results

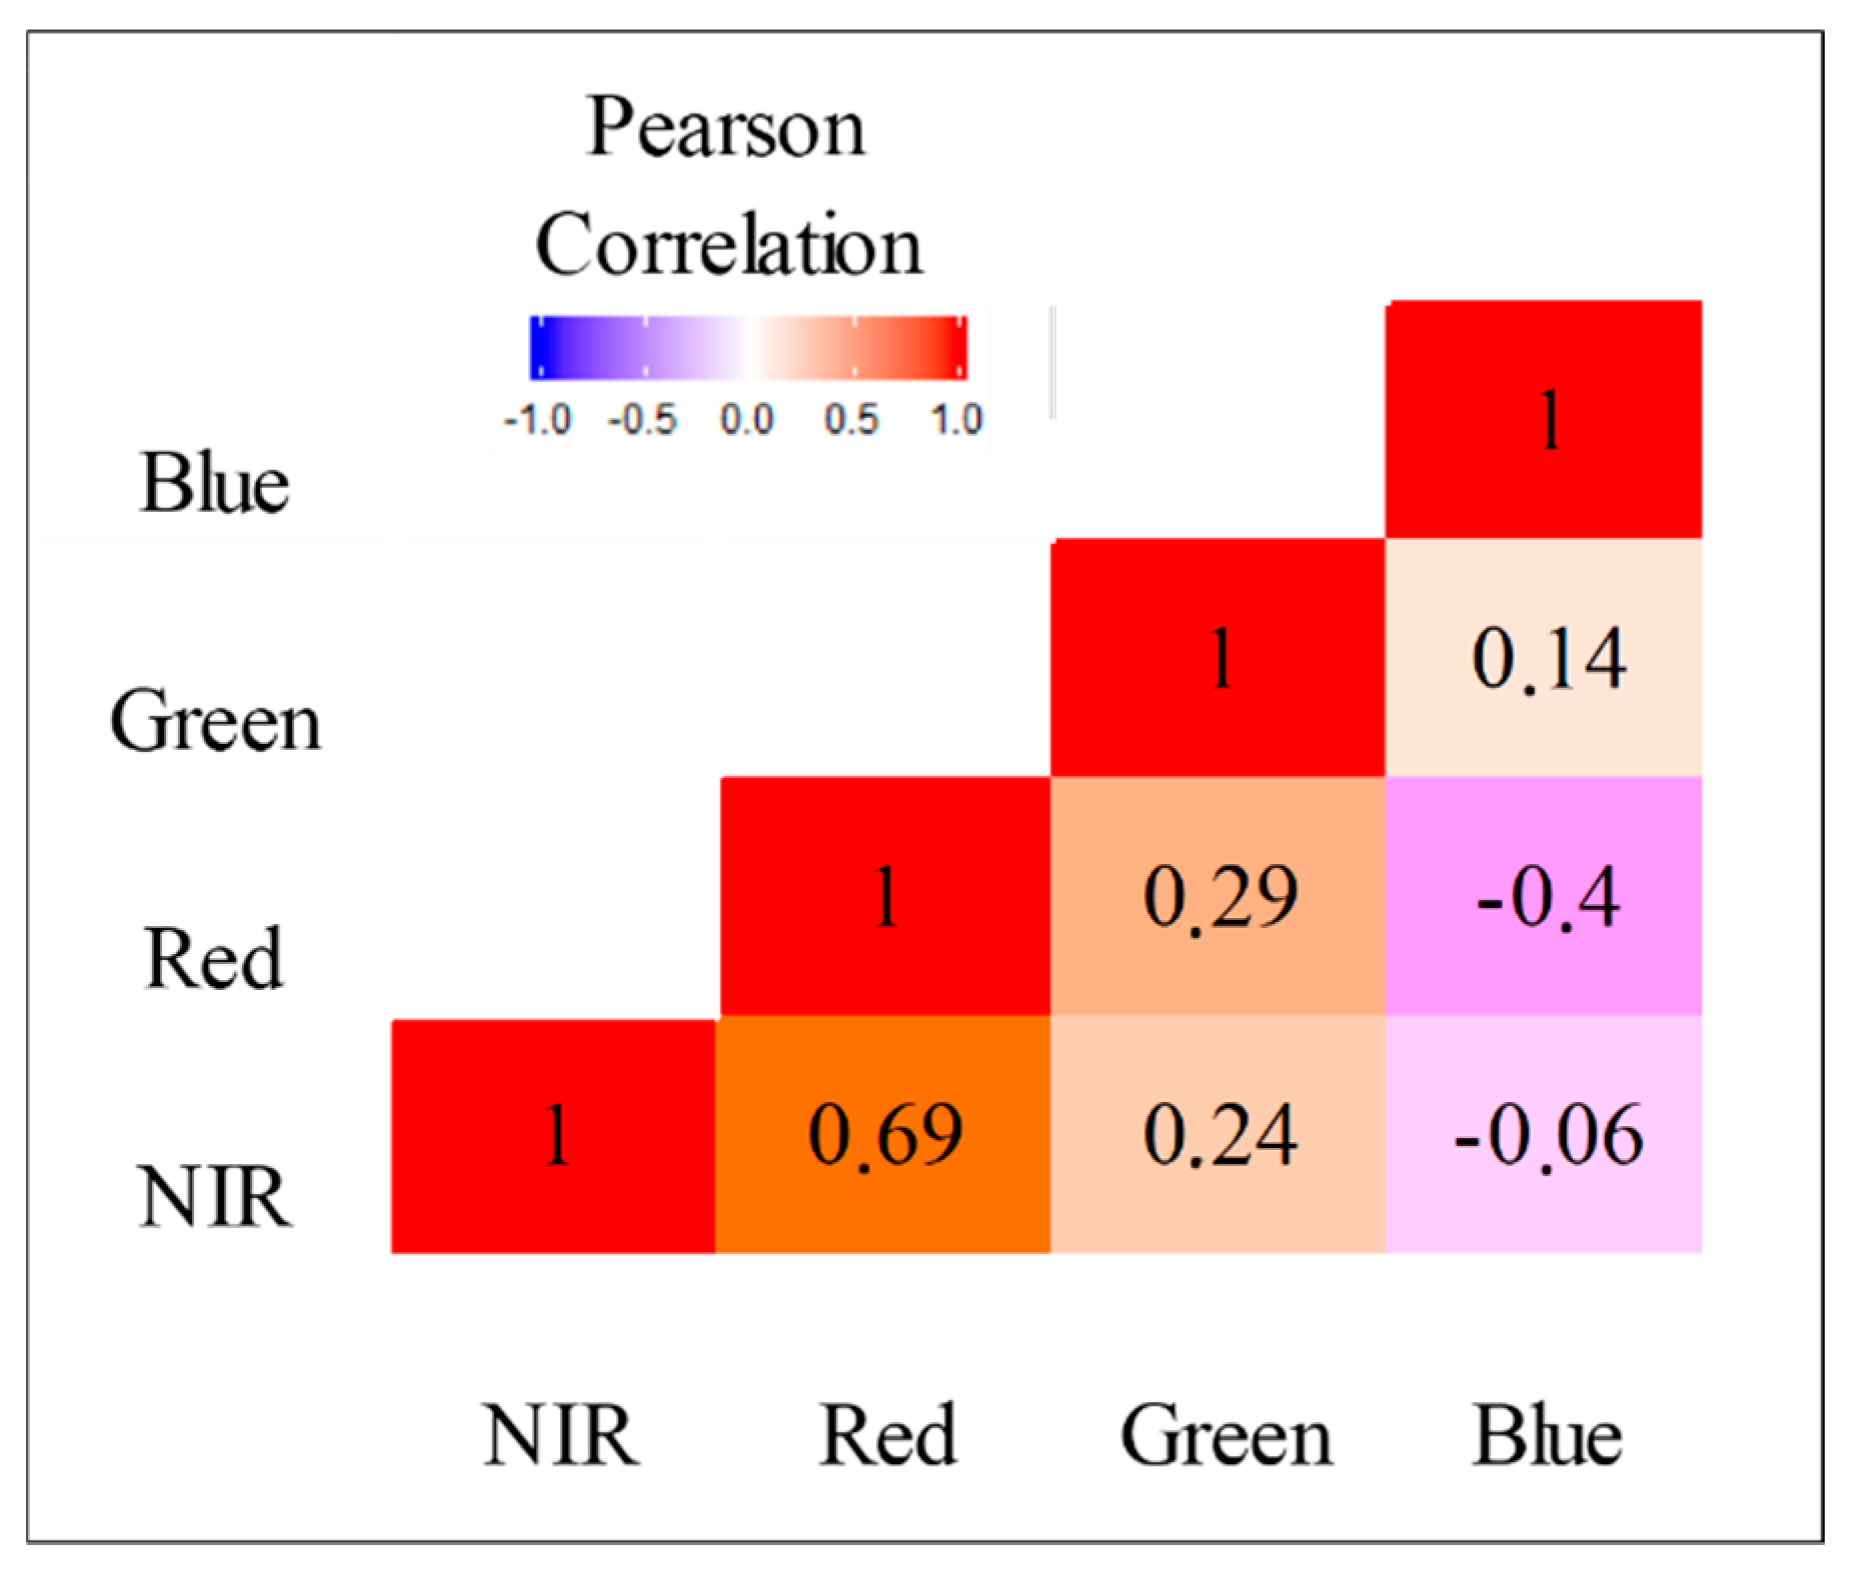
3.1. Correlation of Spectral Bands

When inter-band correlations were calculated (Figure 4), the strongest correlation existed between near infrared (NIR) and the red band (r = 0.69) followed by the red and green (r = 0.29) and finally, between NIR and green (r = 0.24). Negative correlations were observed between NIR and the blue band (r = −0.06) and between the red and blue band (r = −0.40). A weak correlation also existed between the green and blue band (r = 0.14).

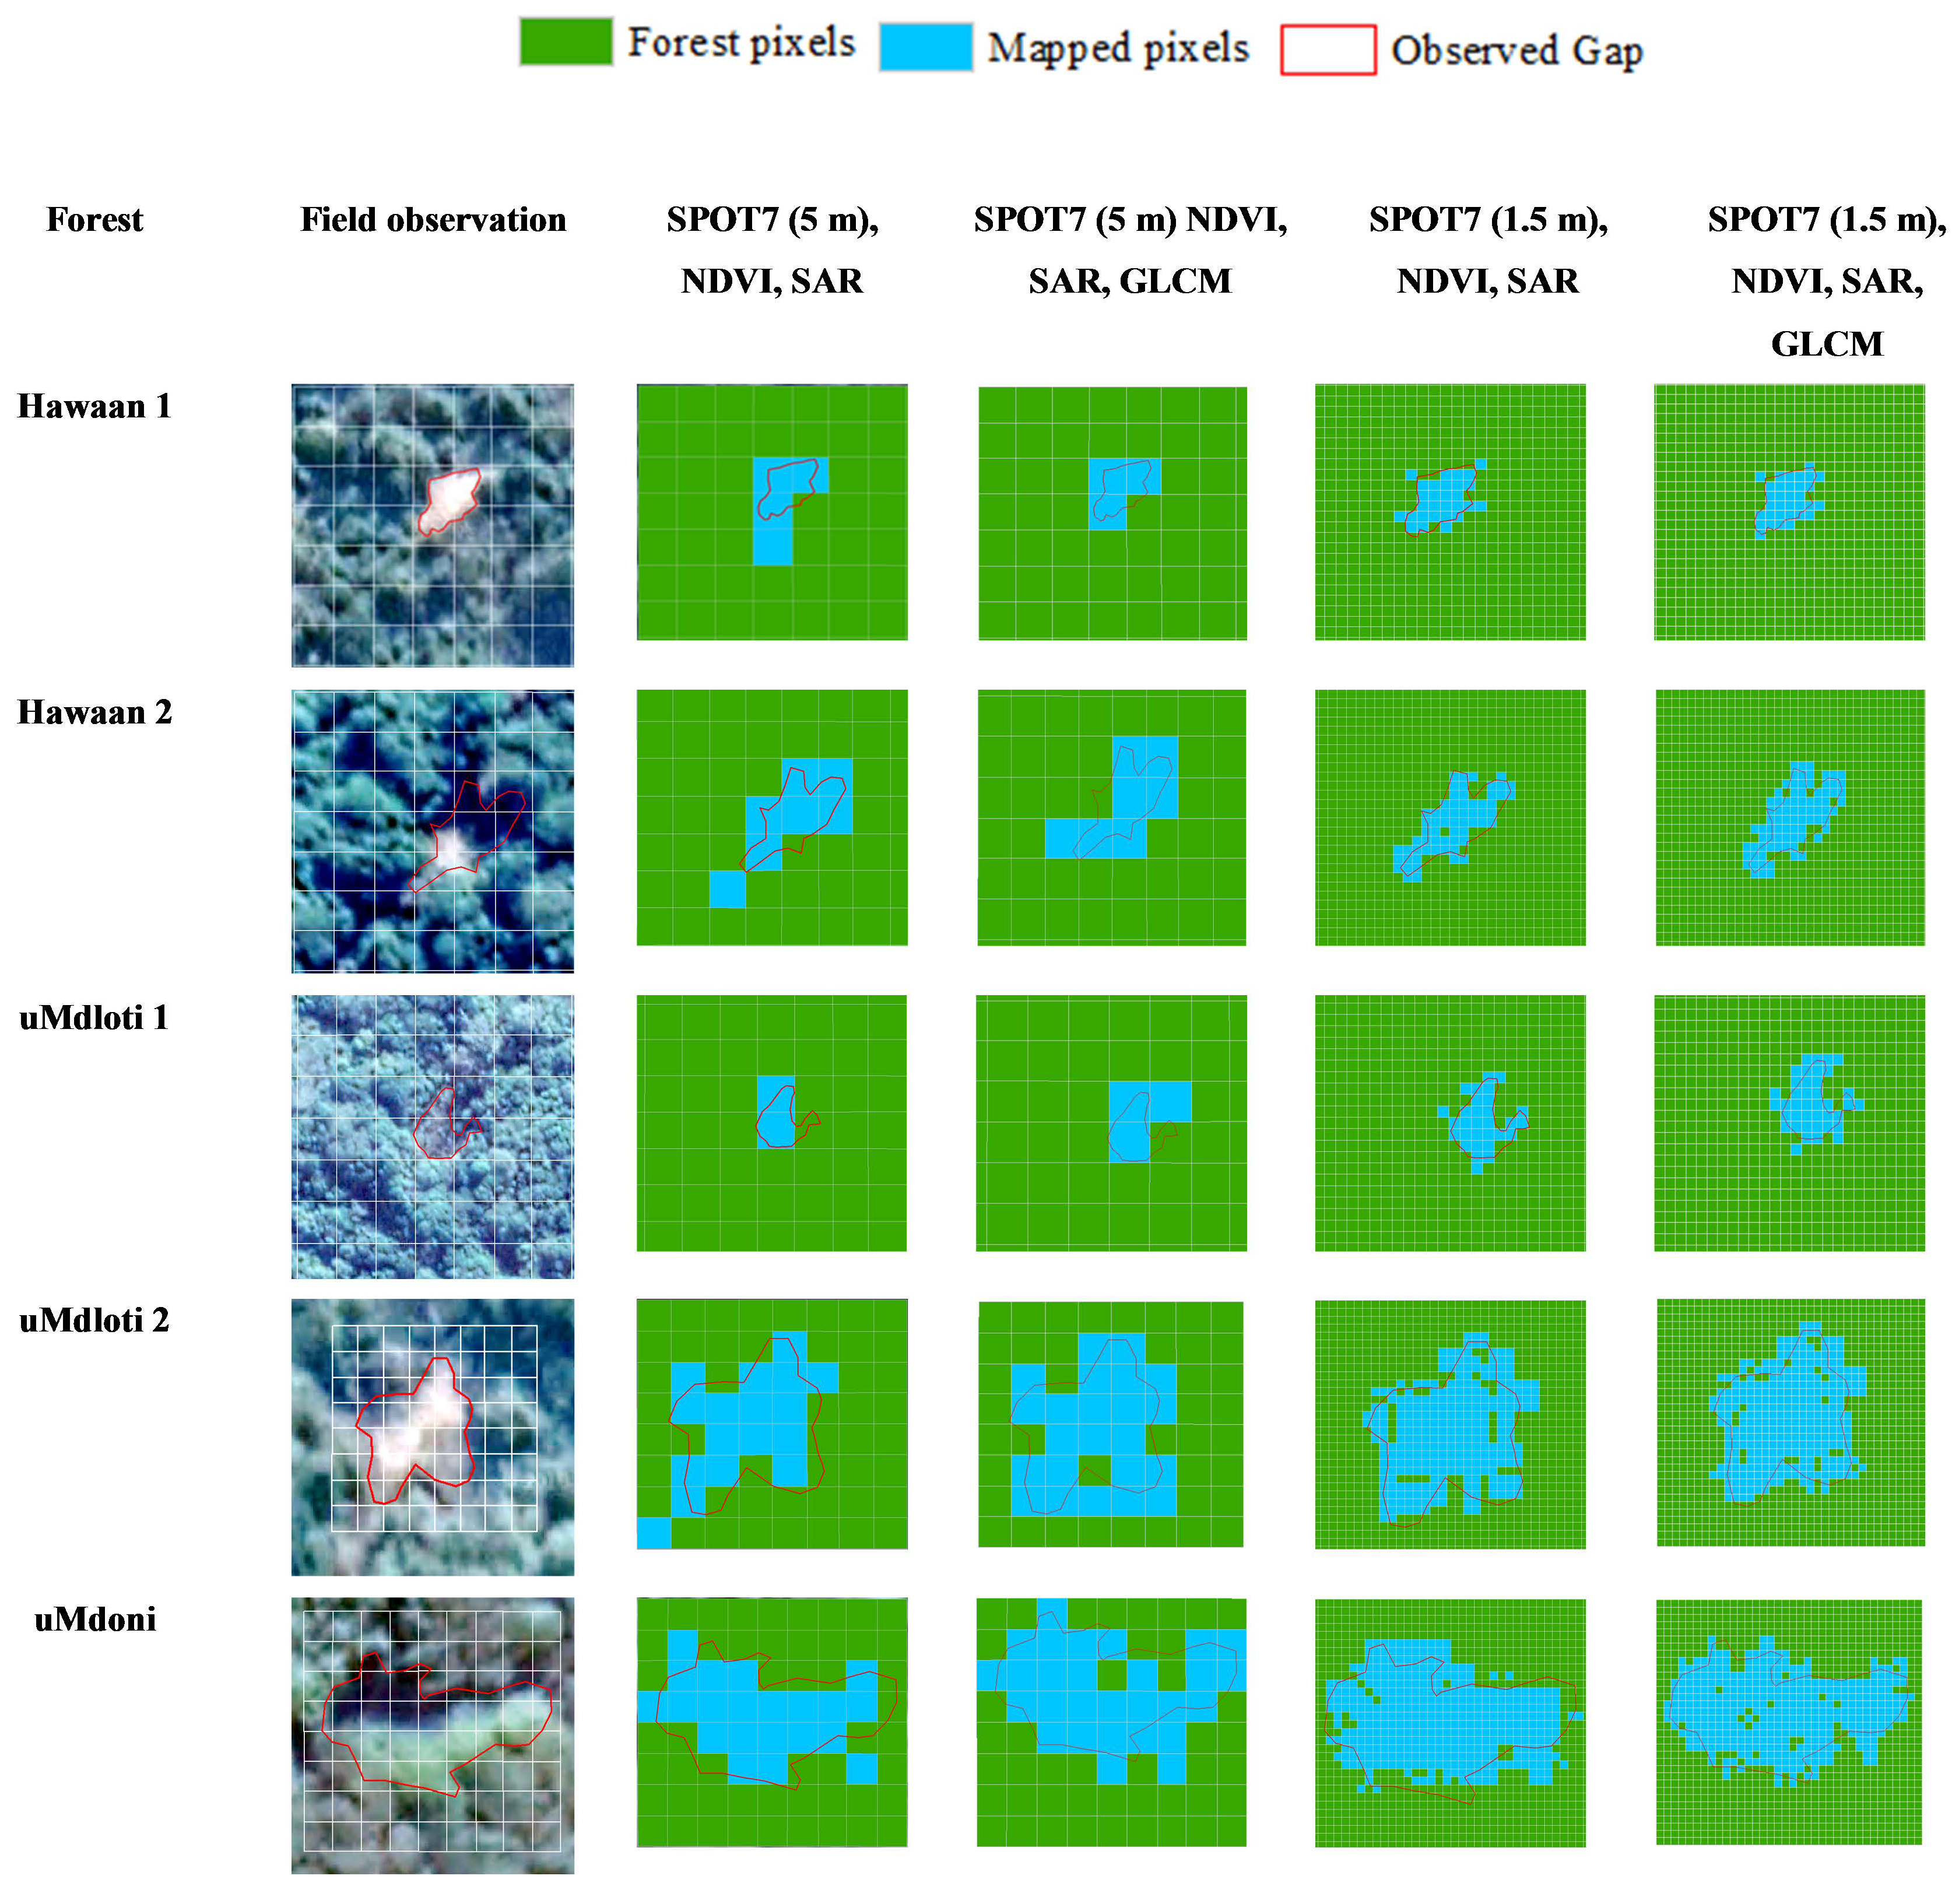
3.2. Classification of Canopy Gaps Versus Intact Canopy Using Spot7 (5 m) Bands and Synthetic Aperture Radar (SAR)

The RF classifier (ntree = 500, mtry = 3) yielded an overall classification accuracy of 69.44% with a ϰ value of 0.59. The highest confusion was canopy gaps classified as intact canopy forest (60/190 cases). The lowest confusion was intact canopy classified as canopy gaps (50/170 cases) (Table 2). Producer’s accuracy was higher for gaps than intact canopy (72.22% versus 66.67%) while intact canopy had a higher user’s accuracy compared to the gaps (70.59% versus 68.42%). For comparison purposes, a support vector machine (SVM) [43,44] classifier (regularized parameter C = 100) was used to classify the SPOT 7 dataset. The results revealed an overall classification accuracy of 67.84% with a ϰ value of 0.57 and user’s and producer’s accuracies ranging from 64.20% to 70%.

3.3. Classification of Canopy Gaps versus Intact Canopy Using Spot7 (1.5 m) Pan-Sharpened Imagery and SAR

The 1.5 m resolution imagery (RF ntree = 500, mtry = 2) yielded an overall classification accuracy of 77.78% with a ϰ value of 0.66. The highest confusion was canopy gaps classified as intact forest canopy (50/200 cases) and the lowest confusion was intact canopy classified as gaps (30/160 cases) (Table 3). Gaps also had a higher producer’s accuracy than intact canopy (83.33% versus 72.22%) and intact canopy had a higher user’s accuracy than the canopy gaps (81.25% versus 75.00%). For comparison purposes, a SVM analysis was also used to classify the Spot 1.5 m dataset. The SVM results (regularized parameter C = 100) revealed an overall accuracy of 75.35% and a kappa value of 0.64 with user’s and producer’s accuracies ranging from 70% to 83%.
When evaluating the results of SPOT 7 and SAR datasets, the RF framework provided successful results for detecting canopy gaps from intact forest canopies. Image texture was incorporated within the RF framework [45] to assess the effectiveness of textural information in the context of this study. Following [46,47], grey level co-occurrence (GLCM) texture measures comprising contrast, correlation, dissimilarity, entropy, homogeneity, mean, second moment and variance (Supplementary Materials) were computed and included within the RF framework in conjunction with SPOT 7 spectral features, NDVI and SAR. Using the RF classifier, results revealed improved overall classification accuracies as well as better kappa, user’s and producer’s accuracies when compared to excluding textural variables (Table 4; Figure 5). The GLCM textural measure was computed using a specified angle (45°) with window sizes for each band calculated [47,48] using the minimum variance approach [42,43]. A 5 × 5 window was used for the SPOT 5 m dataset, where as a window size of 3 × 3 was used for the 1.5 m dataset.

3.4. Variable Importance

The importance of each variable was compared in terms of the mean decrease in accuracy. In addition to the spectral bands assessed in the SPOT7 imagery, blue (0.455–0.525 µm) green (0.530–0.590 µm), red (0.625–0.695 µm), near infrared (NIR) (0.760–0.890 µm), NDVI, SAR and texture-derived variable importance were also assessed (Figure 6). In this regard, for both the 5 m and 1.5 m resolution imagery the NIR, NDVI, SAR, contrast, mean, entropy and second moment were most important in terms of improving model accuracy. The remaining variables had a slightly lower influence on model accuracy. The blue, green and red wavebands individually had negligible importance on the mean decrease in accuracy with the blue waveband having the lowest influence.

4. Discussion

This study has demonstrated the potential for using high-resolution multispectral SPOT7 imagery in conjunction with a RF approach to accurately detect forest canopy gaps in three subtropical coastal forests in South Africa. Suitability comparisons between SPOT7 5 m and SPOT7 pan-sharpened 1.5 m imagery with SAR and texture analysis to detect gaps revealed the latter resolution to be more accurate for this purpose. This study was also the first to use optimised SPOT7 imagery in conjunction with SAR, NDVI and texture analysis for detecting and mapping forest gaps. Furthermore, the present study focused on forests with varying levels of disturbance and conservation measures, indicating the versatility of SPOT7 imagery in discerning intact canopy and canopy gaps within numerous sub-tropical forest types.

4.1. Mapping Forest Canopy Gaps Using High-Resolution Multispectral Imagery

The RF classifier showed that the SPOT7 1.5 m imagery was able to accurately detect canopy gaps and intact canopy with greater accuracy than the 5 m resolution imagery. The higher ϰ value and lower error rate for the 1.5 m imagery also indicates that there is greater agreement between the classification results and ground truth values, thereby indicating greater reliability of the classification method [44]. The higher number of pixels that were mapped in the 1.5 m resolution imagery versus the 5 m resolution imagery directly contributes to the improved classification accuracies of the higher-resolution imagery. Improved classification accuracies can be attributed to variations in reflectance and light absorption influenced by shadows and underlying material such as soil and rock [49]. Higher confusion rates between gaps and intact canopy may also be attributed to the spectral signatures of smaller canopy gaps being similar to those of intact canopy Additionally, NDVI is known to saturate in high-density vegetation (in the red edge) particularly in tropical forest gaps [22]. This can be overcome by increasing the resolution of the images used. As such, higher accuracies were achieved with NDVI for the pan-sharpened imagery [22].
The accuracies produced by the SPOT7 5 m (69.44%) and 1.5 m imagery (77.78%) in conjunction with NDVI and SAR are comparable to accuracy levels achieved in similar studies. For example, Malahlela et al. [22] mapped gaps in forest canopy in northern KwaZulu-Natal (SA) and achieved an overall accuracy of 86.90% for WorldView-2 eight band imagery while a 74.64% overall accuracy was achieved using a resampled four band image, similar to the imagery used in this study. Similarly, high accuracies (77% to 88%) were achieved by Gaulton and Malthus [50] when mapping canopy gaps using LiDAR. In contrast, Chan et al. [51] achieved an average accuracy of 55% when mapping heathland vegetation, which is structurally and compositionally very different to forest, using CHRIS and PROBA hyperspectral imagery.
The 5.66% and 8.33% improvement in classification accuracy achieved when texture variables were included with the SPOT7 5 m and SPOT7 1.5 m imagery respectively, can be attributed to the variations in canopy cover [47,48]. Since canopy structure contributes to variations in grey tone levels, coarse variations could be attributed to intact canopy whereas finer variations are due to canopy gaps [48,52]. This can also be attributed to combining texture analysis with spectral analysis, making grey levels more discernible in the imagery [48,53]. The use of texture variables also improved overall accuracy when discriminating between forest gaps and intact canopy possibly due to the minimisation of topographic and illumination errors common with band imagery [54]. These results are comparable to those obtained by Zhao et al. [54] who achieved an accuracy of 78.42% when estimating above-ground biomass of the subtropical region of Zhejiang province, China, using a GLCM matrix. Similarly, Dube and Mutanga [55], Feng et al. [56] and Hlatshwayo et al. [48] also found that the inclusion of texture variables increased the accuracy assessments when used in conjunction with spectral variables while maintaining a positive relationship between image resolution and image texture.
The results from this study suggest that a lower resolution multispectral imagery in conjunction with SAR, vegetation indices and GLCM can be used to identify, characterise and represent canopy gaps in dynamic subtropical forests with acceptable levels of accuracy. More specifically, the results suggest that the methodological approach can be used to establish the frequency of gaps across a range of size classes. Therefore, it can be used to provide valuable information on changes in forest canopy cover and canopy regeneration patterns within gaps, which can be useful for monitoring and conservation purposes. Further studies are needed to investigate the effect that underlying features such as grass cover and rocky terrain in canopy gaps have on the accuracy levels achieved when detecting gap cover. Further studies should also focus on time taken for gaps to “close”, i.e., time-series analysis can be undertaken over a series of years to determine average canopy gap closing times and/or whether gaps are in fact closing.

4.2. Variables of Importance

Analyses involving both 5 m and 1.5 m imagery indicated that the SAR, NIR and NDVI variables as well as the contrast, mean, entropy and second moment filters were capable of detecting canopy gaps across all three forests. The identification of optimal predictor variables in this study suggests that if multispectral images are to be used for gap detection, then these variables should be prioritised during the method optimisation process. Likewise, Karlson et al. [23] also identified greenness indices, such as NDVI, as important bands in their study which utilised a RF classifier in conjunction with multispectral Landsat 8 imagery to map tree canopy cover and above-ground biomass in the Sudano-Sahelian woodlands. The blue, green and red bands and NIR bands, had low rankings in terms of variable importance. However, this vegetation type has varying levels of canopy cover and does not include “open gaps” i.e., the use of bands in discrimination between gaps and closed canopy cover cannot be overstated. In contrast, a study looking at gap patterns in a European beech forest (Ukraine) using multispectral WorldView-2 imagery [18] showed yellow and red bands to be most useful in separating gaps from intact canopy. This is expected given the difference in structure and composition of these two vegetation types.
Additionally, in contrast with the results obtained here, NDVI yielded the lowest producer’s and user’s accuracies in a study that used high-resolution multispectral imagery to detect sub-tropical forest gaps in coastal KZN [22]. However, only one forest (Dukuduku Forest) was investigated by Malahlela et al. [22] which is threatened by severe invasive alien plant infestations and is surrounded by sugarcane plantations, which may have altered the reflectance patterns of the gaps. NDVI was also deemed to be less suitable in comparison with other bands in other studies due to overlapping spectral properties between gaps and non-gaps [18], suggesting that the canopy gaps in this study were better defined compared to others. The discrepancy in variable importance between the present study and others may also be attributed to the structural and compositional characteristics of temperate open woodland [23] and beech forests [18] compared with the sub-tropical forests investigated here. When assessing the importance of image texture variables in this study, Lottering and Mutanga [47] also identified second moment and contrast as important texture variables in estimating the road edge effect on Eucalyptus grandis forests in KwaZulu-Natal, South Africa. Second moment, contrast, mean and entropy were similarly identified as important when mapping above-ground biomass in a forest in KwaZulu-Natal, South Africa [48].
The case-specific utility of different spectral bands and indices may also be attributed to differences in satellite imagery used, necessitating further testing. Nevertheless, all the studies quoted above validated the use of high-resolution satellite imagery for characterising forest disturbance regimes and long-term forest gap dynamics.

5. Concluding Remarks and Recommendations

The major findings of the study are as follows:
  • The SPOT7 1.5 m pan-sharpened imagery is more accurate for delineating between intact canopy versus canopy gaps in sub-tropical forests. This is attributed to the greater classification imagery compared to SPOT7 5 m imagery.
  • NIR, NDVI, SAR, contrast, mean, entropy and second moment were the most important variables in the 5 m and 1.5 m resolution imagery while blue, green and red wavebands had minor impacts on the mean decrease in accuracy.
This was the first study to use optimised SPOT7 imagery (5 m and 1.5 m) in conjunction with SAR, NDVI and texture analysis for detecting and mapping canopy gaps.
Improper management of canopy gaps and mitigation/avoidance of disturbances can lead to poor canopy regrowth within gaps and ultimately compromise forest health. Monitoring of canopy gaps is, therefore, an important aspect of forest management [10]. Ongoing monitoring of dynamic systems, such as forests can, however, be challenging. For example, mapping of canopy gaps on a regular basis, for example annually, is recommended as spectral signatures of gaps change as the gap regrows (closes), making it difficult to delineate from closed forest [57,58]. Although several studies have focused on higher resolution imagery such as WorldView-2 and Sentinel-2, this study has shown that data generated from freely available multispectral images of relatively lower resolution can provide a reliable alternative for mapping and monitoring continuous areas of land as opposed to methods requiring high data acquisitions costs and high data dimensionality [23]. The approach used here could prove particularly valuable for decision-making around indigenous forest management in developing countries such as South Africa whose natural systems are increasingly under pressure from rising population and urbanisation [58].

Supplementary Materials

The following are available at https://www.mdpi.com/1999-4907/9/12/781/s1.

Author Contributions

A.B., S., K.P. and S.R. conceived the idea. A.B. and K.P. conducted formal analyses. A.B., K.P. and S. led the writing, with contributions from S.R.

Funding

The authors would like to thank the National Research Foundation of South Africa (Grant number 114898) for supporting this research.

Acknowledgments

The authors would like to thank the South African National Space Agency (SANSA) for providing satellite imagery, the University of KwaZulu-Natal for providing research support, and the managers of Hawaan Forest Nature Reserve, uMdoni Park Golf Club and the uMdloti Improvement Project (UIP) for allowing us access to the study sites; all of which allowed for the successful completion of this research.

Conflicts of Interest

The authors declare no conflict of interest.

References

  1. McCarthy, J. Erratum: Gap dynamics of forest trees: A review with particular attention to boreal forests. Environ. Rev. 2001, 9, 1–59. [Google Scholar] [CrossRef]
  2. Wyman, M.S.; Stein, T.V. Modeling social and land-use/land-cover change data to assess drivers of smallholder deforestation in Belize. Appl. Geogr. 2010, 30, 329–342. [Google Scholar] [CrossRef]
  3. Mangwale, K.; Shackleton, C.M.; Sigwela, A. Changes in forest cover and carbon stocks of the coastal scarp forests of the Wild Coast, South Africa. South. For. 2017, 79, 305–315. [Google Scholar] [CrossRef]
  4. Murphy, H.T.; Westcott, D.A.; Metcalfe, D.J. Functional Diversity of Native and Invasive Plant Species in Tropical Rainforests. In Proceedings of the 15th Australian Weeds Conference, Papers and Proceedings, Adelaide, Australia, 24–28 September 2006; pp. 199–202. [Google Scholar]
  5. Horvitz, C.C.; Pascarella, J.B.; Mcmann, S.; Freedman, A.; Hofstetter, R.H.; Hofstetter, R.H. Functional roles of invasive non-indigenous plants in hurricane-affected subtropical hardwood forests. Ecol. Appl. 1998, 8, 947–974. [Google Scholar] [CrossRef]
  6. Andrew, M.E.; Ruthrof, K.X.; Matusick, G.; Hardy, G.E.S.J. Spatial configuration of drought disturbance and forest gap creation across environmental gradients. PLoS ONE 2016, 11, 1–18. [Google Scholar] [CrossRef] [PubMed]
  7. Runkle, J.R. Gap Regeneration in Some Old-growth Forests of the Eastern United States. Ecology 1981, 62, 1041–1051. [Google Scholar] [CrossRef]
  8. Yamamoto, S.I. Forest gap dynamics and tree regeneration. For. Res. 2000, 5, 223–229. [Google Scholar] [CrossRef]
  9. Coates, K.D. Conifer seedling response to northern temperate forest gaps. For. Ecol. Manag. 2000, 127, 249–269. [Google Scholar] [CrossRef]
  10. Asner, G.P.; Kellner, J.R.; Kennedy-Bowdoin, T.; Knapp, D.E.; Anderson, C.; Martin, R.E. Forest Canopy Gap Distributions in the Southern Peruvian Amazon. PLoS ONE 2013, 8. [Google Scholar] [CrossRef] [PubMed]
  11. Blackburn, G.A.; Abd Latif, Z.; Boyd, D. Forest disturbance and regeneration: A mosaic of discrete gap dynamics and open matrix regimes? J. Veg. Sci. 2014, 25, 1341–1354. [Google Scholar] [CrossRef]
  12. Young, T.P.; Hubbell, S.P. Crown Asymmetry, Treefalls, and Repeat Disturbance of Broad-Leaved Forest Gaps. Ecol. Soc. Am. 2016, 72, 1464–1471. [Google Scholar] [CrossRef]
  13. Obiri, J.A.F.; Lawes, M.J.; John, A.F. Chance versus Determinism in Canopy Gap Regeneration in Coastal Scarp Forest in South Africa. J. Veg. Sci. 2004, 15, 539–547. [Google Scholar] [CrossRef]
  14. Muscolo, A.; Bagnato, S.; Sidari, M.; Mercurio, R. A review of the roles of forest canopy gaps. J. For. Res. 2014, 25, 725–736. [Google Scholar] [CrossRef]
  15. Hunter, M.O.; Keller, M.; Morton, D.; Cook, B.; Lefsky, M.; Ducey, M.; Saleska, S.; De Oliveira, R.C.; Schietti, J. Structural dynamics of tropical moist forest gaps. PLoS ONE 2015, 10, 1–20. [Google Scholar] [CrossRef] [PubMed]
  16. Sexton, J.O.; Song, X.P.; Feng, M.; Noojipady, P.; Anand, A.; Huang, C.; Kim, D.H.; Collins, K.M.; Channan, S.; DiMiceli, C.; et al. Global, 30-m resolution continuous fields of tree cover: Landsat-based rescaling of MODIS vegetation continuous fields with lidar-based estimates of error. Int. J. Digit. Earth 2013, 6, 427–448. [Google Scholar] [CrossRef] [Green Version]
  17. Vepakomma, U.; St-Onge, B.; Kneeshaw, D. Spatially explicit characterization of boreal forest gap dynamics using multi-temporal lidar data. Remote Sens. Environ. 2008, 112, 2326–2340. [Google Scholar] [CrossRef]
  18. Hobi, M.L.; Ginzler, C.; Commarmot, B.; Bugmann, H. Gap pattern of the largest primeval beech forest of Europe revealed by remote sensing. Ecosphere 2015, 6, 1–15. [Google Scholar] [CrossRef]
  19. Lobo, E.; Dalling, J.W. Spatial scale and sampling resolution affect measures of gap disturbance in a lowland tropical forest: Implications for understanding forest regeneration and carbon storage. Proc. R. Soc. B Biol. Sci. 2014, 281. [Google Scholar] [CrossRef] [PubMed]
  20. Malahlela, O.E.; Cho, M.A.; Mutanga, O. Mapping the occurrence of Chromolaena odorata (L.) in subtropical forest gaps using environmental and remote sensing data. Biol. Invasions 2015, 17, 2027–2042. [Google Scholar] [CrossRef]
  21. Rugani, T.; Diaci, J.; Hladnik, D. Gap Dynamics and Structure of Two Old-Growth Beech Forest Remnants in Slovenia. PLoS ONE 2013, 8. [Google Scholar] [CrossRef] [PubMed]
  22. Malahlela, O.; Cho, M.A.; Mutanga, O. Mapping canopy gaps in an indigenous subtropical coastal forest using high-resolution WorldView-2 data. Int. J. Remote Sens. 2014, 35, 6397–6417. [Google Scholar] [CrossRef]
  23. Karlson, M.; Ostwald, M.; Reese, H.; Sanou, J.; Tankoano, B.; Mattsson, E. Mapping tree canopy cover and aboveground biomass in Sudano-Sahelian woodlands using Landsat 8 and random forest. Remote Sens. 2015, 7, 10017–10041. [Google Scholar] [CrossRef]
  24. Kambaj, O.K.; Sershen; Govender, Y.; Ramdhani, S. A floristic comparison of three Northern Coastal Forests differing in disturbance history. Bothalia 2018, 48, a2262. [Google Scholar] [CrossRef]
  25. Mucina, L.; Scott-Shaw, C.R.; Rutherford, M.C.; Camp, K.G.T.; Matthews, W.S.; Powrie, L.W.; Hoare, D.B. Indian Ocean Coastal Belt. In The Vegetation of South Africa, Lesotho and Swaziland; Mucina, L., Rutherford, M.C., Eds.; Strelitzia 19: Pretoria, South Africa, 2006; pp. 568–583. [Google Scholar]
  26. Mucina, L.; Rutherford, M.C. The Vegetation of South Africa, Lesotho and Swaziland; Mucina, L., Rutherford, M.C., Eds.; Strelitzia 19: Pretoria, South Africa, 2006; ISBN 978-1-919976-21-1. [Google Scholar]
  27. Runkle, J.R. Guidelines and Sample Protocol for Sampling Forest Gaps; United States Department of Agriculture: Portland, OR, USA, 1992; Volume PNW-GTR-28.
  28. Lottering, R.; Mutanga, O.; Peerbhay, K. Detecting and mapping levels of Gonipterus scutellatus-induced vegetation defoliation and leaf area index using spatially optimized vegetation indices. Geocarto Int. 2018, 33, 277–292. [Google Scholar] [CrossRef]
  29. Singh, L.; Mutanga, O.; Mafongoya, P.; Peerbhay, K.Y. Multispectral mapping of key grassland nutrients in KwaZulu-Natal, South Africa. J. Spat. Sci. 2018, 63, 155–172. [Google Scholar] [CrossRef]
  30. Gamon, J.A.; Field, C.B.; Goulden, M.L.; Griffin, K.L.; Hartley, A.E.; Joel, G.; Penuelas, J.; Valentini, R. Relationships Between NDVI, Canopy Structure, and Photosynthesis in Three Californian Vegetation Types. Ecol. Appl. 1995, 5, 28–41. [Google Scholar] [CrossRef] [Green Version]
  31. Maselli, F. Monitoring forest conditions in a protected Mediterranean coastal area by the analysis of multiyear NDVI data. Remote Sens. Environ. 2004, 89, 423–433. [Google Scholar] [CrossRef]
  32. Bhandari, A.K.; Kumar, A.; Singh, G.K. Feature Extraction using Normalized Difference Vegetation Index (NDVI): A Case Study of Jabalpur City. Procedia Technol. 2012, 6, 612–621. [Google Scholar] [CrossRef]
  33. Zhu, X.; Liu, D. Improving forest aboveground biomass estimation using seasonal Landsat NDVI time-series. ISPRS J. Photogramm. Remote Sens. 2015, 102, 222–231. [Google Scholar] [CrossRef]
  34. Balzter, H. Forest mapping and monitoring with interferometric synthetic aperture radar (InSAR). Prog. Phys. Geogr. 2001, 25, 159–177. [Google Scholar] [CrossRef] [Green Version]
  35. Kellndorfer, J.; Cartus, O.; Bishop, J.; Walker, W.; Holecz, F. Land applications of radar remote sensing. In Land Applications of Radar Remote Sensing; Holecz, F., Pasquali, P., Millisavjevic, Closson, D., Eds.; Intech: London, UK, 2014. [Google Scholar]
  36. Souza-Filho, P.W.M.; Paradella, W.R. Use of synthetic aperture radar for recognition of Coastal Geomorphological Features, land-use assessment and shoreline changes in Bragança coast, Pará, Northern Brazil. An. Acad. Bras. Cienc. 2003, 75, 341–356. [Google Scholar] [CrossRef]
  37. Breiman, L. Random Forests. Mach. Learn. 2001, 45, 5–32. [Google Scholar] [CrossRef] [Green Version]
  38. Dye, M.; Mutanga, O.; Ismail, R. Examining the utility of random forest and AISA Eagle hyperspectral image data to predict Pinus patula age in KwaZulu-Natal, South Africa. Geocarto Int. 2011, 26, 275–289. [Google Scholar] [CrossRef]
  39. Liaw, A.; Wiener, M. Classification and Regression by randomForest. R News 2002, 2, 18–22. [Google Scholar] [CrossRef]
  40. Peerbhay, K.Y.; Mutanga, O.; Ismail, R. Investigating the capability of few strategically placed worldview-2 multispectral bands to discriminate forest species in KwaZulu-Natal, South Africa. IEEE J. Sel. Top. Appl. Earth Obs. Remote Sens. 2014, 7, 307–316. [Google Scholar] [CrossRef]
  41. Peerbhay, K.Y.; Mutanga, O.; Ismail, R. Commercial tree species discrimination using airborne AISA Eagle hyperspectral imagery and partial least squares discriminant analysis (PLS-DA) in KwaZulu-Natal, South Africa. ISPRS J. Photogramm. Remote Sens. 2013, 79, 19–28. [Google Scholar] [CrossRef]
  42. Peerbhay, K.; Mutanga, O.; Lottering, R.; Ismail, R. Mapping Solanum mauritianum plant invasions using WorldView-2 imagery and unsupervised random forests. Remote Sens. Environ. 2016, 182, 39–48. [Google Scholar] [CrossRef]
  43. Marceau, D.J.; Gratton, D.J.; Fournier, R.A.; Fortin, J.P. Remote sensing and the measurement of geographical entities in a forested environment. 2. The optimal spatial resolution. Remote Sens. Environ. 1994, 49, 105–117. [Google Scholar] [CrossRef]
  44. Landis, J.R.; Koch, G.G. An Application of Hierarchical Kappa-type Statistics in the Assessment of Majority Agreement among Multiple Observers. Biometrics 1977, 363–374. [Google Scholar] [CrossRef]
  45. ENVI Environment for Visualizing Images: Version 5.2; Exelis Visual Information Solutions; ITT Industries: White Plains, NY, USA, 2014.
  46. Yuan, X.; King, D.; Vlcek, J. Sugar maple decline assessment based on spectral and textural analysis of multispectral aerial videography. Remote Sens. Environ. 1991, 37, 47–54. [Google Scholar] [CrossRef]
  47. Lottering, R.; Mutanga, O. Estimating the road edge effect on adjacent Eucalyptus grandis forests in KwaZulu-Natal, South Africa, using texture measures and an artificial neural network. J. Spat. Sci. 2012, 57, 153–173. [Google Scholar] [CrossRef]
  48. Hlatshwayo, S.T.; Mutanga, O.; Lottering, R.T.; Kiala, Z.; Ismail, R. Mapping forest aboveground biomass in the reforested Buffelsdraai landfill site using texture combinations computed from SPOT-6 pan-sharpened imagery. Int. J. Appl. Earth Obs. Geoinf. 2019, 74, 65–77. [Google Scholar] [CrossRef]
  49. Peerbhay, K.; Mutanga, O.; Lottering, R.; Bangamwabo, V.; Ismail, R. Detecting bugweed (Solanum mauritianum) abundance in plantation forestry using multisource remote sensing. ISPRS J. Photogramm. Remote Sens. 2016, 121, 167–176. [Google Scholar] [CrossRef]
  50. Gaulton, R.; Malthus, T.J. LiDAR mapping of canopy gaps in continuous cover forests: A comparison of canopy height model and point cloud based techniques. Int. J. Remote Sens. 2010, 31, 1193–1211. [Google Scholar] [CrossRef]
  51. Chan, J.C.W.; Beckers, P.; Spanhove, T.; Borre, J.V. An evaluation of ensemble classifiers for mapping Natura 2000 heathland in Belgium using spaceborne angular hyperspectral (CHRIS/Proba) imagery. Int. J. Appl. Earth Obs. Geoinf. 2012, 18, 13–22. [Google Scholar] [CrossRef]
  52. Bastin, A.J.; Barbier, N.; Couteron, P.; Adams, B.; Bogaert, J.; De Cannière, C.; Bastin, J.; Barbier, N.; Couteron, P.; Adams, B.; et al. Aboveground biomass mapping of African forest mosaics using canopy texture analysis: Toward a regional approach. Ecol. Appl. 2014, 24, 1984–2001. [Google Scholar] [CrossRef] [PubMed]
  53. Kayitakire, F.; Hamel, C.; Defourny, P. Retrieving forest structure variables based on image texture analysis and IKONOS-2 imagery. Remote Sens. Environ. 2006, 102, 390–401. [Google Scholar] [CrossRef]
  54. Zhao, P.; Lu, D.; Wang, G.; Wu, C.; Huang, Y.; Yu, S. Examining spectral reflectance saturation in landsat imagery and corresponding solutions to improve forest aboveground biomass estimation. Remote Sens. 2016, 8. [Google Scholar] [CrossRef]
  55. Dube, T.; Mutanga, O. Investigating the robustness of the new Landsat-8 Operational Land Imager derived texture metrics in estimating plantation forest aboveground biomass in resource constrained areas. ISPRS J. Photogramm. Remote Sens. 2015, 108, 12–32. [Google Scholar] [CrossRef]
  56. Feng, Q.; Liu, J.; Gong, J. UAV remote sensing for urban vegetation mapping using random forest and texture analysis. Remote Sens. 2015, 7, 1074–1094. [Google Scholar] [CrossRef]
  57. Masek, J.G.; Hayes, D.J.; Hughes, M.J.; Healey, S.P.; Turner, D.P. The role of remote sensing in process-scaling studies of managed forest ecosystems. For. Ecol. Manag. 2015, 355, 109–123. [Google Scholar] [CrossRef] [Green Version]
  58. Ahrends, A.; Burgess, N.D.; Milledge, S.A.H.; Bulling, M.T.; Fisher, B.; Smart, J.C.R.; Clarke, G.P.; Mhoro, B.E.; Lewis, S.L. Predictable waves of sequential forest degradation and biodiversity loss spreading from an African city. Proc. Natl. Acad. Sci. USA 2010, 107, 14556–14561. [Google Scholar] [CrossRef] [PubMed] [Green Version]
Figure 1. Location of the patches of Northern Coastal Forest investigated.
Forests 09 00781 g001
Figure 2. Examples of field and associated satellite imagery (SPOT7) of representative canopy gaps in the three forests investigated.
Forests 09 00781 g002
Figure 3. Number and corresponding area of gaps sampled across the study sites (n = 36).
Forests 09 00781 g003
Figure 4. Results of inter-band Pearson’s correlation analyses for the four SPOT7 spectral bands used in this study.
Forests 09 00781 g004
Figure 5. Delineated canopy gaps based on random forest classification and GLCM (representative sample).
Forests 09 00781 g005
Figure 6. Waveband importance for (a) SPOT7 5 m imagery and (b) SPOT7 pan-sharpened 1.5 m imagery including SAR, NDVI and texture variables measured by the mean decrease in accuracy.
Forests 09 00781 g006
Table 1. Site characteristics of three forests investigated.
ForestSize (km2)Altitudinal Range (m a.s.l.)LocationLatitudeLongitude
Hawaan1.2671uMhlanga29°42′38.30″ S31°5′24.20″ E
uMdoni3.2726uMdoni30°23′53.23″ S30°41′16.77″ E
uMdloti0.9737uMdloti29°40′49.64″ S31°6′38.73″ E
Table 2. Confusion matrix based on Random Forest (RF) classification using SPOT7 wavebands with 5 m resolution (n = 6).
Intact CanopyGapsRow TotalUser’s Accuracy (%)
Intact canopy1205017070.59
Gaps6013019068.42
Column total180180360
Producer’s accuracy (%)66.6772.22
Table 3. The confusion matrix based on Random Forest (RF) classification using pan-sharpened SPOT7 wavebands with 1.5 m resolution (n = 6).
Intact CanopyGapsRow TotalUser’s Accuracy (%)
Intact canopy1303016081.25
Gaps5015020075.00
Column total180180360
Producer’s accuracy (%)72.2283.33
Table 4. Overall classification performance for SPOT7 imagery (5 m and 1.5 m) with Normalised Difference Vegetation Index (NDVI), Synthetic Aperture Radar (SAR) and including grey level co-occurrence (GLCM) image texture variables.
SPOT7 (5 m), NDVI, SARSPOT7 (5 m), NDVI, SAR, GLCMSPOT7 (1.5 m), NDVI, SARSPOT7 (1.5 m), NDVI, SAR, GLCM
PAUAPAUAPAUAPAUA
Gap7268787483758984
Intact canopy6771727672818388
Std deviation3.542.124.241.417.784.424.242.83
Overall accuracy (%)69.4475.0077.7886.11
Std deviation3.935.89
Kappa coefficient (ϰ)0.590.700.660.72

