1. Introduction
Sapwood depth (also called sapwood thickness) and sapwood area are commonly used parameters to scale sap flow measurements from a single cross section within a tree to the entire tree, to plots (i.e., stands) and beyond. Furthermore, these scaled sap flow rates may be input data to environmental models, climate change analysis, hydrological water balance, and water–plant relationships [
1]. The methods used to distinguish sapwood from heartwood rely on assumptions that are not always applicable due to physiological and morphological differences among tree species. This can result in errors in the measurement of sapwood depth and, therefore, lead to errors in sapwood area, tree sap flow rates and transpiration estimates. Overall, the method used to estimate sapwood depth and sapwood area may considerably influence sap flow values scaled to the entire tree [
2,
3,
4].
Common, direct methods of sapwood depth measurement include the injection of dye in situ, sapwood–heartwood boundary distinction by light transmission (i.e., translucence) and sapwood–heartwood boundary distinction by change in wood color. Another method is the microscopic analysis of wood anatomy, which is considered more rigorous than the methods mentioned above.
In theory, the dye injected into a cored tree trunk should flow from the base to the apex, following the natural sap flow. But tree age and physiological characteristics can hinder the ascent of the dye including the tangential spread and the pattern of water conduction [
5]. Some researchers have successfully used this method in tropical and mixed deciduous forest species [
6,
7], but none of the works reported accuracy assessments and only Mokany et al. [
8] commented on the need for coring the trees at different height levels to find the dye traces.
Sapwood–heartwood boundary distinction methods assume that a trunk’s cross-section at any height level generally shows two zones: a light one located at the outermost part of the trunk (generally translucent due to high water content), and a darker zone (due to phenolic compounds and resins [
9,
10]) located at the innermost part of the tree trunk [
11,
12,
13,
14]. For most species, the lighter colored, translucent zone is considered the sapwood. Sapwood depth measurements obtained with this method have revealed significant correlations with a variety of morphological features such as foliage biomass [
14,
15,
16,
17,
18,
19,
20,
21]. However, the method could introduce uncertainty into these correlations since the anatomical assumptions behind it do not strictly apply to every species, or even within the same species [
1,
22,
23,
24,
25,
26]. For instance, some species (e.g.,
Picea mariana (Mill.) BSP and
P. glauca (Moench) Voss) show only very slight to no sapwood–heartwood color differences. Pathological conditions of wood (e.g., pathogenic invasion, tree injury, wetwood [
24,
26]) can also alter anatomical characteristics creating false sapwood–heartwood zones [
12,
26]. Also, for some species, the water content in the transitional zone and heartwood is similar to their sapwood water content [
2,
27], which leads to over- or underestimations of sapwood depth. Since differences in color and translucency are not always evident at first sight for all species, advanced technology may be used to determine the sapwood–heartwood boundary. Computed tomography [
28], and microwave scanning [
29], are some of the latest techniques used to evaluate the wood moisture profile and determine sapwood depth. These techniques are, however, onerous and expensive to employ. Thus, the conventional methods mentioned above are widely used to determine sapwood depth in a large number of samples.
Microscopic differentiation of sapwood from heartwood requires the anatomical identification of capillary structures (vessels or tracheids), the density of these conducting elements, the presence and gradual decrement of alive ray parenchyma, starch grains and centered pits [
30]. Not surprisingly, these elements directly impact sap flow and nutrient transport, which occurs in sapwood [
31,
32]. Jeremic et al. [
23] stressed that the only confident way of differentiating heartwood and wetwood from sapwood is by means of microscopic wood anatomy. Čermák and Nadezhdina [
2] demonstrated that the best way to avoid errors due to physiological differences is through microscopic differentiation. Some authors have also used the microscopic differentiation of wood anatomy to explain how the direct methods mentioned above give inaccurate measures of sapwood depth [
22,
23,
24,
27]. Still, the most commonly used methods are sapwood–heartwood boundary differentiation by observing the change in color or translucency, and the dye injection method due to their apparent ease [
19,
33,
34,
35,
36] and simplicity. They are easy in situ measurements with relatively little time investment. Because it is not likely these methods will be abandoned, an assessment of the errors involved in these methods is warranted.
The research hypothesis is that the uncertainty associated with the use of quick, inexpensive methods for determining sapwood depth is quantifiable and that, once quantified, it can be used to improve the accuracy of these methods. Therefore, the objective of this research is to assess the differences in two direct methods (translucence method and change in wood color method) by comparison with the microscopic analysis of wood anatomy when estimating sapwood depth for three boreal species: Populus tremuloides (Michx.), Pinus banksiana (Lamb.) and Picea glauca ((Moench) Voss). These three species are prominent in the Canadian boreal forest and, thus, affected by forest management practices. The microscopic analysis of wood anatomy is used as a reference (known or “true” values) since it is considered to be the most accurate and rigorous method. The results should provide recommendations that can help to account for error propagation in sapwood depth estimates, and in scaled values of sapwood area.
2. Materials and Methods
2.1. Field Sites and Data Collection
Wood cores were collected during two different field campaigns (2003 and 2004) in three sites: Kananaskis Country (KC) and White Court, (WC) both in Alberta, Canada; and Prince Albert National Park (PANP), in Saskatchewan, Canada. Kananaskis Country has a Montane closed forest formation [
37] within the Rocky Mountains [
38,
39] and is classified as an ecoregion within the Cordilleran Ecoprovince. The species sampled at this site were
Picea glauca, and
Populus tremuloides. The White Court forest is within the mid boreal mixedwood ecoregion [
39] and considered a closed forest formation [
40] in the Southern Alberta uplands [
39]. A pure stand of
Pinus banksiana was selected for sampling in WC. PANP straddles the northern boreal forest (in the northern part of the park) and aspen parkland (in the southern part of the park) ecozones of Saskatchewan. Stands of
Populus tremuloides, Picea mariana and
Pinus banksiana were selected for sampling in PANP [
41].
A Haglof Increment Borer (Haglöf Sweden AB) of 200 mm length and 5.15 mm diameter was used to extract trunk wood cores. Mature trees were cored out at breast height, i.e., 1.3 m from the tree base, on the North, South, East and West sides. The wood cores were immediately wrapped in aluminum foil and kept in polyethylene bags in a cold environment. To prevent infestations from insects or fungi to the sampled trees, the cavities were completely sealed using a tree wax.
Since the conifers’ tracheids and the vessels of
Populus tremuloides can support extreme changes in weather [
42,
43], the specimens can be preserved with refrigeration without damaging their active xylem structure. Thus, the samples were refrigerated (at 5 °C) and occasionally misted with distilled water to avoid cracks and dehydration. The outer bark diameter at breast height (
Dob) of each cored tree was also measured.
Table 1 lists the three species considered in this study, their respective wood types, the field sites, the number of trees sampled at each site (
n), and the maximum and minimum
Dob of the trees sampled. For every tree sampled, four cores were extracted—one in each cardinal direction (thus, the number of cores tested in any site is 4
n).
2.2. Direct Methods: Translucence Method and Color-Change Method
Before using microscopic differentiation, the translucence and color-change methods were attempted on each core to measure sapwood depth. All the collected cores were allowed to reach room temperature over a two-hour period because cores at room temperature experience better water absorption. Every core was soaked in distilled water after reaching room temperature. Following this, the authors observed each wood core of every species to differentiate change in wood color, and sapwood depth was measured as the length of the portion of the core with a lighter color than the rest of the core length (which is considered the heartwood). Once sapwood depth was defined by the change in color, each wood core was exposed to a source of artificial light (white incandescent light bulb) to highlight the translucent zone of the core. The method’s principle rests on the suggestion that the portion of the wood with a high water content appears to be translucent when exposed to bright light and is, thus, considered the active sapwood [
11,
12]. Therefore, the length of the translucent zone of each wood core was measured and here reported as the sapwood depth.
All the cores were examined by these methods for the three boreal species as well as for cores taken in stands of Picea mariana and Pinus contorta (Doug. ex Loud. var. latifolia Engelm.) that were part of the overall research objectives. However, these direct methods only provided estimates of sapwood depth in two cores of Picea mariana and no useable estimates in Pinus contorta. Eventually, these methods could only provide useable samples (based on the quality of the sample) from 12 trees of Pinus banksiana, eight Picea glauca trees and five Populus tremuloides trees. In addition, not every tree produced a useable core (that is, could be assessed using these direct methods) on all four sides.
In addition, the direct method of dye injection in situ was also attempted in this research. This method involved injecting the tree with methyl-blue dye, which is an organic solution believed to travel easily through the sapwood conducting tissues while staining them. The radial length of stained wood while the dye moves towards the canopy is considered the total sapwood depth [
6,
7,
44,
45]. The injection of dye in situ was applied to trees at PANP. The dye was injected through the hole made by the borer at breast height. After 2 h, a wood core was extracted at 2cm above the dye injection point. Unfortunately, after several attempts with the dye injection method, there were no clear indications of radial or longitudinal dye dispersion in any of the tests [
34]. In total, the dye was injected into 23 specimens of
Populus tremuloides, 21 of
Pinus banksiana, and 25 of
Picea mariana but traces of dye were only observed in four specimens of
Picea mariana, two specimens of
Populus tremuloides, and one specimen of
Pinus banksiana (see [
34] for details). Thus, no further analysis was conducted with this method.
2.3. Microscopic Analysis of Wood Anatomy
The following steps were followed in the application of the microscopic method:
The innermost side of the core was the initial point where the heartwood–sapwood boundary was delimited by the translucence or color-change method.
A cross-sectional cut of the core was made right at the boundary separating heartwood from sapwood to expose the cross-section at the boundary.
At both sides of the cross-section boundary, thin cross-sectional slices were cut and stained with safranin dye (2 slices) and methyl-blue (2 slices).
After 10 min, the sections were rinsed with a few drops of distilled water to eliminate the excess dye.
The sections were placed onto glass slides and observed in a light microscope.
If the wood anatomy did not concur with the boundary marked by the translucence/color change method, more sections were cut and analyzed under the microscope.
If heartwood was identified instead of sapwood, the process was repeated with the next ring at the innermost side of the core, until the sapwood was apparent. The microscopic analysis of the innermost side of the core ends here.
If sapwood was still apparent on the side marked as heartwood, then steps 3–6 were applied to that section of the core until the actual sapwood–heartwood boundary was anatomically identified.
To identify the outermost boundary between sapwood and non-conductive tissues, we visually identified the non-conductive tissues and proceeded to cut thin cross-sectional slices at both sides of the cross-section boundary. Steps 4 to 7 were followed to identify the non-conductive tissues at the outermost side of the wood core, cambium and phloem, until active sapwood was apparent.
Once sapwood was apparent in both sides of the core, its length was measured and reported as the sapwood depth.
All the wood cores that were successfully analyzed with either the translucence or color change method were also successfully analyzed through the microscope. For most of the wood cores, it was possible to estimate sapwood depth with an accuracy of 0.01 mm by using the microscope ocular micrometer. Factors that affected the observation of wood anatomy under the microscope were related to wood decay, high concentrations of bacteria, malformations, and other conditions [
23]. The authors note that in the 480 wood cores collected for the overall research campaign, it was not possible to differentiate and measure sapwood depth with microscopy in 17.5% of the samples collected.
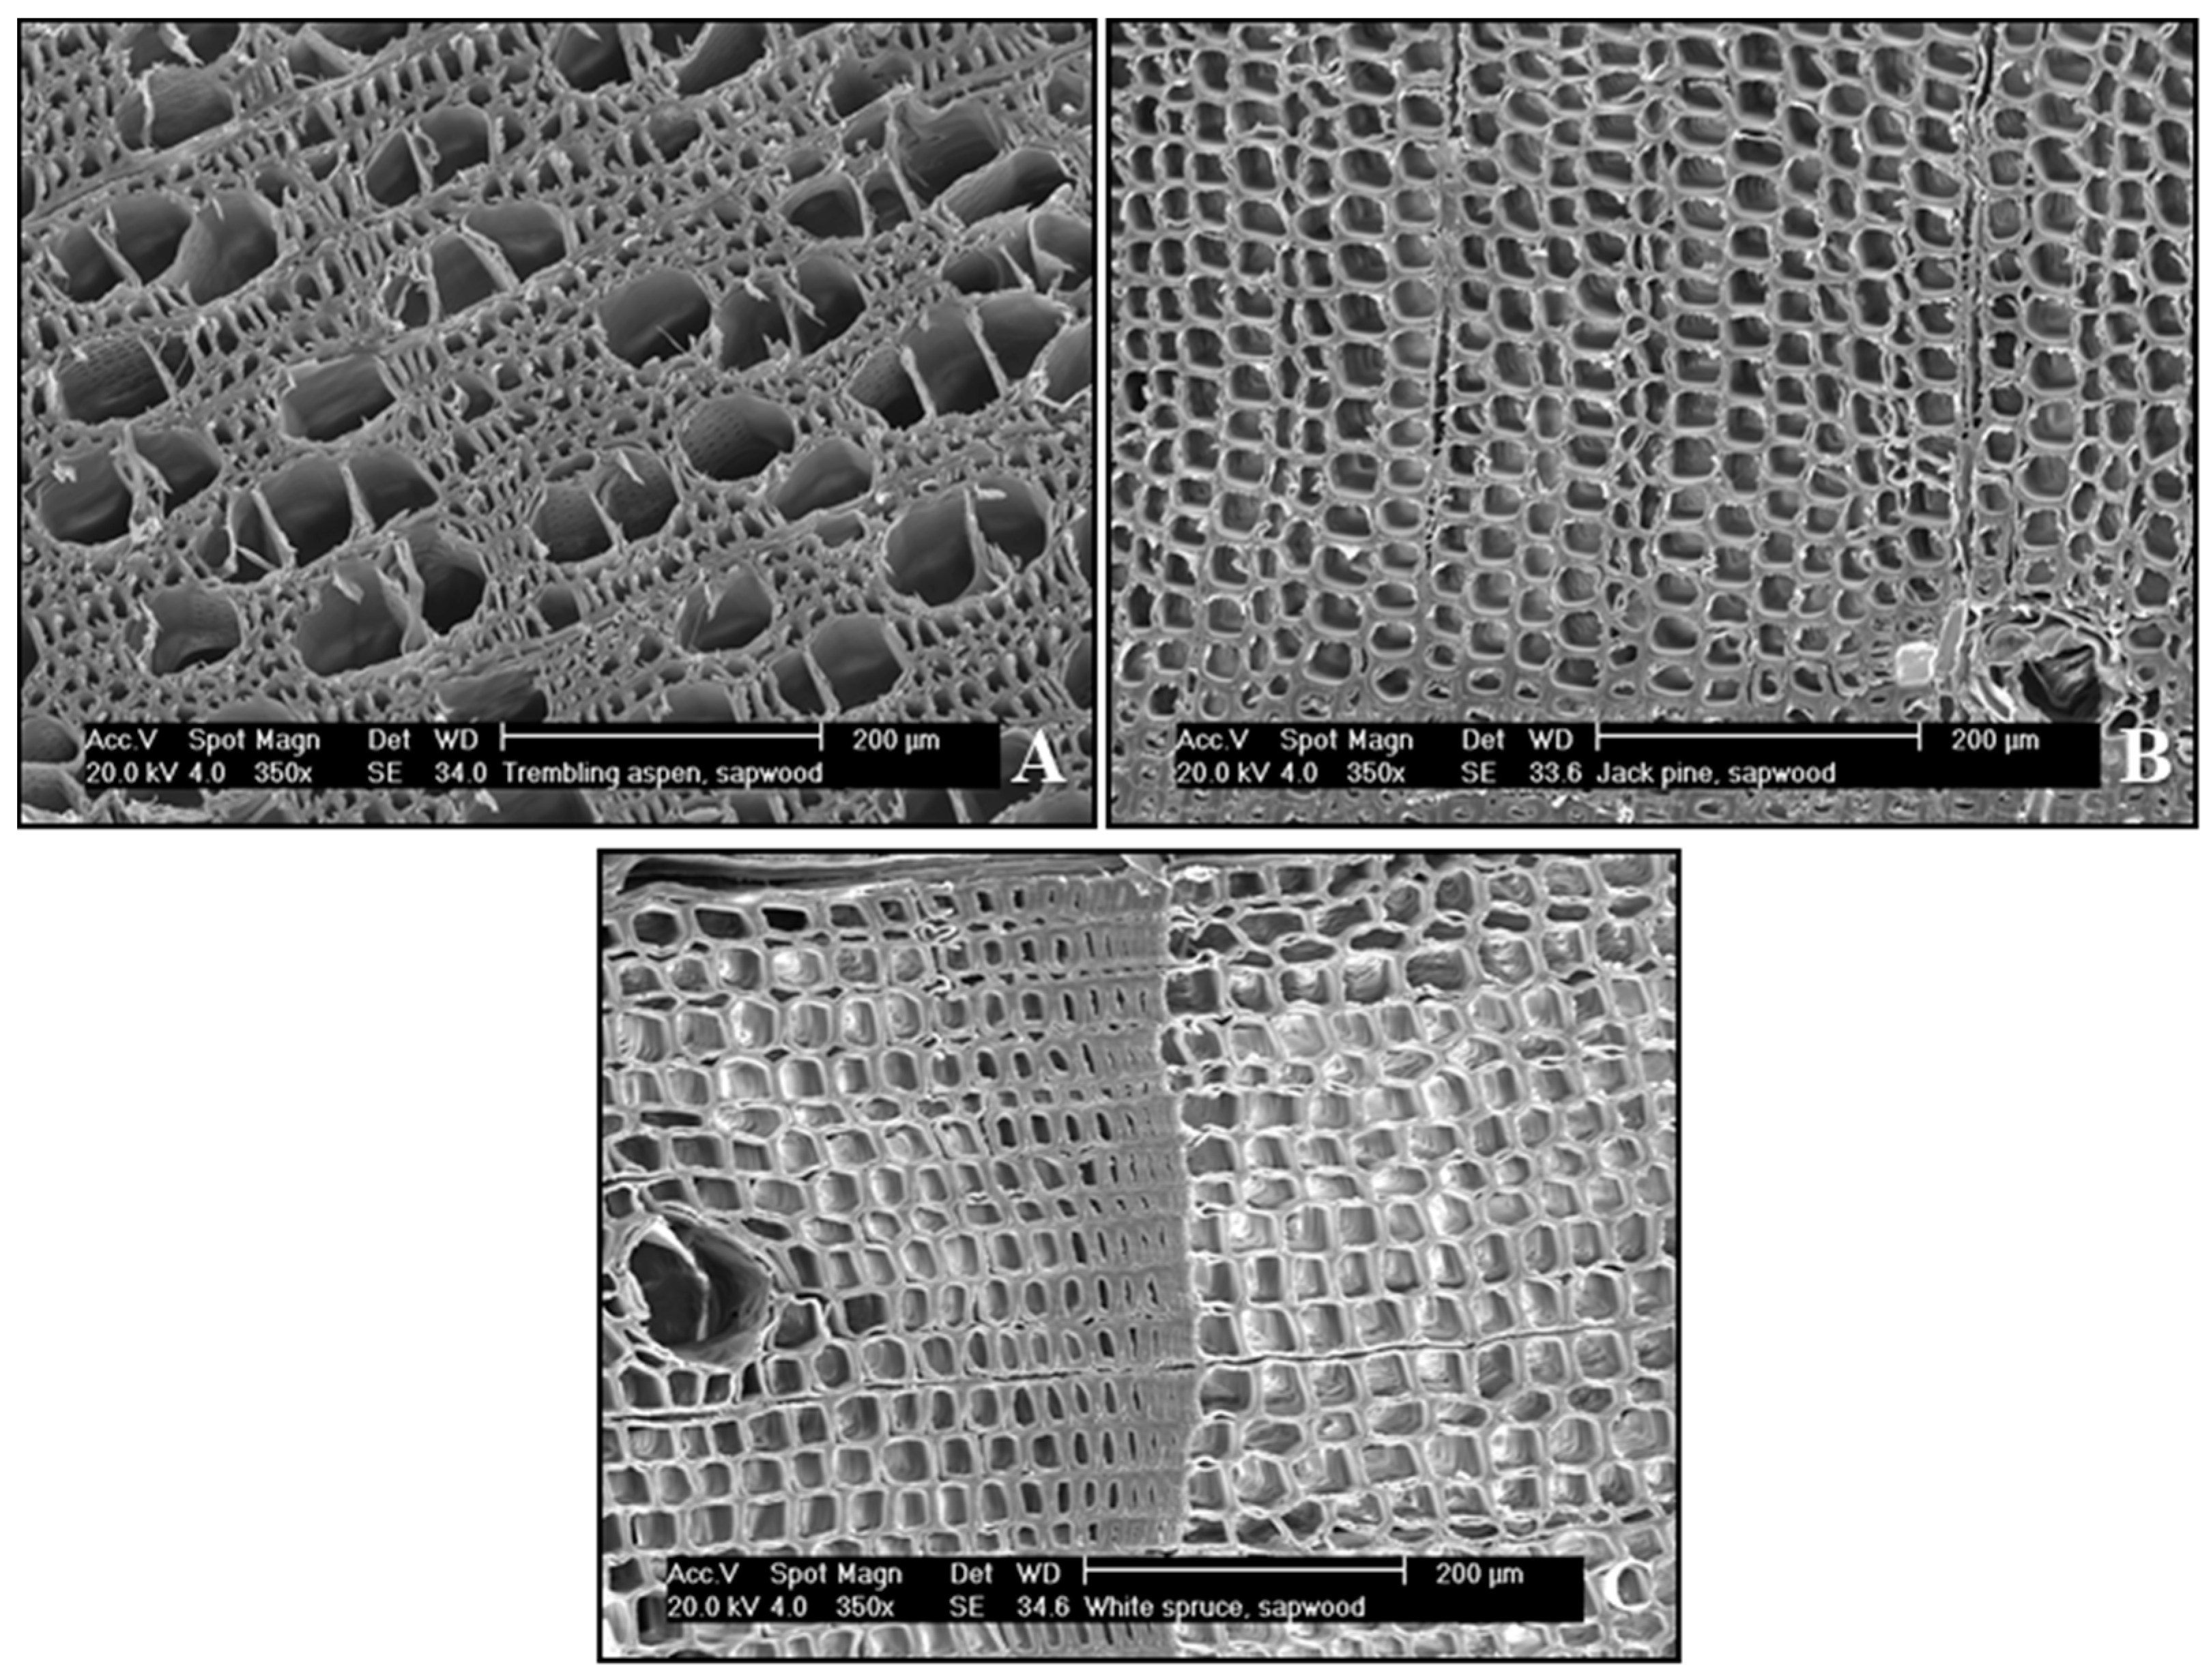
Microscopical anatomy can be revealed through micrographs—images of wood cores captured onto scanning electron micrographs (SEM) using an Environmental Scanning Electron Microscope model XL30 (Philips/FEI, Hilsboro OR, USA) –examples are shown in
Figure 1 for each type of tree studied here. Micrographs of conifer wood will show typical sapwood characteristics, such as the presence of unaspirated bordered pits and open resin canals. The unaspirated bordered pits are microscopical cavities with a centered membrane (torus-margo pit membrane) that allow transversal sap flow. When sapwood turns into heartwood, the torus-margo pit membrane adheres to one side of the bordered pit—a phenomenon known as aspiration [
11,
46,
47]. This phenomenon creates a structural difference of the bordered pits, which is an adequate anatomical reference to differentiate sapwood from heartwood. The presence of tyloses is more common in angiosperm trees such as those pertaining to the genus
Populus [
12]. Thus, the considerably high concentration of tyloses in heartwood was the key feature for distinguishing between sapwood and heartwood in
Populus tremuloides. Other features used for sapwood recognition (not shown) were the presence of bacteria and starch grains. Distinguishing sapwood and heartwood features for samples obtained in this research are given in Quiñonez-Piñón and Valeo [
41].
For the purposes of assessing the direct methods used in this research, a result for each specimen was possible when both the direct method (either translucence or color change) and the method of microscopy provided an estimate of sapwood depth. The methods of translucence and microscopy were successfully applied to a total of 36 cores of Picea glauca, and 50 cores of Pinus banksiana. The color-change method proved more suitable for use when dealing with Populus tremuloides cores and this method, along with microscopy, was successfully applied to 17 cores of Populus tremuloides.
Statistical analysis was conducted on these data sets for assessing the accuracy of the translucence method and color-change methods. The sapwood depths obtained using these methods are considered estimated values, while sapwood depths obtained with the microscopy method on the same core are considered the true value. Plots of estimated sapwood depth versus true sapwood depth are created to provide illustrations of trends and bias. Errors are calculated as the difference between the estimated value and true value for each core, and statistics are calculated for the errors. All the statistical analyses were performed with Minitab, version 13.32 and version 18.0 (Minitab Inc., State College, PA, USA). The analysis included paired-t tests, Pearson’s correlation coefficient calculations, detection of outliers, linear regression analysis, the analysis of variance (ANOVA), identification of unusual observations, and the lack-of-fit test. Finally, each linear model’s residuals (developed in the linear regression analysis) were examined in order to check the model adequacy.
4. Discussion of Accuracy of the Methods
The direct methods of translucence and color change have already been noted as methods to use with caution [
2,
3] when estimating sapwood depth, particularly if those methods are to eventually be used for scaling purposes. The visual tracing of sapwood–heartwood edge was possible by the translucence method in the
Picea glauca and
Pinus banksiana samples; while the color-change method was the more feasible method for application to the
Populus tremuloides samples. When examining the deviations from the sapwood depth measurements obtained with the microscope, there was a strong overestimation of sapwood depth by the direct method in
Picea glauca and
Populus tremuloides individuals, while underestimates commonly occurred in
Pinus banksiana individuals. The reported percentages quantify the over- and underestimates, keeping in mind that these results are species-specific.
The sapwood overestimates in
Picea glauca can be explained by the fact that the outermost part of the heartwood can hold a similar or even higher water content than sapwood; thus, the results concur with previous statements made by [
2,
3,
27]. Underestimates in hybrid poplars (known as
Populus x
interamericana, hybrids of
P. trichocarpa x
P. deltoides (Hook) Torr. & A. Gray) were observed in the literature by [
2] based on wood water content but here, overestimates were noticed with the color change in wood for
Populus tremuloides. Sapwood in
Pinus banksiana specimens were underestimated by the translucence method, which implies that in the case of this species, their innermost sapwood holds a low water content that keeps the sapwood opaque.
The uncertainty associated with the translucence and color change method is complex to estimate because it is a function of the gross and systematic errors. Both types of errors are difficult to measure because the sapwood depth is estimated using human, visual judgement. The only guidance in using these direct methods is that the sapwood transmits light while the heartwood does not (due to the high water content of the sapwood), or that the heartwood is darker in color than the sapwood. Based on our results, that criterion might be weak since the wood water content and color vary and confound both the sapwood and the heartwood. On the contrary, the uncertainty associated with the microscopic analysis method can be estimated and carried into further estimates or predictions. Here, it is estimated that the error on sd is related to the accuracy of the ocular scale of the microscope (with divisions of 1μm) and the ruler (with divisions of 1 mm) used to measure each core’s sapwood depth. Thus, the instrument limit of error (ILE) is estimated as ½ of the largest measuring instrument (the ruler). Hence, the error associated with the sapwood depth measurements (δsd) is sd*ILE = 0.5(1) mm, giving δsd = ±0.5 mm. This is considered a relatively small inaccuracy, particularly in comparison to the possible errors when using the direct methods. Thus, in regard to propagation of errors, this error was considered negligible.
Sapwood depth values have been used in the literature to estimate sapwood area, which in turn have been used to develop allometric correlations with other tree biometrics (such as leaf area) in order to estimate forest stand parameters at the plot level and larger [
49,
50]. Thus, any error in sapwood depth can propagate to estimates of sapwood area, leaf area and other forest stand parameters that are somehow derived from some estimate of sapwood depth. To discuss the implications of errors from the translucence method and the color-change method on sapwood area and other tree biometrics, a simple error propagation analysis is conducted to begin the discussion. Sapwood area can be estimated with the following equation, which effectively calculates the area of a circular ring or annulus:
where
SA is the sapwood area (in cm
2),
Dob is the outer bark diameter at breast height (in cm) and
sd (in cm) is the sapwood depth for each tree. In each tree
sd is calculated as the average of its four cardinal points’ sapwood depth. Based on Equation (5), the absolute error in sapwood area estimates can be calculated by a Taylor series [
48]:
Therefore,
where
δSA is the error in the estimated sapwood area using the translucence sapwood depth values,
δDob is the outer bark diameter at breast height for each tree, and
δsd is the error of the measured sapwood depth for each tree determined in
Section 3 for each species. With regard to
δDob, the diameter at breast height was verified by measuring the diameter on the same tree 50 times. Two trees were measured in this exercise. The tree with a
Dob of 0.98 m was always measured at 0.98 m; thus, this error was null. The second tree with a
Dob of 1.24 m was measured to a precision of ± 0.0048 m. The average of the two calculated errors was used as the precision in
Dob (
δDob ± 0.24 cm).
Figure 5a shows the sapwood area computed for each tree based on the sapwood depth measured with the translucence method, and its upper and lower errors computed using Equation (7) and the accuracy limits reported for
Picea glauca. Because of the unevenness of the accuracy estimation, there is a greater probability that the
SA value is overestimated than underestimated for this species. By Equation (7), this error grows as the diameter grows. This is because the value of the error in the sapwood area (left side of Equation (7)) is dominated by the second set of brackets on the right side of the Equation. Even if
δsd is small, as
Dob increases in the π
Dob term, this increase dominates the growth in
δSA. However, one could simply invert Equation (2) to estimate what
sd would be if measured with a microscope and compute
SA.
The
Pinus banksiana sapwood depth areas produced no feasible equation but did show a consistent bias in the underestimation of sapwood depth. The data suggest that an average bias of −1.64 cm is present in the data. Thus, to explore the use of employing this bias, the sapwood areas were computed using observations obtained with the direct method, the microscopic method, and a bias corrected sapwood depth, which added 1.64 cm to all direct method sapwood depth estimates. This is plotted in
Figure 5b. This figure shows that the bias-corrected estimates only overestimated the sapwood area by an average of 5 cm
2 (standard error of the mean equal to 40.5 cm
2) in comparison to the underestimated sapwood area by the uncorrected translucence sapwood depth of –56 cm
2 (standard error of the mean equal to 42.2 cm
2).
In 65% of the cases, Populus tremuloides’s sapwood depth was overestimated by the color method. In the remaining 35% of cases, the measured sapwood depth was exactly the same for both methods (i.e., the error was null). In terms of sapwood area, the largest overestimation was 18% of the total area calculated with the microscopy method. On average, the overestimates were 10% of the total area calculated with the microscopic analysis method.
It is common to see reports of allometric models for the same species that differ in results [
17,
21,
49,
50]. This discrepancy is normally attributed to site conditions and the species’ physiological response to such conditions. The authors suggest that the different methods used to measure sapwood depth is also contributing to the discrepancies among those allometric models. Reporting errors associated with the method used to measure sapwood depth will open the door for comparisons among different allometric models created for the same species.
In terms of scaling purposes, the under- and overestimation of sapwood depth, and consequently of sapwood area, generates considerable differences at larger spatial scales. Sapwood area is used for estimating transpiration rates from forest stands [
1] and thus, when it comes to watershed management that involves forest water yield studies, or changes in canopy transpiration rates due to climate change, these differences will have a considerable influence in the final conclusions and plan managements. Thus, it would be appropriate to quantify the error associated with the method used for estimating sapwood depth if further modeling, scaling or predictions are attempted. In addition,
Figure 2b,
Figure 3b and
Figure 4b all show that sapwood depths vary with direction. Quiñonez-Piñón and Valeo [
41] demonstrated that for the species studied in this work, the tendency for
Pinus banksiana to grow thicker on the North-East side, for example, was very strong and statistically significant. These kinds of variations should also be considered when attempting to use sapwood depth estimates for estimating evapotranspiration and other physiological responses to climate.
5. Conclusions
The translucence method and the color change method consistently over- or underestimated (depending on the species) sapwood depth due to the inter- and intra-specific structural variations for three boreal species Picea glauca, Pinus banksiana, and Populus tremuloides. For every statistical comparison, sapwood depth values obtained with these direct methods were significantly different from those obtained using the microscopic analysis. Considering the microscopic sapwood depth values as truth, the error associated with the translucence or color change methods derived sapwood depths for the three species noted above ranged from −5% to 30%; −1000% to +100%; and 0 to 50% for Picea glauca, Pinus banksiana and Populus tremuloides, respectively.
Not all species and individuals of each species show an evident change in color between sapwood and heartwood. In the same manner, the theory behind the translucence by light transmission cannot guarantee that sapwood has a higher water concentration than the heartwood, as it was observed in this study. Also, these two methods overlook the fact that there is a transition zone between sapwood and heartwood, which is not visual to the naked eye and could potentially lead to over- or under-estimation of sapwood depth. The most precise method to measure sapwood depth is the microscopic analysis of wood anatomy, which has minimal error that can also be estimated; and, as well, anatomical details such transition zones can be identified. Since this method is time consuming, the optimal approach would be to use the translucence method (for Picea glauca and Pinus banksiana), or the color-change method (for Populus tremuloides) and the estimated error given for each species when computing other parameters that use sapwood depth. The authors suggest reporting the error (or accuracy) associated with the two visual methods and propagating it forward for scaling purposes or for the study of allometric correlations. As previously discussed, the resulting random errors are not only species-specific but user-dependent, but the error associated with the measuring instrument (ruler or microscope) can be calculated or obtained from the instrument’s manufacturer (in the case of a caliper, for instance).
This research quantifies errors in sapwood depth obtained with the translucence method for two softwood species, and in the color-change method applied to a hardwood species. This quantification arises from a statistically adequate sample size, and now a user can continue to use these methods in the field and report an expected error in sapwood depth that may be propagated to other tree biometrics. The value of quantifying uncertainty and error cannot be understated and this research now provides the means to quantify the uncertainty in forest metrics that are used in making decisions supporting forest management.


