Article

What Are the Impacts of Deforestation on the Harvest of Non-Timber Forest Products in Central Africa?

by
Pauline Gillet
1,*,
Cédric Vermeulen
1,
Jean-Louis Doucet
1,
Elisabet Codina
1,
Charlotte Lehnebach
1 and
Laurène Feintrenie
2
1
Management of Forest Resources, BIOSE Department, Gembloux Agro-Bio Tech, University of Liège, Passage des Déportés 2, Gembloux 5030, Belgium
2
Research Unit Tropical Forest Goods and Ecosystem Services, Department Environments and Societies, CIRAD, Direction Régionale d’Afrique Centrale, BP 2572, rue Joseph Essono Balla, Yaoundé, Cameroon
*
Author to whom correspondence should be addressed.
Forests 2016, 7(5), 106; https://doi.org/10.3390/f7050106
Submission received: 25 January 2016 / Revised: 9 May 2016 / Accepted: 10 May 2016 / Published: 12 May 2016

Abstract

:
The objective of the study is to evaluate the impact of forest transition on non-timber forest product (NTFP) harvesting in Central Africa. We analyze the evolution of several parameters, including distance from NTFP harvest site to road, proportion of dietary intake and villagers’ incomes. The research is based on field surveys, participatory mapping and the geolocation of activities in three study sites representing different stages along the Mather’s forest transition curve: (i) intact forest; (ii) partially degraded forest; and (iii) small areas of degraded forest with plantations of useful trees. The results show that the maximum distance from harvest site to road is higher in Site 2 compared to Site 1 as a consequence of a lower availability of NTFPs; and that this distance is significantly lower in Site 3 due to a drastically smaller village territory. The diversity of bushmeat decreases as game evolves from large to small species, commensurate with the progression of forest transition. As a consequence, there is also a reduction in the proportion of these products represented both in household dietary intake and cash income. This analysis establishes a strong link between the Mather’s forest transition curve and a decline in the importance of NTFPs in village production and livelihoods.

1. Introduction

Forests (In this paper we consider forests as natural forests, including primary, secondary and degraded forests, and excluding plantations (forestry or agricultural ones)) of the Congo Basin are among the best preserved in the world. Currently, the erosion of biodiversity is low compared with that found in other tropical areas [1]. According to projections of the impacts of global change on biodiversity, as proposed by de Wasseige et al. [2], the conversion of large forest areas (such as industrial extractive mining or large scale plantations) to address economic purposes is expected [3]. The impacts of this on biodiversity and forest-associated ecosystem services could be considerable.
Mather [4] described the process of deforestation due to increasing demographic pressure at a national scale as a “forest transition”. The forest transition curve shows the relationship between forest cover and time (Figure 1). Time can be replaced by an increase in population density or economic development [5]. According to Angelsen [6], the forest transition curve can be divided into four phases: initially, the area is characterized by a high percentage of forest cover with a low deforestation rate, and with a low population density exerting minimal impact on forest resources. Subsequently, as deforestation rate increases, the forest becomes partially degraded through conversion to other land uses. Finally, only small areas of degraded forest remain, deforestation rate slows and forest cover can stabilize. In some cases tree cover regrows, but a number of possibilities exist in this forest transition stage: stabilization of forest cover at a low level; regrowth by spontaneous reforestation on abandoned agricultural lands; and voluntary regrowth by plantation. Figure 1 gives an example whereby the ultimate stage experiences a trend of useful tree plantations on deforested land, leading to an increase in forest cover. This is the result of a shared evolution of economy, culture, technology and institutional development at different scales [7]. The forest transition contributes to a complex phenomenon of change of a socio-ecological system (SES) (The so-called forested SES deals with a particular group of actors who have an impact on a particular set of resources that are allocated to a particular set of institutions in a forested landscape [8]).
A deterministic relationship is assumed between population trends and: (i) infrastructure; (ii) use of land; and (iii) natural forest area [9]. This assumption states that huge areas of primary forest will disappear before the forest transition is completed and deforestation is stopped. Nonetheless, the turnaround point from forest loss to forest gain might be achieved when there is a greater percentage of remaining forest linked to changes in perception and resource use by local people and programs of reforestation or afforestation [10].
Despite the numerous studies dealing with the theory of forest transition [5,11,12], related functional aspects, such as the availability of non-timber forest products (NTFPs) and land tenure aspects, have not been adequately studied. NTFPs were defined by FAO [13] as “goods of biological origin other than wood, as well as services, derived from forests and allied land uses”; in this paper we will distinguish products obtained by hunting and fishing from harvested NTFPs, such as fruit, bark, leaves or caterpillars [14]. In Africa, studies on the diversity and uses of NTFPs exist [14,15,16], but none compare the evolution of these concepts with forest transition. Despite the generalization of health care and food production through the intensification of production systems, not all rural populations can afford or access such services. Forest products meet some of these basic needs. Even in cities, such products are valuable [17,18]. According to Ingram et al. [19], 500 plants and 82 animals are used as NTFPs in Cameroon. Although many studies have considered the biology of the main marketed NTFPs of Central Africa [14,20,21,22,23], little is known regarding the impact on incomes or access to NTFPs of decreasing forest cover. Studies dealing with NTFP, bushmeat or fish focus on forested or savanna landscapes, but rarely look at the impact of the evolution of landscapes or SES on these resources.
The socio-economical aspects of NTFPs must be considered when conducting research on the conservation, utilization and development of forest resources [24]. Clark and Sunderland [17,25,26,27,28] provide lists of the main NTFPs traded on the market, their place of production and their use by the local populations of Central African countries. Other local studies show the economic importance of these products in Central Africa. In villages of South Cameroon, the proportion of incomes generated by NTFPs is very low (maximum 8% of household income) due to changing prices, a lack of communication and transport or irregular harvests [16]. Indeed, these products are mostly used by local populations as a safety-net strategy and for an additional source of income [29]. Contrarily, in the equator province of Demographic Republic of Congo, NTFPs provide the highest earnings, notably more than mean salaries [30]. At the regional level, when the NTFP definition is extended to include firewood and hunting and fishing products, NTFPs represent between 25% and 40% of annual household incomes. These differences are due to access and distance to markets, local knowledge and NTFP availability [19].
Rural populations of Central Africa have historically practiced self-reliant hunting activities predominantly because bushmeat is an important source of animal protein in their diets [31,32,33,34]. However, due to urbanization and the opening of roads and development of towns and cities in forested regions, hunting practices have evolved to meet the urban market demand, resulting in the “bushmeat crisis” [29,32]. In the literature, various positions are expressed regarding the concept of wildlife. Clearly, poaching is a threat for several mammalian species in Central Africa [33] that have to be protected to ensure their survival. But to some other authors and the majority of African populations, wildlife remains a source of food [29]. Although numerous studies have been conducted to investigate the impacts of hunting on wildlife survival and diversity [35], little is known about the evolution of game diversity with forest degradation. “Hunting bag” diversity depends on capture technique and location [35]: snares set in the forest will capture medium-sized duikers (Cephalophus dorsalis) and snares set around villages will capture small blue duikers (C. monticola) and large rodents such as brush-tailed porcupine (Atherurus africanus) or aulacodes (Thryonomys swinderianus). Primates and other large mammals are hunted with guns [35,36].
Fish are another major food and economic resource in Central Africa [37]. Fishing techniques differ depending on location, ethnic group and the size of the rivers located within the village territory. In Doumo, a village in East Cameroon, for example, the various fishing techniques used by the population were described by Abe’ele [38,39]. Fishing takes place in small and medium-sized rivers. Fishing techniques (and the fish species captured) also differ depending on whether they are practiced by men or women.
The aim of this paper is to understand the evolution in the production and use of NTFPs and fishing and hunting products in relation to deforestation rate. More specifically, we aim to determine the following: (i) whether the distance traveled in order to access NTFPs increases when forest cover decreases; (ii) whether incomes derived from NTFP gathering and bushmeat hunting decrease with forest transition; and (iii) whether the proportion of NTFPs and bushmeat consumed in rural populations changes in terms of quantity and species diversity with deforestation.

2. Materials and Methods
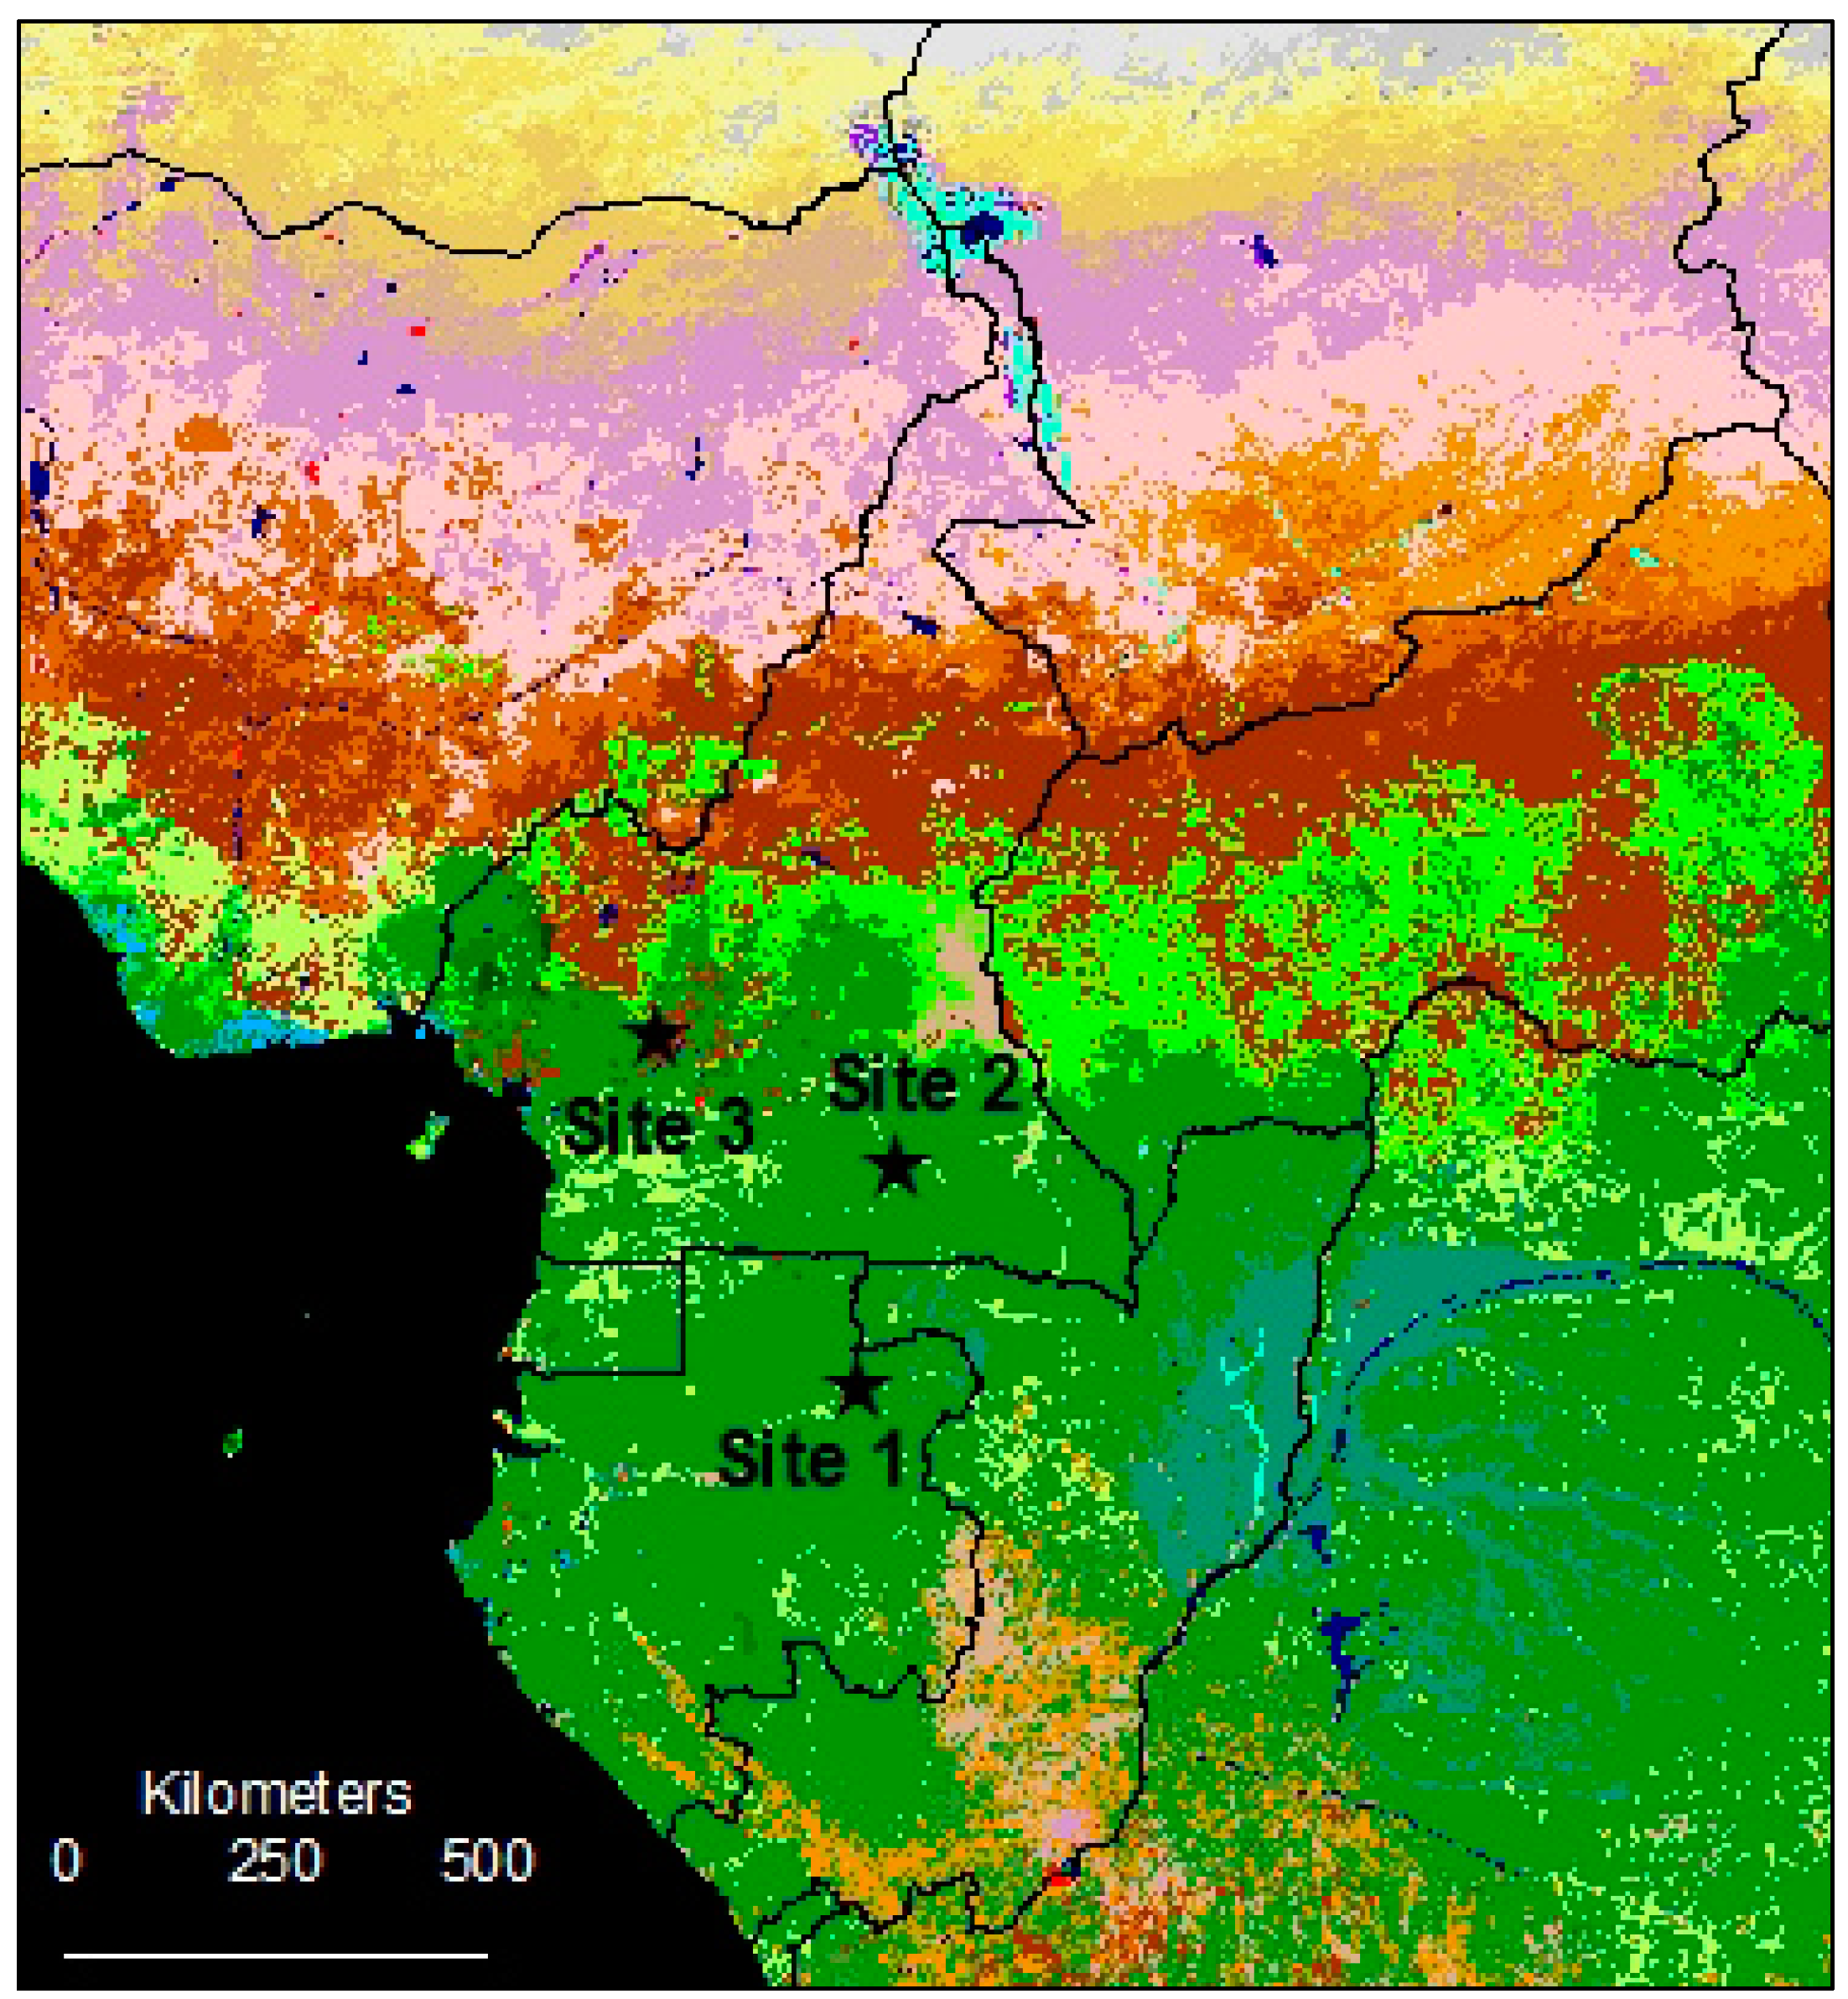
This research employed the use of participatory mapping, as well as observations, interviews and group discussions conducted between June 2013 and May 2014 in eight villages in Central Africa. The villages were located at three research sites in Cameroon and Gabon. The sites were chosen according to their assumed position on the forest transition curve (Figure 1). Otherwise, studying the evolution of socio-economical aspects of an SES using a forest transition curve would require following a defined SES located in an intact environment over a very long period of time. According to Mather et al. [40], in France, forest cover decrease took place between A.D. 500 and 1830, when forest cover subsequently stabilized and afforestation began. Although forest transition in tropical areas is likely to happen sooner and more abruptly than the European model [4], the time available for scientific studies would not be sufficient. To investigate the socio-economic impacts of an SES under a forest transition scenario, we use a synchronic approach: we assume that, at the origin, the three sites benefited from similar ecological conditions and that their natural ecosystems were identical before human disturbance. This assumption is supported by Gond et al. [41]. We further assume that the three sites represent three different stages of a possible evolution of the same SES, and thus can be considered as representative of the evolution of this SES in a time dynamic [42]. This assumption is confirmed by Oswald et al. [43], who compared the forest cover of the three study sites and its evolution in time.

2.1. Study Sites

The first study site, which consisted of three surrounding villages (108, 326 and 358 inhabitants, respectively), is located in northeastern Makokou district, Ogooué-Ivindo province and Gabon (Figure 2). The nearest city (Makokou) is located 2–3 hour away by road. It is characterized by a low population density (1.6 inhabitants/km2) and a forest cover that is scarcely disturbed by human activities, with the native forest (Native forest is the “climax forest type for a given region and environment” [43]) representing 94.13% of the village communal territory. The villagers’ incomes are generated mostly through the exploitation of natural resources, for example, slash and burn agriculture, hunting, fishing and gathering. The position of this site on Mather’s transition curve was confirmed by Oswald et al. [44]. The low population density, combined with a low agricultural dynamic, situates this site on the left of Mather’s curve (Figure 1).
The second study site consists of three villages (2454, 829 and 593 inhabitants, respectively), located in Mindourou district, in the East Region of Cameroon (Figure 2). One of these villages hosts the base camp of a Forest Stewardship Council-certified logging company. As described by Auzel [45], industrial forest sites are centers of attraction and concentration of local and non-native manpower, causing a higher population pressure. The population density is approximately 6.3 inhabitants/km2 and the forest cover represents 85.51% of the village communal territory. The forest communal territory is subjected to degradation through increased agricultural activities. The income level is higher than in Site 1 and depends mostly on salaries from the logging company [45]. Slash and burn agriculture is practiced to provide for family food needs. NTFP diversity and uses have been described in this region [21,46,47]. The forest cover located around the villages of this site is becoming degraded due to increases in population density and infrastructure as a result of activities of the logging company (roads, log yard and company buildings). As a consequence, this site has been placed at an intermediary position on the forest transition curve (Figure 1).
The third study site consists of two interconnected villages (1481 and 1103 inhabitants, respectively) in Bokito district, located 100 km north of Yaoundé (Cameroon capital city) in a densely populated area (65.1 inhabitants/km2) and at the interface between forest and savannah (Figure 2). Only 37.02% of the village communal territory is covered by a secondary forest (Secondary forests are forests regenerating through natural processes after disturbance of the original forest, with major difference in forest structure and/or composition [43]). The population is made up exclusively of Yambassa, a native ethno-linguistic group (classified A.62 by Guthrie [48] as part of the A.60 Sanaga group). Agriculture is the main source of income. Food products are sold in local marketplaces to traders from the capital city and to cocoa resellers. This area is characterized by a mosaic of agricultural land, with small patches of remnant forest. The current landscape dynamics consist of an increase in tree cover due to an expansion of cocoa agroforestry plantations in savannas [49]. This dynamic explains the position of this site in the last phase of the forest transition curve (Figure 1).

2.2. Data Collection

Reliable, up-to-date statistical data on population demography (such as density, number of households, population pyramid) were not available for the three study areas. To operationalize the investigations, a systematic census of households was carried out in each study village. Each permanent household (Permanent household means every household member spending the majority of his/her time in the village [51]) was asked about the gender, age, ethnicity and main activities of its members. This enabled us to estimate population density and determine a stratified sampling for the interviews.
We performed participatory mapping [52] to characterize and locate the activities performed by villagers. During this exercise, we paid attention to the contribution of every group (women, young and old people and minority ethnic groups). A spatial occupancy study was performed to localize hunting, fishing and gathering sites. For this, we collected GPS data while accompanying villagers in their daily activities (hunting, fishing and gathering). The study results were used to determine distances walked by villagers to collect NTFPs, or to hunt or fish.
To evaluate the proportion of NTFPs and bushmeat in villagers’ incomes, a survey was administered to households chosen according to a stratified sampling of the ethno-linguistic groups and the main source of household income [53] (results from the systematic census). Household members responded to interviews regarding the activities for which they were responsible, or participated in (mainly women and children for NTFP collection and men for bushmeat hunting). Interviews lasted about an hour and were conducted in French (all villagers from the study sites spoke fluent French). We interviewed 58 of the 135 family units in Makokou (43.0%), 97 of the 691 family units in Mindourou (14.0%) and 55 of the 450 family units in Bokito (12.1%), based on their representativeness in terms of ethnic groups and main activities. Households were selected so as to obtain a minimum of five households per type, based on 10 types differentiated by their main activities and ethnic groups. This method ensures a good representation of the situation in each site. For site comparisons we used averages per site, thus assigning each site with the same level of importance as the others. The “hunting bag” was determined by interviewing hunters about the number and the species of game they collected in the past year. We interviewed 16 of the 23 hunters (69.6%) in Site 1, 27 of the 169 hunters (16.0%) in Site 2 and 15 of the 98 hunters (15.3%) in Site 3. The most common way to investigate NTFP use is by summarizing annual practices without direct observations. These results can be extrapolated to a large number of households, but the data come from an estimation of the households, which can be biased [16]. Amborse-Oji [54] showed that households overestimate incomes, focusing on important amounts and neglecting small incomes spread over the year. For analysis, this bias was considered equivalent for every activity and was thus neglected.
The analysis of family incomes was based on in-depth interviews concerning the list of income-generating activities for the past year, including salaries, agricultural production, hunting, fishing and gathering. We further specified the products that were consumed or sold, as well as the selling prices of the different products.
We observed and quantified dietary intake during 21 days of the dry season for each village, according to the method developed by Rastoin and Ghersi [55] and used by Semeki Ngabi et al. [31]. For this study, 317 households were asked about the composition, origin and price of the components of their main meals (In the study sites, people eat twice a day. The main meal is the evening meal, in the morning they eat what is left from the day before). We then distinguished, for each food category (bushmeat, NTFPs, agricultural products, livestock products), both the amount that was actually spent and the amount that was spared as a result of the household’s own hunting, fishing, gathering or agricultural production activity. Prices were reported during the interviews and confirmed with prices charged in the village.

2.3. Data Analysis

To complete the comparison of accessibility between the three study sites, we considered the following for each study site: (i) the mean and maximum distance from the NTFP collection site perpendicular to the nearest road using the “Near” function in ArcMap 10; and (ii) the maximum distance to access 99% of the NTFP collection sites [56]. We used Welch’s test for equality of means in a one-way layout to test whether there was a site effect on mean distances, considering the non-homogeneity of variances. For incomes and hunting bag, we compared the obtained values with theoretical values under the hypothesis of independence of the two variables. We used Dunnett’s Modified Tukey-Kramer Pairwise Multiple Comparison Test to identify significant differences between sites. Chi-squared tests were performed to test whether incomes differed between sites and whether there was a relationship between site and hunting bag composition. To observe whether there was an under- or over-representation compared to a random distribution, we computed the contribution of each table cell to the chi-squared result. If the contribution was greater than twice the mean chi-squared value, we considered the difference to be significant (with p-value < 0.001) [57]. All analyses were performed using R software [58].

3. Results

3.1. Distance

NTFP collection and fishing and hunting places are spread over the entire village territory. Collection sites were found in the forest, along rivers, in fields and plantations or within the village. To allow a comparison of accessibility for the three study areas, we considered the mean and maximum perpendicular distances from the hunting, fishing and NTFP collection sites to the road (Table 1). The mean distance was significantly different between the three study sites (F = 123.6; p < 0.05). This difference can be explained by the relatives sizes of the village territories (57,591 ha in Site 2 compared to 3959 ha in Site 3) and a corresponding reduction in the area available per family unit (363 ha in Site 1 compared to 8.8 ha in Site 3). The maximum perpendicular distance from these sites to the road was greater in Site 2 than Site 1, probably due to the additional effort required to collect NTFPs when the pressure on the forest is higher [59] . In the third study site, this distance was much lower, which is likely related to the reduced village territory caused by high population density.

3.2. Family Incomes

The main income-generating activities are summarized in Table 2. In this table, “grocery” refers to the purchase of small agricultural products that are not produced in the villages, such as rice, oil or onions. The homogeneity hypothesis of the three distributions was rejected (χ2obs = 146,829 for χ20.05 = 26.30) because the differences in income-generating activities were highly significant between χ-tests (p < 0.001). In Makokou, income derived from forest activities (fishing, hunting and NTFP gathering) was greater than the theoretical income obtained under the hypothesis of independence of the two variables, but only fishing presented a significant difference. In Mindourou, income provided by salaries from the logging company was significantly greater than the theoretical income. Agriculture was significantly under-represented, unlike in Bokito, where agriculture was the main income and salaries were under-represented.

3.3. Bushmeat

The average annual number of prey captured per site, as reported by hunters, is between 92.8 (Makokou) and 116.2 (Mindourou) (Table 3). The hypothesis of homogeneity of bushmeat diversity in the three study sites was rejected (χ2obs = 144.57 for χ20.05 = 23.68) because the differences in number of species between sites were highly significant (p < 0.001). We used typology made by Fargeot to group bushmeat species according to their size and reproduction dynamics [60]. According to Delvingt et al. [47], the high proportion of blue duikers suggests that hunting pressure is relatively high, while the large proportion of medium-sized artiodactyls and the small proportion of rodents indicates that bushmeat was still abundant in Makokou. In Mindourou, the hunting bag was bigger, probably due to a higher demand from logging company workers [45]. The significant over-representation of manidae reflects the high hunting pressure [47]. The large number of primates demonstrates the use of guns (probably to compensate for a lack of game more sensitive to human pressure [47]). Bokito showed an almost total absence of forest animal species and a dominance of rodents, the majority of which were very small-sized species (rats and shrews).

3.4. Dietary Intake

The varying monetary amounts budgeted for bushmeat, farmed meat, fish from village fishing and sea fish from markets, NTFPs, and agricultural products grown in the village and those grown elsewhere (such as rice or onions) in the three study sites are summarized in Table 4. For each food category, a χ2-test was performed. The homogeneity hypothesis of the three distributions was rejected for bushmeat, farmed meat, NTFPs and agricultural products, showing a significant link between site and acquisition means (production or purchase). Specifically, the amount spent for agricultural products was significantly lower than the theoretical value, thus leading to a rejection of the hypothesis of independence of the two variables for Makokou, and for Mindourou the case was the opposite.
The abundance of anthropophilic species (such as rodents) in the bushmeat of Mindourou and Bokito demonstrates an overexploited hunting territory [47]. Although the quantity of blue duiker is high in Makokou (according to Fargeot [61], duikers represent the majority of bushmeat in Central Africa), the presence of other game species in the hunting bag reflects an area that has a more diversified bushmeat population compared with the other two study sites. The large average number of prey observed in Mindourou is probably linked to the high demand for bushmeat in study Site 2 [45].
Some villagers specialize in hunting as their only income-generating activity, leaving aside other activities of the production system. This strategy is confirmed by the sharing of revenues from hunting within hunters’ household incomes.
Bokito is an example of an overexploited hunting area: the number of prey remains high but comprises mainly small rodents, such as rats and shrews (illustrated in Figure 3). The animal protein in the dietary intake is mainly provided by farmed meat bought on the market.
In Makokou and Mindourou, the majority of animal protein consumed in the SES was linked to the exploitation of SES resources. In Bokito, production of consumed protein takes place at the periphery of the SES (for fish and farmed meat). This leads to a translocation of demand and pressures to other anthropized ecosystems. Deforestation has thus not only local consequences but also affects other near and far regions.

4. Discussion

Our first study site, Makokou, is an example of traditional livelihoods being sought in forested landscapes, where agricultural practices have not evolved in the past 30 years [44], and therefore can be considered a site with a low human impact on the forest cover. The second study site, Mindourou, which is characterized by the presence of a logging company, is a strong center of attraction for a large indigenous population but also for national migrants within Cameroon. Wages generated by the logging company have led to a sharp increase in purchasing power of the population, which has had a significant impact on the local economy [45]. The third study site, Bokito, is dominated by agriculture and has completely merged into a monetary economy, with main incomes generated through the sale of agricultural products.
Although urbanization is rapidly increasing in Central Africa [60], huge areas of forest remain, in which harvesting, hunting and fishing are—along with slash and burn agriculture—crucial to the production systems of rural communities [34]. Gillet et al. [62] demonstrated that the dynamic of agricultural expansion observed in their study led to a drastic reduction in the amount of land available for individual occupancy, which in turn led to the tightening of land tenure rules. This evolution eventually resulted in private land ownership and commercialization of this land in Bokito, in contrast to Makokou and Mindourou, where the majority of the land is common and not titled.
The average distance covered to access NTFP collection sites decreases with smaller village territories, which in turn is larger with the progression of forest transition. The higher maximum distance in Site 2 is likely related to the greater effort that villagers are willing to make in order to collect NTFPs and hunting and fishing products to sell to workers of the forestry company (illustrated in Figure 3) [45].
In rural forested areas of Central Africa, daily consumption of animal protein results mainly from hunting or, in some cases, fishing [33]. Livestock is a form of savings. Farmed animals can also be eaten on important occasions, such as weddings, or used for special purposes, such as dowries [29]. According to Bahuchet [35] and Delvingt et al. [47], medium-sized artiodactyls are mainly captured in the forest, unlike blue duiker, which are mainly hunted around villages. Our results show that the diversity of bushmeat decreases, and mainly comprises anthropophilic species such as rodents, with a decrease in forest cover. As a consequence, the role of hunting in the provision of animal protein in the diet decreases and is replaced by farmed meat bought in the market. In terms of household incomes, revenue from hunting activities decreases with progression of forest transition.
The composition of the diet changes from a dominance of protein derived from hunting and fishing (whether from family hunting and fishing or bought in the local market) to that of protein from livestock that can be produced within the household, but is often bought. NTFP harvesting follows a different trend: forest transition is reflected in a decrease in the average distance from collection site to habitat due to the smaller area of the village territory that is available for each family unit. The share of family income from the marketing of NTFPs was low [16] in the three study sites and decreased with forest transition. The consumption of these products is often complemented with agricultural products in the diet [63]. It is important to note that in Mindourou, a population with an ethnic mix and important purchasing power, some households specialize in collecting NTFPs or in hunting activity by walking long distances to practice their activity, with their income consequently resulting from that activity alone [21].
NTFP resources are generally managed in an unsustainable way [64]. This is mainly due to a combination of the large amounts collected and the lack of domestication of these products. Only 5% of plant NTFPs are cultivated [64]. Projects aiming to domesticate the main NTFPs have been conducted in Central Africa. Domestication of some tree species, such as Dacryodes edulis, Cola sp. or Raphia spp., has been achieved in South Cameroon and in Nigeria. The results of these projects reveal that these species are easily domesticated and are being planted in agroforestry systems [19,22]. On the contrary, and despite its economic importance and its non-sustainable harvesting in the field (it is one of the most common NTFPs in all three study sites), the successful domestication of Gnetum sp. has not been documented. Provenance tests and studies into the conditions required for such plantations are currently being carried out [65]. The farming of some game species that are highly appreciated by local populations, such as the brush-tailed porcupine (Atherurus africanus), is not efficient due to small litter sizes, although such animals can be easily raised in captivity [66]. Many authors have underlined the importance of NTFPs [20,21,46]. Public policies and donors have proposed projects focusing on NTFPs in Central Africa [16]. However, our results demonstrate that the importance of these products for local populations decreases with deforestation, which is specifically linked to population growth (as expected in most countries in Central Africa). Policies need to be adapted accordingly. Two options are emerging: abandoning this theme in deforested areas; or turning to programs oriented towards domestication and reforestation of priority NTFPs [19] within the framework of high-efficiency agroforestry systems.
A decrease in the quantity and diversity of captured game and harvested NTFPs with deforestation consequently leads to a decrease in overall food diversity, particularly if the increase in deforestation is not accompanied by an increase in agricultural production.

5. Conclusions

The objective of this study was to assess the co-evolution of forest transition and the harvesting of non-timber forest products (NTFPs) in Central Africa. Our results revealed that the maximum distance from collection site to the road is higher in Site 2 compared to Site 1 due to a lower availability of NTFPs; and that this distance is significantly lower in Site 3 due to a decrease in village territory size. Diversity in the composition of bushmeat decreases as game evolves from large to small species, commensurate with the progression of forest transition. As a consequence, the proportion of these products contributing to dietary intake and household cash income is reduced.
This analysis strongly suggests a link between a progression on the Mather’s forest transition curve and a decline in importance of NTFPs in village production and livelihoods. This study also demonstrated that the progression of the forest transition curve is linked to a reduction in the generation of hunting products. This subsequently results in a reduction in the contribution of these products to household incomes and to dietary intake, with a replacement of these products by agricultural and farmed products.

Acknowledgments

We are very grateful to Dakis-Yaoba Ouédraougo, Nikki Tagg and our co-authors for valuable discussion and comments. CoForTips is part of Biodiversa 2012 call for projects and is co-funded by ERA-Net Biodiversa with national donors: ANR (France, ANR-12-EBID-0002), BELSPO (Belgium) and FWF (Austria). We thank DACEFI project and the logging company Pallisco for their welcome and the villagers of the study villages for welcoming the research team and answering our interviews.

Author Contributions

Conceived and designed the interviews: Pauline Gillet, Cédric Vermeulen,; performed the data collection: Elisabet Codina, Charlotte Lehnebach and Pauline Gillet; Lead author: Pauline Gillet. The article was improved by the contributions of Laurène Feintrenie, Cédric Vermeulen and Jean-Louis Doucet at various stages of the analysis and writing process.

Conflicts of Interest

The authors declare no conflict of interest. The founding sponsors had no role in the design of the study; in the collection, analyses, or interpretation of data; in the writing of the manuscript, and in the decision to publish the results.

Abbreviations

The following abbreviations are used in this manuscript
FAOFood and Agriculture Organization
NTFPsNon-Timber Forest Products
FCFACentral African Franc

References

  1. Sanderson, E.; Jaiteh, M.; Levy, M.; Redford, K.; Wannebo, A.; Woolmer, G. The Human footprint and the Last of the Wild. BioScience 2002, 52. [Google Scholar] [CrossRef]
  2. De Wasseige, C.; Flynn, J.; Louppe, D.; Hiol Hiol, F.; Mayaux, P. Les Forêts du Bassin du Congo-État des Forêts 2013; Weyrich Édition: Neufchâteau, Belgique, 2014. [Google Scholar]
  3. Gillet, P.; Vermeulen, C.; Feintrenie, L.; Dessard, H.; Garcia, C. Quelles sont les causes de la déforestation dans le bassin du Congo? Synthèse bibliographique et études de cas. Biotechnol. Agron. Soc. Environ. 2016, in press. [Google Scholar]
  4. Mather, A.S. The forest transition. Area 1992, 24, 367–379. [Google Scholar]
  5. Barbier, E.; Burgess, J.; Grainger, A. The forest transition: Towards a more comprehensive theoretical framework. Land Use Policy 2010, 27, 98–107. [Google Scholar] [CrossRef]
  6. Angelsen, A. How do we set the reference levels for REDD payments. In Moving Ahead with REDD: Issues, Options and Implications; CIFOR: Bogor, Indonesia, 2008; pp. 53–64. [Google Scholar]
  7. Marten, G. Environmental tipping points: A new paradigm for restoring ecological security. J. Policy Stud. Jpn. 2005, 20, 75–87. [Google Scholar]
  8. Janssen, M.; Anderies, J.; Ostrom, E. Robustness of Social-Ecological Systems to Spatial and Temporal Variability. Soc. Nat. Resour. 2007, 20, 307–322. [Google Scholar] [CrossRef]
  9. Krausmann, F.; Fischer-Kowalski, M.; Schandl, H.; Eisenmenger, N. The Global Sociometabolic Transition: Past and Present Metabolic Profiles and Their Future Trajectories. J. Ind. Ecol. 2008, 12, 637–656. [Google Scholar] [CrossRef]
  10. Mather, A.S.; Needle, C.L. The forest transition: A theoretical basis. Area 1998, 30, 117–124. [Google Scholar] [CrossRef]
  11. Rudel, T.; Coomes, O.; Moran, E.; Achard, F.; Angelsen, Z.; Xu, J.; Lambin, E. Forest transitions: Towards a global understanding of land use change. Glob. Environ. Chang. 2005, 15, 23–31. [Google Scholar] [CrossRef]
  12. Rudel, T.; Bates, D.; Machinguiashi, R. A Tropical Forest Transition? Agricultural Change, Out-migration, and Secondary Forests in the Ecuadorian Amazon. Ann. Assoc. Am. Geogr. 2002, 92, 87–102. [Google Scholar] [CrossRef]
  13. FAO. Non-Wood Forest Products for Rural Income and Sustainable Forestry; FAO: Rome, Italy, 1995. [Google Scholar]
  14. Clark, L.E.; Sunderland, T.C. The Key Non-Timber Forest Products of Central Africa: State of the Knowledge; USAID: Washington, DC, USA, 2004. [Google Scholar]
  15. Vermeulen, C.; Doucet, J.-L. Conservation and sustainable use of non-timber forest products in favour of local communities within integrated forest management in Central Africa. Trop. For. Chang. Glob. Context R. Acad. Overseas Sci. Bruss. 2005, 267–280. [Google Scholar]
  16. Lescuyer, G. Importance économique des produits forestiers non ligneux dans quelques villages du Sud-Cameroun. Bois For. Trop. 2010, 304, 15–24. [Google Scholar]
  17. Yembi, P. A preliminary survey of the non-wood forest products of the Libreville markets (Gabon). In Non-Wood Forest Products of Central Africa: Current Research Issues and Prospects for Conservation and Development; CARPE-USAID-FAO: Washington, DC, USA, 1999; pp. 233–236. [Google Scholar]
  18. Laird, S.; Ingram, V.; Awono, A.; Ndoye, O.; Sunderland, T.; Lisinge, E.; Nkinkeu, R. Integrating Customary and Statutory Systems: The Struggle to Develop a Legal and Policy Framework for NTFPs in Cameroon. In Wild Product Governance: Finding Policies that Work for Non-Timber Forest Products; Laird, S.A., McLain, R., Wynberg, R.P., Eds.; Earthscan: London, UK, 2010; pp. 53–70. [Google Scholar]
  19. Ingram, V.; Ndoye, O.; Iponga, D.; Tieguhong, J.; Nasi, R. Les produits forestiers non ligneux: Contribution aux économies nationales et stratégies pour une gestion durable. In Etat des Forêts d’Afrique Centrale; Office des publications de l’Union européenne: Luxembourg, Luxembourg, 2011. [Google Scholar]
  20. Moupela, C.; Vermeulen, C.; Daïnou, K.; Doucet, J.-L. Le noisetier d’Afrique (Coula edulis Baill.). Un produit forestier non ligneux méconnu. BASE Biotecnol. Agron. Soc Environ. 2011, 15, 451–461. [Google Scholar]
  21. Vermeulen, C.; Fankap, R. Exploitation des palmiers et de Garcinia Kola pour la fabrication du vin de palme en pays Badjoué ou quand trop boire nuit à la santé... de l’écosystème. In La Forêt des Hommes-Terroirs Villageois en Forêt Tropicale Africaine; Les Presses agronomiques de Gembloux asbl: Gembloux, Belgique, 2001. [Google Scholar]
  22. Ayuk, E.T.; Duguma, B.; Franzel, S.; Kengue, J.; Mollet, M.; Tiki-Manga, T.; Zekeng, P. Uses, management, and economic potential of Dacryodes edulis (Burseraceae) in the Humid Lowlands of Cameroon. Econ. Bot. 1999, 53, 292–301. [Google Scholar] [CrossRef]
  23. David, O.L. Domestication and Commercialization of Non-Timber Forest Products in Agroforestry Systems. In Proceedings of An International Conference, Nairobi, Kenya, 19–23 February 1996; Non-Wood Forest Products. Food and Agriculture Organization of the United Nations: Rome, Italy, 1996. [Google Scholar]
  24. Kabuye, C. Socio-economic research and non-wood forest products: An overview. In Non-Wood Forest Products of Central Africa: Current Research Issues and Prospects for Conservation and Development; CARPE-USAID-FAO: Washington, DC, USA, 1999; pp. 111–115. [Google Scholar]
  25. Clark, L.; Sunderland, T. A regional market survey of the non-wood forest products traded in Central Africa. In Non-Wood Forest Products of Central Africa: Current Research Issues and Prospects for Conservation and Development; CARPE-USAID-FAO: Washington, DC, USA, 1999; pp. 207–210. [Google Scholar]
  26. Sunderland, T.; Obama, C. A preliminary market survey of the non-wood forest products of Equatorial Guinea. In Non-Wood Forest Products of Central Africa: Current Research Issues and Prospects for Conservation and Development; CARPE-USAID-FAO: Washington, DC, USA, 1999; pp. 211–220. [Google Scholar]
  27. Kimpouni, V. A preliminary market survey of the non-wood forest products traded in the Pointe-Noire Markets (COngo-Brazzaville). In Non-Wood Forest Products of Central Africa: Current Research Issues and Prospects for Conservation and Development; CARPE-USAID-FAO: Washington, DC, USA, 1999; pp. 221–226. [Google Scholar]
  28. Bauma, I.L. A preliminary market survey of the non-wood forest products of the Democratic Republic of Congo: The Beni and Kisangani markets. In Non-Wood Forest Products of Central Africa: Current Research Issues and Prospects for Conservation and Development; CARPE-USAID-FAO: Washington, DC, USA, 1999; pp. 227–231. [Google Scholar]
  29. Fargeot, C. La chasse commerciale en Afrique centrale I. La venaison ou le négoce d’un produit vivrier. Bois For. Trop. 2004, 4, 27–40. [Google Scholar]
  30. Tieguhong, J.C.; Ndoye, O.; Vantomme, P.; Zwolinski, J.; Masuch, J. S’adapter à la crise en Afrique centrale: Un rôle accru pour les produits forestiers non ligneux. Unasylva 2009, 223, 49–54. [Google Scholar]
  31. Semeki Ngabinzeke, J.; Belani Masamba, J.; Ntoto M’Vubu, R.; Vermeulen, C. Consommation de produits d’origine animale dans la concession forestière 039/11 de la SODEFOR à Oshwe (R.D. Congo). Tropicultura 2014, 32, 147–155. [Google Scholar]
  32. Puit, M.; Huart, A.; Leroy, P.; Njiakam Nsangou, I. Dynamique de la filière viande de brousse dans la partie continentale du Rio Muni en Guinée équatoriale. Tropicultura 2004, 22, 204–210. [Google Scholar]
  33. Van Vliet, N.; Nasi, R. Hunting for Livelihood in Northeast Gabon: Patterns, Evolution, and Sustainability. Available online: http://www.cifor.org/publications/pdf_files/articles/ANasi0803.pdf (assessed on 1 July 2008).
  34. Bahuchet, S. Les Systèmes de Production des Peuples Forestiers; Avenir des Peuples des Forêts Tropicales: Bruxelles, Belgium, 2000. [Google Scholar]
  35. Bahuchet, S. La filière “viande de brousse”. Peuples Forêts Trop. Aujourd’hui 2000, 2, 331–363. [Google Scholar]
  36. Mathot, L.; Doucet, J.-L. Méthode d’inventaire faunique pour le zonage des concession en forêt tropicale. Bois For. Trop. 2006, 1, 59–70. [Google Scholar]
  37. Inogwabini, B.-I. Fishes of the Salonga National Park, Democratic Republic of Congo: Survey and conservation issues. Oryx 2005, 39. [Google Scholar] [CrossRef]
  38. Abe’ele Mbanzo’o, P. la pêche traditionnelle badjoué: Appropriation d’une ressource mobile. In La Forêt des Hommes: Terroirs Villageois en Forêt Tropicale Africaine; Willy Delvingt: Gembloux, Belgium, 2001. [Google Scholar]
  39. Abe’ele Mbanzo’o, P. La Pêche Chez les Badjoué—Interaction Entre les Techniques, le Temps, les Terroirs et les Ressources Prélevées à Douma (Périphérie Nord de la Réserve de Faune du Dja. Est Cameroun); Projet Mise en place des forêts communautaires en périphérie nord de la réserve de faune du Dja: Yaoundé, Cameroun, 1998. [Google Scholar]
  40. Mather, A.S.; Fairbairn, J.; Needle, C.L. The course and drivers of the forest transition: The case of France. J. Rural Stud. 1999, 15, 65–90. [Google Scholar] [CrossRef]
  41. Gond, V.; Fayolle, A.; Pennec, A.; Cornu, G.; Mayaux, P.; Camberlin, P.; Doumenge, C.; Fauvet, N.; Gourlet-Fleury, S. Vegetation structure and greenness in Central Africa from Modis multi-temporal data. Philos. Trans. R. Soc. B Biol. Sci. 2013, 368. [Google Scholar] [CrossRef] [PubMed] [Green Version]
  42. Pickett, S.T.A. Space-for-Time Substitution as an Alternative to Long-Term Studies. In Long-Term Studies in Ecology; Springer New York: New York, NY, USA, 1989; pp. 110–135. [Google Scholar]
  43. Oswald, J.; Gond, V.; Tchiengué, B.; Nzigou Boucka, F.; Dallery, D.; Garcia, C. Description des Éléments Paysagers des Classifications D’occupation des sols CoForTips—Cameroun; CIRAD: Montpellier, France, 2015; p. 41. [Google Scholar]
  44. Chokkalingam, U.; De Jong, W. Secondary forest: A working definition and typology. Int. For. Rev. 2001, 3, 19–27. [Google Scholar]
  45. Auzel, P. Les villes en forêt: Impact de l’exploitation forestière sur la gestion coutumière des ressources naturelles. In La Forêt des Hommes—Terroirs Villageois en Forêt Tropicale Africaine; Willy Delvingt: Gembloux, Belgium, 2001. [Google Scholar]
  46. Fankap, R.; Doucet, J.-L.; Dethier, M. Valorisation des produits forestiers non ligneux en forêt communautaire. In La Forêt des Hommes: Terroirs Villageois en Forêt Tropicale Africaine; Willy Delvingt: Gembloux, Belgium, 2001; pp. 145–168. [Google Scholar]
  47. Delvingt, W.; Dethier, M.; Auzel, P.; Jeanmart, P. La chasse villageoise Badjoué, gestion coutumière durable ou pillage de la ressource gibier. In La Forêt des Hommes: Terroirs Villageois en Forêt Tropicale Africaine; Willy Delvingt: Gembloux, Belgium, 2001. [Google Scholar]
  48. Robinson, C. Phonologie du Gunu, Parler Yambassa: Langue Bantoue du Cameroun; Peeters Publishers: Leuven, Belgium, 1983. [Google Scholar]
  49. Yambene Bomono, H. Représentations et dynamiques foncières en zone de contact forêt-savane (pays yambassa) au Cameroun. Ph.D. Thesis, Université de Paris I et Université de Ngaoundéré, Paris, France, May 2012. [Google Scholar]
  50. Mayaux, P.; Bartholomé, E.; Fritz, S.; Belward, A. A new land-cover map of Africa for the year 2000. J. Biogeogr. 2004, 31, 861–877. [Google Scholar] [CrossRef]
  51. Vermeulen, C. Le facteur humain dans l’aménagement des espaces-ressources en Afrique centrale forestière: Application aux Badjoué de l’Est Cameroun. Ph.D. Thesis, Faculté Universitaire des Sciences Agronomiques de Gembloux, Gembloux, Belgium, January 2000. [Google Scholar]
  52. Larzillière, A.; Vermeulen, C.; Dubiez, E.; Yamba Yamba, T.; Diowo, S.; Mumbere, G. La maquette interactive, un outil novateur de participation. Bois For. Trop. 2013, 315, 21–28. [Google Scholar]
  53. Incomes from the Forest: Methods for the Development and Conservation of Forest Products for Local Communities; Wollenberg, E.; Ingles, A.; Center for International Forestry Research, International Union for Conservation of Nature and Natural Resources (Eds.) Center for International Forestry Research; World Conservation Union: Bogor, Indonesia, 1998.
  54. Ambrose-Oji, B. The contribution of NTFPs to the livelihoods of the “forest poor”: Evidence from the tropical forest zone of South-West Cameroon. Int. For. Rev. 2003, 5, 106–117. [Google Scholar] [CrossRef]
  55. Rastoin, J.-L.; Ghersi, G. Tendances et déterminants de la consommation alimentaire. In Le Système Alimentaire Mondial Concepts et Méthodes, Analyses et Dynamiques; Editions Quæ: Plouzané, France, 2010. [Google Scholar]
  56. Vermeulen, C.; Schippers, C.; Julve, C.; Ntoune, F.D.M.; Bracke, C.; Doucet, J.-L. Enjeux méthodologiques autour des produits forestiers non ligneux dans le cadre de la certification en Afrique centrale. Bois For. Trop. 2009, 300, 69–78. [Google Scholar]
  57. Saporta, G. Probabilités, Analyse des Données et Statistique; Editions TECHNIP: Ashland, OH, USA, 2006. [Google Scholar]
  58. R Core Team. R: A Language and Environment for Statistical Computing; R Foundation for Statistical Computing: Vienna, Austria, 2014. [Google Scholar]
  59. Gillet, P.; Gembloux Agro-Bio Tech, Gembloux, Belgium. Increase in distance from collecting sites to the road. Personal observation, 2013. [Google Scholar]
  60. Fargeot, C. La chasse commerciale en Afrique centrale: Une menace pour la biodiversité ou une activité économique durable?: Le cas de la république centrafricaine, Ph.D. Thesis, Université Paul Valéry-Montpellier III, Montpellier, France, December 2013. [Google Scholar]
  61. Fargeot, C. La chasse commerciale en Afrique centrale II. Une activité territoriale de rente. Bois For. Trop. 2005, 283, 65–80. [Google Scholar]
  62. Gillet, P.; Feintrenie, L.; Codina Llavinia, E.; Lehnebach, C.; Vermeulen, C. The effect of deforestation rate on land tenure in Central Africa. Available online: http://www.cofortips.org/content/download/4182/31836/version/1/file/Gillet_P_poster_maitrises.pdf (accessed on 23 March 2015).
  63. Feintrenie, L.; Gillet, P.; Garcia, C.; Boulaud, A.L.; Ferlay, A.; Codina Llavinia, E.; Lehnebach, C.; Vermeulen, C. Family farming in a changing landscape: How activities change when forest disappears. Available online: http://agritrop.cirad.fr/576010/2/document_576010.pdf (accessed on 23 March 2015).
  64. Ingram, V. Governance of non-timber forest products in the Congo Basin. Available online: http://hdl.handle.net/11245/1.373174 (assessed on 2 April 2012).
  65. Caspa, R.; Biloso, A.; Akalakou, C.; Mafolo, J.; Tsobeng, A.; Kouodiekong, L.; Tchoundjeu, Z. Nursery substrates and provenances influence rooting performance of juvenile, single-node vine cuttings of Gnetum africanum Welw. (Gnetaceae). Afr. Focus 2014, 27, 7–21. [Google Scholar]
  66. Edderai, D.; Houben, P. Elevage et performances de reproduction et de croissance de l’athérure africaine. Résultats sur l’étude de sa reproduction en captivité= Rearing, and reproduction and growth performances of the african brush-tailed porcupine. Study results on its reproduction in captivity= Cria y rendimiento de la reporduccion y del crecimiento del Atherurus africanus, roedor africano. Resultado sobre el estudio de su reproduccion en cautiverio. Rev. Délevage Méd. Vét. Pays Trop. 2002, 55, 313–320. [Google Scholar]
Figure 1. Forest transition curve and the approximate position of the three study sites.
Forests 07 00106 g001
Figure 2. Location of the three study sites. Map adapted from Mayaux et al. [50].
Forests 07 00106 g002
Figure 3. Illustration of the results: evolution of bushmeat diversity, maximal sampling distance, proportion of NTFP and bushmeat harvesting reflected in the income and in the dietary intake, at different stages along the forest transition curve.
Forests 07 00106 g003
Table 1. Number of hunting, fishing and NTFP collection sites, mean and maximal distances to access collection sites of NTFPs from the village center, mean village territory surface and mean surface per family unit in the three study sites.
Number of PointsMean Distance (m)Standard Deviation (m)Maximum Distance (m)Mean Village Territory Surface (ha)Mean Village Territory Surface per Family Unit (ha)
Site 1: Makokou10963040263211,80549,010363
Site 2: Mindourou10072218337121,80157,59183.3
Site 3: Bokito502747466239839598.8
Table 2. Distribution of average income per household between the main activities in FCFA (Central African Franc), in € (Euro) and in proportion (theoretical income under hypothesis of independence of the two variables).
Site 1: MakokouSite 2: MindourouSite 3: Bokito
AverageTheoreticalAverageTheoreticalAverageTheoretical
FCFA%FCFAFCFA%FCFAFCFA%FCFA
Agriculture236,70336140.6282,555365,222 *55725.7688,2511,016,720 *1,55076.0647,570
Fishing57,158 *879.812,10812,204190.929,504000.027,750
Hunting75,63011513.041,223155,20723710.9100,451531380.494,476
NTFP13,882212.49312369460.322,69235,771552.721,343
Livestock000.03018000.0735517,292261.36918
Grocery133,045 *20322.853,716157,79824111.1130,89416,875261.3123,108
Taxis000.016,35527,441421.939,85366,2501015.037,483
Salaries61,0359310.5144,188644,715 *98345.3351,354120,250 *1839.0330,457
Other6207101.121,18555,968853.951,62459,188904.448,553
* means that the difference between the theoretical and observed value is significant (p-value < 0.05).
Table 3. Number of prey per hunter, observed and theoretical, in the three study sites.
Site 1: MakokouSite2: MindourouSite3: Bokito
Observed%TheoreticalObserved%TheoreticalObserved%Theoretical
Medium-sized artiodactyls16.317.69.210.89.311.53.53.59.9
Blue duikers32.735.223.645.038.729.61 *1.025.5
Primates7.27.86.012.811.07.60.20.26.5
Rodents31.333.743.424.4 *21.054.288.5 *88.546.7
Manidae0.70.84.614.8 *12.75.80.00.05.0
Carnivores0.30.31.31.81.51.62.12.11.4
Birds4.44.72.71.00.93.43.53.52.9
Reptiles0.00.02.15.64.82.61.31.32.2
Total92.8116.2100
* means that the difference between the theoretical and observed value is significant (p-value < 0.05).
Table 4. Budget allocated for food in the three study sites in FCFA.
Site 1: MakokouSite 2: MindourouSite 3: Bokito
Amount SparedAmount SpentAmount SparedAmount SpentAmount SparedAmount Spent
Obs.%Exp.Obs.%Exp.Obs.%Exp.Obs.%Exp.Obs.%Exp.Obs.%Exp.χ2p-value
Bushmeat26.614.321.814.515.519.310.212.219.726.925.117.413.39.08.63.02.07.717.4280.0001
Farmed meat0.30.22.65.86.23.500.00.92.12.01.215.410.412.213.38.716.56.4860.039
Village fish20.811.219.428.230.129.56.88.18.514.513.512.83.72.53.34.73.15.10.7770.6781
Sea fish00.0020.922.420.900.007.06.67.000.0054.135.454.1nana
NTFP12.56.78.61.71.85.73.44.06.88.07.54.58.65.89.16.54.26.09.0760.0107
Agriculture126.267.7117.112.4 *13.221.563.075.671.021.1 *19.713.0106.872.3107.920.913.719.810.5710.0051
Other agricultural products00.0010.210.810.200.0027.625.727.600.0050.433.050.4nana
The different columns represent the observed (Obs.) and expected (Exp.) amounts of household budget effectively expended to buy food (amount spent) and the value of the products produced or harvested by the household (amount spared by production). * means that the difference between the expected and observed values is significant (p-value < 0.05). “na” stands for not available datas.

