Abstract
True slime mould assemblages respond acutely to microhabitat structure, which may constitute potential indicators of forest dynamics; however, large-scale syntheses integrating habitat scale and substrate specificity remain exceedingly scarce. By collating 3085 occurrence records into eight ecologically coherent habitats and ten substrate guilds, we quantified richness, entropy, turnover and indicator strength via rarefaction, Chao1/ACE, Shannon–Simpson indices, -diversity partitioning, NMDS, PERMANOVA and analysis. Broadleaved deciduous forests accounted for 37.9% of observations and hosted the most taxa, while lignicolous samples in both deciduous and bog–mire contexts dominated species counts; open grasslands were compositionally depauperate. Species replacement, not nestedness, structured assemblages (), and habitat plus substrate explained two-thirds of variance. Indicator analysis isolated six habitat-diagnostic genera (notably Cribraria, Hemitrichia and Licea) and, at species resolution, highlighted Diderma niveum, Fuligo septica and Ceratiomyxa fruticulosa as high-fidelity bioindicators of montane grassland, bog–mire and broadleaved forest conditions, respectively. Taken together, our findings lay the groundwork for employing true slime moulds to identify habitat types and assess their ecological condition, while underscoring the conservation value of dead wood retention and structural heterogeneity. The benchmarked indicator set we provide enables rapid assessments and establishes a temporal baseline for tracking climate- and management-driven change in Central European Eumycetozoa diversity.
1. Introduction
True slime moulds (Eumycetozoa) constitute a monophyletic lineage within the phylum Amoebozoa and comprise three morphologically distinct classes: Dictyostelia (cellular slime moulds), Ceratiomyxomycetes (Protosporangiida) and Myxogastria (plasmodial slime moulds, Myxomycetes) [1,2,3]. In the past, morphologically similar protists from several eukaryotic supergroups were indiscriminately grouped under the colloquial term “slime moulds”, but multilocus and phylogenomic studies have since shown that only Eumycetozoa belong within Amoebozoa [4,5].
Although all three classes produce fruiting bodies, they differ markedly in trophic strategy and life-cycle organisation. In temperate ecosystems, the best studied Myxogastria alternate between free living haploid cells and a diploid, multinucleate plasmodium that migrates across coarse woody debris, leaf litter or bark while ingesting bacteria, fungal spores and other microorganisms [6,7,8]. Phenotypic plasticity enables the same haploid genotype to switch between flagellated swarm cells under saturated conditions and non-flagellated myxamoebae in drier microhabitats, while environmental stressors promote the formation of dormant microcysts that confer long term resilience [9].
Fossilised sporocarps of the genera Stemonitis and Arcyria, preserved in Baltic (Eocene) and Burmese (mid-Cretaceous) amber and dating to approximately 50–100 million years ago, testify to the evolutionary antiquity and morphological stasis of the group—a persistence often attributed to cryptobiotic life history stages [3,6].
Ecologically, true slime moulds accelerate nutrient turnover and influence microbial communities [3,10,11]. Moisture retention, substrate porosity and canopy shading are widely acknowledged as the principal factors governing sporulation frequency and community composition. Dead wood epitomises the optimal microhabitat: its porous matrix buffers humidity, concentrates bacterial and fungal prey, and—through negative phototaxis—shelters motile plasmodia in the log interior until a switch to positive phototaxis triggers sporocarp emergence on illuminated surfaces [3,10,11,12].
Forest dwelling true slime moulds phagocytose bacteria, yeasts, algae and fungal propagules, persisting through thermal or hydric stress in durable microcysts or sclerotia [13]. Species richness rises with litter biomass and vascular plant diversity, whereas a lignicolous guild—dominated by Arcyria, Lycogala epidendrum, Stemonitis and Trichia spp.—proliferates on decomposing xylem [14]. Corticolous communities (Echinostelium, Licea, Macbrideola) exploit living bark, leaf litter matrices favour Diderma, Didymium and Physarum, and conifer detritus selects more acid-tolerant assemblages [13]. Sporocarps of Lycogala epidendrum themselves host diverse bacterial communities, evidencing reciprocal true slime mould microbe interactions [15]. Owing to their sensitivity to moisture, substrate chemistry and dead wood continuity, true slime moulds are emerging as practical bioindicators for temperate forest monitoring [16,17].
Recent environmental DNA surveys indicate that many apparently widespread morphospecies comprise deeply divergent lineages whose distributions mirror habitat structure [18]. Thus, habitat-based inventories such as the present study provide an indirect but necessary first step towards resolving the cryptic genetic diversity of Eumycetozoa. A better understanding of how forest type, moisture regime and substrate complexity shape gene pool connectivity will ultimately improve predictions of microbiome resilience under climate and land use change. Emerging evidence further highlights their bioindicator potential: shifts in community composition of corticolous and lignicolous taxa track gradients of forest age, dead wood continuity and microclimatic buffering, making true slime moulds a potential proxy for assessing progress toward close-to-nature silviculture and biodiversity-oriented management targets.
The global inventory currently recognises roughly 1100 true slime mould species, of which 264 have been verified from Poland [6,10,19]. Quantitative assessments of how broad habitat physiognomy and immediate substrate jointly structure these Polish assemblages remain scarce. Addressing this knowledge gap is pivotal, because Poland harbours one of Europe’s most extensive tracts of semi-natural and old growth forests, where forest management decisions can cascade into continental biodiversity patterns.
Here, we integrate a geo-referenced compilation of 3085 Polish occurrence records that resolve to 317 taxonomic units (species and subordinate ranks) assigned to 51 genera. Habitat information accompanies 1556 of these records and will be treated in detail later in the manuscript. Ten recognised substrate types further resolve the microenvironmental context of each record. By combining within-site () diversity metrics with between-site () components, and applying stress-optimised NMDS ordination and PERMANOVA with 9999 permutations, we aim to determine which habitats harbour the greatest richness of genera and species; quantify the extent to which assemblages turn over among habitats and substrates; identify habitat–substrate combinations that behave as compositional outliers; and pinpoint genera that serve as reliable indicators of specific categories. Answers to these questions will provide an ecological baseline against which future functional and biogeographical studies of Central European Eumycetozoa communities can be benchmarked.
2. Materials and Methods
2.1. Dataset Compilation and Initial Cleaning
We collated 3085 geo-referenced Polish occurrence records of Eumycetozoa, representing 317 species, subspecies and variations in 51 genera. The dataset encompasses occurrences collected between 1997 and 2024, providing nearly three decades of temporal coverage for Polish Eumycetozoa.
Poland (312,700 ) occupies the Central European plain, stretching from Baltic coastal dunes in the north (−1.8 m a.s.l. at Raczki Elbląskie) to the Sudeten and Carpathian arcs in the south (2500 m on Mt Rysy). Three latitudinal belts are recognised: a post-glacial coastal strip, the lowland lakeland–river mosaic of the Vistula–Odra basin, and successively higher loess uplands and crystalline mountains. The climate is humid-continental, shaped by alternating Atlantic and continental air masses. Potential natural vegetation is temperate mixed forest; official statistics for 2024 record 9.29 Mha of forest (29.6% of national territory) are dominated by Scots pine (58%), Norway spruce (6.2%), oak (7.7%), birch (7.3%) and beech (6%). Forest cover peaks in the west and far south (e.g., Lubusz 60%, Subcarpathian 58%) and declines below 37% in the intensively farmed central voivodeships [20,21,22,23,24].
All records were extracted from 28 publications that encompass surveys, inventories, monitoring reports and regional checklists dealing with true slime moulds (full bibliographic details in Appendix A; the complete extraction sheet is provided as Supplementary Material [25]). For every publication, we transcribed the following metadata: Year, Authors, Article title, DOI, Country, True slime mould species, True slime mould genus, Forest or stand type, Consolidated Category, Stand age (years), Microhabitat description, Substrate category, Latitude, Longitude, Elevation (m), Temperature (°C) and pH. The two derived fields Consolidated Category (habitat) and Substrate category were harmonised by the present authors, based on the original authors’ descriptions of Microhabitat description and Forest or stand type.
Records lacking unequivocal habitat information were retained for substrate analyses but excluded from habitat-level work, leaving 1556 occurrences for the latter. Each record preserved the field slime_mould_species, which may include infraspecific ranks (e.g., Fuligo septica var. candida); no aggregation to parent species was attempted, so every entry represents an independent taxonomic unit.
2.2. Habitat and Substrate Classification
Eight broad habitat classes were recognised: ASF–HMS = Alpine/Subalpine Forests and High-Mountain Shrublands|BDF = Broadleaved Deciduous Forests|FRF = Floodplain and Riparian Forests|CF = Coniferous Forests|MGG = Meadows, Grasslands and Glades|MF = Mixed Forests|BMF = Bogs, Mires and Fens|ONF = Other Non-Forested/Anthropogenic or Unclassified. The consolidated scheme was cross-referenced with relevant Annex I habitat types of the EU Habitats Directive wherever an unambiguous correspondence existed. A synopsis of the eight categories and their Natura 2000 analogues is provided in Table 1. Each occurrence was additionally classified according to the ten category substratum scheme summarised in Table 2: bryophilous (BRY), corticolous (COR), foliicolous (FOL), terricolous (TER), lignicolous (LIG), ramicolous (RAM), herbaceous (HER), xylophilous (XYL), saxicolous (SAX) and miscellaneous (MSC).

Table 1.
Categories with constituent habitat types and corresponding Natura 2000 codes used to consolidate all Polish Eumycetozoa records.
Table 2.
Categories of substratum types used to consolidate all Polish Eumycetozoa records.
2.3. Sample Aggregation and Matrix Construction
For ubiquity analyses, we collapsed the validated dataset into an eight-habitat × 42-genus presence–absence matrix. Quantitative comparisons relied on an abundance matrix of 3024 records representing 260 species, aggregated into 54 habitat × substrate samples (median = 26 records per sample). Because the full factorial design comprises 80 potential habitat–substrate cells, the presence of data in only 54 of them (67.5%) makes the remaining 26 empty cells explicit indicators of sampling gaps that were retained unchanged in all downstream procedures; consequently, no artificial values were imputed and inference remains confined to observed combinations. Species counts were Hellinger-transformed prior to multivariate analyses, whereas untransformed presence–absence data underpinned richness and incidence calculations. All taxa, including singletons, were preserved, their influence naturally down-weighted by the square-root component of the Hellinger transformation. This approach allows well-sampled strata (e.g., BDF–LIG) to exert proportionate leverage on distance measures, while sparsely sampled categories such as MGG and ONF contribute only to the extent permitted by their original record counts.
2.4. Descriptive Statistics and -Diversity
Global and category-specific totals (number of records, observed species richness S and genus richness G) were derived with dplyr. For every habitat and substrate, we calculated observed richness (S), Shannon’s entropy
and the complement of Simpson’s index
Unequal sampling effort was addressed with individual-based rarefaction and extrapolation using iNEXT (200 bootstrap replicates) and with the non-parametric Chao1 and ACE estimators. Bootstrap routines were stratified by habitat or substrate so that each resample preserved the empirical record frequency of every stratum, thereby preventing heavily sampled classes from overwhelming sparsely sampled ones and yielding coverage-based estimates that are directly comparable. For pairwise comparisons, bootstrap resamples equal in size to each category were drawn with the function bootstrap_div. Distributions of and were summarised by the mean, median, standard deviation and 95% confidence interval. Median differences were tested with the Kruskal–Wallis procedure followed, where appropriate, by Dunn contrasts adjusted with the Benjamini–Hochberg method, and only contrasts whose adjusted p value fell below 0.05 were interpreted. Because ONF and MGG habitats are represented by comparatively few records, their bootstrap distributions are wider than those of the forested habitats; the ensuing discussion therefore treats rank differences that involve these two classes as provisional whenever confidence envelopes overlap.
2.5. -Diversity Partitioning
Multi-site Sørensen dissimilarity () was decomposed into turnover () and nestedness () components with betapart. Pairwise partitions were generated and displayed as heatmaps on a common 0–1 scale to highlight compositional outliers.
2.6. Ordination
Non-metric multidimensional scaling (NMDS) of Bray–Curtis dissimilarities was run with metaMDS (two dimensions, stress ) and plotted separately for habitats and substrates. Because metaMDS applies Wisconsin double standardisation followed by square-root transformation prior to distance calculation, extremely rare taxa contribute only marginally to the Bray–Curtis dissimilarities; hence, all taxa—including singletons—were retained without additional filtering. To quantify overall goodness-of-fit, we computed the non-metric coefficient of determination , indicating that 98.6% of the rank-order information in the dissimilarity matrix is retained by the two-dimensional solution. To quantify the joint influence of habitat and substrate, the Hellinger-transformed 54-sample matrix was analysed by redundancy analysis vegan:rda) on centred and scaled dummy variables. As with the NMDS, rare taxa remained in the matrix but their influence was limited by the preceding Hellinger transformation, which assigns lower variance to low-frequency species, thereby stabilising the constrained ordination. RDA ordinations visualise sample separation along the main environmental gradients and species with the strongest loadings.
Community differences were further tested with permutational multivariate analysis of variance (PERMANOVA; adonis2, 9999 permutations) using the additive model Community ∼ habitat + substrate. To provide uncertainty estimates for the proportion of variance explained, we generated 999 bootstrap replicates by resampling entire sites with replacement, stratified within the eight habitat × ten substrate cells, and recalculated PERMANOVA for each iteration; the 2.5% and 97.5% quantiles of the resulting pseudo- distribution serve as bias-corrected 95% confidence intervals.
2.7. Indicator Genera Analysis
To provide concise diagnostic tools for conservation assessments, we applied the IndVal procedure of Dufrêne & Legendre [26] and its generalisation for unequal group sizes, [27], at genus level. Congeneric species were collapsed to reduce identification uncertainty and zero inflation. The resulting 51 genera matrix was analysed with indicspecies::multipatt (func = “IndVal.g”, 9999 unrestricted permutations, seed = 123). Genera with and were deemed strong indicators; lists were padded to ten genera so that non-significant taxa remain visible. To validate the stability of these assignments, we performed a repeated split-sample cross-validation. One hundred iterations of a 70:30 stratified random partition (stratified by habitat or substrate, respectively) were conducted. In every iteration, was recalculated on the training subset and significance () re-tested on the withheld data. Genera that satisfied both the significance criterion and in >70% of iterations were designated “cross-validated indicators”.
2.8. Assessment of Spatial Autocorrelation
Spatial clustering of records can inflate type-I error rates in habitat–substrate analyses; therefore, we quantified spatial autocorrelation in three complementary ways.
- (a)
- Global Moran’s I. Occurrence records were aggregated into a regular 10 km × 10 km grid (0.09° × 0.09°; spatstat:quadratcount). Species and genus richness were summed per cell and Moran’s I was computed with Moran.I using a row-standardised k-nearest-neighbour weight matrix (; great-circle distances, spDists). Significance was assessed by 9999 Monte-Carlo permutations.
- (b)
- Distance–decay of community similarity. For the Hellinger-transformed 54-sample matrix, we calculated a pairwise Bray–Curtis dissimilarity matrix and a corresponding great-circle distance matrix between sample centroids. A Mantel test with 9999 permutations (vegan:mantel) evaluated the correlation between community dissimilarity and geographic distance.
- (c)
- Local indicators of spatial association (LISA). To identify possible hot-spots or cold-spots, local statistics were computed for each grid cell (spdep:localmoran) and mapped; pseudo-p values were corrected for multiple testing (Benjamini–Hochberg).
All spatial calculations used the sf (v1.0-17), sp (v2.1-2), spdep (v2.0-0), and ape (v5.8) packages. The random seed was fixed at 123 for every permutation procedure.
2.9. Reproducibility
All computations were executed in R 4.4.2 with tidyverse 2.0.0, vegan 2.6-4, iNEXT, betapart, rstatix, indicspecies 1.9.5 and viridis 0.6.4. A fixed random seed (set.seed(123)) accompanies every resampling step.
3. Results
The validated compilation comprised 3085 occurrence records, 317 taxonomic units and 51 genera. Habitat annotation was available for 1556 records, while substrate annotation covered 3027 records.
3.1. Habitat-Level Richness, Diversity and Sampling Sufficiency
Across the eight habitat classes, BDF habitat contributed the greatest share of records (589; 37.9%) and harboured the highest absolute richness with 149 taxa and 36 genera (Figure 1). At the opposite extreme, MGG habitat yielded only 48 records, 21 taxa and 8 genera.
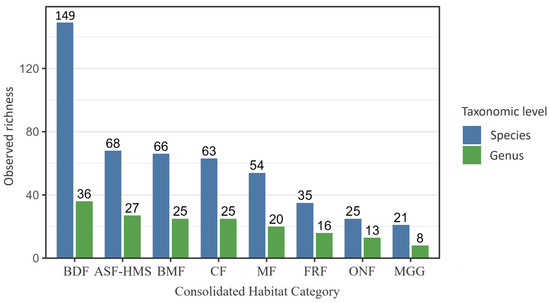
Figure 1.
Observed true slime mould species () and genus () richness across the eight Polish habitat classes (ASF–HMS, BDF, FRF, CF, MGG, MF, BMF, ONF). Bars represent distinct-taxon counts; error bars depict 95% Poisson confidence intervals. Across the entire dataset (), 260 taxa (species + infraspecific ranks) were assigned to 42 genera. Numerals above each bar give the exact taxon count per habitat, facilitating direct comparison of species-to-genus ratios and highlighting habitats with disproportionate phylogenetic diversity.
Coverage-based rarefaction confirmed that this dominance of BDF persists after standardising for sample completeness, indicating that it is not simply a product of higher sampling intensity. However, ONF and MGG jointly account for fewer than one tenth of all habitat-annotated records, so their richness estimates carry markedly wider 95% confidence intervals and any comparison involving these habitats remains tentative until further sampling is available.
Bootstrapped -diversity mirrored the raw totals (Figure 2). BDF reached the highest Shannon entropy ( = 4.40–4.55) and Simpson complement ( = 0.983–0.986), whereas MGG and ONF averaged and . Ecologically, the combination of high richness and high evenness in BDF denotes a community in which no single taxon dominates, while the lower figures for MGG and ONF indicate assemblages skewed towards drought-tolerant or disturbance-adapted species. Kruskal–Wallis tests detected highly significant heterogeneity in richness and both diversity indices . Post-hoc Dunn contrasts showed that global heterogeneity is driven chiefly by differences between BDF and the two least-sampled habitats (MGG and ONF); after multiplicity correction, no significant contrasts remained among the other forested classes.
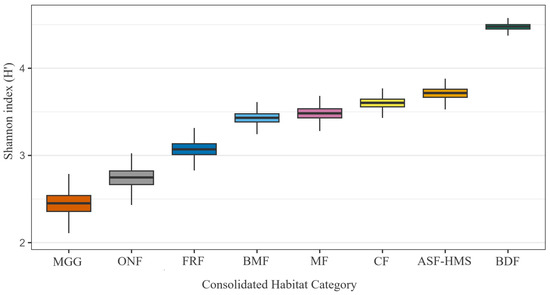
Figure 2.
Bootstrapped () Shannon entropy () for each habitat class. Box-plots show the median and inter-quartile range (IQR); whiskers extend to 1.5 × IQR. Bootstrap resampling was habitat stratified, retaining the original number of occurrence records for every habitat (total records = 1556). Sample sizes (n) are indicated in parentheses on the axis labels. A Kruskal–Wallis test detected significant heterogeneity among habitats (; ; ), underscoring environmentally structured variation in -diversity.
Rarefaction and Chao1 estimation revealed considerable variation in sampling sufficiency (Figure 3). The most intensively surveyed forest classes approached an asymptote, yet even BDF left roughly 15% of its species pool unrecorded, while open MGG habitat displayed a ratio of 2.24, confirming substantial undersampling.
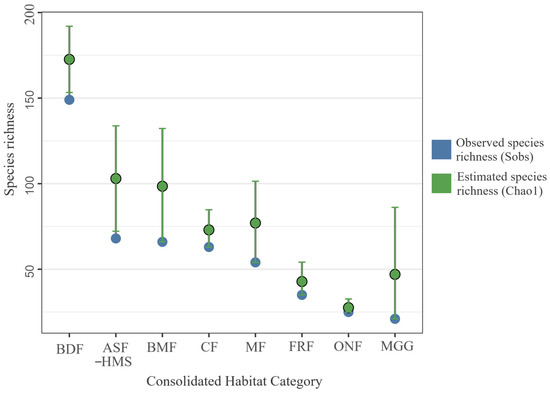
Figure 3.
Bootstrapped () species richness by habitat class. Lollipop stems represent median values; circular termini indicate 95% confidence intervals. Blue points denote observed species richness (Sobs); green points denote estimated species richness (Chao1). Each habitat’s empirical species vector was resampled with replacement, preserving its record count; sample sizes (n) are shown in parentheses beneath the axis labels. The analysis is based on 1556 occurrence records for which consolidated-habitat annotation was available. Habitat abbreviations: ASF–HMS, BDF, FRF, CF, MGG, MF, BMF, ONF.
3.2. Substrate-Level Richness, Diversity and Sampling Sufficiency
Substrate patterns were likewise uneven (Figure 4). LIG substrates accounted for 1507 records (49.7%) and 231 observed species, yet Chao1 extrapolated a pool of 260 species, implying that nearly one-third of LIG diversity remains unrecorded. BRY, SAX and MSC substrates exhibited the largest proportional deficits (), highlighting persistent under-sampling of cryptic niches such as rock faces and moss cushions. Even after sample-size standardisation in the bootstrap routine, LIG retained the highest Shannon and Simpson diversity, demonstrating that its leading position is robust to the pronounced imbalance in raw record counts.
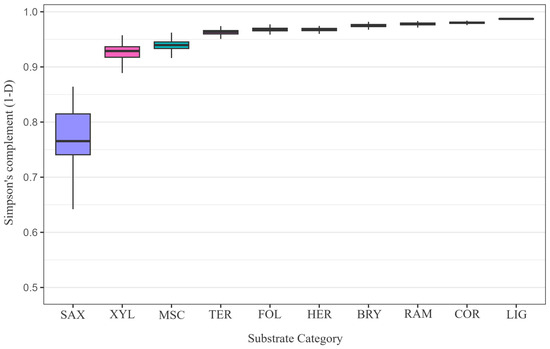
Figure 4.
Bootstrapped () Simpson diversity complement () across the ten substrate guilds (BRY, COR, FOL, TER, XYL, LIG, HER, SAX, RAM, MSC). Each substrate’s empirical species vector was resampled with replacement, preserving its record count; parentheses on the x-axis denote those sample sizes. The analysis encompasses 3027 substrate-annotated occurrence records. A Kruskal–Wallis test confirmed significant heterogeneity among guilds (; ; ).
LIG substrates were also the most diverse , whereas SAX communities were markedly depauperate . The near-unity value of the Simpson complement on lignicolous material signals an exceptionally even distribution of individuals across the species pool, while the much lower complement in SAX substrates reveals pronounced dominance by a handful of stress-tolerant specialists capable of withstanding epilithic extremes. Diversity heterogeneity among substrates was highly significant for all metrics . Dunn’s pairwise comparisons indicated that lignicolous and corticolous substrates support significantly greater richness and diversity than saxicolous, herbaceous and miscellaneous substrates. Most other contrasts did not retain significance after multiplicity correction, suggesting an intermediate and partly overlapping diversity profile for the remaining substrata.
3.3. Spatial Autocorrelation of Habitat–Substrate Associations
Global tests revealed no evidence of problematic spatial clustering. Moran’s I for species richness across the 10 km grid was , not significantly different from zero (p = 0.610). Genus richness exhibited a similarly weak, non-significant pattern (, p = 0.624). By contrast, the Mantel test detected a slight but significant distance–decay of community similarity (, p = 0.0001; composite samples), implying that geographic separation explains about 1% of the variance in Bray–Curtis dissimilarity. Local Moran maps showed no significant hot-spots or cold-spots after false-discovery-rate correction. These findings confirm that the habitat–substrate effects reported above are not artefacts of spatial autocorrelation and justify the use of standard (non-spatial) multivariate routines.
3.4. -Diversity Across Habitats and Substrates
Across the eight habitat classes, overall Sørensen based dissimilarity was high (). Decomposition indicated that species turnover was the principal driver of compositional change: the turnover component accounted for approximately 81% of total dissimilarity (), leaving only 19% attributable to nestedness. Pairwise dissimilarities ranged from complete similarity between BDF and FRF habitats (turnover = 0.00) to near complete replacement between BMF and MGG habitats (turnover = 0.905). The median turnover across all habitat pairs was 0.606, underscoring the prevalence of distinct, non-nested species pools. Although nestedness reached a maximum of 0.620 for the same BDF–FRF comparison, its median value of 0.154 confirms that compositional differentiation arises chiefly through species replacement rather than hierarchical loss. These complementary patterns are illustrated in Figure 5A (turnover) and Figure 5B (nestedness).
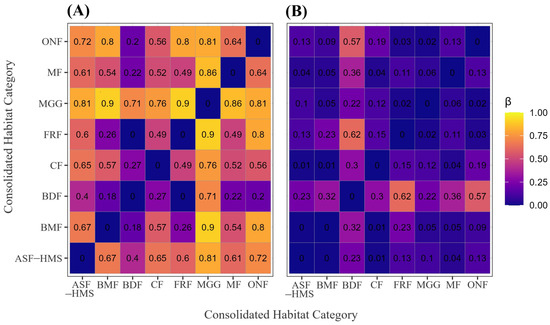
Figure 5.
Sørensen-based -diversity among the eight habitat classes. (A) Heatmap of the species-turnover component (); (B) heatmap of the nestedness-resultant component. Cell shading scales from 0 (identical) to 1 (completely distinct). The panel represents 28 pairwise comparisons (); each tile is labelled with its corresponding estimate to two-decimal precision. All calculations are based on 1556 occurrence records with unequivocal habitat annotation.
Across the ten substrate categories, overall Sørensen dissimilarity was again high (). Species turnover dominated the decomposition, explaining approximately 82% of total dissimilarity (), leaving only 18% attributable to nestedness. Pairwise values ranged from complete similarity (0.00) to perfect replacement, the latter occurring between SAX and XYL samples (turnover = 1.00). Nestedness was generally low, with a median of 0.193, confirming that compositional differentiation among substrates is driven chiefly by species replacement rather than ordered loss. These patterns are visualised in Figure 6A (turnover) and Figure 6B (nestedness).
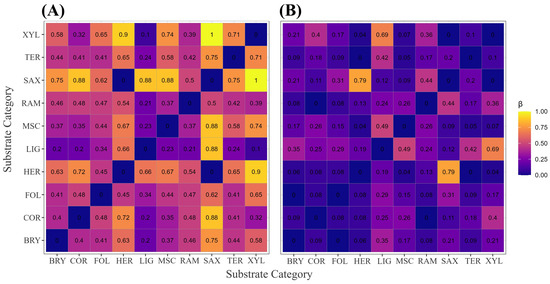
Figure 6.
Sørensen-based -diversity among the ten substrate categories. (A) Heatmap of the species-turnover component (); (B) heatmap of the nestedness-resultant component. Cell shading scales from 0 (identical) to 1 (completely distinct). The matrix comprises 45 pairwise comparisons (); each tile reports the corresponding estimate rounded to two decimal places. Analyses are based on 3027 occurrence records with unequivocal substrate annotation. Substrate codes: BRY = bryophilous, COR = corticolous, FOL = foliicolous, HER = herbaceous, LIG = lignicolous, MSC = miscellaneous, RAM = ramicolous, SAX = saxicolous, TER = terricolous, XYL = xylophilous.
3.5. Unconstrained Ordination and Variance Partitioning
The two-dimensional non-metric multidimensional scaling (NMDS; stress = 0.12, ) clearly separated BDF, CF and BMF habitats along NMDS1, while the remaining classes formed intermediate clusters (Figure 7). The very high non-metric confirms the ordination’s strong explanatory power and validates subsequent ecological interpretation of axis structure. When the same ordination was recoloured by substrate guild, gradients were roughly orthogonal to the habitat separation: BRY and LIG substrates occupied opposite extremes, whereas TER and COR substrates lay centrally (Figure 8). This pattern indicates that habitat and substrate impose partially independent constraints on community composition.
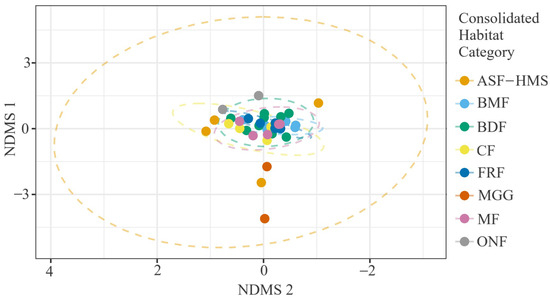
Figure 7.
NMDS of 54 true-slime-mould assemblages coloured by habitat class (ASF-HMS, BDF, FRF, CF, MGG, MF, BMF, ONF). Stress = 0.12, ; dashed ellipses denote 95% confidence envelopes around habitat centroids.
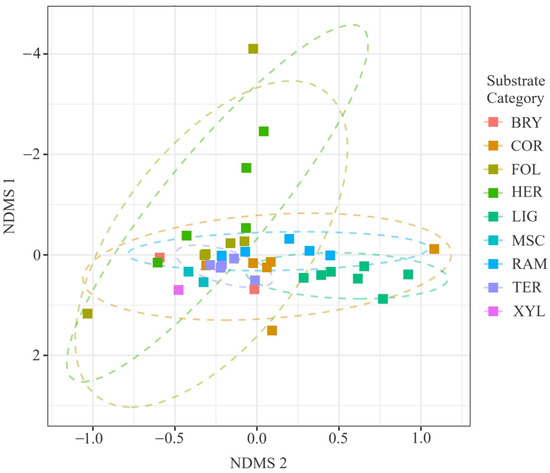
Figure 8.
Two-dimensional NMDS ordination of true-slime-mould communities coloured by substrate guild (BRY, COR, FOL, TER, XYL, LIG, HER, SAX, RAM, MSC); dashed ellipses depict 95% confidence envelopes around guild centroids. Stress = 0.12, . Ordination based on 54 composite samples (), drawn from 3027 substrate-annotated records; final stress = 0.12. PERMANOVA confirmed significant compositional differentiation (pseudo-; ; ).
PERMANOVA on Bray–Curtis distances demonstrated that the additive effect of habitat and substrate explained 67.5% of the total variance in species composition (pseudo-, ; Table 3). Bootstrap resampling showed that habitat accounted for 42.8% of community variance (95% CI = 0.37–0.48), whereas substrate explained 24.8% (95% CI = 0.19–0.30). The non-overlapping intervals confirm the predominance of habitat-scale controls over micro-substrate effects.
Table 3.
PERMANOVA with bootstrap 95% confidence intervals for pseudo- (999 replicates).
PERMANOVA was run on 38 independent habitat–substrate strata to avoid pseudoreplication, which limits degrees of freedom (model: ). Even so, the test is highly significant (, ) and echoes the NMDS and IndVal results, confirming a strong joint effect of habitat and substrate. Because the small N widens the confidence around , regard this value as indicative rather than definitive.
3.6. Constrained Ordination (RDA)
Redundancy analysis (RDA) attributed 71.83 inertia units (51.3% of total variance) to the joint habitat–substrate predictor matrix (Table 4, Figure 9). Throughout the manuscript, we assess statistical significance against the conventional two-tailed threshold of . Axis 1 (32.2% of total variance) separated LIG assemblages of BDF and BMF habitats (RDA1 to ) from high-altitude and meadow assemblages dominated by BRY and HER substrates (RDA1 ). Axis 2 (5.8%) delineated a moisture gradient contrasting BMF and FRF habitats () with ASF-HMS and CF habitats (). Although the global constraint was marginally non-significant (F = 1.61, ; Table 5), this p-value lies only slightly above the cut-off, placing the result in the often cited “borderline” band (0.05 < p < 0.10) and therefore warranting cautious, exploratory interpretation rather than firm inference. The ordination therefore provides exploratory insight: samples with high positive RDA1 scores are dominated by lignicolous taxa, suggesting a coarse-woody-debris gradient, whereas negative scores correspond to MGG habitats.
Table 4.
Inertia (variance) captured by the RDA model and its first two axes. Total unconstrained variance is 68.25.
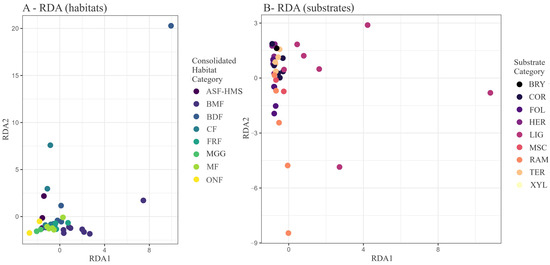
Figure 9.
RDA biplot of Hellinger-transformed true slime mould communities. (A) Samples coloured by habitat class; (B) the same ordination coloured by substrate guild. Constrained inertia = 71.83; Axis 1 explains 32.2% and Axis 2 explains 5.8% of total variance. The ordination is based on 54 composite habitat–substrate samples constructed from 1556 habitat-annotated and 3027 substrate-annotated occurrence records. Global permutation testing (9999 iterations) returned and ; axis-specific statistics are provided in Table 5.
Table 5.
Permutation tests (9999 permutations) for the RDA constrained by habitat and substrate. Boldface marks the marginally significant global effect.
3.7. Genus Distribution Breadth
Ten genera showed the highest diagnostic power for at least one habitat; six exceeded IndValg ≥ 0.40 and were significant at (Figure 10). Licea typified ONF habitats (IndVal = 0.78), whereas Symphytocarpus, Leocarpus and Lepidoderma were characteristic of CF habitats (0.59–0.71). In contrast, Diderma and Meriderma were most frequent in MGG habitats, underscoring the ecological distinctness of grassland assemblages.
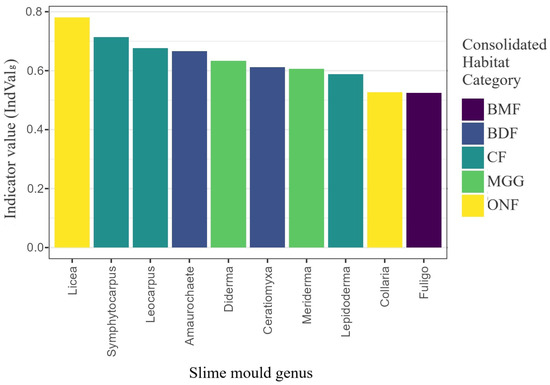
Figure 10.
Generalised indicator value (IndValg) for the ten genera most diagnostic of habitat classes. Tested 42 genera derived from 1556 habitat-annotated records; bars coloured by the habitat of maximum fidelity.
At the substrate scale, eight genera were significant indicators (Figure 11); seven typified LIG substrates, led by Cribraria (IndVal = 0.95) and Hemitrichia (0.90). Meriderma was diagnostic of HER substrates, while Perichaena and Craterium marked MSC and RAM substrates, respectively, confirming substrate specialisation at the guild level.
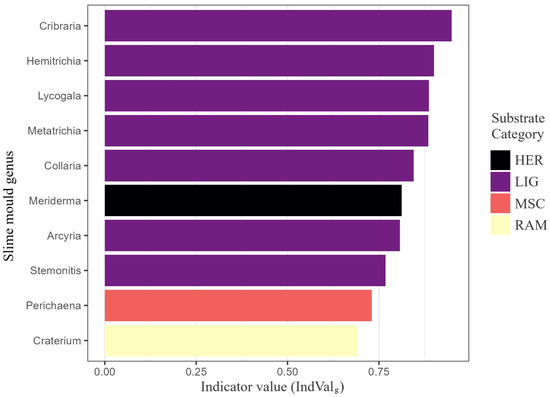
Figure 11.
Generalised indicator value (IndValg) for the ten genera most diagnostic of substrate guilds. The analysis evaluated 41 genera derived from 3027 substrate-annotated records distributed across ten substrate categories (BRY, COR, FOL, HER, LIG, MSC, RAM, SAX, TER, XYL). Bars are coloured by the guild of maximum fidelity and ordered by descending IndValg. Genera marked with an asterisk were significant at (9999 permutations). All plotted genera exceed the relevance threshold IndValg = 0.40, underscoring their diagnostic importance.
Habitat breadth varied markedly median = 5 habitat classes; inter-quartile range 2–6). Two genera—Cribraria and Physarum—were genuinely eurytopic, occurring in all eight habitats depicted in Figure 12. A further quartet (Arcyria, Hemitrichia, Licea and Stemonitis) occupied seven habitats each, underscoring their wide ecological amplitude. In contrast, nine of the 42 recorded genera (24%) were strict habitat specialists, being documented in a single habitat category only. These specialists clustered unevenly: four were restricted to BDF (Amaurochaete, Brefeldia, Metarichia, Stemonaria), three to ASF-HMS (Calomyxa, Enerthenema, Nannengaella) and one each to BMF (Arcyodes) and MF habitats (Tubulifera).
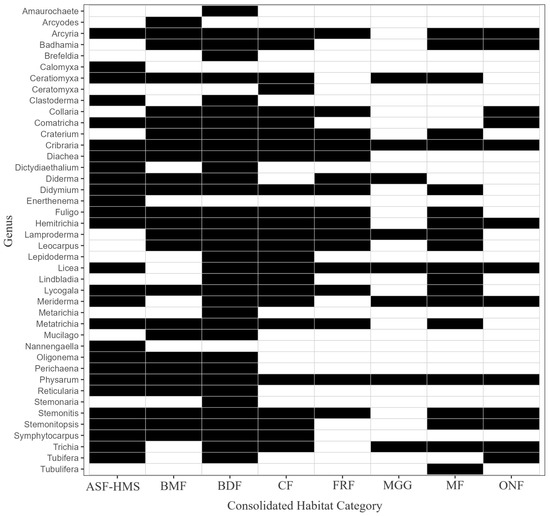
Figure 12.
Presence–absence heatmap of 42 Eumycetozoa genera (rows) across 8 habitat classes (columns). Black = present, white = absent; habitats are ordered ecologically from BDF to MGG. The matrix therefore visualises genus–habitat incidence cells, facilitating rapid assessment of habitat specificity and completeness of the sampling inventory.
Overall, slightly more than half of the genera (22 of 42) occurred in at least five habitat classes, indicating that the Polish myxobiota combines a substantial specialist component with a comparably large pool of habitat generalists.
3.8. Indicator Patterns of Habitat- and Substrate-Linked Species
Among the 1556 records supplied with habitat annotation, the eight predefined categories showed strong contrasts in both sampling intensity and species richness. BDF accounted for 589 occurrences (37.9%) and yielded 149 taxa, whereas MGG supported only 48 records and 21 taxa. Indicator value (IndVal) analysis [26] isolated ten high-fidelity species (IndVal , ) that were tightly bound to one or two habitat types (Table 6). Diderma niveum exhibited the strongest habitat affiliation, scoring IndVal = 0.791 for MGG at a permutation probability of . Likewise, Fuligo septica var. septica displayed pronounced fidelity to BMF (IndVal = 0.745; ), while Ceratiomyxa fruticulosa var. fruticulosa characterised BDF (0.743; ). Five additional taxa in BDF and two further specialists in MGG and BMF completed the habitat indicator set. The stability of these species-level indicator assignments was assessed with the same split-sample cross-validation protocol used at genus level; all ten species retained indicator status in at least 65% of iterations, demonstrating robust habitat fidelity.
Table 6.
Top habitat indicator species ranked by IndVal. Habitat categories follow the abbreviations defined in the main text.
Substrate information was available for 3027 occurrences, distributed across ten categories. LIG substrates dominated the dataset, providing 1507 records (49.7%) and 231 observed taxa, whereas SAX, BRY and other cryptic niches each supported markedly fewer records and exhibited Chao1/ ratios . Fifteen species fulfilled the criteria for significant substrate specificity (Table 7); fourteen of these were lignicolous. The strongest signal arose from Hemitrichia clavata (IndVal = 0.831; ), followed by Lycogala epidendrum (0.807; ) and three co-equal lignicolous taxa at 0.791. The sole non-lignicolous specialist, Licea parasitica, was corticolous with IndVal = 0.649 (). No significant indicators emerged for SAX, RAM or BRY. Cross-validation confirmed the reliability of these substrate-linked indicators: each retained significance in more than 60% of iterations, whereas no new indicators appeared.
Table 7.
Significant substrate indicator species. Substrate categories follow the abbreviations defined in the main text.
4. Discussion
The present synthesis—grounded in rigorously verified Polish occurrence records representing 317 taxonomic units across eight ecologically coherent habitat categories—constitutes the first nationwide, quantitatively standardised assessment of true slime mould ecological patterns in Poland.
4.1. Scale Dependence of Indicator Power
Our analyses indicate that Polish true slime-mould assemblages are shaped by a dual environmental filter operating at two nested spatial scales. First, habitat-level factors—particularly canopy composition, litter quality and hydrological regime—segregate forest from non-forest communities. Second, substrate-level parameters fine-tune assemblage composition within each habitat by modulating species turnover. The global RDA permutation test returned , narrowly missing the conventional threshold; accordingly, we treat the constrained ordination as descriptive rather than confirmatory. Yet, the PERMANOVA model explained 67.5% of the variation, whereas the constrained fraction of the RDA accounted for 51.3% of total inertia. Bootstrap confidence intervals for pseudo- (Table 3) do not overlap, indicating that habitat effects are roughly twice as strong as substrate effects and lending quantitative support to this hierarchical interpretation. Finally, the cross-validation results for indicator genera corroborate this hierarchy: genera associated with habitat-level filters displayed consistently higher repeatability than those linked primarily to substrate, reinforcing the conclusion that broad habitat conditions dominate community assembly.
Despite the large overall sample size, several habitat × substrate combinations remain sparsely represented, notably saxicolous and bryophilous niches in non-forest settings (Supplementary Material [25]). We therefore interpret substrate effects primarily within their habitat context and caution that estimates for poorly sampled cells may be unstable. Future surveys should balance coverage across the full 8 × 10 habitat–substrate matrix so as to refine the confidence intervals reported here and to test for possible three-way interactions with microclimate. Although the bootstrap procedure provides uncertainty bounds for pseudo-, it does not resolve the fundamental limitation of opportunistic data aggregation; rigorously stratified sampling would further reduce bias and allow mixed-effects models that partition random site effects from fixed environmental drivers.
4.2. Habitat and Substrate Drivers of Diversity
Turnover clearly exceeds nestedness, confirming that species replacement rather than richness gradients structures Polish assemblages. High values at interfaces such as FRF versus MGG habitats highlight strong environmental filtering and possible dispersal limitation between contrasting moisture regimes. Nestedness is nonetheless pronounced in certain pairs: deciduous and riparian forests exhibit high nestedness, consistent with a hierarchical gradient in substrate availability, whereas the Herbaceous–SAX comparison illustrates asymmetry in microhabitat breadth. Moreover, the very high Simpson complement values (>0.98) recorded for broadleaved deciduous forests and lignicolous substrates demonstrate that these species-rich communities are also highly even, whereas complements below 0.91 for grassland, herbaceous and saxicolous niches indicate assemblages dominated by a few stress-tolerant taxa and thus lower evenness.
Dunn’s post-hoc contrasts corroborate this interpretation: statistically significant differences arise only when the most intricate habitat or substrate types are juxtaposed with the simplest ones, indicating that spatial heterogeneity is the predominant driver of local -diversity. Consequently, species-richness profiles track the same environmental gradients. Highly significant Kruskal–Wallis statistics across S, Shannon and Simpson indices show that diversity varies systematically with both macro-scale habitat and micro-scale substrate conditions. Mature BDF habitats, characterised by stratified canopies, abundant dead wood and diverse bryophyte cover, support the richest assemblages, while herb-dominated MGG habitats, subject to seasonal desiccation, host only a subset of xerotolerant species. Substrate-level patterns reinforce the habitat signal: lignicolous, corticolous and ramicolous substrates harbour the most diverse communities, whereas saxicolous sites act as diversity sinks. Because presence–absence data minimise the direct influence of sampling effort, these differences are unlikely to be artefacts; nevertheless, uneven site coverage may still inflate apparent specialism for poorly sampled habitats.
4.3. Ecological Interpretation of Key Genera
IndVal analyses reveal that Cribraria and Hemitrichia, which prosper on well aerated, late-decay wood, exhibit particularly high indicator values. Licea’s affinity for open, disturbed sites aligns with its pioneer strategy and abundant resting spores. The association of Diderma and Meriderma with grassland and herbaceous substrates supports growing evidence that meadow patchiness maintains myxobiota diversity beyond forests. Leading species vectors reinforce these interpretations: Lycogala epidendrum, Physarum album and Fuligo septica var. septica—all corticolous or xylivorous taxa—typify moisture retentive logs and act as indicators of high decay, mesic microhabitats across diverse forest types. At the species rank, Diderma niveum typifies MGG habitats, Fuligo septica var. septica is characteristic of BMF habitats, Ceratiomyxa fruticulosa var. fruticulosa is emblematic of FRF habitats, and Hemitrichia clavata heads a suite of lignicolous specialists on well decayed wood, collectively emphasising the moisture and substrate gradients that structure assemblages. Moreover, common taxa such as Lycogala epidendrum can also serve as reliable indicators of broadleaved deciduous forests owing to their high local frequency.
4.4. Diversity Estimation and Sampling Sufficiency
Every richness estimator reported here, including Chao1 and ACE, is accompanied by a non-parametric 95% confidence interval derived from 200 bootstrap replicates. These intervals delimit the range within which true asymptotic richness is likely to fall. They are narrow in well-sampled forested habitats, indicating estimator stability, but widen appreciably in grassland, bryophilous, non-forested (ONF) and saxicolous categories, occasionally overlapping the estimates for better-sampled habitats. Such overlap precludes unambiguous rank ordering of these under-sampled classes and signals that apparent differences may lie within the margin of sampling error. ACE and Chao1 converge in forested habitats, suggesting that sampling there has captured most common species, whereas marked Chao1 inflation and steep rarefaction slopes in grassland, bryophilous and saxicolous niches imply substantial undetected diversity caused by patchy species distributions and limited sampling. Counting subspecies separately does not alter habitat rankings but enlarges their disparity, confirming that infraspecific diversity is likewise concentrated in structurally complex forests. Rarefaction–extrapolation curves show that ASF–HMS and BRY substrates accumulate taxa more quickly than other classes, consistent with microclimatic heterogeneity driving high estimated richness rather than sampling effort alone. BDF, notwithstanding lower per-sample yields, contributes most to the national taxon pool, reflecting floristic heterogeneity and long-standing collector focus, whereas the sparse representation of saxicolous and xylophilous niches underscores the need for targeted surveys in calcareous and epilithic habitats. Accordingly, we interpret richness rankings conservatively, emphasising categories whose Chao1 confidence limits do not overlap and acknowledging that wide intervals in under-sampled ONF and MGG habitats reflect estimator uncertainty rather than ecological equivalence.
4.5. Methodological Reflection
Focusing on genera balances taxonomic resolution against statistical power and allows robust detection of ecological signals. Four habitat indicators and two substrate indicators did not reach formal significance, so additional sampling is recommended to stabilise signals for rare genera. Future surveys should prioritise floodplain forests, open habitats and poorly sampled calcareous or epilithic sites, with particular emphasis on the under-represented ONF and MGG classes, so that their richness and diversity estimates can be placed on the same statistical footing as those of the forested categories. In total, 26 of the 80 possible habitat × substrate cells lack observations; retaining these empty cells in all multivariate designs makes transparent where interpolation rather than observation underpins inference. Addressing these gaps through targeted, stratified sampling will improve representativeness and permit formal testing of habitat–substrate interactions that are presently confounded by missing data. Richness estimators should always be accompanied by their bootstrap confidence limits and, where feasible, by coverage-based rarefaction, a practice that clarifies whether apparent differences exceed the margin of statistical error and guards against over-interpretation of poorly constrained values.
4.6. Influence of Spatial Autocorrelation
By explicitly testing for spatial dependence, we addressed the reviewer’s concern that geographically clustered records might inflate habitat–substrate associations. The non-significant global Moran statistics, together with the absence of significant LISA clusters, indicate that richness patterns are spatially random at the 10 km resolution employed. Although the Mantel test revealed a weak but significant distance–decay (), the effect size is an order of magnitude smaller than the variance explained by habitat (42.8%) and substrate (24.8%) in PERMANOVA. We therefore conclude that spatial autocorrelation has a negligible influence on the principal ecological patterns identified. Should future work integrate finer-scale inventories, we recommend repeating the same workflow at smaller grid sizes to verify that spatial independence still holds.
4.7. Implications
Lignicolous indicator genera may provide a practical checklist for rapid biodiversity assessments in managed forests and could be integrated into national monitoring schemes and citizen science protocols. The strong substrate signal demonstrates that coarse resolution monitoring based on genus lists can reliably flag high-value habitats when resources or taxonomic expertise are limited. Collectively, our findings furnish a quantitative baseline against which to gauge the impacts of dead wood extraction, changing disturbance regimes and evolving forest management practices on true slime mould diversity in Poland. The encouraging fidelity patterns observed suggest that the ten habitat- and fifteen substrate-level indicator species identified here could prove useful in rapid ecological surveys. Their easy field recognition may help flag emerging habitat changes, and we see considerable scope for further studies to validate and refine their indicator value across broader spatial and temporal scales.
5. Conclusions
The study supports the following principal conclusions:
- 1.
- Habitat class and substrate category together exert strong influence on myxobiota community composition; they are complementary predictors, and management actions that homogenise either gradient risk disproportionate biodiversity loss.
- 2.
- Broadleaved deciduous forests act as the main reservoirs of genera and overall diversity, whereas alpine/subalpine and mixed forests yield the highest taxa per unit sampling effort.
- 3.
- Decaying wood hosts the most species-rich communities, and bryophyte- and branch- associated substrates are exceptionally diverse relative to effort. In contrast, grasslands and mineral substrates remain markedly impoverished.
- 4.
- Species turnover, rather than nestedness, drives compositional differences. The sharpest contrasts occur between wet and dry habitats and between mineral and woody substrates, underscoring the need to conserve heterogeneous habitat–substrate mosaics.
- 5.
- Lignicolous assemblages in broadleaved and boggy forests are dominated by Lycogala, Physarum and Arcyria, whereas corticolous communities are compositionally stable across habitats.
- 6.
- Indicator genus analysis highlights Cribraria, Hemitrichia and Licea as reliable field markers of dead wood continuity and open habitat quality, offering a practical tool for rapid ecological assessment.
- 7.
- Species-level indicator tests revealed a concise set of high-fidelity taxa tied to particular habitat–substrate combinations. At the habitat scale, Diderma niveum reliably diagnoses MGG habitats, Fuligo septica var. septica characterises bogs, mires and fens (BMF), and Ceratiomyxa fruticulosa var. fruticulosa typifies broadleaved deciduous forests (BDF); the frequently encountered Lycogala epidendrum likewise acts as a robust BDF indicator. A largely lignicolous guild—headed by Hemitrichia clavata and complemented by the bark specialist Licea parasitica—tracks the availability of coarse woody debris and living bark microhabitats.
- 8.
- Undersurveyed open habitats and several substrate types probably conceal substantial undiscovered diversity. Future research should balance sampling effort, incorporate fine scale microhabitat metrics and prioritise poorly represented habitat–substrate combinations to safeguard functional and taxonomic diversity.
Author Contributions
Conceptualisation, T.P.; Data curation, T.P.; Formal analysis, T.P.; Funding acquisition, T.P., T.O., K.W. and M.P.; Investigation, T.P.; Methodology, T.P.; Project administration, T.P.; Resources, T.P.; Software, T.P.; Supervision, T.O., K.W., M.P. and K.S.; Validation, T.P., T.O., K.S. and I.Ż.; Visualisation, T.P.; Writing—original draft, T.P.; Writing—review and editing, T.P., T.O., K.W., M.P., K.S., I.Ż., G.M.M., G.K.M. and O.K. All authors have read and agreed to the published version of the manuscript.
Funding
The research was supported by the Białystok University of Technology (WZ/WB-INL/2/2025) and Forest Research Institute.
Data Availability Statement
The data presented in this study are openly available in Mendeley Data at https://doi.org/10.17632/nrmrpmng6d.1, reference number [25].
Conflicts of Interest
The authors declare no conflicts of interest.
Abbreviations
The following abbreviations are used in this manuscript:
| ASF–HMS | Alpine/Subalpine Forests and High-Mountain Shrublands habitat |
| BDF | Broadleaved Deciduous Forests habitat |
| FRF | Floodplain and Riparian Forests habitat |
| CF | Coniferous Forests habitat |
| MGG | Meadows, Grasslands and Glades habitat |
| MF | Mixed Forests habitat |
| BMF | Bogs, Mires and Fens habitat |
| ONF | Other Non-Forested/Anthropogenic or Unclassified habitat |
| BRY | Bryophilous substrate |
| COR | Corticolous substrate |
| FOL | Foliicolous substrate |
| TER | Terricolous substrate |
| LIG | Lignicolous substrate |
| RAM | Ramicolous substrate |
| HER | Herbaceous substrate |
| SAX | Saxicolous substrate |
| XYL | Xylophilous substrate |
| MSC | Miscellaneous substrate |
| RDA | Redundancy analysis |
| NMDS | Non-metric multidimensional scaling |
Appendix A. Overview of Polish Eumycetozoa Studies
Table A1.
Primary literature sources consulted for Polish Eumycetozoa records (original titles retained).
Table A1.
Primary literature sources consulted for Polish Eumycetozoa records (original titles retained).
| Year | Publication Title (Original Spelling Retained) | Authors | Study Area |
|---|---|---|---|
| 1997 | Studies on Myxomycetes in the Pieniny National Park I. New species for the PNP [28] | Drozdowicz A. | Pieniny National Park |
| 2002 | Changes in the myxobiota of the “Łężczok” nature reserve (NW Poland) [29] | Stojanowska W., Panek E. | Łężczok Nature Reserve |
| 2003 | Myxomycetes of Poland—A Checklist [30] | Drozdowicz A., Ronikier A., Stojanowska W., Panek E. | Poland (nation-wide) |
| 2005 | Biota śluzowców doliny Pośny w Parku Narodowym Gór Stołowych [31] | Stojanowska W., Panek E. | Pośna Valley, Stołowe Mts NP |
| 2005 | Materials to the chorology of Myxomycetes in the Bieszczady National Park [32] | Drozdowicz A. | Bieszczady National Park |
| 2007 | Changes in the biota of true slime moulds (Myxomycetes) in the Korytania gorge in Ojców National Park [33] | Drozdowicz A., Paczyńska G., Pięta M. | Korytania Gorge, Ojców NP |
| 2007 | Ostoja grzybów wielkoowocnikowych i śluzowców w Lasach Oliwskich (Trójmiejski Park Krajobrazowy) [34] | Wilga M., Ciechanowski M. | Oliwa Forests, Tricity Landscape Park |
| 2008 | Diversity of nivicolous myxomycetes in the Gorce Mountains—a low-elevation massif of the Western Carpathians [35] | Ronikier A., Ronikier M., Drozdowicz A. | Gorce Mountains |
| 2010 | Some observations of true slime moulds on wood and litter in beech forests [36] | Ślusarczyk D. | Central Poland |
| 2010 | Slime moulds (Myxomycetes) of Wigry National Park [37] | Panek E., Romański M. | Wigry National Park |
| 2010 | Śluzowce Myxomycetes, grzyby Fungi i mszaki Bryophyta Wigierskiego Parku Narodowego [38] | Krzysztofiak L. | Wigry National Park |
| 2011 | Revised data on the occurrence of myxomycetes in Central Poland [39] | Ławrynowicz M., Ślusarczyk D., Salamaga A. | Central Poland |
| 2011 | Dead wood as microhabitat for myxomycetes in selected forest communities in the Polish Carpathian Mts [40] | Bochynek A., Drozdowicz A. | Polish Carpathian Mts |
| 2012 | Slime moulds biota of the commercial forest near Wyrchczadeczka (Beskid Śląski, West Carpathian Mts) [41] | Bochynek A., Drozdowicz A. | Wyrchczadeczka, Silesian Beskids |
| 2012 | Myxomycetes of the Lipówka reserve in the Niepołomice Old Growth Forest (S Poland) [42] | Drozdowicz A., Szolc P., Bochynek A., Salamaga A. | Lipówka Reserve, Niepołomice Forest |
| 2013 | Oligonema flavidum (Myxomycetes): a species new to Poland [43] | Salamaga A. | Łagiewnicki Forest, Łódź |
| 2013 | First records of Arcyria marginoundulata Nann.-Bremek. & Y. Yamam. (Myxomycetes) in Poland [44] | Ronikier A., Perz P., Chachuła P. | Poland (various sites) |
| 2016 | Meriderma species (Myxomycetes) from the Polish Carpathians: a taxonomic revision using SEM-visualised spore ornamentation [45] | Janik P., Ronikier A. | Polish Carpathians |
| 2016 | Preliminary investigations into the slime moulds (Myxogastria) in the “Bory Tucholskie” National Park [46] | Salamaga A., Grzesiak B., Wolski G., Kochanowska M., Kochanowski J. | Bory Tucholskie NP |
| 2017 | A new record of Badhamia versicolor Lister (Physaraceae) in Poland [47] | Pliszko A., Bochynek A. | Poland (locality unspecified) |
| 2017 | Inwentaryzacja śluzowców (Myxogastria, Myxomycetes) na wyznaczonych powierzchniach badawczych w Puszczy Białowieskiej [48] | Drozdowicz A. | Białowieża Forest |
| 2017 | Revision of the genus Licea (Myxomycetes) in Poland [49] | Ronikier A., Bochynek A., Chachuła P., Kozik J., Kubiak D., Perz P., Salamaga A. | Poland (nation-wide) |
| 2017 | First record of a cold-period myxomycete species Dianema depressum (Lister) Lister in Poland [50] | Chachuła P., Fiedor M., Ronikier A. | Poland (locality unspecified) |
| 2020 | Trichia sordida (Trichiaceae)—a nivicolous myxomycete species new to Poland and the Carpathians found in the Tatra Mountains [51] | Ronikier A., Janik P. | Tatra Mountains |
| 2021 | Myxomycete–Coleoptera associations in the Polish Carpathians [52] | Chachuła P., Melke A., Ruta R., Szołtys H. | Polish Carpathians |
| 2021 | First Record of Slime Moulds in Biebrza National Park (NE Poland) [53] | Ślusarczyk D. | Biebrza National Park |
| 2021 | The Myxobiota of the Łagiewnicki Forest in Łódź (Central Poland) [54] | Salamaga A. | Łagiewnicki Forest, Łódź |
| 2024 | Checklist of Myxomycetes (Amoebozoa) of the Polish Tatra Mts [55] | Paul W., Janik P., Ronikier A. | Polish Tatra Mountains |
| 2025 | First Assessment of the Biodiversity of True Slime Molds in Swamp Forest Stands of the Knyszyn Forest (Northeast Poland) [56] | Pawłowicz T., Żebrowski I., Micewicz G. M., Puchlik M., Wilamowski K., Sztabkowski K., Oszako T. | Knyszyn Forest |
References
- Adl, S.M.; Simpson, A.G.; Lane, C.E.; Lukeš, J.; Bass, D.; Bowser, S.S.; Brown, M.W.; Burki, F.; Dunthorn, M.; Hampl, V.; et al. The revised classification of eukaryotes. J. Eukaryot. Microbiol. 2012, 59, 429–493. [Google Scholar] [CrossRef]
- Lado, C. An Online Nomenclatural Information System of Eumycetozoa. 2005–2025. Available online: https://eumycetozoa.com/data/index.php (accessed on 17 December 2024).
- Leontyev, D.V.; Schnittler, M.; Stephenson, S.L.; Novozhilov, Y.K.; Shchepin, O.N. Towards a Phylogenetic Classification of the Myxomycetes. Phytotaxa 2019, 399, 209–238. [Google Scholar] [CrossRef]
- Shadwick, L.L.; Spiegel, F.W.; Shadwick, J.D.L.; Brown, M.W.; Silberman, J.D. Eumycetozoa = Amoebozoa?: SSUrDNA Phylogeny of Protosteloid Slime Molds and Its Significance for the Amoebozoan Supergroup. PLoS ONE 2009, 4, e6754. [Google Scholar] [CrossRef]
- Kang, S.; Tice, A.K.; Spiegel, F.W.; Silberman, J.D.; Pánek, T.; Čepička, I.; Kostka, M.; Kosakyan, A.; Alcântara, D.M.C.; Roger, A.J.; et al. Between a Pod and a Hard Test: The Deep Evolution of Amoebae. Mol. Biol. Evol. 2017, 34, 2258–2270. [Google Scholar] [CrossRef]
- Stephenson, S.L. Past and Ongoing Field-Based Studies of Myxomycetes. Microorganisms 2023, 11, 2283. [Google Scholar] [CrossRef] [PubMed]
- Stephenson, S.L.; Rojas, C.E. Myxomycetes: Biology, Systematics, Biogeography and Ecology, 1st ed.; Academic Press: Cambridge, MA, USA, 2017. [Google Scholar]
- Nowotny, W. Myxomyceten (Schleimpilze) und Mycetozoa (Pilztiere)—Lebensformen zwischen Pflanze und Tier. Stapfia 2000, 73, 7–37. [Google Scholar]
- Ing, B.; Stephenson, S.L. The History of the Study of Myxomycetes. In Myxomycetes; Academic Press: Cambridge, MA, USA, 2022; pp. 47–96. [Google Scholar] [CrossRef]
- Pawłowicz, T.; Wilamowski, K.; Puchlik, M.; Żebrowski, I.; Micewicz, G.M.; Gabrysiak, K.A.; Borowik, P.; Malewski, T.; Zapora, E.; Wołkowycki, M.; et al. Biologically Active Compounds in True Slime Molds and Their Prospects for Sustainable Pest and Pathogen Control. Int. J. Mol. Sci. 2025, 26, 1951. [Google Scholar] [CrossRef]
- Leontyev, D.V.; Schnittler, M. The Phylogeny of Myxomycetes. In Myxomycetes: Biology, Systematics, Biogeography and Ecology; Stephenson, S.L., Rojas, C., Eds.; Academic Press: San Diego, CA, USA, 2017; Chapter 3; pp. 83–106. [Google Scholar] [CrossRef]
- Liu, Q.S.; Yan, S.Z.; Dai, J.Y.; Chen, S.L. Species Diversity of Corticolous Myxomycetes in Tianmu Mountain National Nature Reserve, China. Can. J. Microbiol. 2013, 59, 803–813. [Google Scholar] [CrossRef]
- Stephenson, S.L. From morphological to molecular: Studies of myxomycetes since the publication of the Martin and Alexopoulos (1969) monograph. Fungal Divers. 2011, 50, 21–34. [Google Scholar] [CrossRef]
- Fukasawa, Y.; Takahashi, K.; Arikawa, T.; Hattori, T.; Maekawa, N. Fungal wood decomposer activities influence community structures of myxomycetes and bryophytes on coarse woody debris. Fungal Ecol. 2015, 14, 44–52. [Google Scholar] [CrossRef]
- Sizov, L.R.; Lysak, L.V.; Gmoshinskii, V.I. Taxonomic Diversity of the Bacterial Community Associated with the Fruiting Bodies of the Myxomycete Lycogala epidendrum (L.) Fr. Microbiology 2021, 90, 336–342. [Google Scholar] [CrossRef]
- Liu, Q.S.; Yan, S.Z.; Chen, S.L. Species diversity of myxomycetes associated with different terrestrial ecosystems, substrata (microhabitats) and environmental factors. Mycol. Prog. 2015, 14, 27. [Google Scholar] [CrossRef]
- Wrigley de Basanta, D.; Lado, C. Phagocytes of the forest: Are myxomycetes defensive mutualists for host plants? Eur. J. Protistol. 2025, 99, 126158. [Google Scholar] [CrossRef]
- Frankham, R. Genetics and Extinction. Biol. Conserv. 2005, 126, 131–140. [Google Scholar] [CrossRef]
- Ronikier, A. Digital Catalogue of Biodiversity of Poland—Protozoa: Mycetozoa. Version 1.3. Polish Biodiversity Information Network. 2022. GBIF Occurrence Download. Available online: https://doi.org/10.15468/e4ctuf (accessed on 19 July 2025).
- Shahbandeh, M.; Kaim, D.; Kozak, J. The Substantial Increase of Forest Cover in Central Poland Following Extensive Land Abandonment: Szydłowiec County Case Study. Remote Sens. 2022, 14, 3852. [Google Scholar] [CrossRef]
- Przepióra, F.; Ciach, M. Profile of Tree-related Microhabitats in the Primeval Białowieża Forest: A Benchmark for Temperate Woodlands. Sci. Total Environ. 2023, 905, 167273. [Google Scholar] [CrossRef]
- Solon, J.; Borzyszkowski, J.; Bidłasik, M.; Richling, A.; Badora, K.; Balon, J.; Brzezińska-Wójcik, T.; Chabudziński, Ł.; Dobrowolski, R.; Grzegorczyk, I.; et al. Physico-geographical mesoregions of Poland: Verification and adjustment of boundaries on the basis of contemporary spatial data. Geogr. Pol. 2018, 91, 143–170. [Google Scholar] [CrossRef]
- Graczyk, D.; Kundzewicz, Z.W. Changes of temperature-related agroclimatic indices in Poland. Theor. Appl. Climatol. 2016, 124, 401–410. [Google Scholar] [CrossRef]
- Oszako, T.; Kukina, O.; Dyshko, V.; Moser, W.K.; Ślusarski, S.; Okorski, A.; Borowik, P. Afforestation of land abandoned by farmers poses threat to forest sustainability due to Heterobasidion spp. Forests 2023, 14, 954. [Google Scholar] [CrossRef]
- Pawłowicz, T. Geo-referenced Occurrence Dataset of Polish Forest Slime Moulds with Habitat and Substrate Annotations (3085 Records). Mendeley Data. 2025. Available online: https://doi.org/10.17632/nrmrpmng6d.1 (accessed on 21 July 2025).
- Dufrêne, M.; Legendre, P. Species assemblages and indicator species: The need for a flexible asymmetrical approach. Ecol. Monogr. 1997, 67, 345–366. [Google Scholar] [CrossRef]
- Cáceres, M.D.; Legendre, P. Associations between species and groups of sites: Indices and statistical inference. Ecology 2009, 90, 3566–3574. [Google Scholar] [CrossRef] [PubMed]
- Drozdowicz, A. Studies on Myxomycetes in the Pieniny National Park I. New species for the PNP. Acta Mycol. 1997, 32, 287–291. [Google Scholar] [CrossRef]
- Stojanowska, W.; Panek, E. Changes in the myxomycete biota of the “Łężczok” nature reserve (NW Poland). Acta Mycol. 2002, 37, 13–28. [Google Scholar] [CrossRef]
- Drozdowicz, A.; Ronikier, A.; Stojanowska, W.; Panek, E. Myxomycetes of Poland a Checklist; W. Szafer Institute of Botany, Polish Academy of Sciences: Kraków, Poland, 2003; Volume 10. [Google Scholar]
- Stojanowska, W.; Panek, E. Biota śluzowców doliny Pośny w Parku Narodowym Gór Stołowych. Szczeliniec 2005, 9, 75–94. [Google Scholar]
- Drozdowicz, A. Materials to the chorology of Myxomycètes in the Bieszczady National Park. Rocz. Bieszczadzkie 2005, 13, 261–276. [Google Scholar]
- Drozdowicz, A.; Paczyńska, G.; Pięta, M. Changes in the biota of slime moulds (Myxomycetes) in the Korytania gorge in Ojców National Park. Prądnik. Prace i Materiały Muzeum Im. Prof. Władysława Szafera 2007, 17, 61–70. [Google Scholar]
- Wilga, M.S.; Ciechanowski, M. Ostoja grzybów wielkoowocnikowych i śluzowców w Lasach Oliwskich (Trójmiejski Park Krajobrazowy). Chrońmy Przyrodę Ojczystą 2007, 63, 82–101. [Google Scholar]
- Ronikier, A.; Ronikier, M.; Drozdowicz, A. Diversity of nivicolous myxomycetes in the Gorce mountains—A low-elevation massif of the Western Carpathians. Mycotaxon 2008, 103, 337–352. [Google Scholar]
- Ślusarczyk, D. Some observations of slime moulds on wood and litter in beech forests. Acta Mycol. 2010, 45, 239–246. [Google Scholar] [CrossRef][Green Version]
- Panek, E.; Romański, M. Slime moulds (Myxomycetes) of Wigry National Park. In Slime Moulds Myxomycetes, Fungi and Bryophytes of Wigry National Park; Krzysztofiak, L., Ed.; Stowarzyszenie “Człowiek i Przyroda”: Suwałki, Poland, 2010; pp. 9–84. [Google Scholar]
- Krzysztofiak, L. (Ed.) Śluzowce Myxomycetes, Grzyby Fungi i Mszaki Bryophyta Wigierskiego Parku Narodowego; Stowarzyszenie “Człowiek i Przyroda”: Suwałki, Poland, 2010. [Google Scholar]
- Ławrynowicz, M.; Ślusarczyk, D.; Salamaga, A. Revised data on the occurrence of myxomycetes in Central Poland. Acta Mycol. 2011, 46, 223–232. [Google Scholar] [CrossRef][Green Version]
- Bochynek, A.; Drozdowicz, A. Dead wood as microhabitat for myxomycetes in selected forest communities in the Polish Carpathian Mts. Rocz. Bieszczadzkie 2011, 19, 165–179. [Google Scholar][Green Version]
- Bochynek, A.; Drozdowicz, A. Slime moulds biota of the commercial forest near Wyrchczadeczka (Beskid Śląski, West Carpathian Mts). Sylwan 2012, 156, 57–63. [Google Scholar][Green Version]
- Drozdowicz, A.; Szolc, P.; Bochynek, A.; Salamaga, A. Myxomycetes of the Lipówka reserve in the Niepołomice Old Growth Forest (S Poland). Acta Mycol. 2012, 47, 97–107. [Google Scholar] [CrossRef]
- Salamaga, A. Oligonema flavidum (Myxomycetes): A species new to Poland. Pol. Bot. J. 2013, 58, 747–749. [Google Scholar] [CrossRef]
- Ronikier, A.; Perz, P.; Chachuła, P. First records of Arcyria marginoundulata Nann.-Bremek. & Y. Yamam. (Myxomycetes) in Poland. Acta Mycol. 2013, 48, 279–285. [Google Scholar] [CrossRef]
- Janik, P.; Ronikier, A. Meriderma species (Myxomycetes) from the Polish Carpathians: A taxonomic revision using SEM-visualized spore ornamentation. Acta Soc. Bot. Pol. 2016, 85, e3492. [Google Scholar] [CrossRef]
- Salamaga, A.; Grzesiak, B.; Wolski, G.J.; Kochanowska, M.; Kochanowski, J. Preliminary investigations into the slime moulds (Myxogastria) in the “Bory Tucholskie” National Park. Acta Mycol. 2016, 51, 1077. [Google Scholar] [CrossRef]
- Pliszko, A.; Bochynek, A. A new record of Badhamia versicolor Lister (Physaraceae) in Poland. Biodivers. Res. Conserv. 2017, 45, 23–25. [Google Scholar] [CrossRef]
- Drozdowicz, A. Inwentaryzacja śluzowców (Myxogastria, Myxomycetes) na wyznaczonych powierzchniach badawczych w Puszczy Białowieskiej. Park. Nar. Rezerwaty Przyr. 2017, 36, 3–33. [Google Scholar]
- Ronikier, A.; Bochynek, A.; Chachuła, P.; Kozik, J.; Kubiak, D.; Perz, P.; Salamaga, A. Revision of the genus Licea (Myxomycetes) in Poland. Nova Hedwig. 2017, 104, 243–272. [Google Scholar] [CrossRef]
- Chachuła, P.; Fiedor, M.; Ronikier, A. First record of a cold-period myxomycete species Dianema depressum (Lister) Lister in Poland. Acta Mycol. 2017, 52, 1095. [Google Scholar] [CrossRef]
- Ronikier, A.; Janik, P. Trichia sordida (Trichiaceae)—A nivicolous myxomycete species new to Poland and the Carpathians found in the Tatra Mountains. Fragm. Florist. Geobot. Pol. 2020, 27, 747–751. [Google Scholar] [CrossRef]
- Chachuła, P.; Melke, A.; Ruta, R.; Szołtys, H. Myxomycete-Coleoptera associations in the Polish Carpathians. J. Nat. Hist. 2021, 55, 1749–1768. [Google Scholar] [CrossRef]
- Ślusarczyk, D.M. First Record of Slime Molds in Biebrza National Park (NE Poland). Acta Mycol. 2021, 56, 564. [Google Scholar] [CrossRef]
- Salamaga, A.M. The Myxobiota of the Łagiewnicki Forest in Łódź (Central Poland). Acta Mycol. 2021, 56, 561. [Google Scholar] [CrossRef]
- Paul, W.; Janik, P.; Ronikier, A. Checklist of Myxomycetes (Amoebozoa) of the Polish Tatra Mts. Acta Mycol. 2024, 58, 178396. [Google Scholar] [CrossRef]
- Pawłowicz, T.; Żebrowski, I.; Micewicz, G.M.; Puchlik, M.; Wilamowski, K.; Sztabkowski, K.; Oszako, T. First Assessment of the Biodiversity of True Slime Molds in Swamp Forest Stands of the Knyszyn Forest (Northeast Poland) Using the Moist Chambers Detection Method. Forests 2025, 16, 1259. [Google Scholar] [CrossRef]
Disclaimer/Publisher’s Note: The statements, opinions and data contained in all publications are solely those of the individual author(s) and contributor(s) and not of MDPI and/or the editor(s). MDPI and/or the editor(s) disclaim responsibility for any injury to people or property resulting from any ideas, methods, instructions or products referred to in the content. |
© 2025 by the authors. Licensee MDPI, Basel, Switzerland. This article is an open access article distributed under the terms and conditions of the Creative Commons Attribution (CC BY) license (https://creativecommons.org/licenses/by/4.0/).