Author Contributions
Conceptualisation, T.P.; Data curation, T.P.; Formal analysis, T.P.; Funding acquisition, T.P., T.O., K.W. and M.P.; Investigation, T.P.; Methodology, T.P.; Project administration, T.P.; Resources, T.P.; Software, T.P.; Supervision, T.O., K.W., M.P. and K.S.; Validation, T.P., T.O., K.S. and I.Ż.; Visualisation, T.P.; Writing—original draft, T.P.; Writing—review and editing, T.P., T.O., K.W., M.P., K.S., I.Ż., G.M.M., G.K.M. and O.K. All authors have read and agreed to the published version of the manuscript.
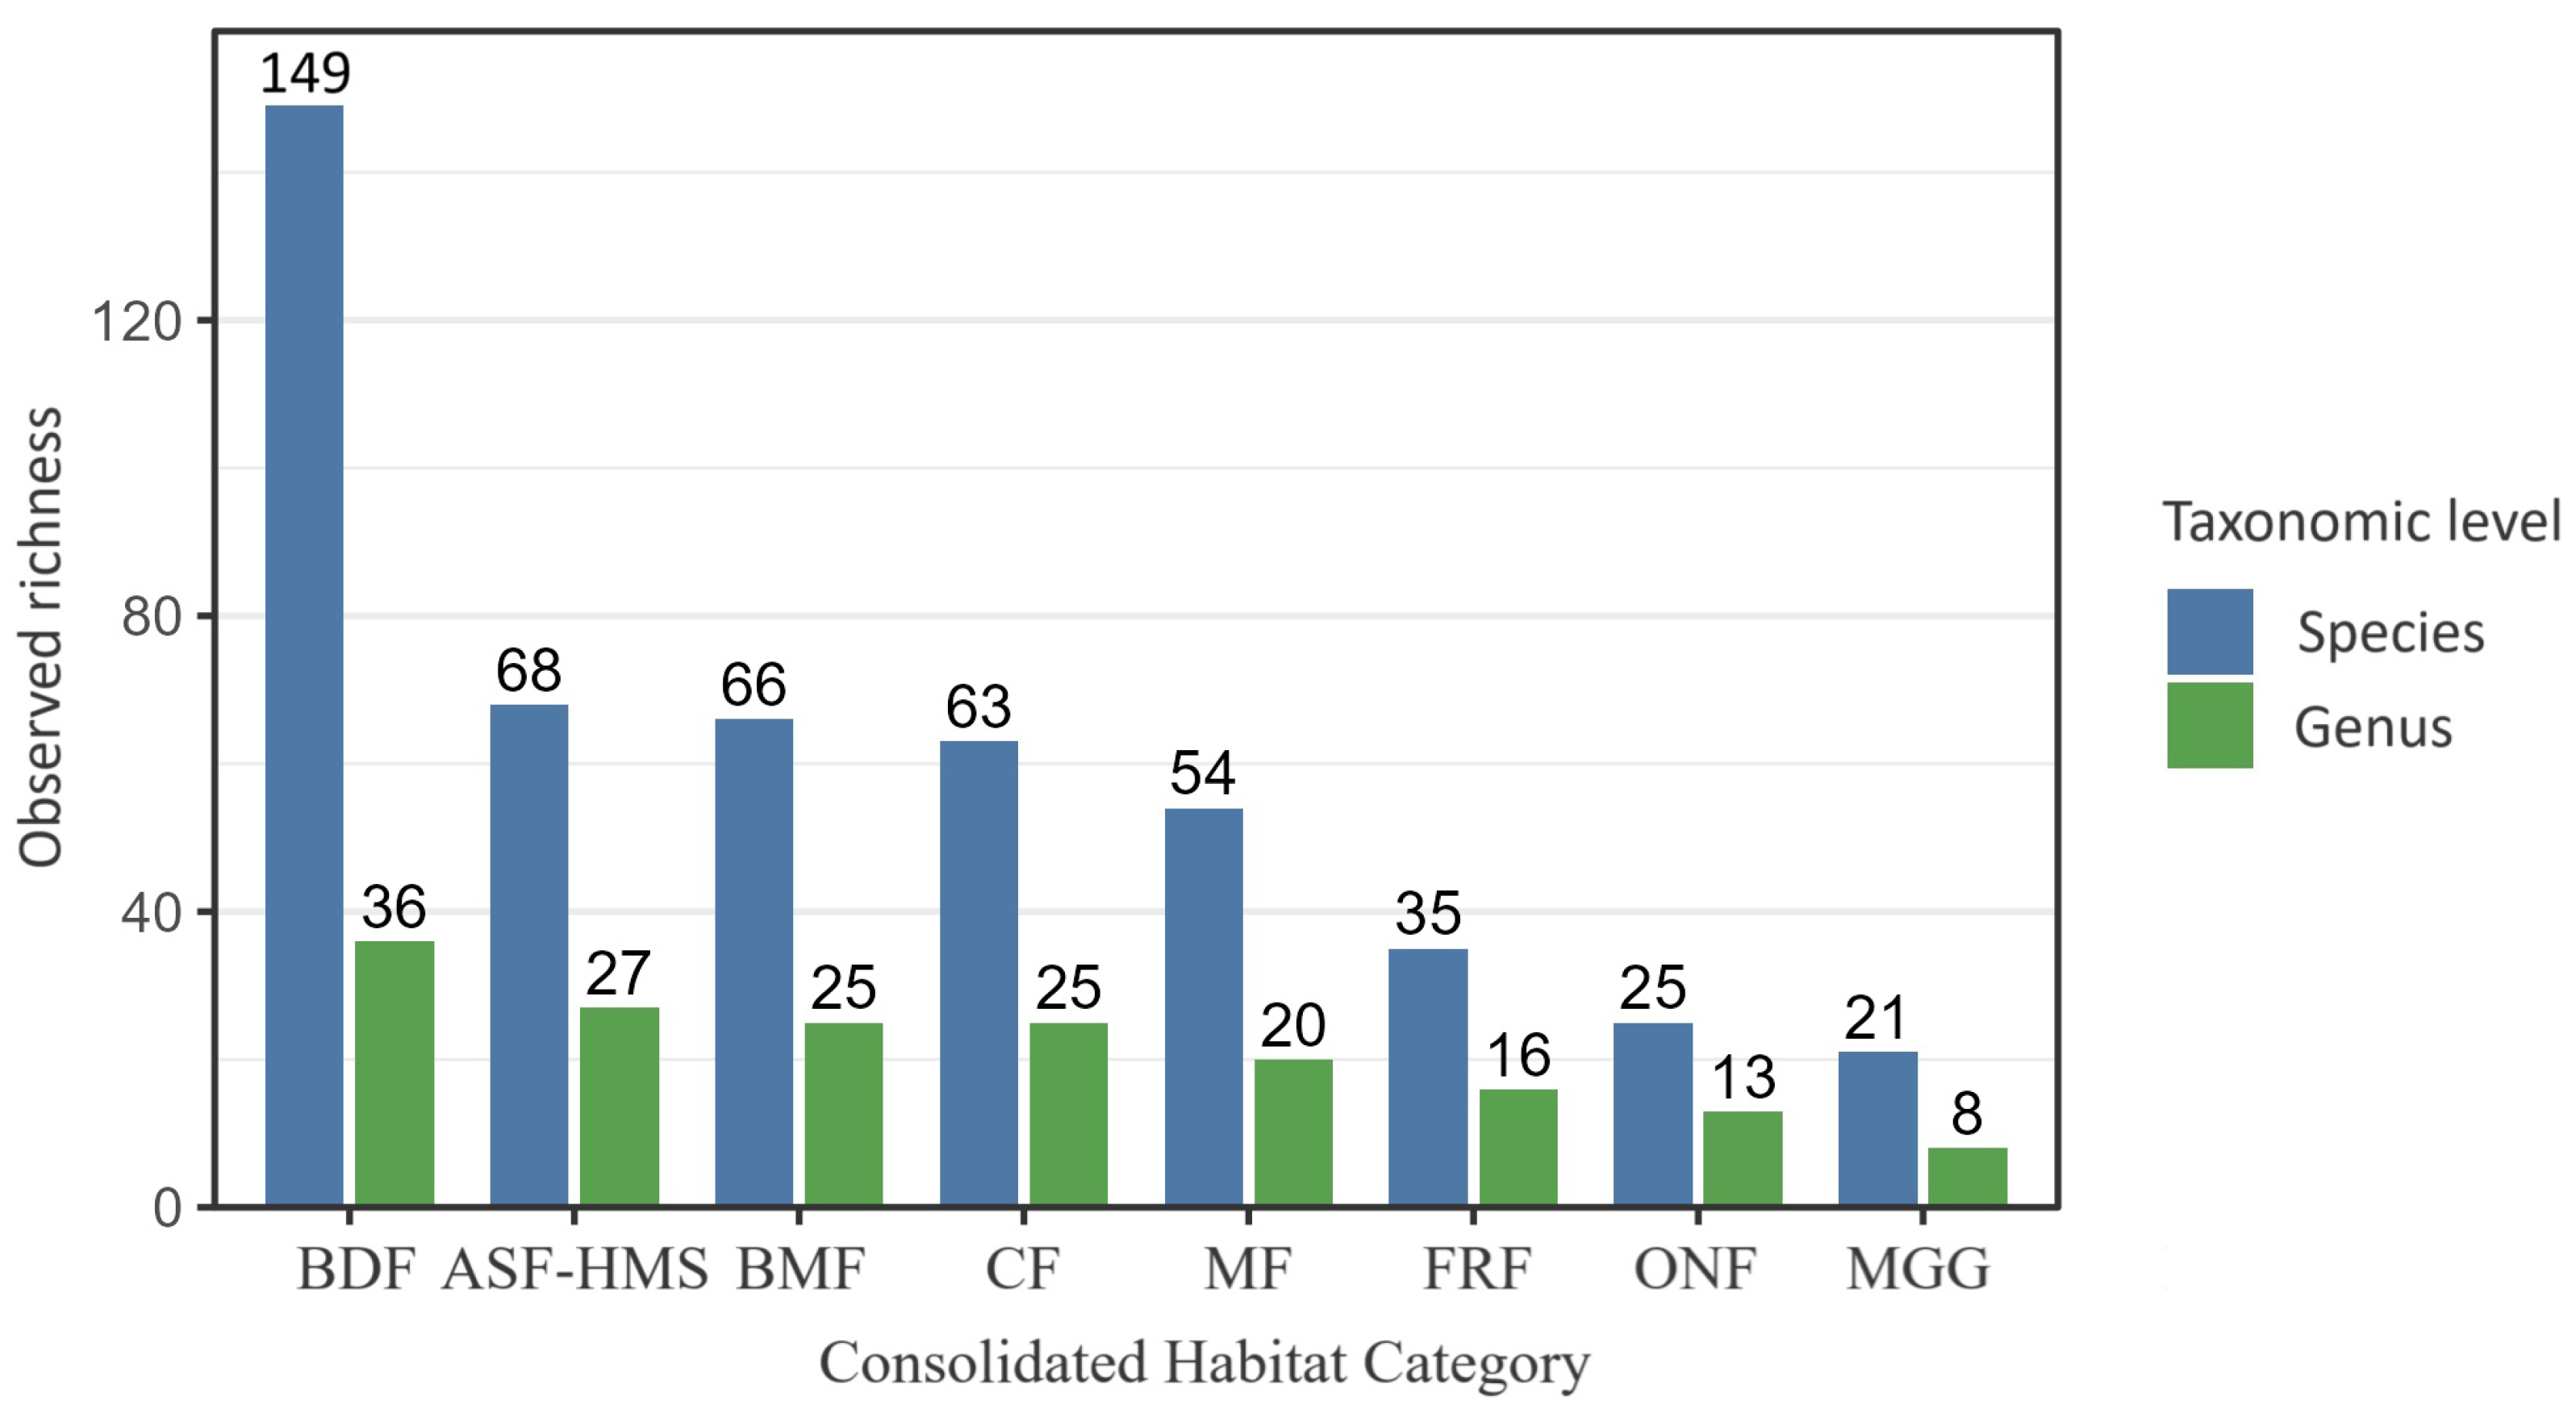
Figure 1.
Observed true slime mould species () and genus () richness across the eight Polish habitat classes (ASF–HMS, BDF, FRF, CF, MGG, MF, BMF, ONF). Bars represent distinct-taxon counts; error bars depict 95% Poisson confidence intervals. Across the entire dataset (), 260 taxa (species + infraspecific ranks) were assigned to 42 genera. Numerals above each bar give the exact taxon count per habitat, facilitating direct comparison of species-to-genus ratios and highlighting habitats with disproportionate phylogenetic diversity.
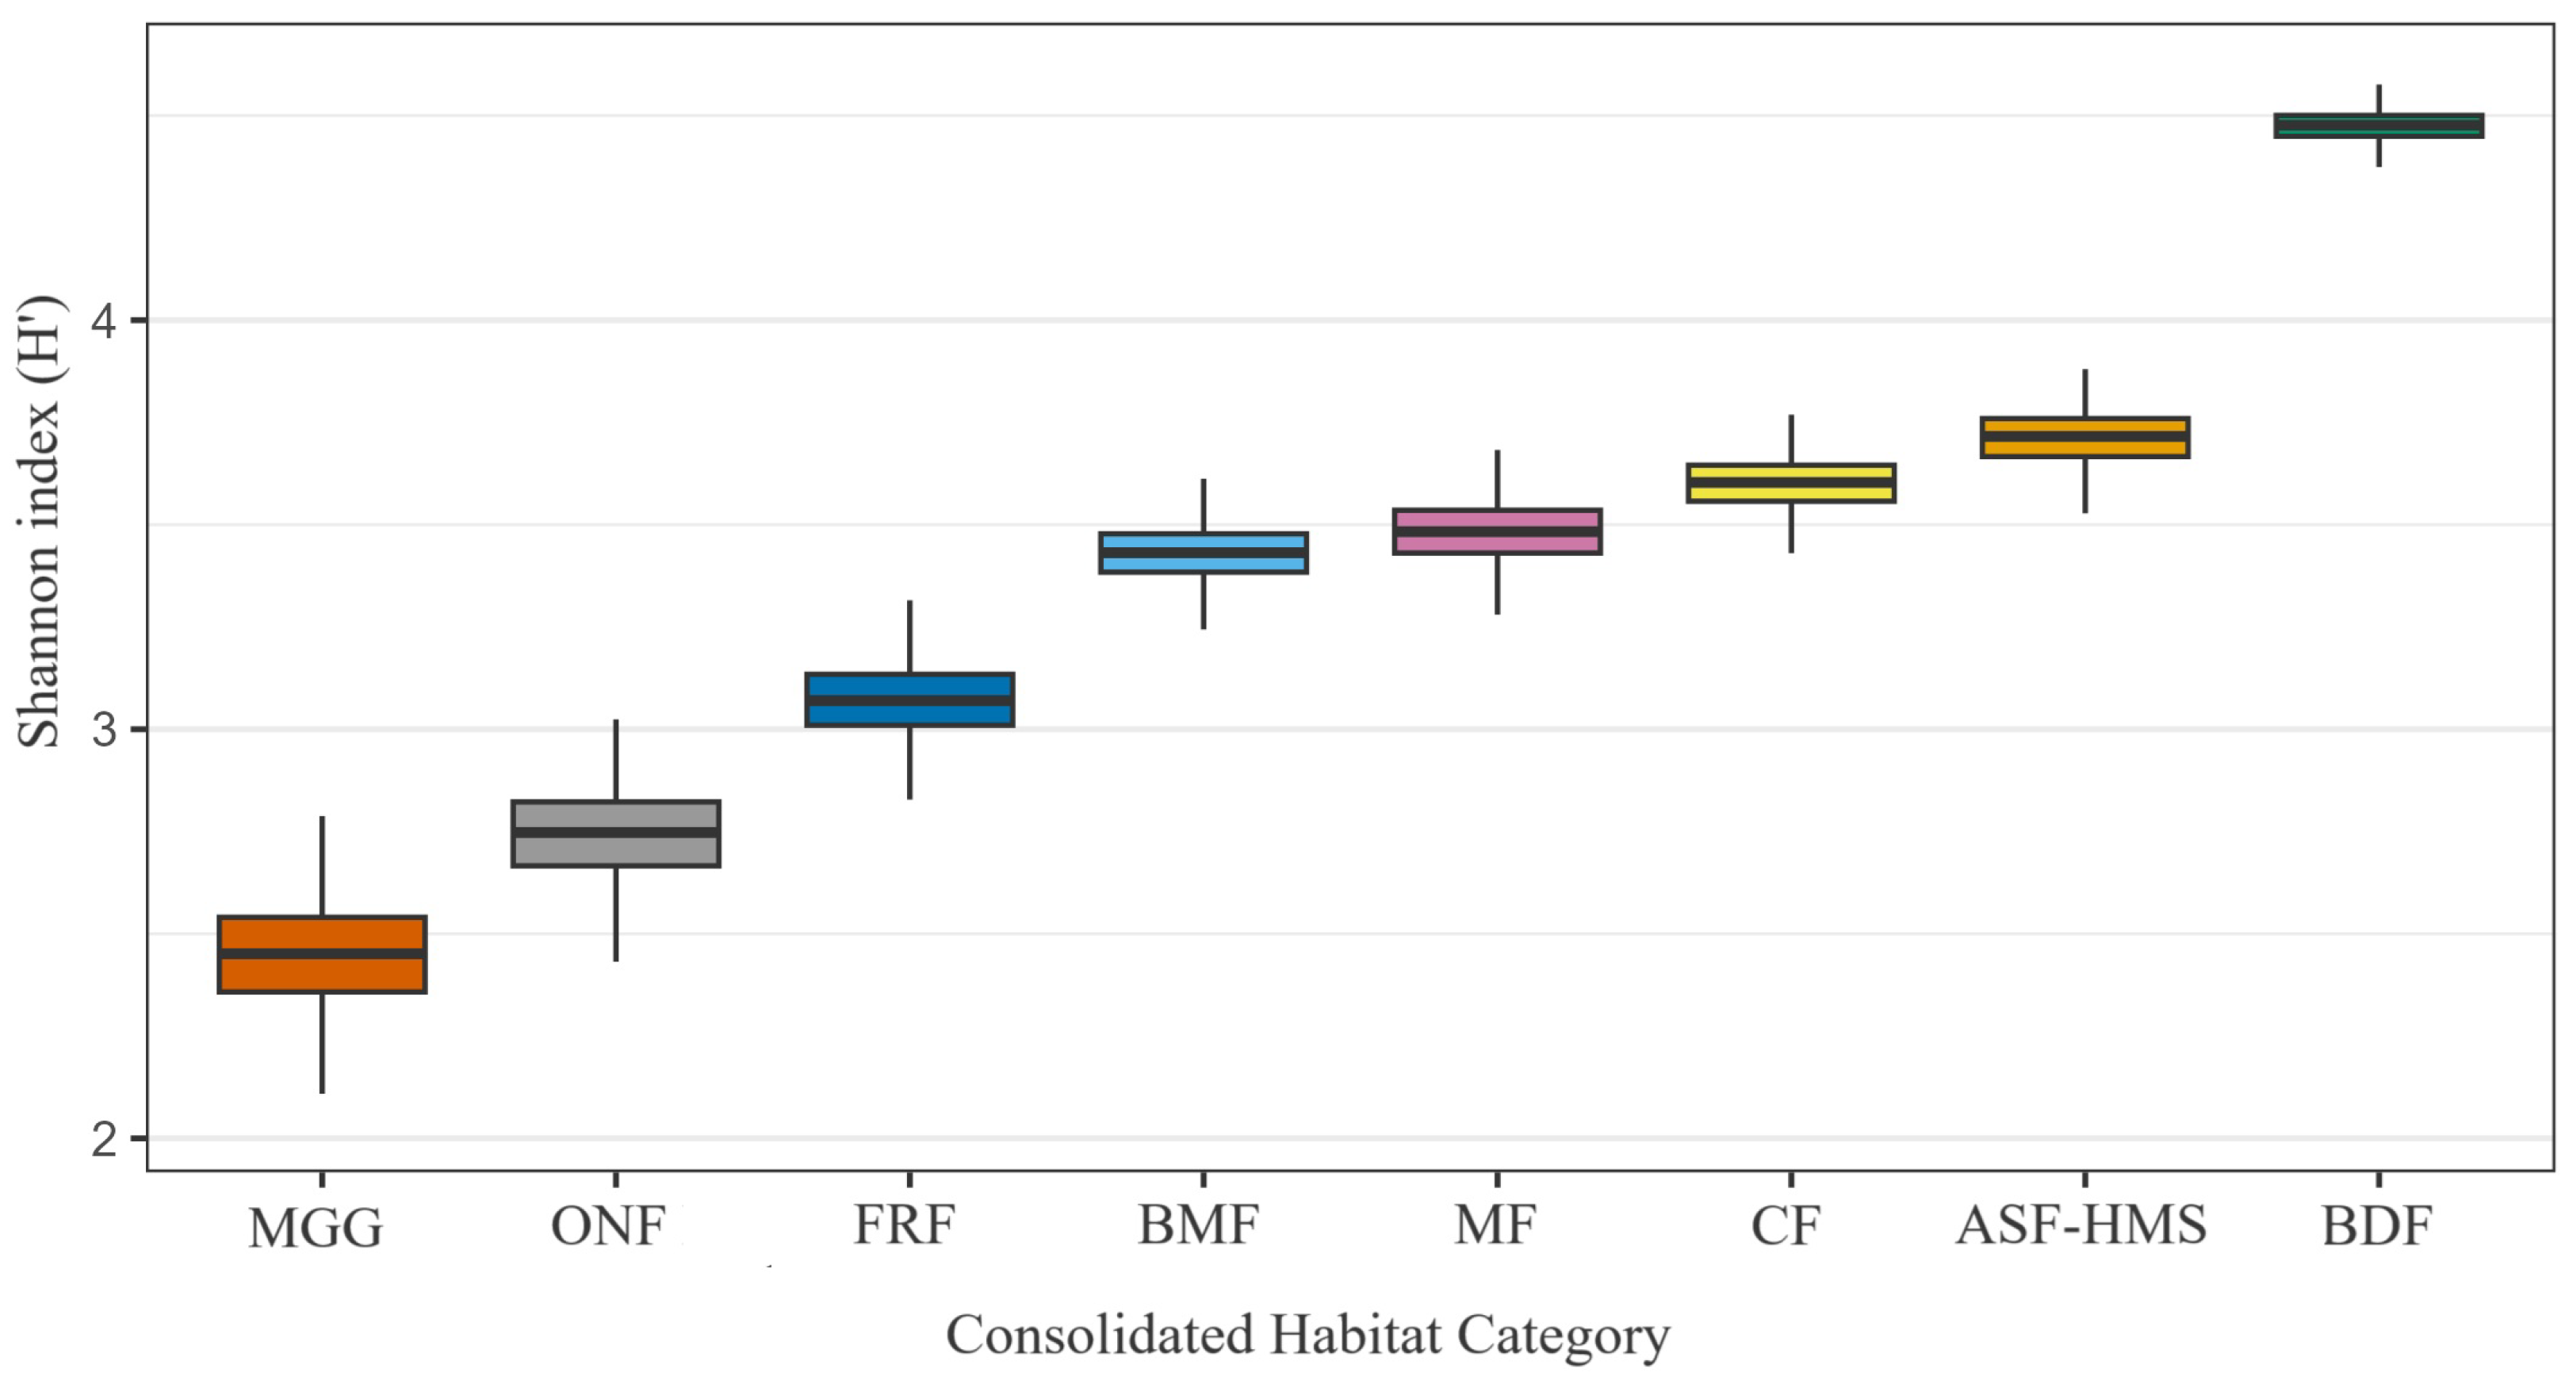
Figure 2.
Bootstrapped () Shannon entropy () for each habitat class. Box-plots show the median and inter-quartile range (IQR); whiskers extend to 1.5 × IQR. Bootstrap resampling was habitat stratified, retaining the original number of occurrence records for every habitat (total records = 1556). Sample sizes (n) are indicated in parentheses on the axis labels. A Kruskal–Wallis test detected significant heterogeneity among habitats (; ; ), underscoring environmentally structured variation in -diversity.
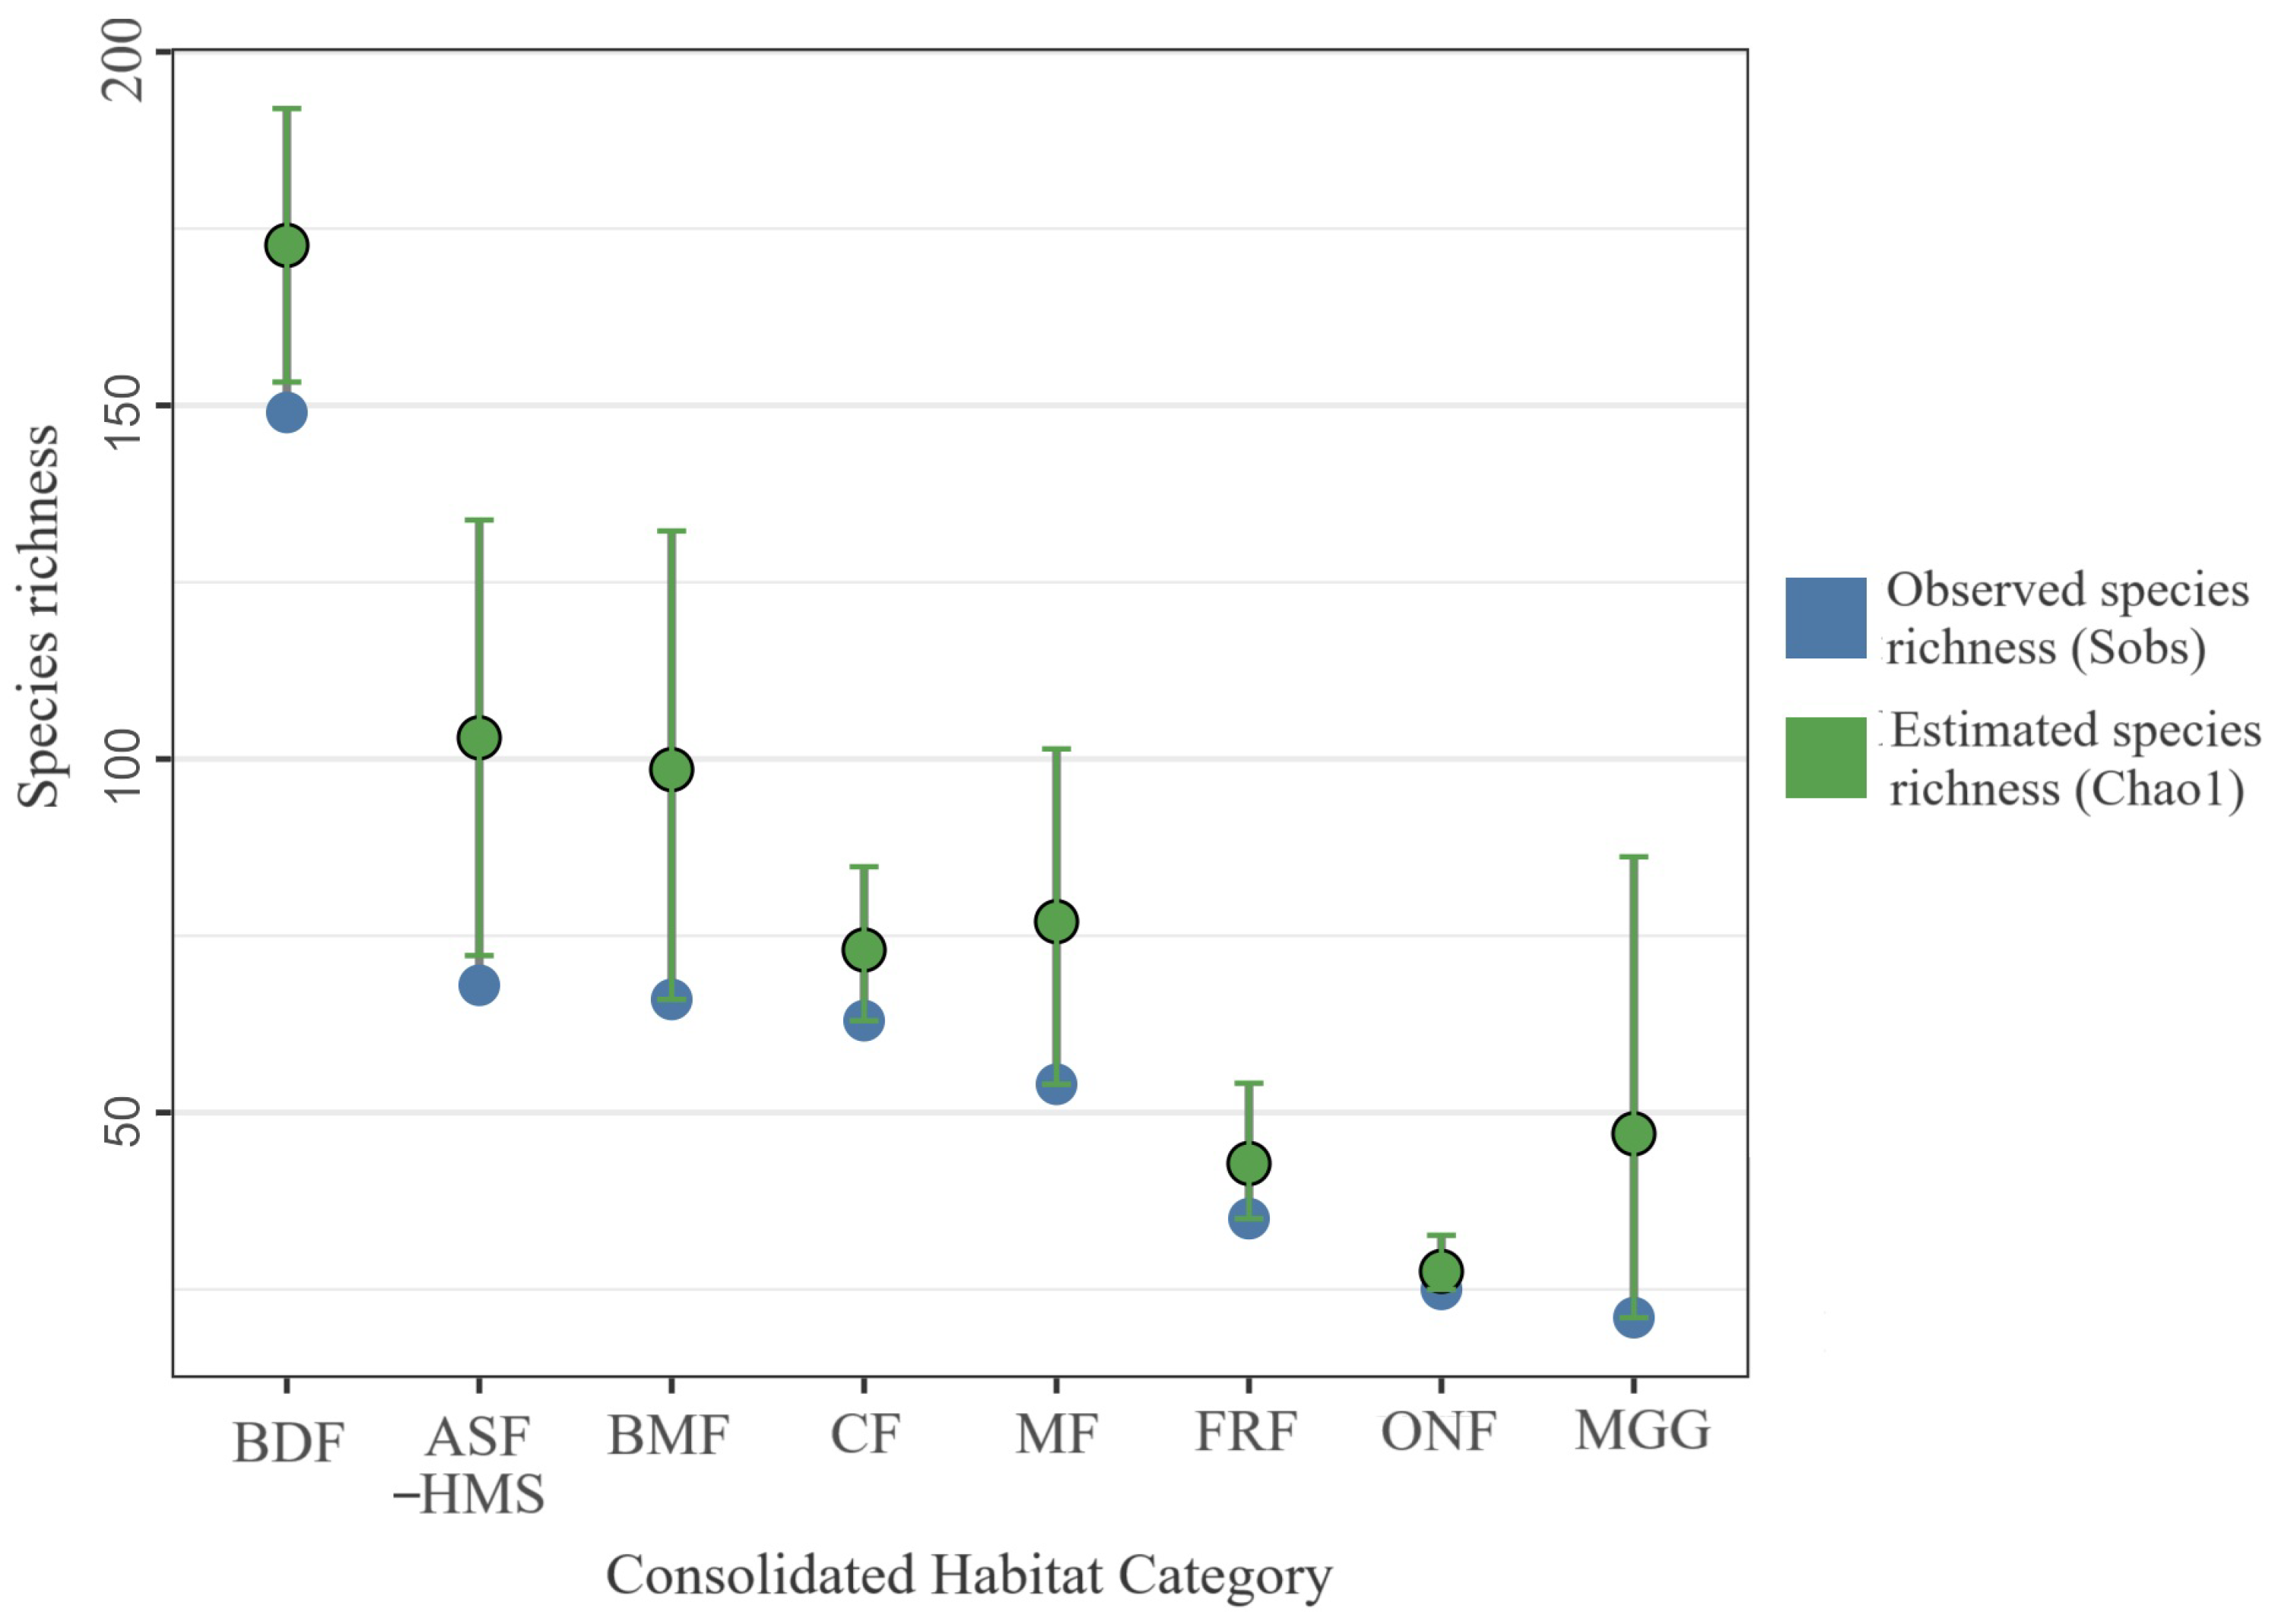
Figure 3.
Bootstrapped () species richness by habitat class. Lollipop stems represent median values; circular termini indicate 95% confidence intervals. Blue points denote observed species richness (Sobs); green points denote estimated species richness (Chao1). Each habitat’s empirical species vector was resampled with replacement, preserving its record count; sample sizes (n) are shown in parentheses beneath the axis labels. The analysis is based on 1556 occurrence records for which consolidated-habitat annotation was available. Habitat abbreviations: ASF–HMS, BDF, FRF, CF, MGG, MF, BMF, ONF.
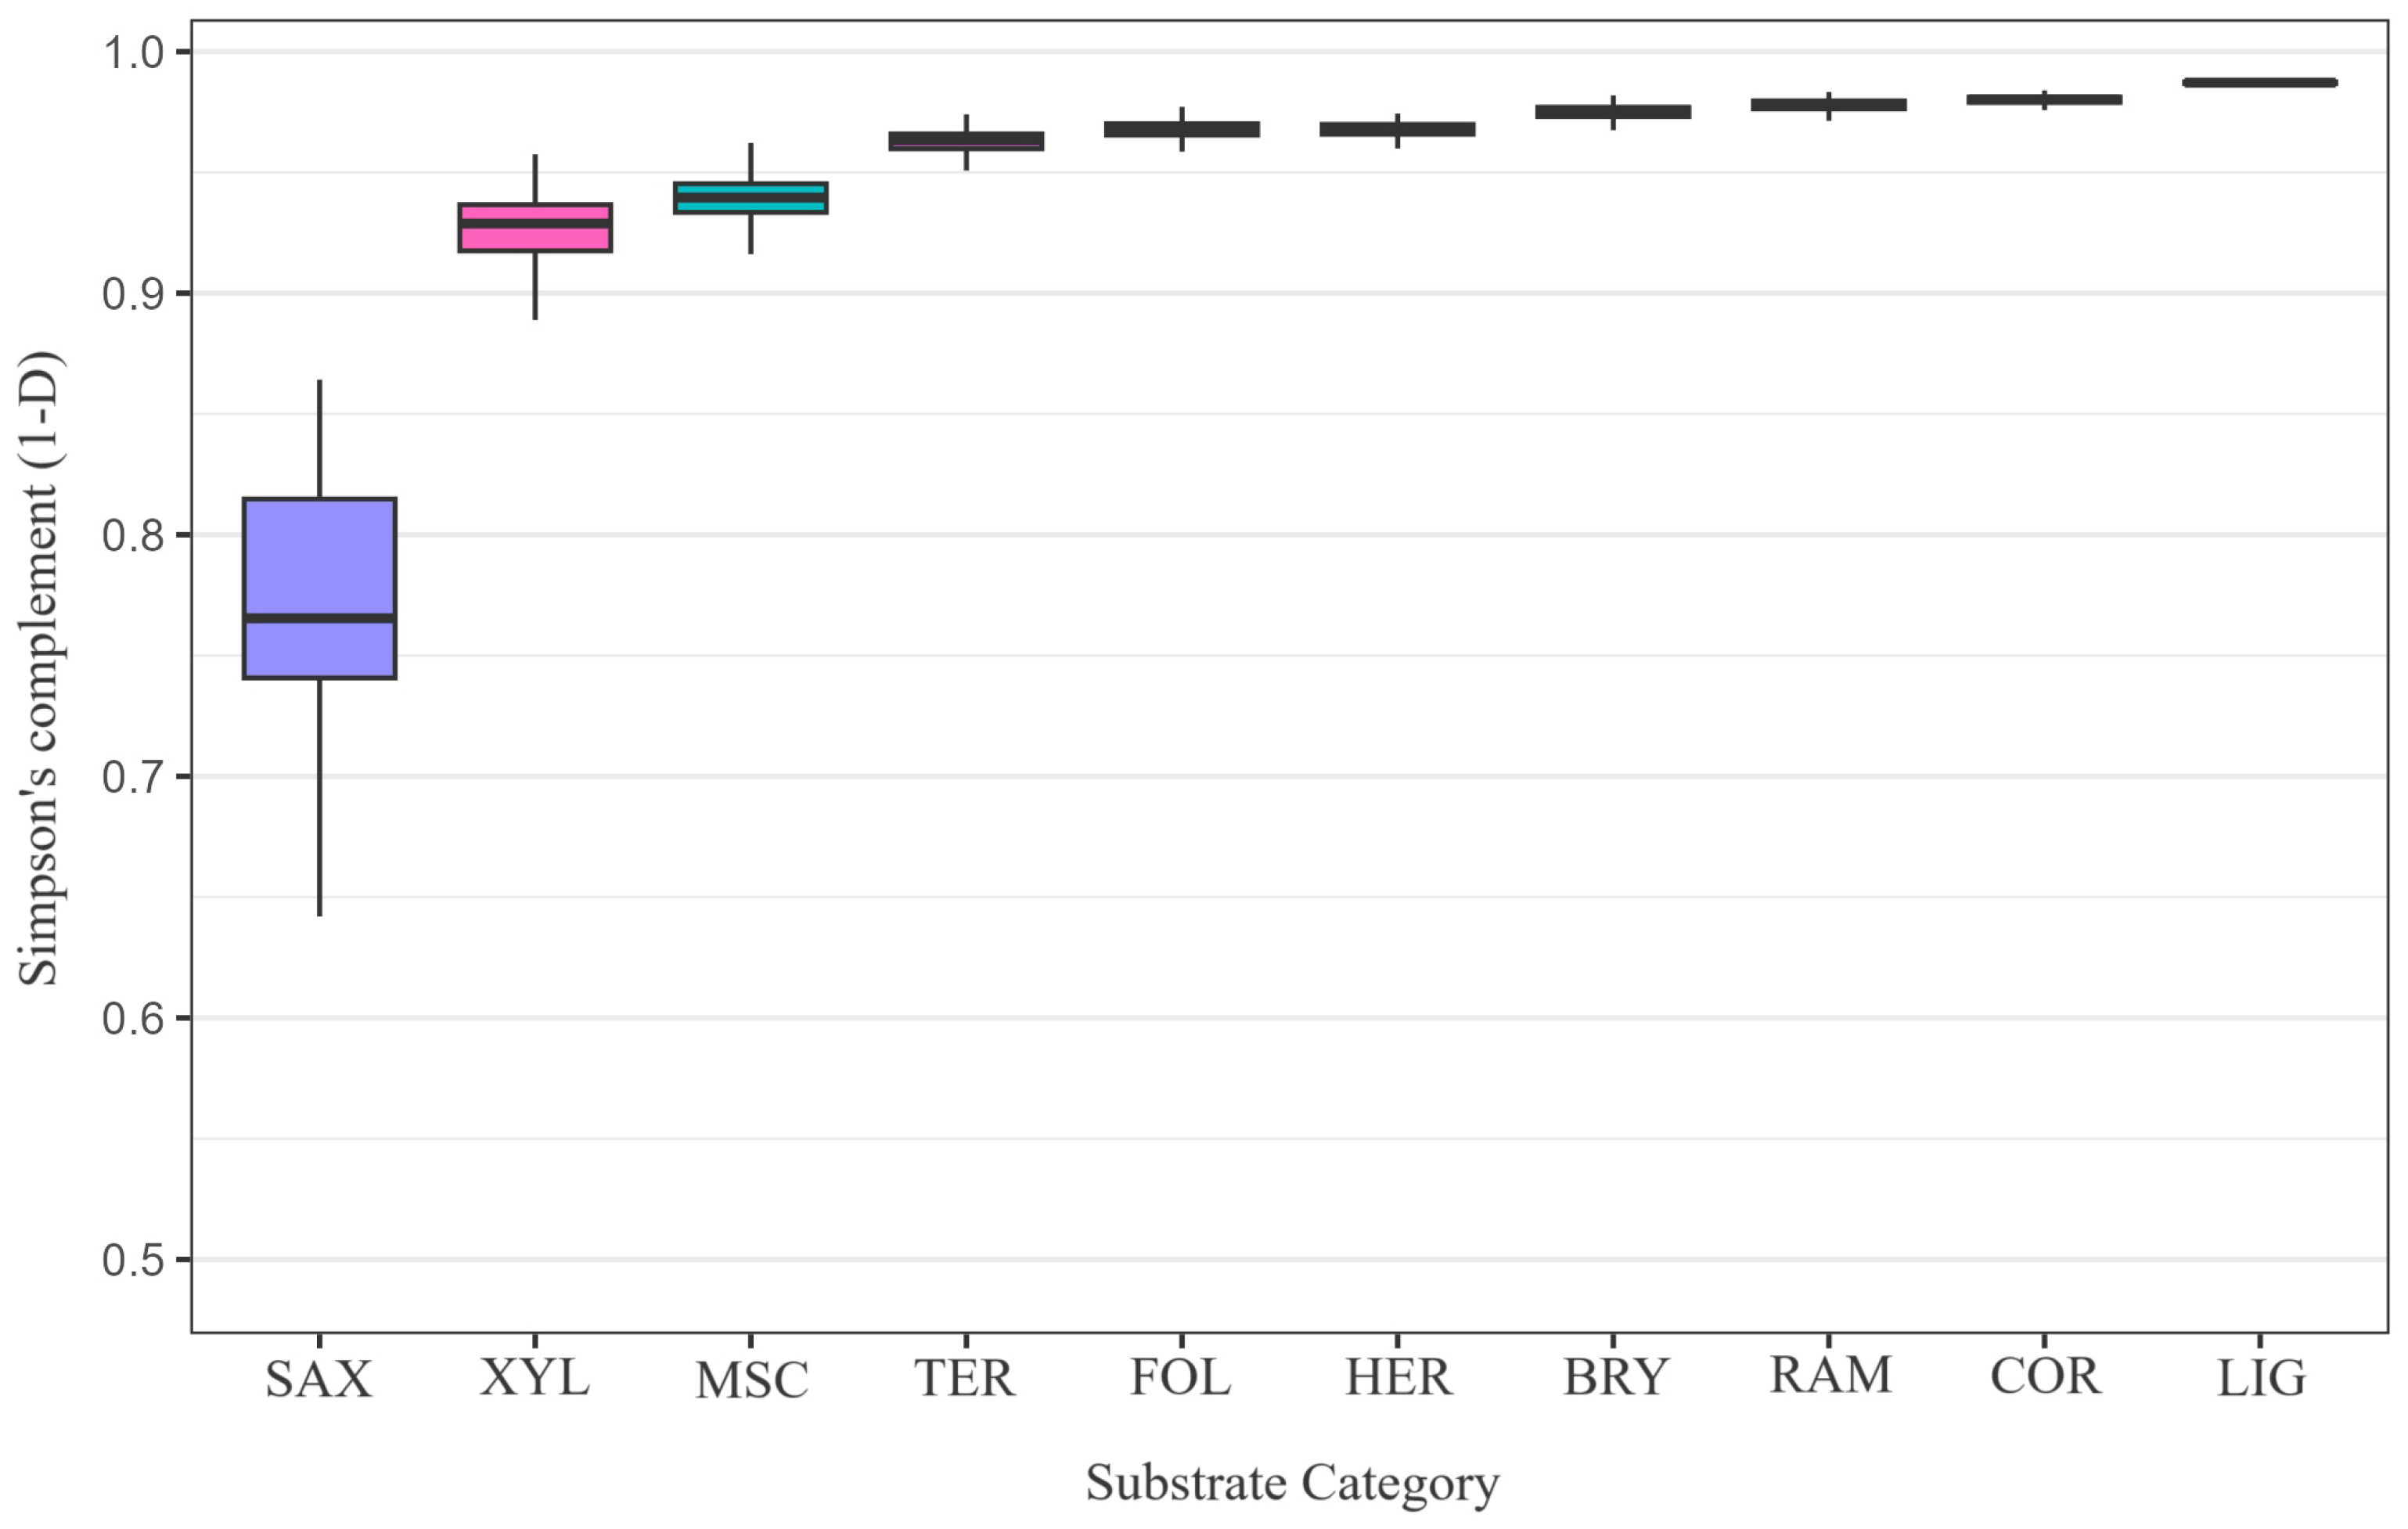
Figure 4.
Bootstrapped () Simpson diversity complement () across the ten substrate guilds (BRY, COR, FOL, TER, XYL, LIG, HER, SAX, RAM, MSC). Each substrate’s empirical species vector was resampled with replacement, preserving its record count; parentheses on the x-axis denote those sample sizes. The analysis encompasses 3027 substrate-annotated occurrence records. A Kruskal–Wallis test confirmed significant heterogeneity among guilds (; ; ).
Figure 5.
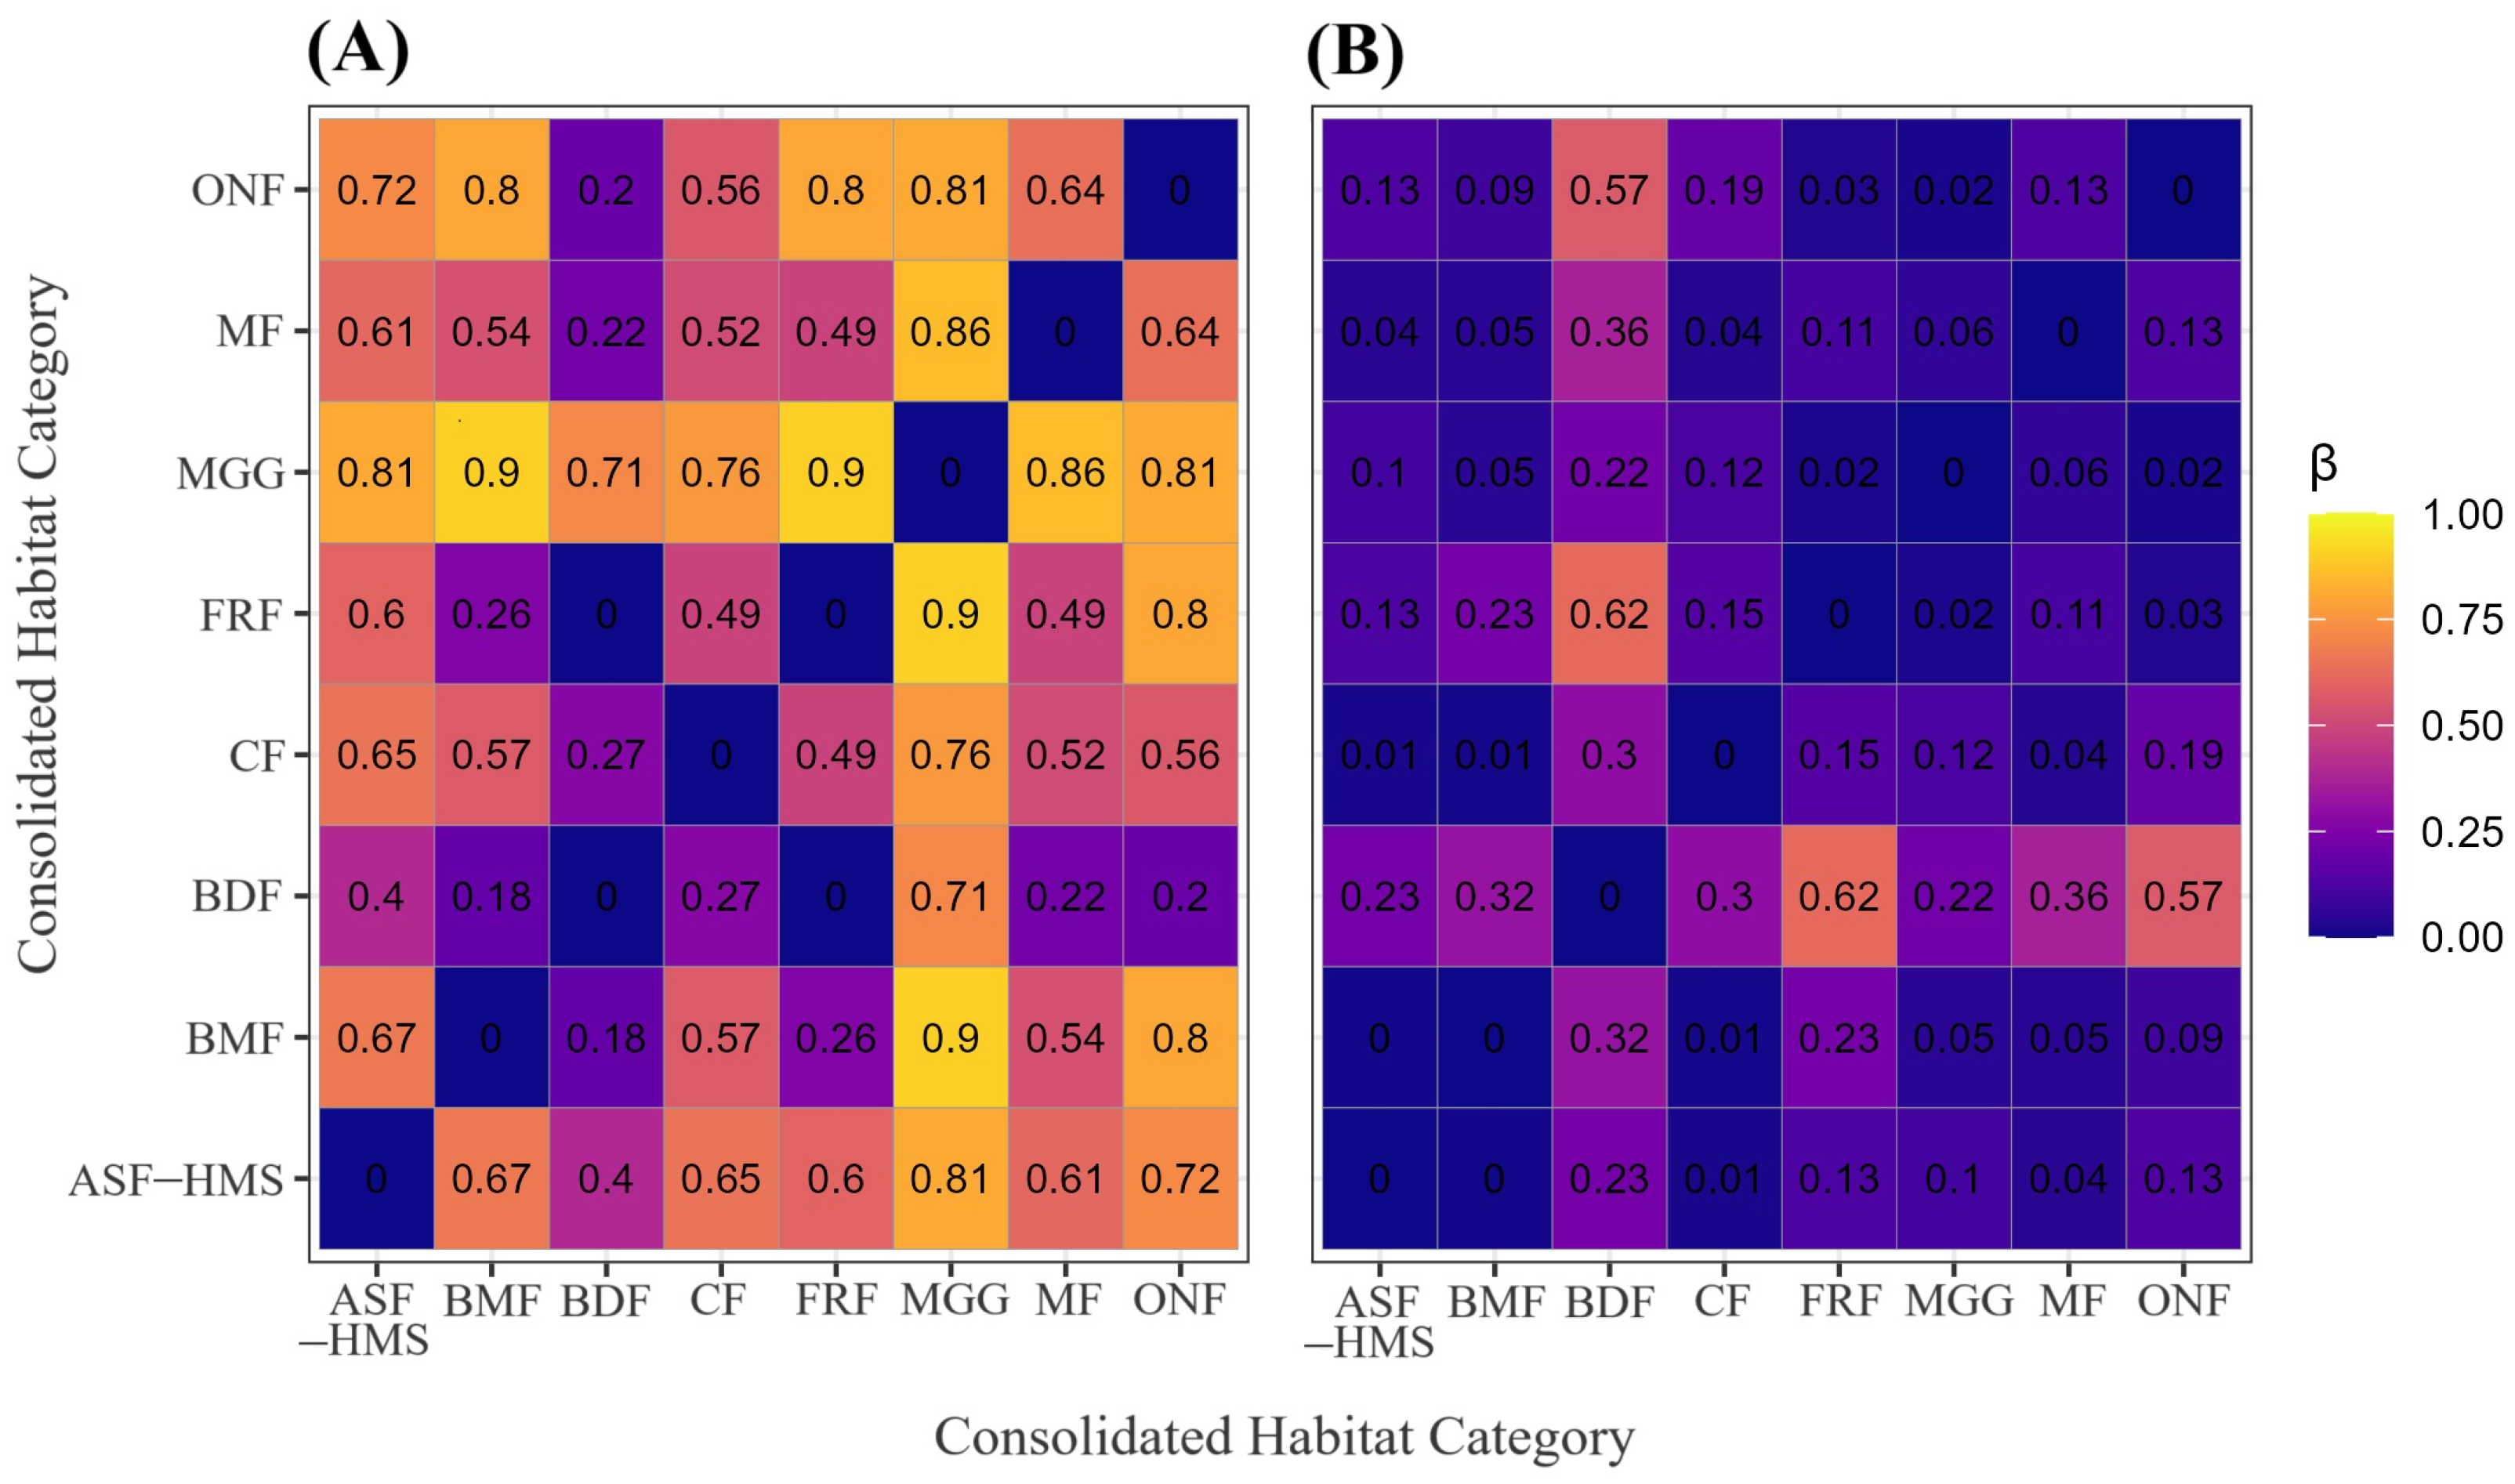
Sørensen-based -diversity among the eight habitat classes. (A) Heatmap of the species-turnover component (); (B) heatmap of the nestedness-resultant component. Cell shading scales from 0 (identical) to 1 (completely distinct). The panel represents 28 pairwise comparisons (); each tile is labelled with its corresponding estimate to two-decimal precision. All calculations are based on 1556 occurrence records with unequivocal habitat annotation.
Figure 6.
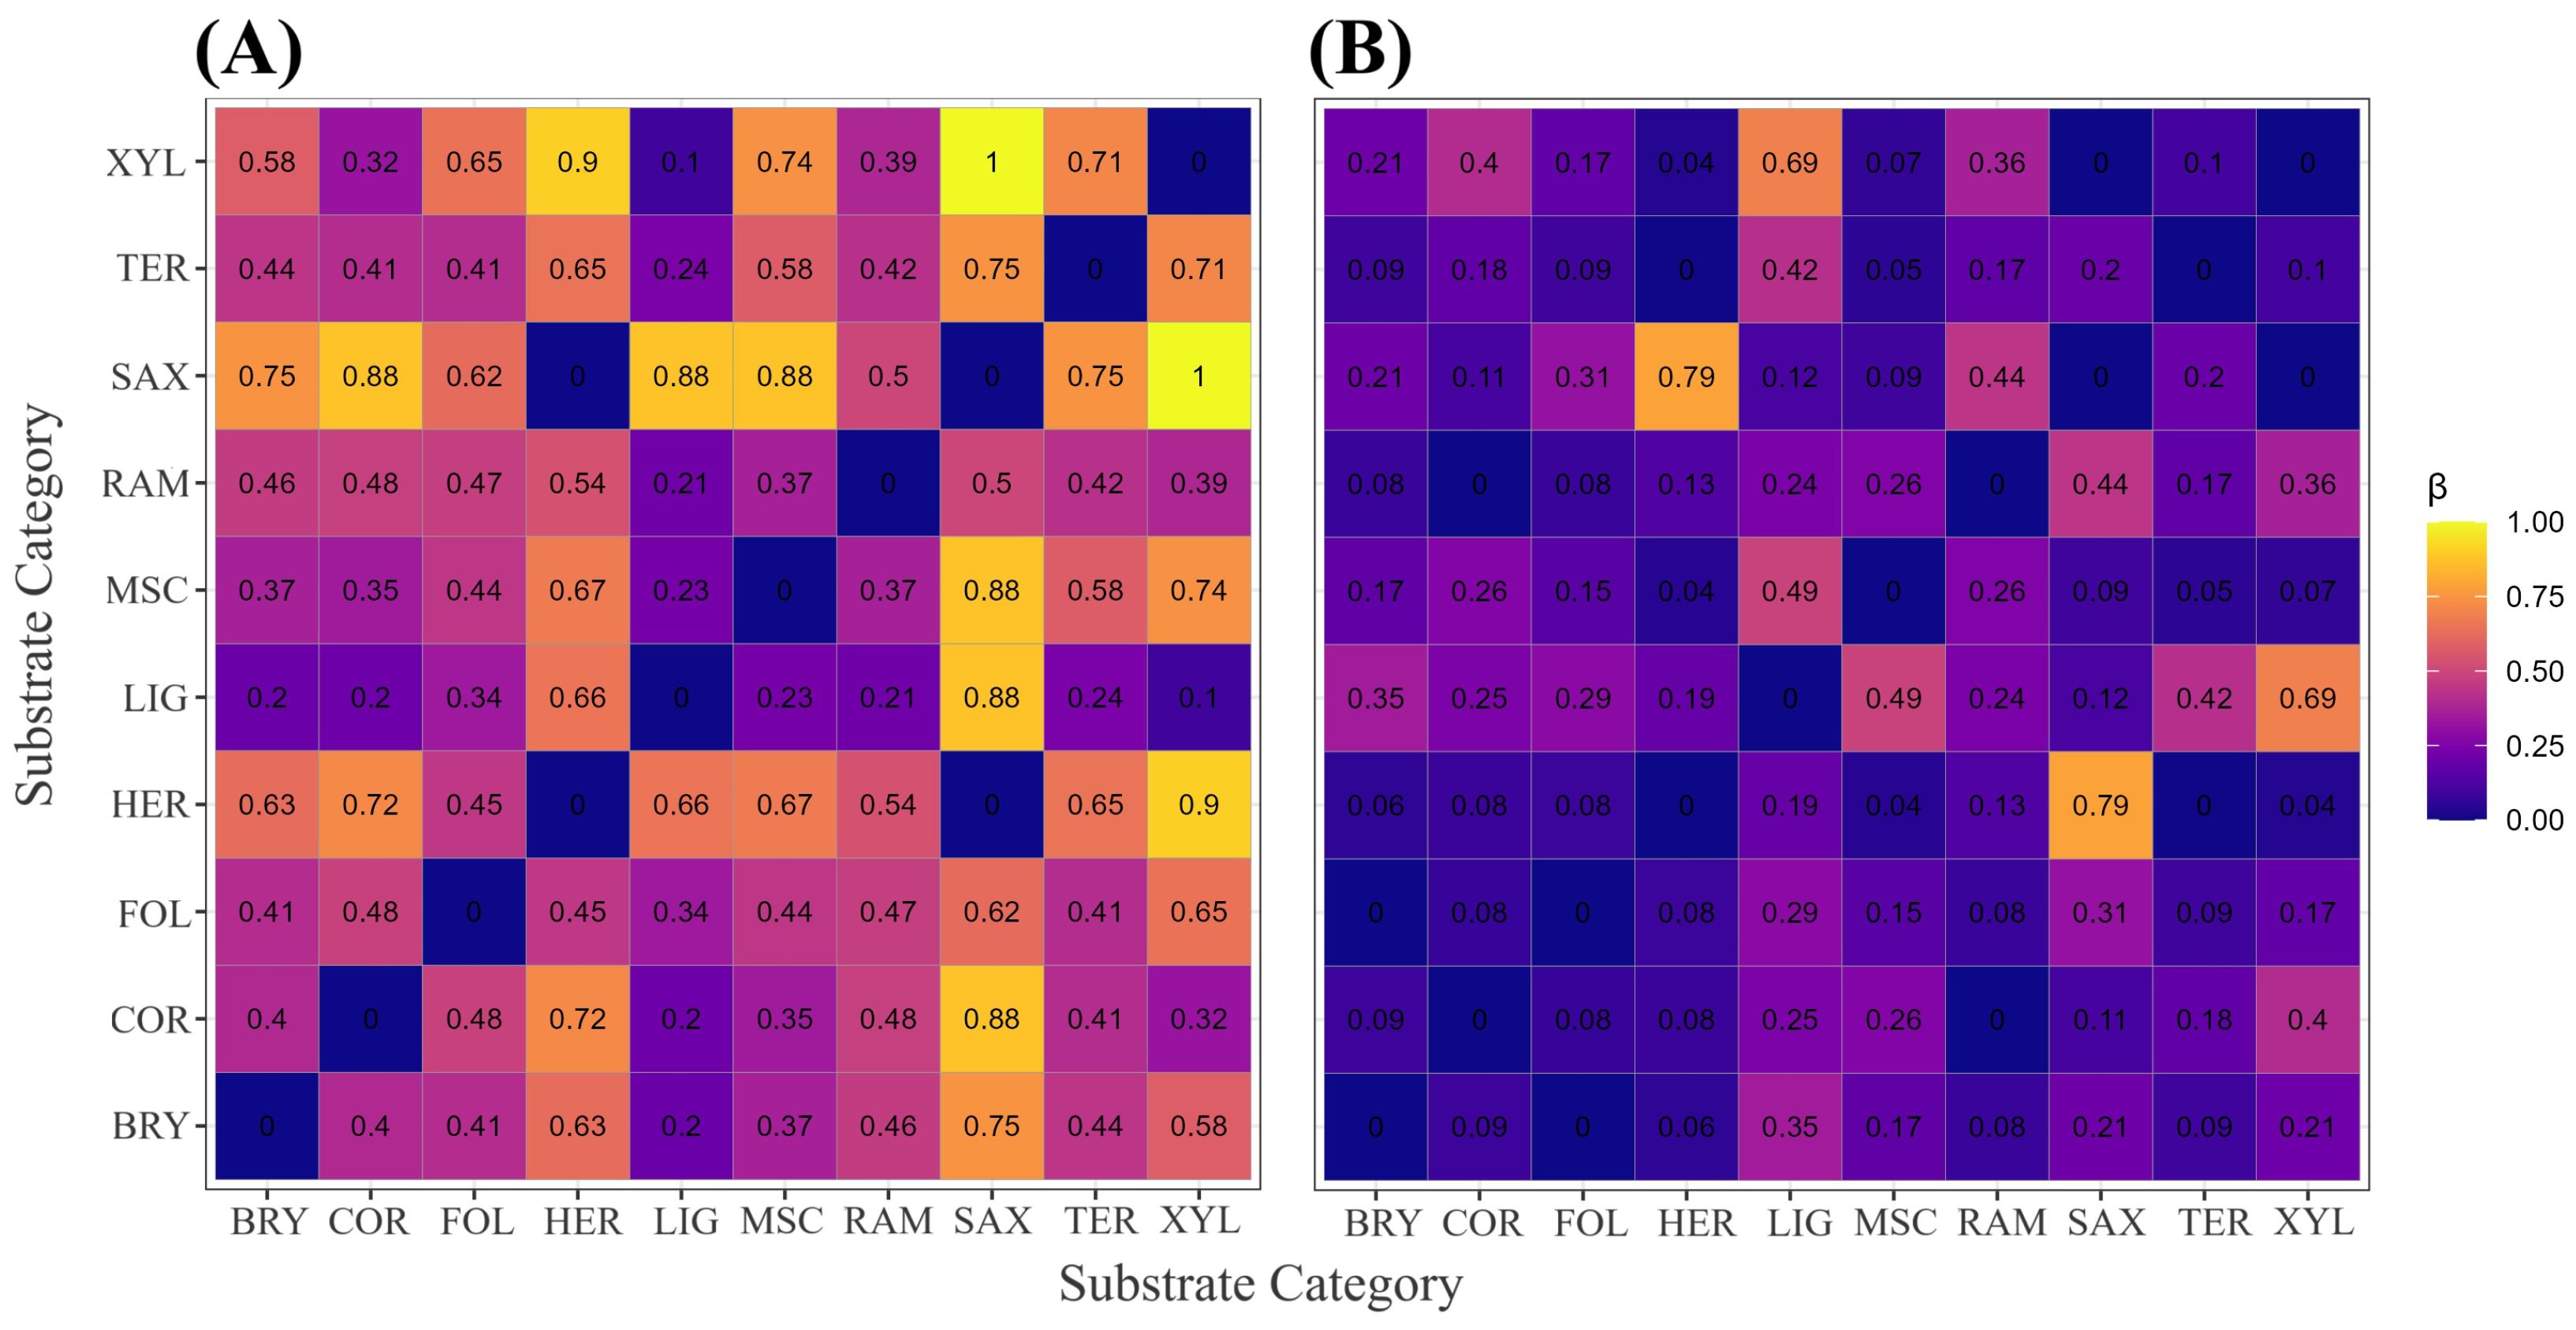
Sørensen-based -diversity among the ten substrate categories. (A) Heatmap of the species-turnover component (); (B) heatmap of the nestedness-resultant component. Cell shading scales from 0 (identical) to 1 (completely distinct). The matrix comprises 45 pairwise comparisons (); each tile reports the corresponding estimate rounded to two decimal places. Analyses are based on 3027 occurrence records with unequivocal substrate annotation. Substrate codes: BRY = bryophilous, COR = corticolous, FOL = foliicolous, HER = herbaceous, LIG = lignicolous, MSC = miscellaneous, RAM = ramicolous, SAX = saxicolous, TER = terricolous, XYL = xylophilous.
Figure 7.
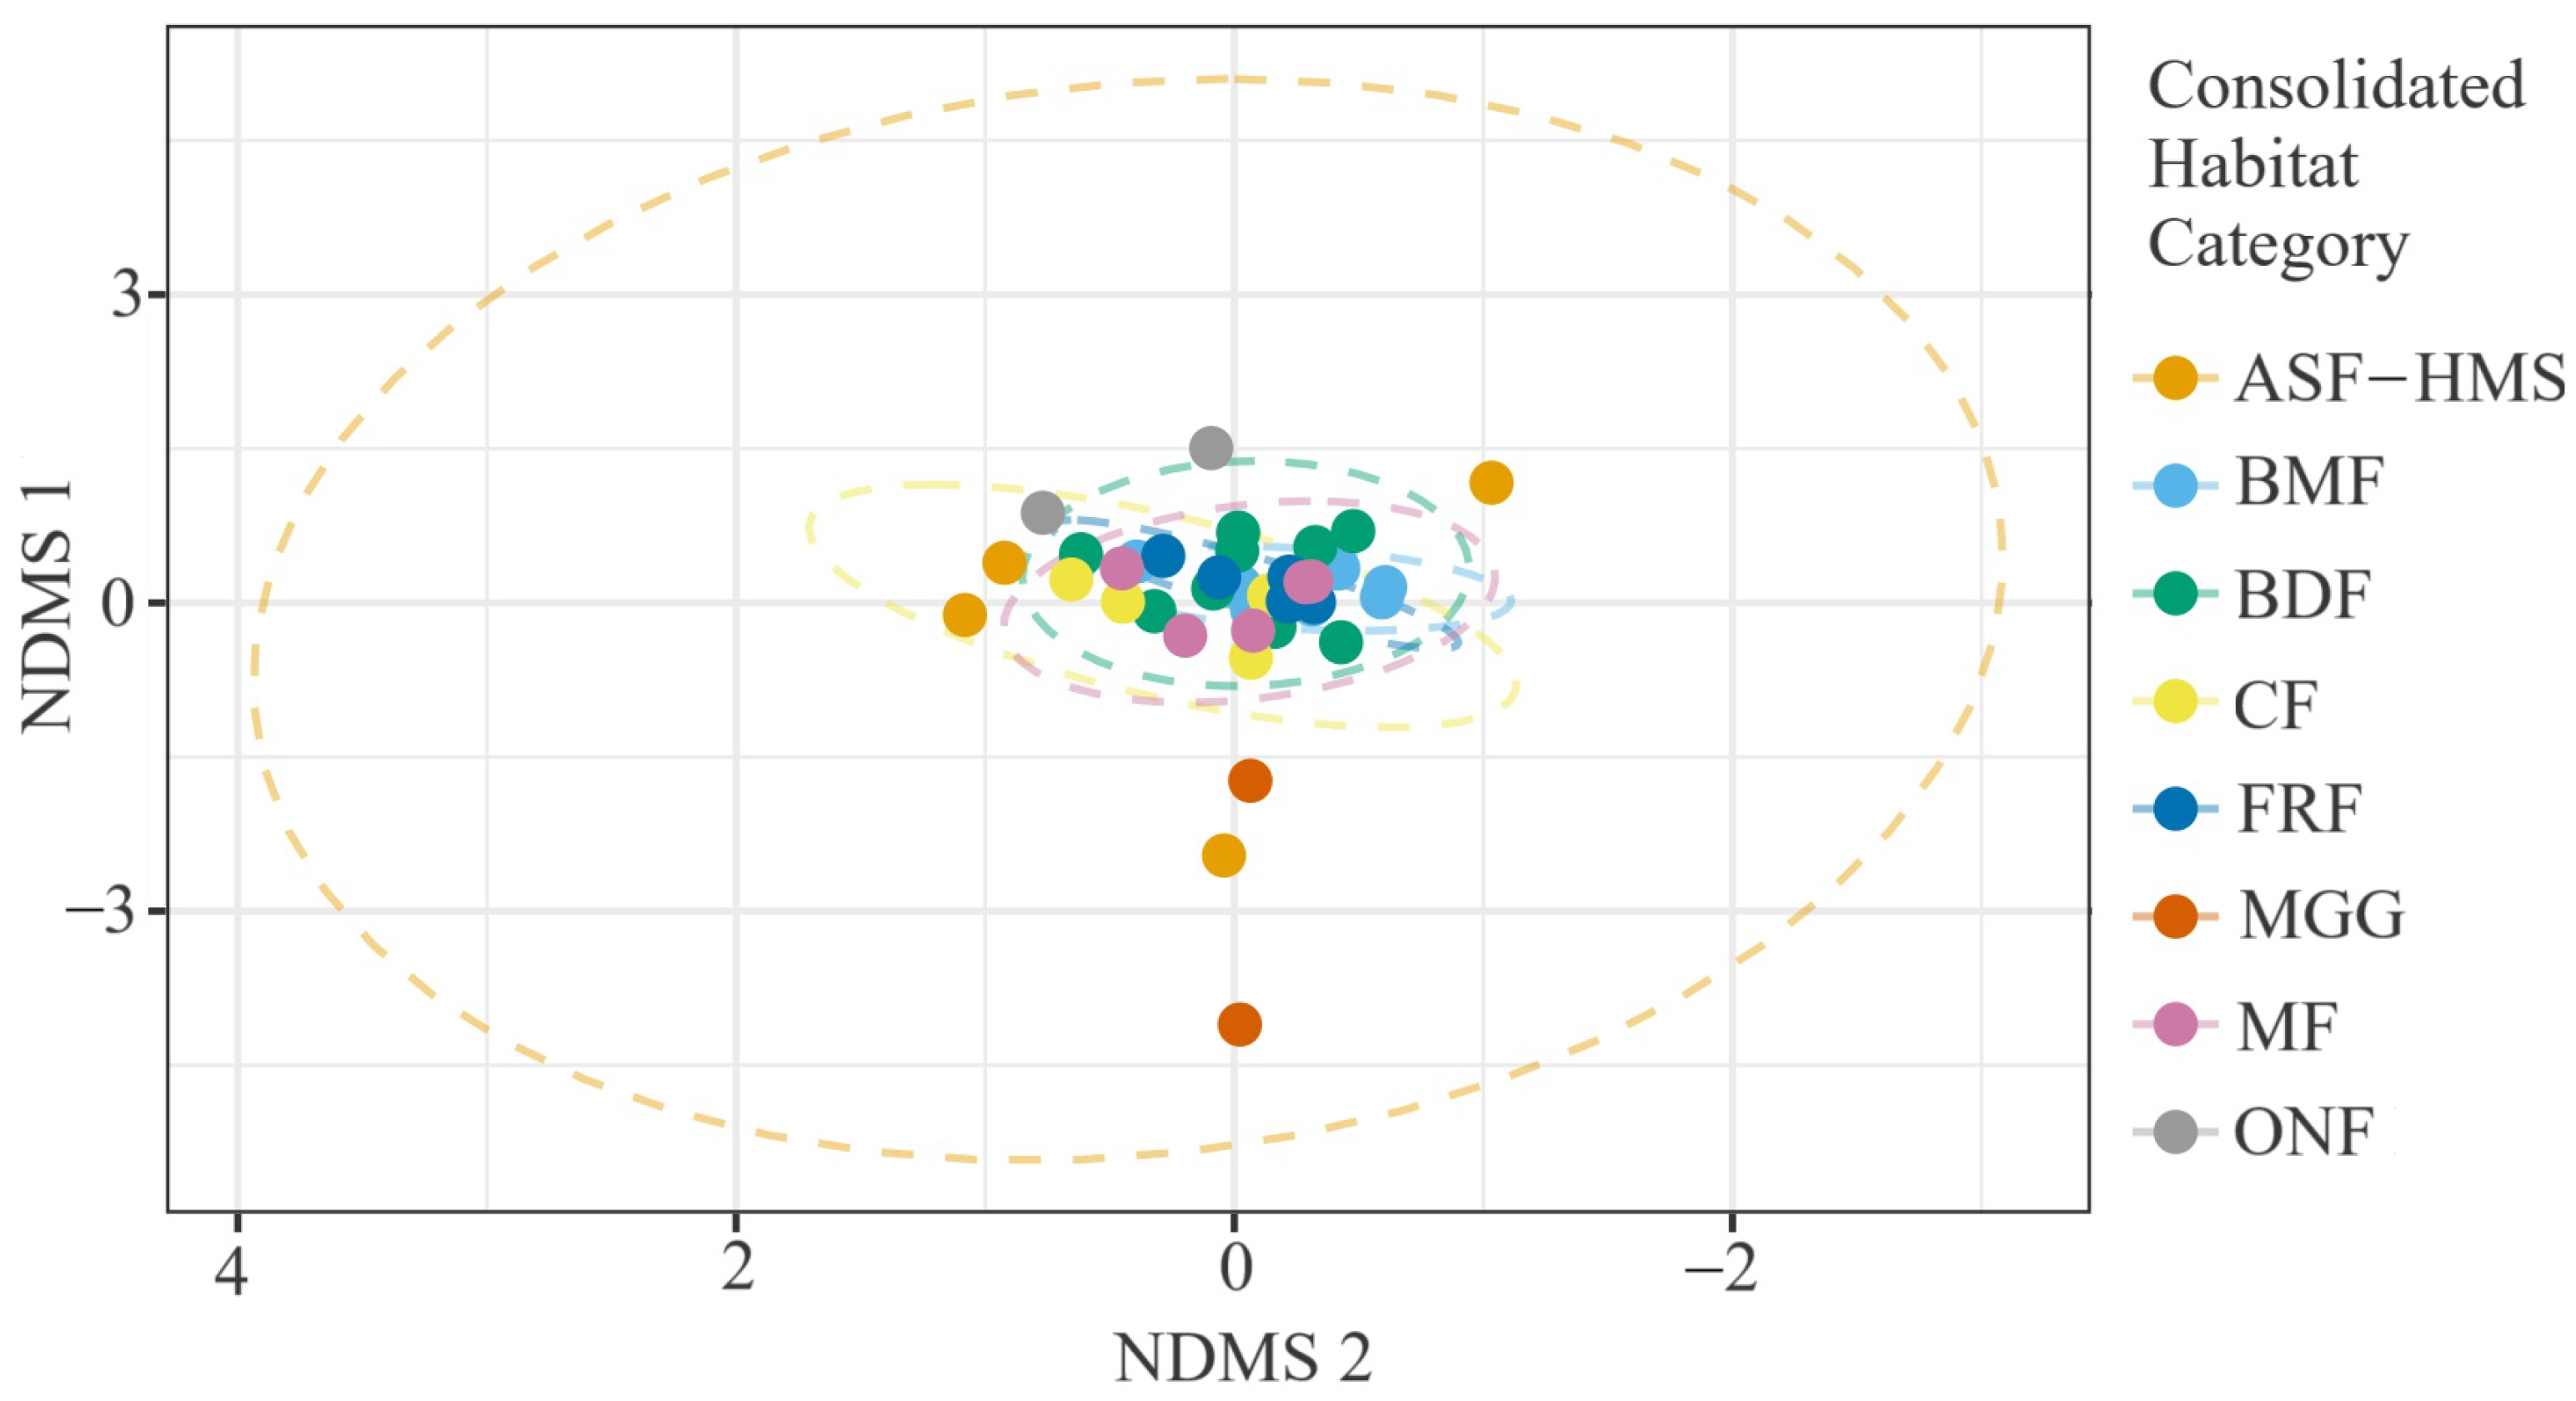
NMDS of 54 true-slime-mould assemblages coloured by habitat class (ASF-HMS, BDF, FRF, CF, MGG, MF, BMF, ONF). Stress = 0.12, ; dashed ellipses denote 95% confidence envelopes around habitat centroids.
Figure 7.
NMDS of 54 true-slime-mould assemblages coloured by habitat class (ASF-HMS, BDF, FRF, CF, MGG, MF, BMF, ONF). Stress = 0.12, ; dashed ellipses denote 95% confidence envelopes around habitat centroids.
Figure 8.
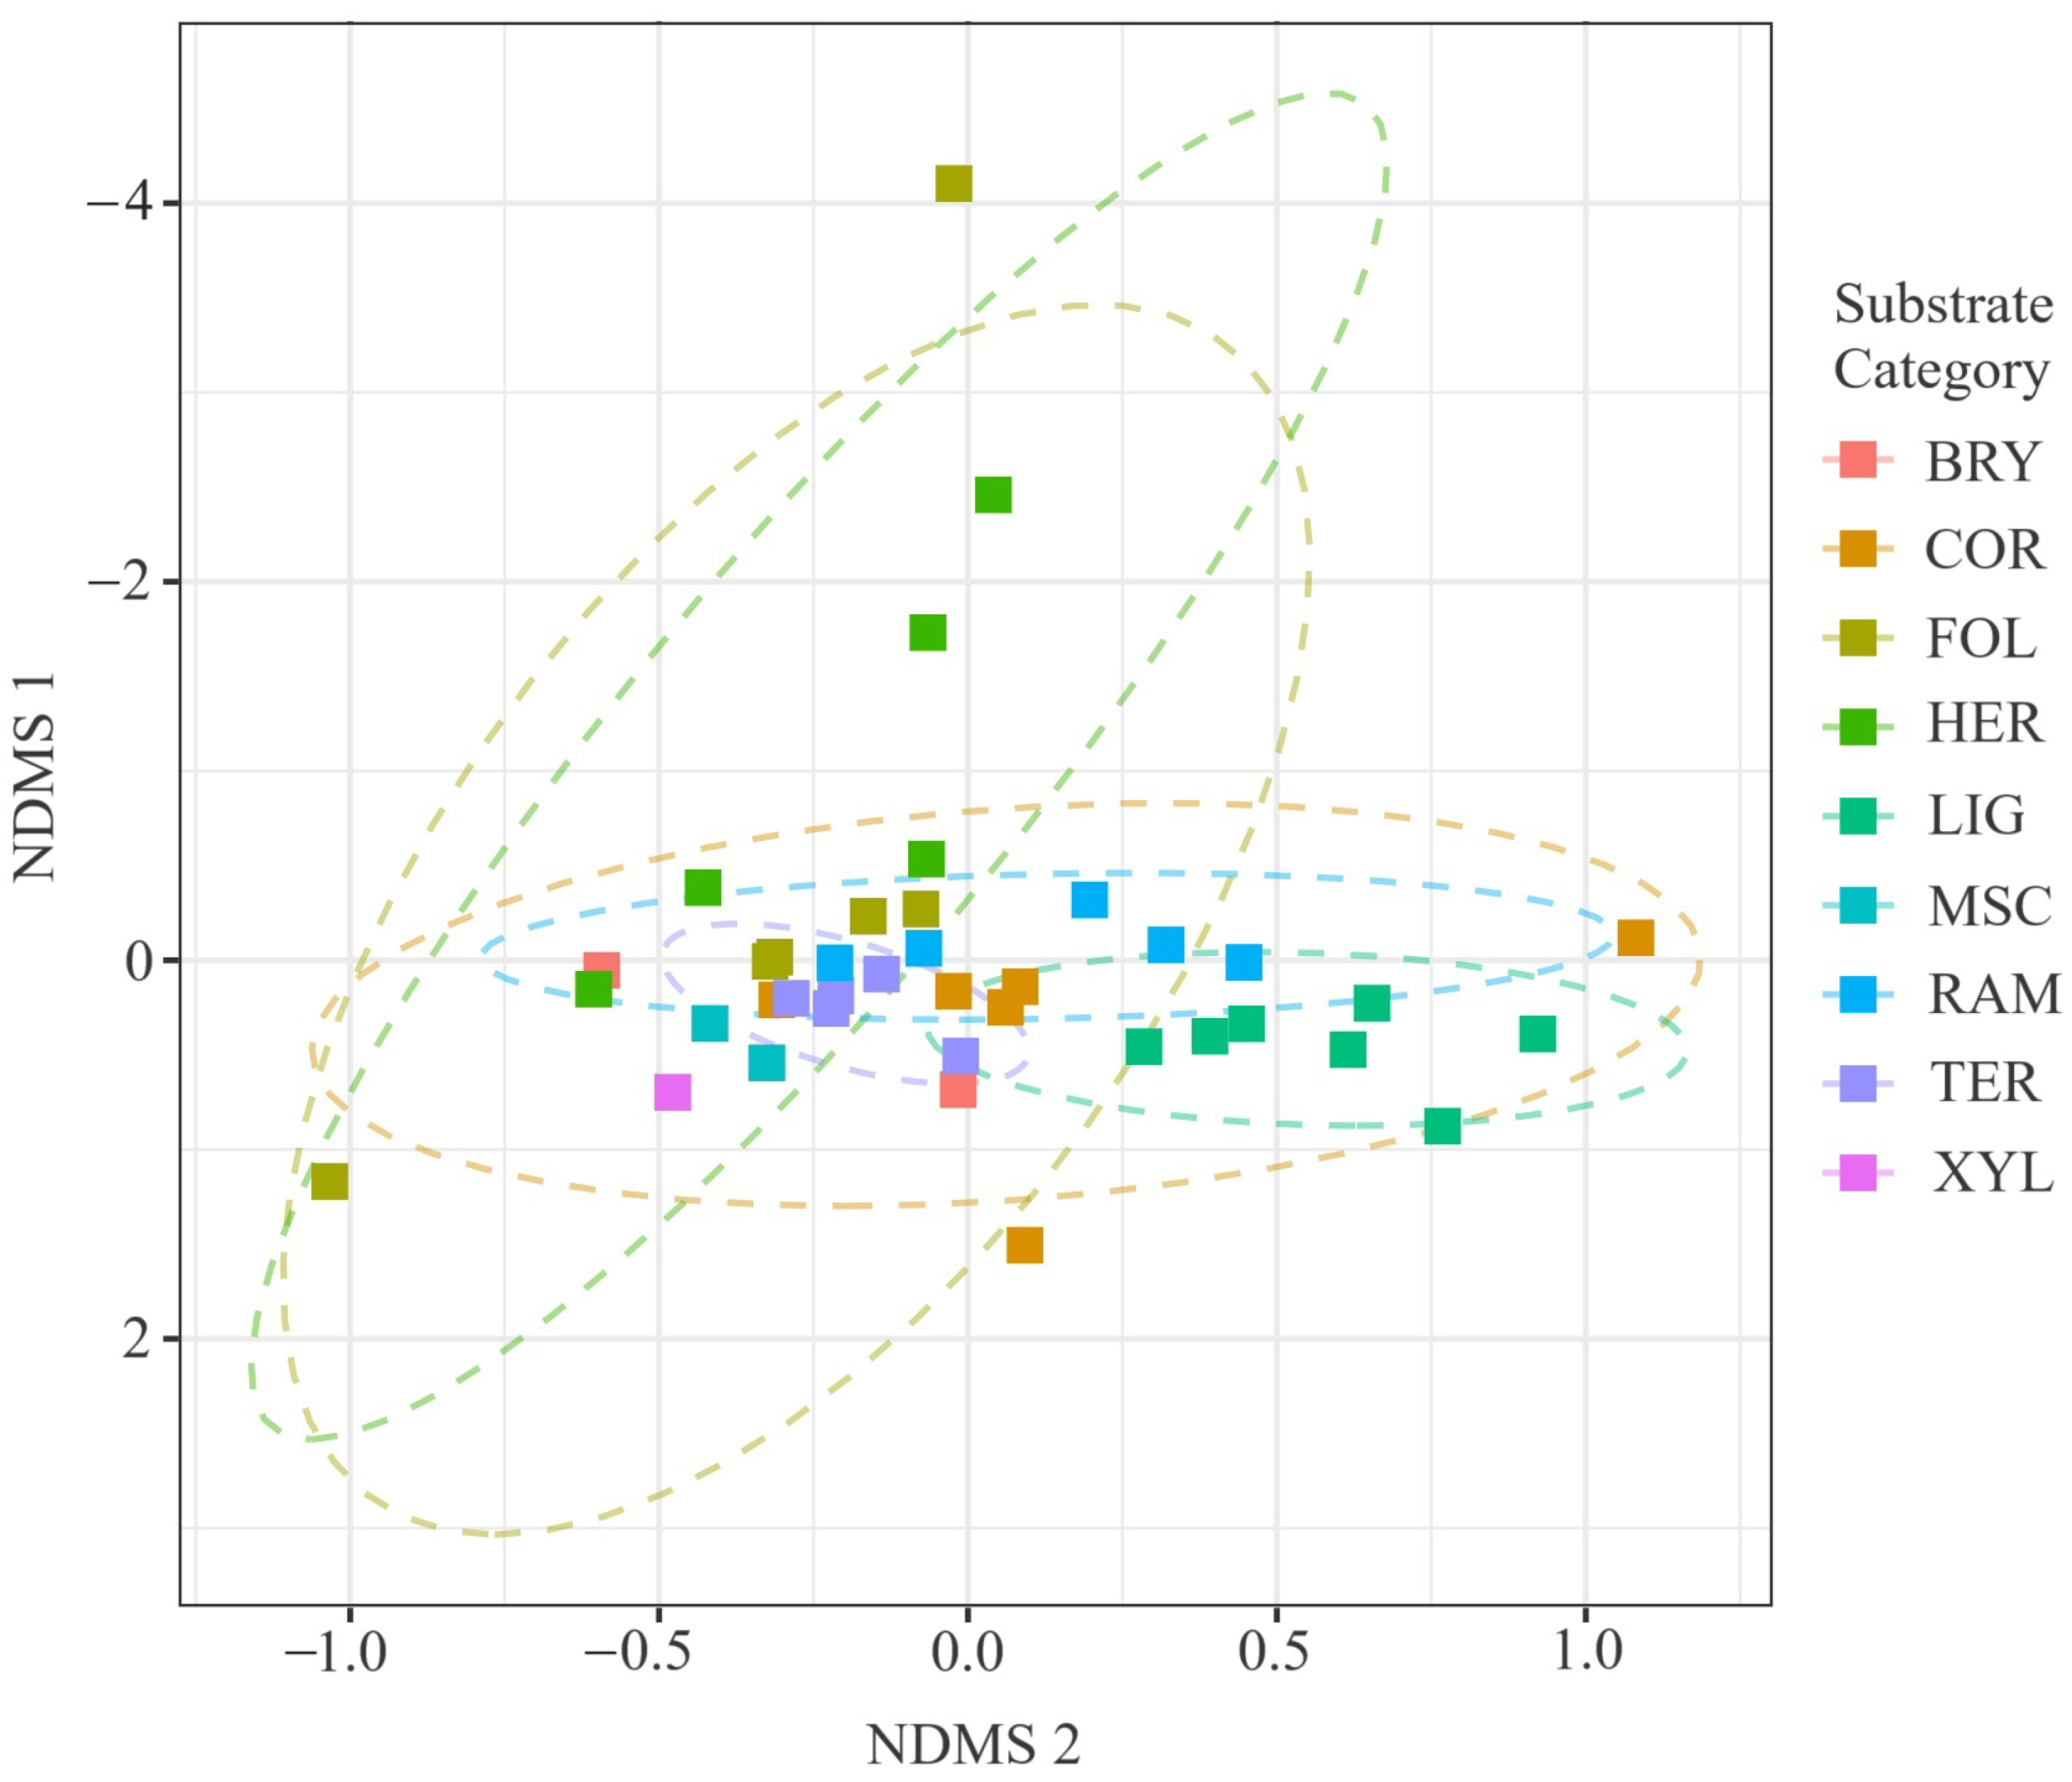
Two-dimensional NMDS ordination of true-slime-mould communities coloured by substrate guild (BRY, COR, FOL, TER, XYL, LIG, HER, SAX, RAM, MSC); dashed ellipses depict 95% confidence envelopes around guild centroids. Stress = 0.12, . Ordination based on 54 composite samples (), drawn from 3027 substrate-annotated records; final stress = 0.12. PERMANOVA confirmed significant compositional differentiation (pseudo-; ; ).
Figure 9.
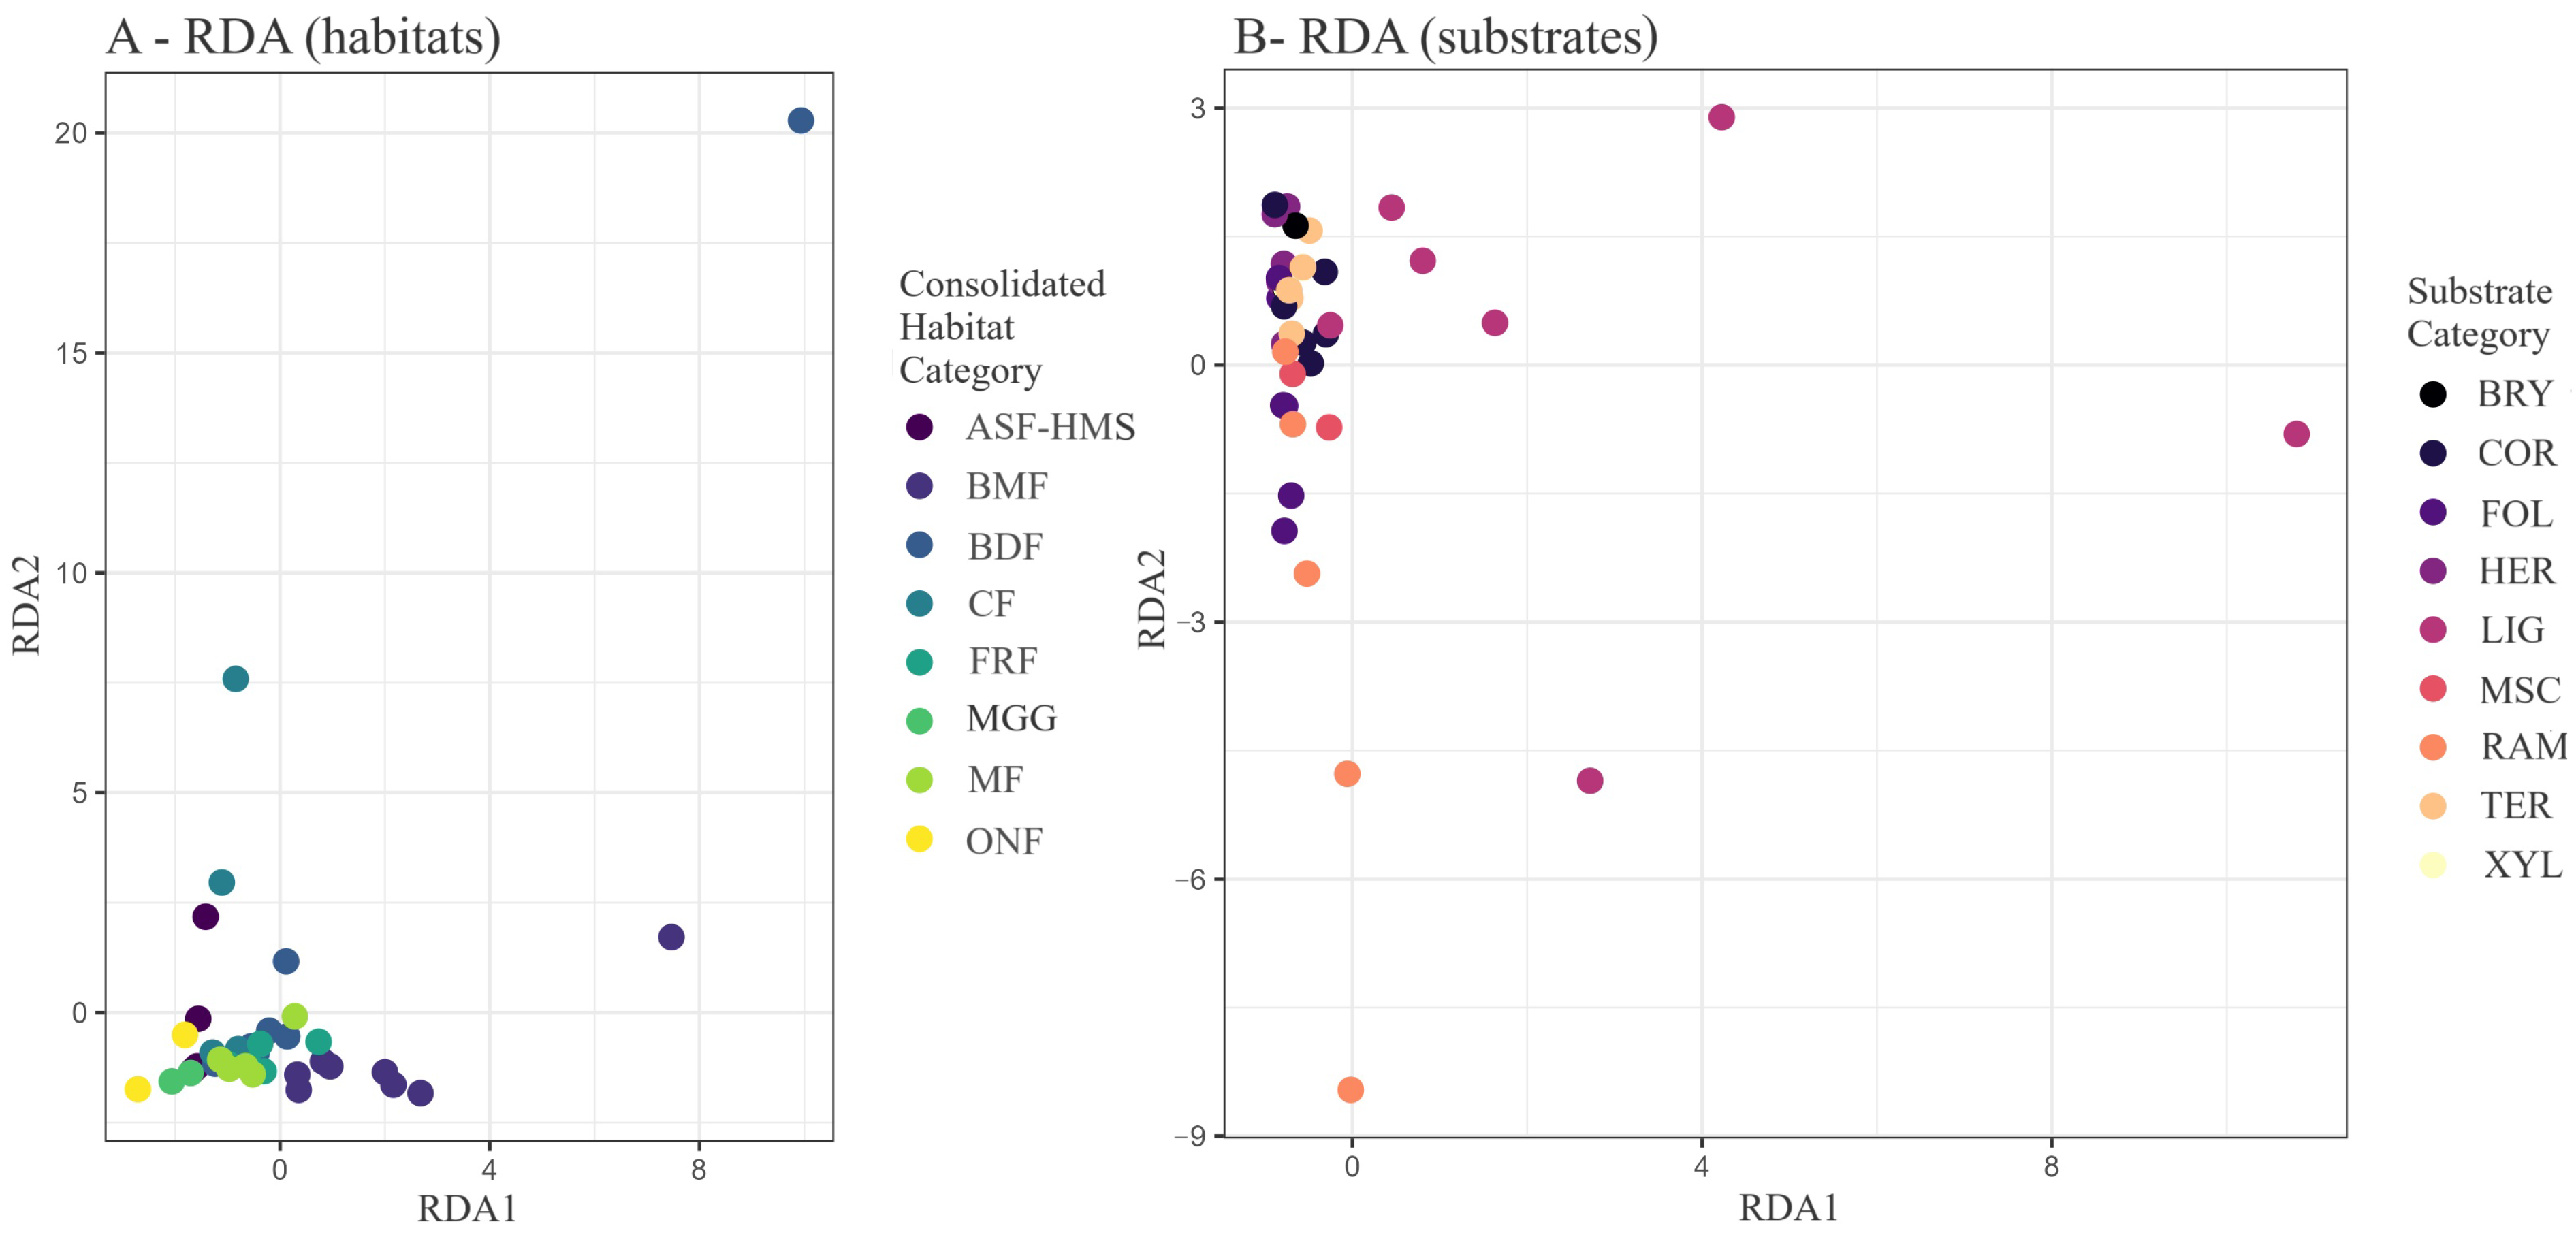
RDA biplot of Hellinger-transformed true slime mould communities. (
A) Samples coloured by habitat class; (
B) the same ordination coloured by substrate guild. Constrained inertia = 71.83; Axis 1 explains 32.2% and Axis 2 explains 5.8% of total variance. The ordination is based on 54 composite habitat–substrate samples constructed from 1556 habitat-annotated and 3027 substrate-annotated occurrence records. Global permutation testing (9999 iterations) returned
and
; axis-specific statistics are provided in
Table 5.
Figure 10.
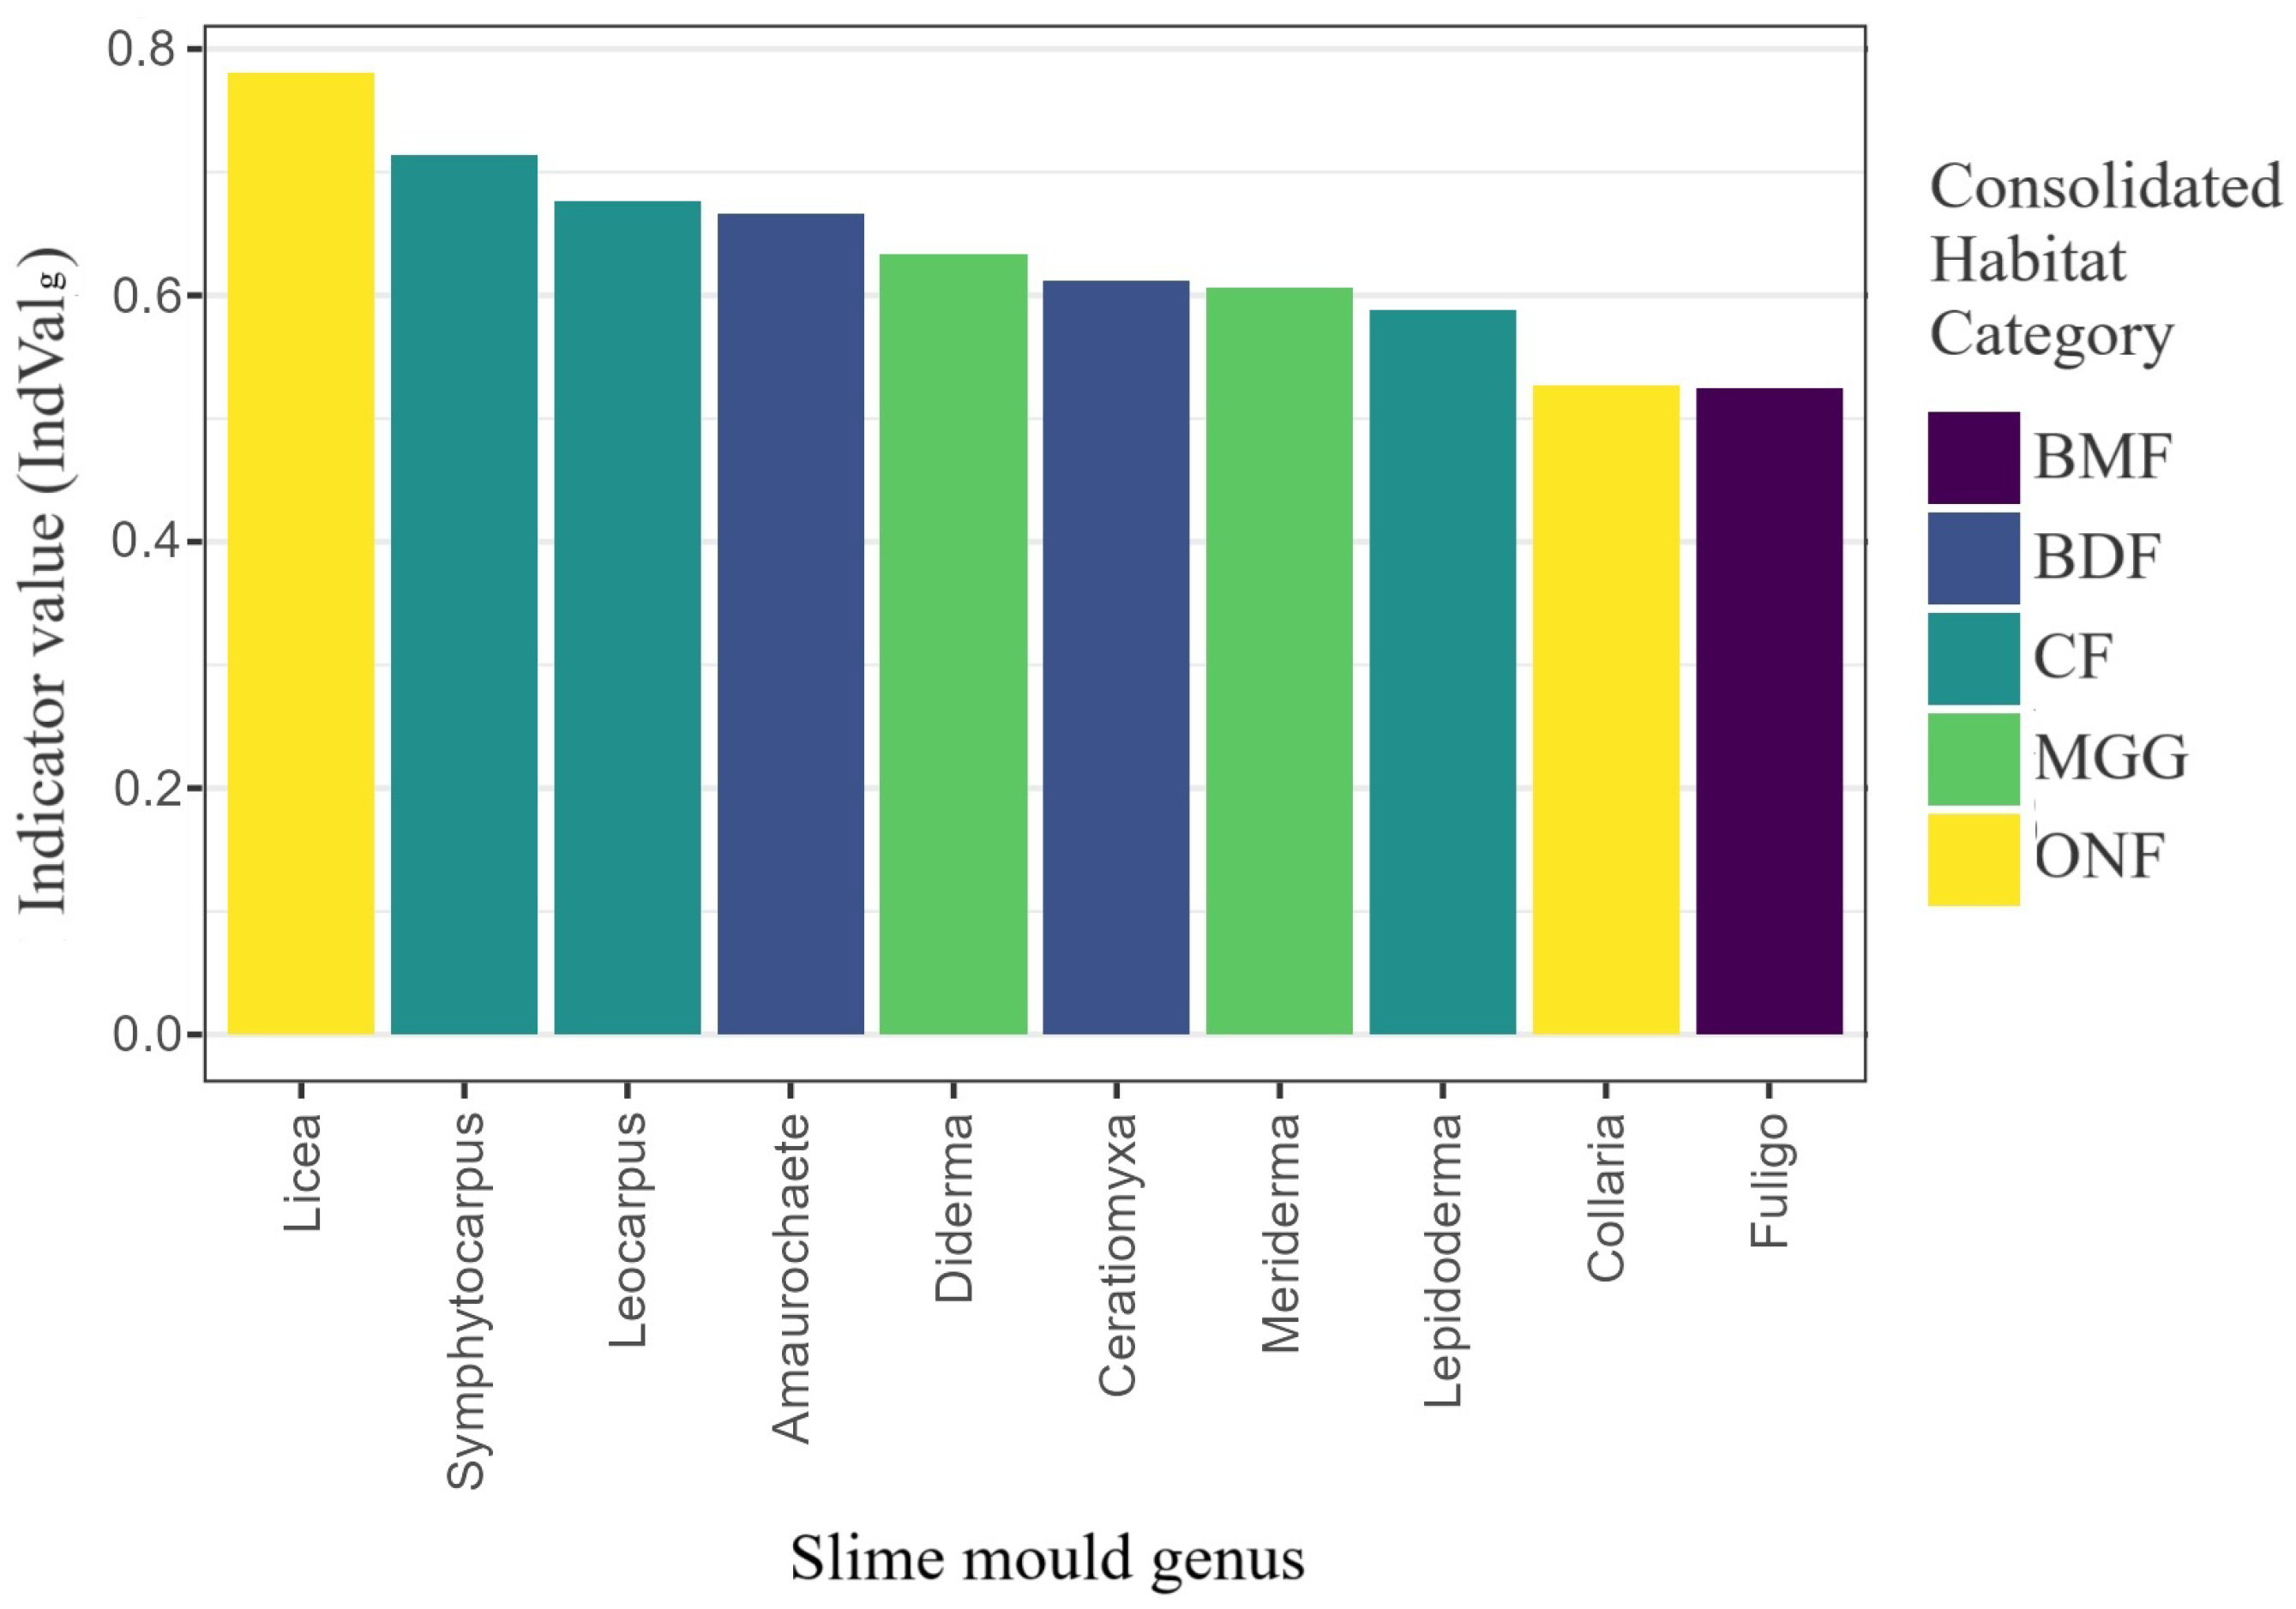
Generalised indicator value (IndValg) for the ten genera most diagnostic of habitat classes. Tested 42 genera derived from 1556 habitat-annotated records; bars coloured by the habitat of maximum fidelity.
Figure 10.
Generalised indicator value (IndValg) for the ten genera most diagnostic of habitat classes. Tested 42 genera derived from 1556 habitat-annotated records; bars coloured by the habitat of maximum fidelity.
Figure 11.
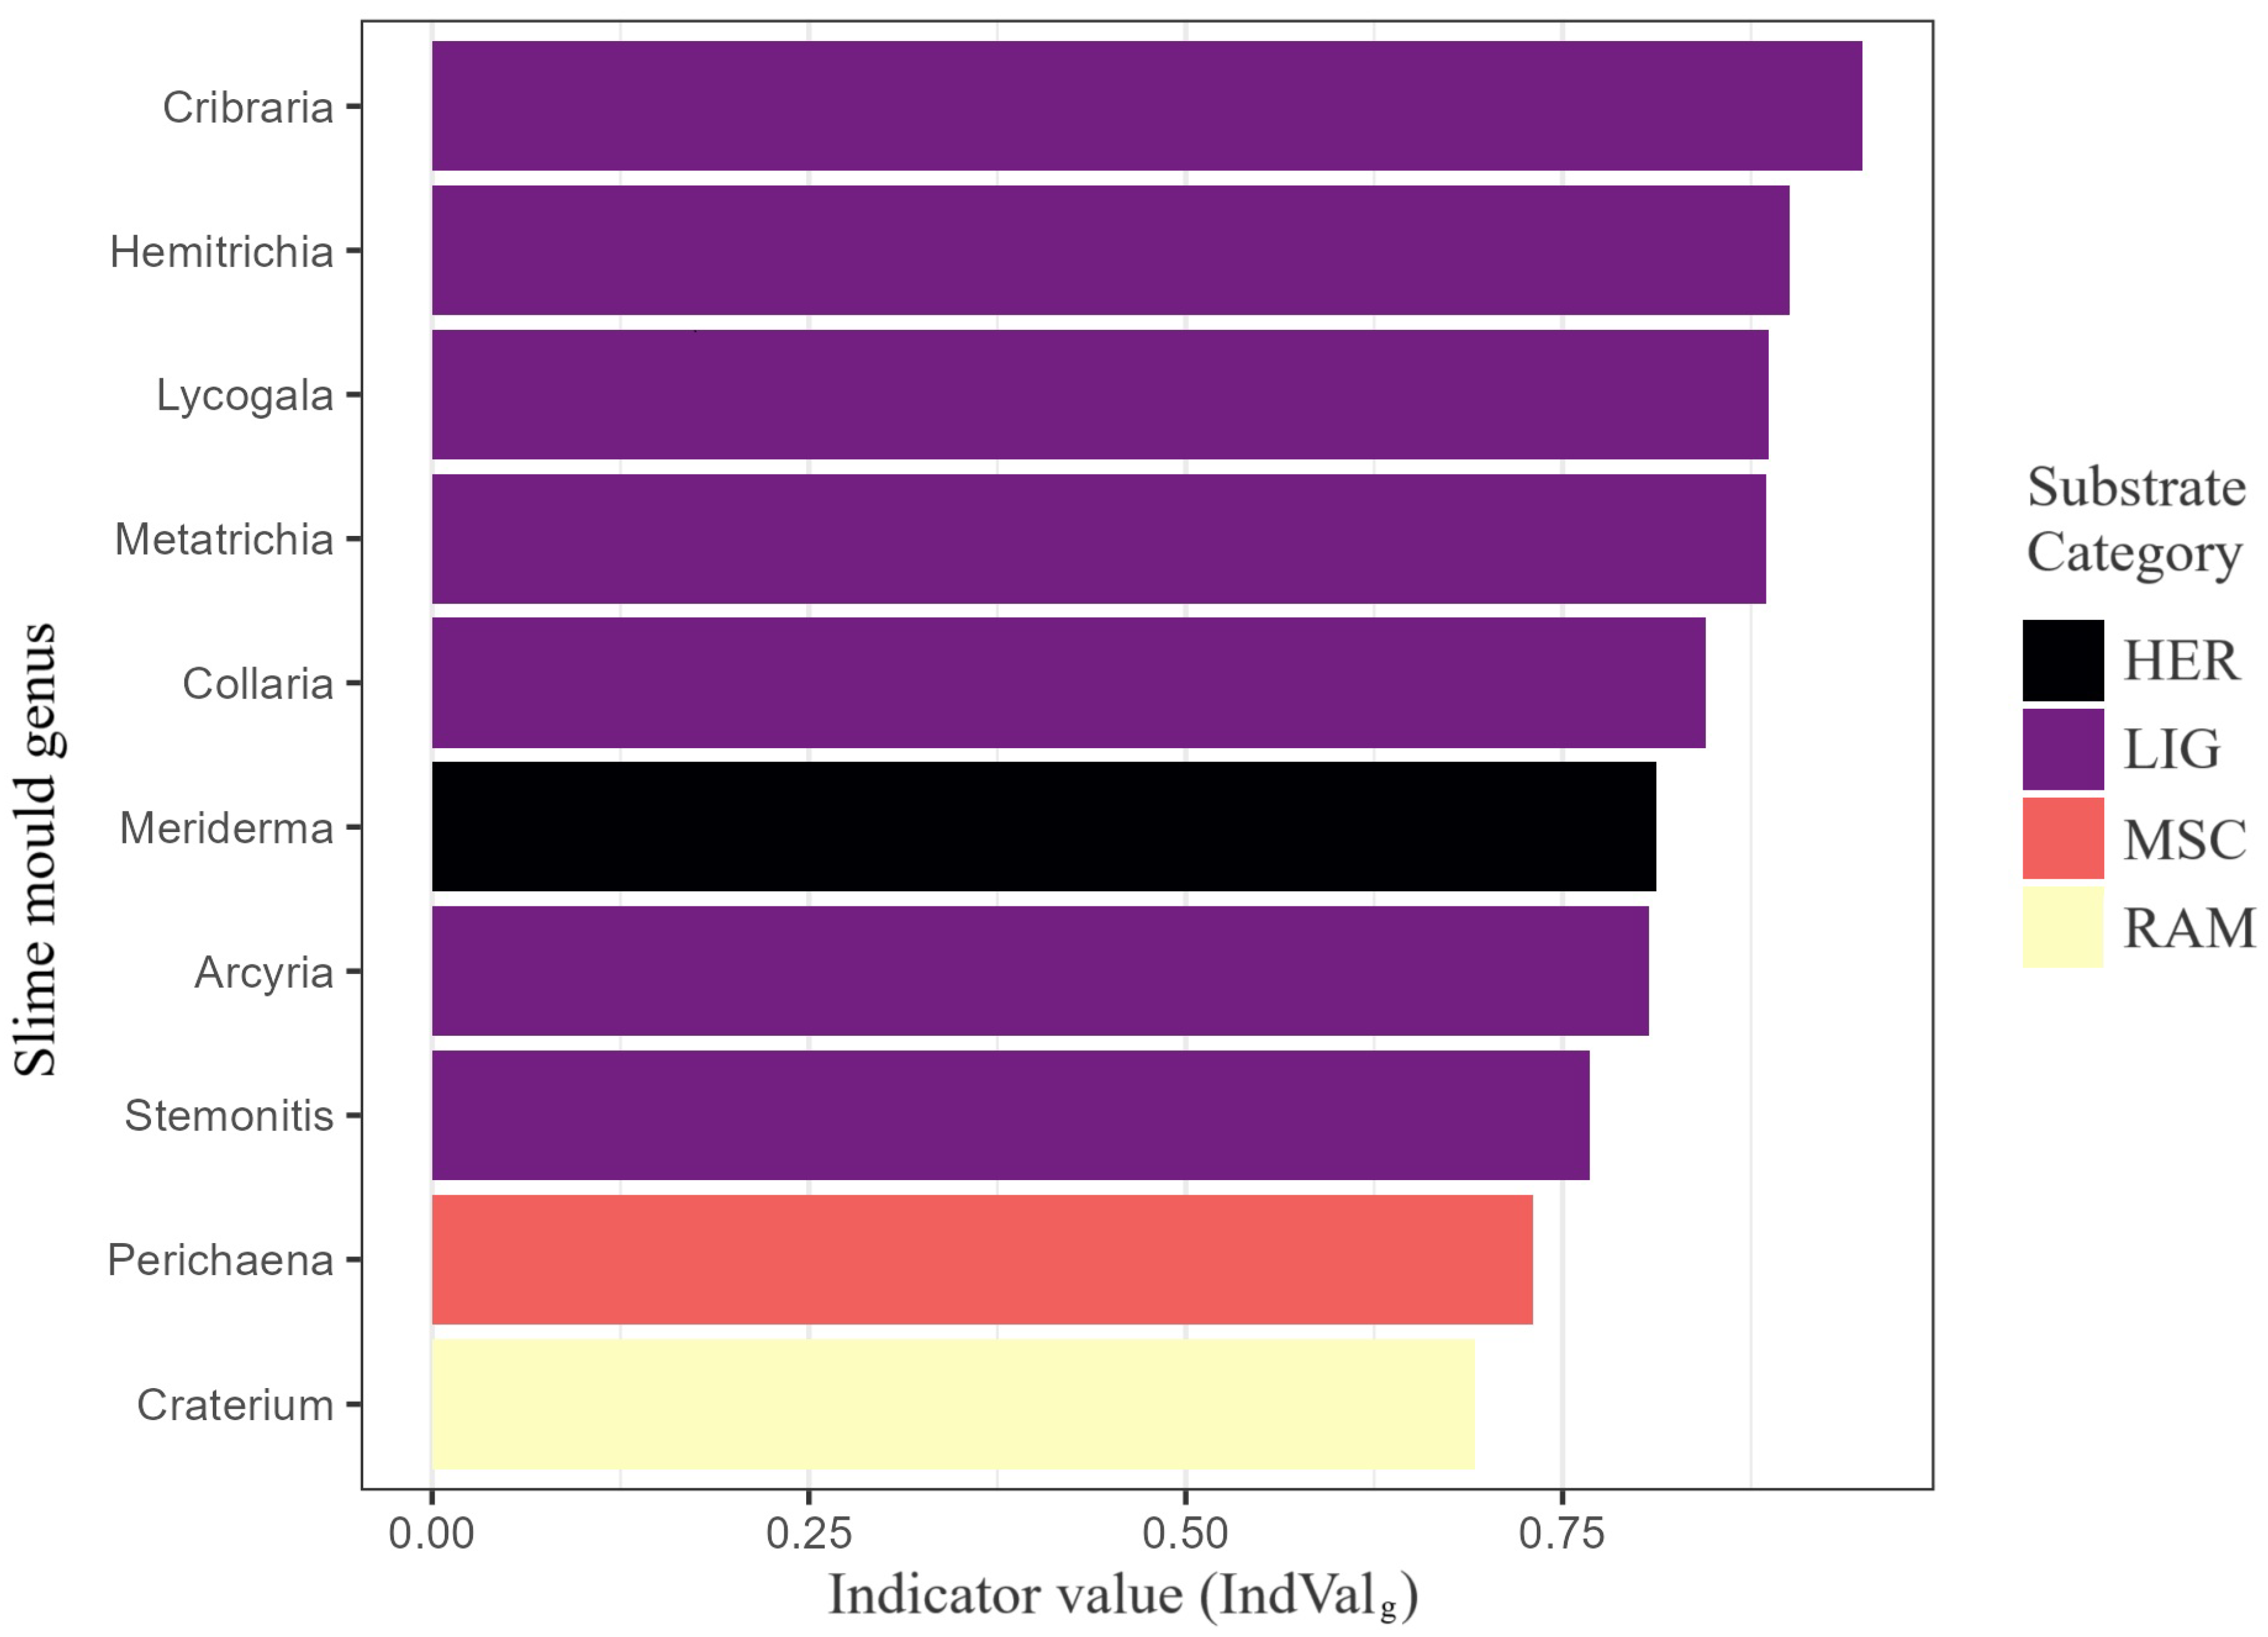
Generalised indicator value (IndValg) for the ten genera most diagnostic of substrate guilds. The analysis evaluated 41 genera derived from 3027 substrate-annotated records distributed across ten substrate categories (BRY, COR, FOL, HER, LIG, MSC, RAM, SAX, TER, XYL). Bars are coloured by the guild of maximum fidelity and ordered by descending IndValg. Genera marked with an asterisk were significant at (9999 permutations). All plotted genera exceed the relevance threshold IndValg = 0.40, underscoring their diagnostic importance.
Figure 12.
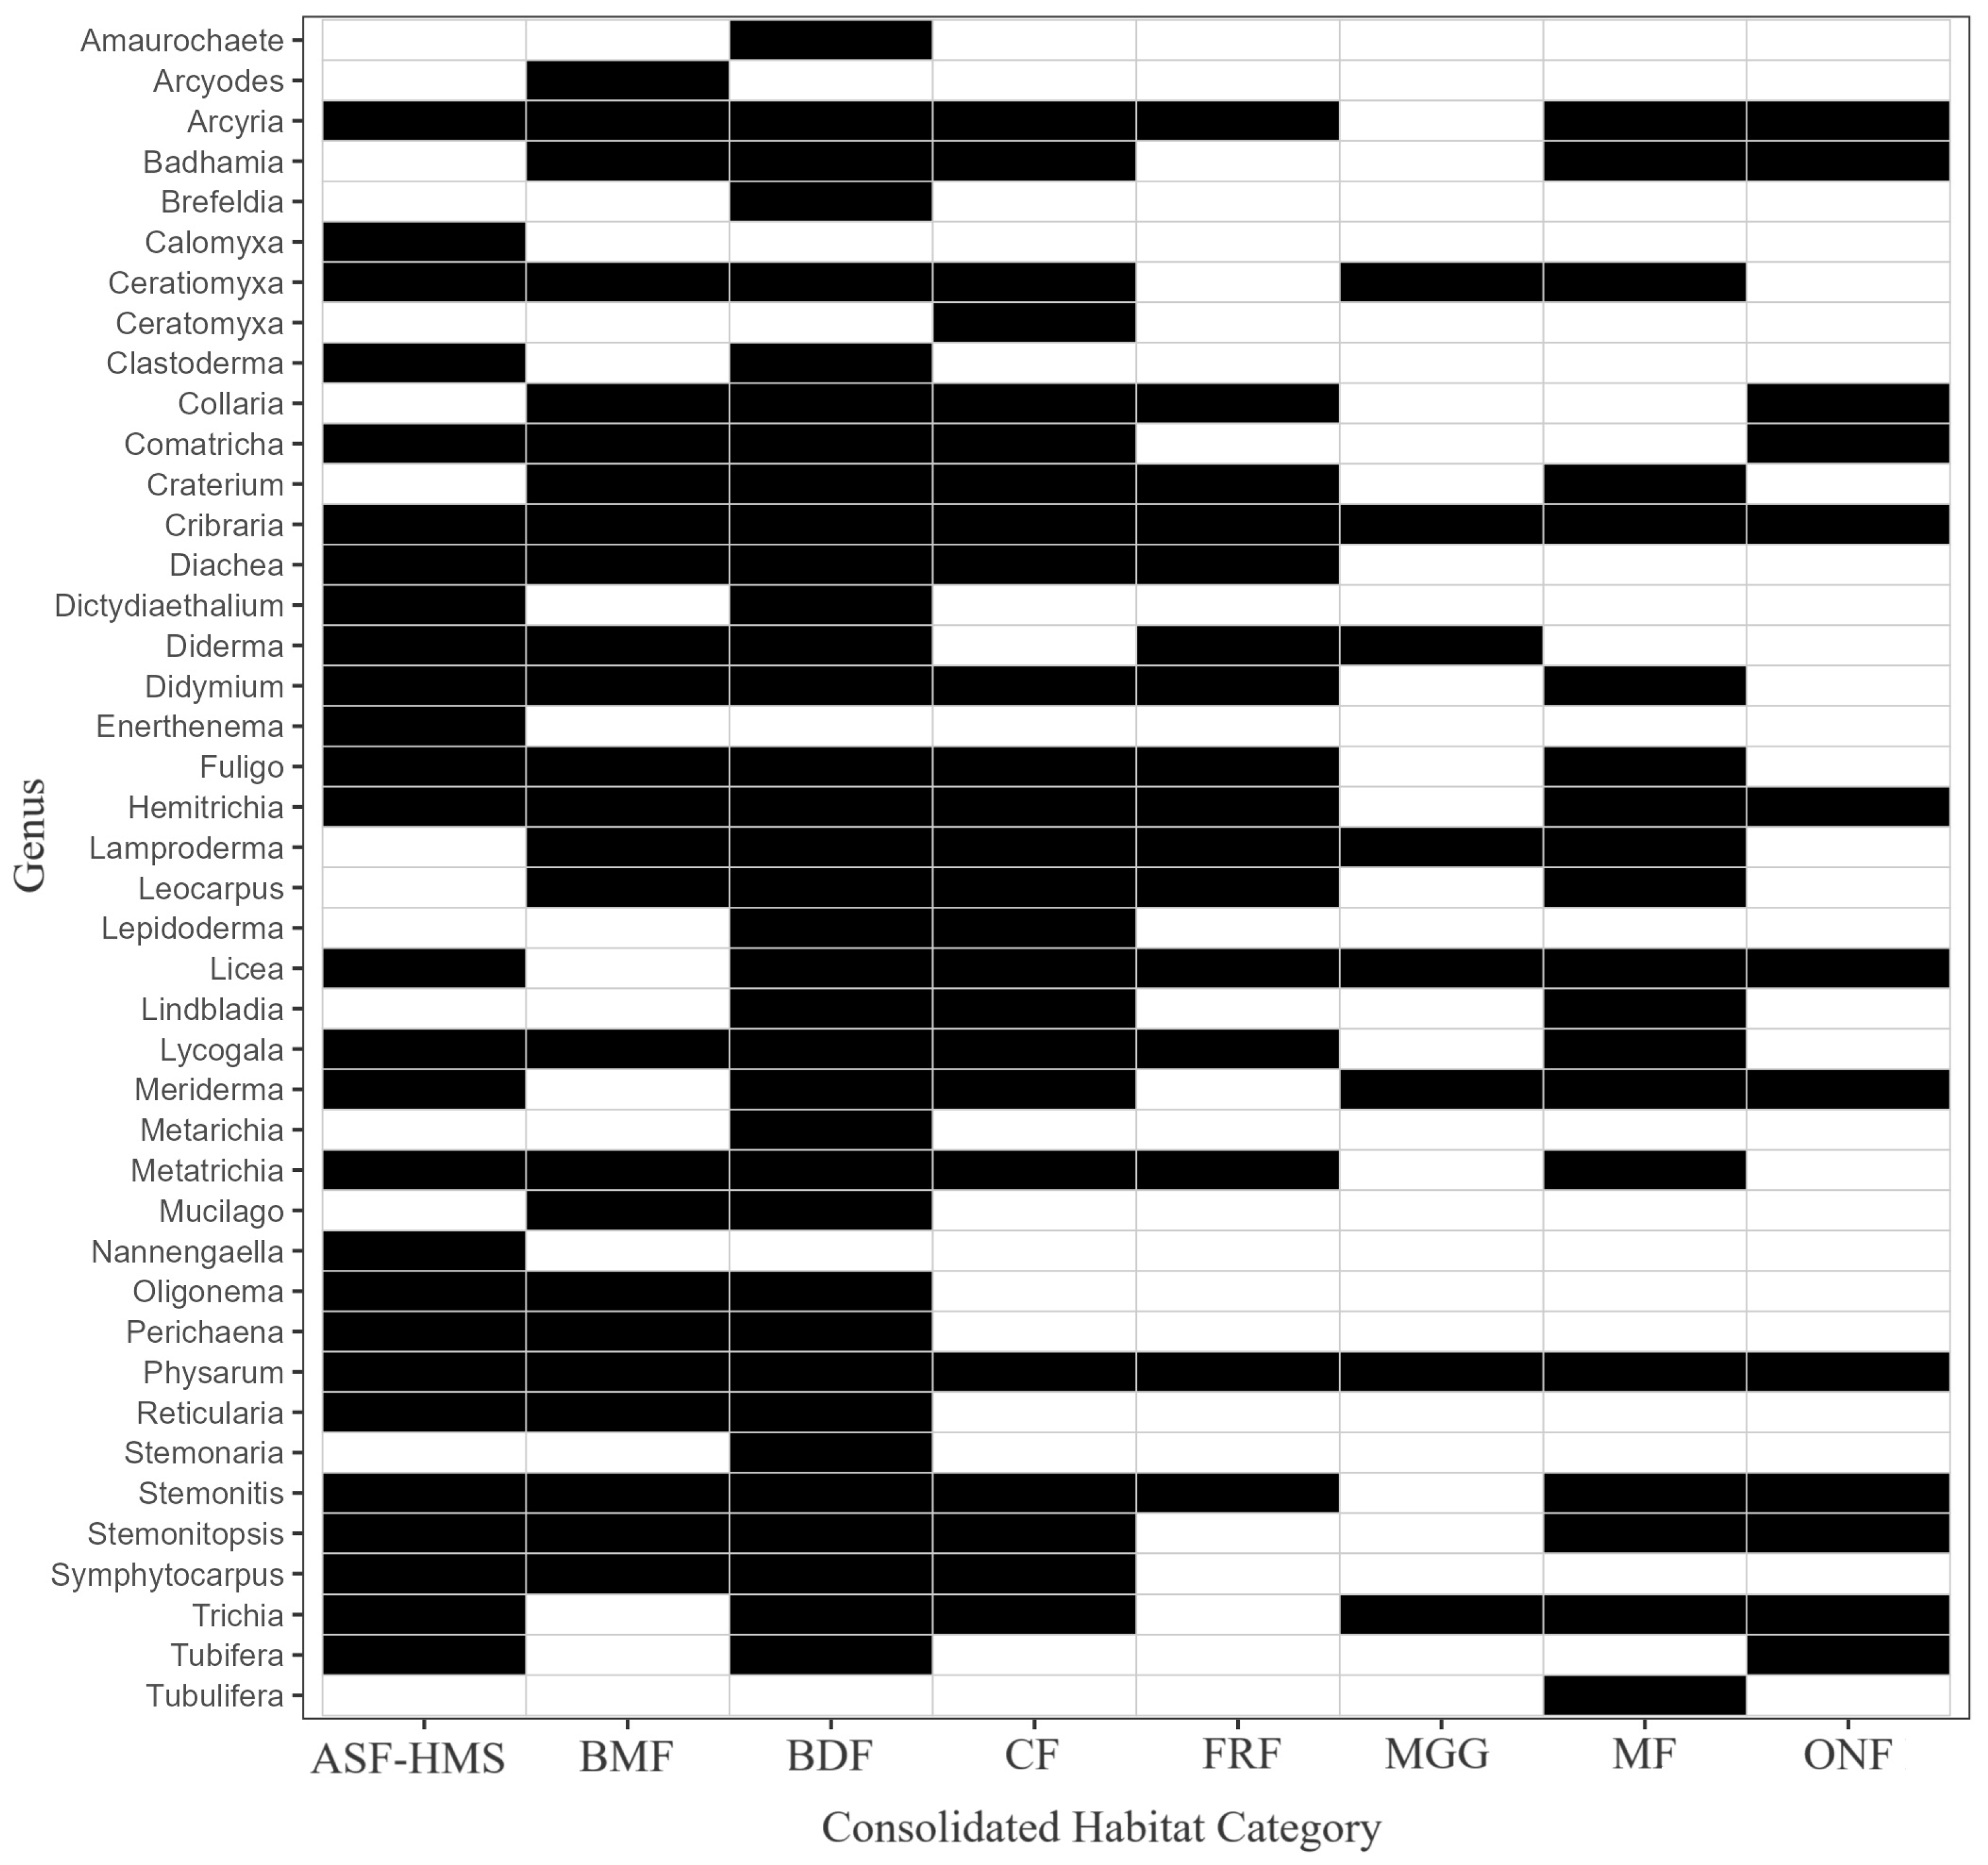
Presence–absence heatmap of 42 Eumycetozoa genera (rows) across 8 habitat classes (columns). Black = present, white = absent; habitats are ordered ecologically from BDF to MGG. The matrix therefore visualises genus–habitat incidence cells, facilitating rapid assessment of habitat specificity and completeness of the sampling inventory.
Table 1.
Categories with constituent habitat types and corresponding Natura 2000 codes used to consolidate all Polish Eumycetozoa records.
Table 1.
Categories with constituent habitat types and corresponding Natura 2000 codes used to consolidate all Polish Eumycetozoa records.
| Overarching Category | Included Habitat Types | Natura 2000 Code(s) |
|---|
| 1. Broadleaved Deciduous Forests | Tilio-Carpinetum—typical, mesic and oligotrophic variants; Dentario glandulosae-Fagetum; Galio odorati-Fagetum; Luzulo pilosae-Fagetum; Stellario-Carpinetum; sessile-oak forests (e.g., Potentillo albae-Quercetum petraeae); Carici albae-Fagetum; lower-montane beech stands; lowland acidic beech forest; beech forest with fir admixture (fir not dominant); Tilio cordatae-Carpinetum betuli; undifferentiated temperate broadleaved woodlands | 9110, 9130, 9150, 9160, 9170, 9180 |
| 2. Coniferous Forests | Pine forests (e.g., Peucedano-Pinetum); montane and subalpine spruce forests; spruce monocultures in managed landscapes; Polysticho-Piceetum and other conifer-dominated communities | 9410, 91T0, 91U0, 91R0 |
| 3. Mixed Forests | Mixed pine forests (e.g., Serratulo-Pinetum); beech–fir–spruce mixed stands; Polysticho-Piceetum with co-dominant conifers and broadleaves; other mixed deciduous–coniferous woodlands | No single dedicated code; overlaps locally with 9130, 9170, 9410, 91T0 |
| 4. Alpine/Subalpine and High-Mountain Shrublands | Subalpine dwarf-shrub communities above the treeline; dwarf mountain pine belts (Pinus mugo krummholz zone); snow-bed shrub assemblages; ericaceous shrub layers with Rubus spp. and Vaccinium myrtillus in high mountains | 4060, 4070, 95A0 |
| 5. Bogs, Mires and Fens | Pinus sylvestris bog woodlands (Vaccinio uliginosi-Pinetum); waterlogged spruce forests (Sphagno girgensohnii-Piceetum); peatland alder carrs (Ribo nigri-Alnetum, Sphagno squarrosi-Alnetum); bog birch stands (Betula pubescens fen woodlands); margins with Ledo-Sphagnetum magellanici; waterlogged peat-forming depressions; willow thickets on bog substrates | 91D0, 7110, 7120, 7140 |
| 6. Floodplain and Riparian Forests | Alder–ash alluvial forests (Circaeo-Alnetum); mineral alluvial alder woodlands; willow thickets in river corridors; moist periodically flooded forests influenced by fluvial processes | 91E0, 91F0 |
| 7. Meadows, Grasslands and Glades | Montane open meadows; semi-natural hay meadows managed by mowing or grazing; subalpine meadows; intra-forest clearings and glades | 6510, 6520, 6230 |
| 8. Other Non-Forested/ Anthropogenic or Unclassified | Non-forest tracts lacking clear vegetation typology; highly modified or urban sites; waterlogged areas with uncertain vegetation; any habitat not matching the above categories or lacking sufficient data | No dedicated Annex I code |
Table 2.
Categories of substratum types used to consolidate all Polish Eumycetozoa records.
Table 2.
Categories of substratum types used to consolidate all Polish Eumycetozoa records.
| Overarching Substrate Category | General Definition |
|---|
| 1. Corticolous | Bark of living or recently dead woody plants, encompassing the outer periderm of trunks, stems and large branches. |
| 2. Lignicolous | Structural xylem tissues in any stage of decay, including logs, stumps and standing trunks of both deciduous and coniferous origin. |
| 3. Ramicolous | Fine woody twigs and branches, whether still attached or fallen, generally <2 cm in diameter. |
| 4. Foliicolous | Photosynthetic foliar organs (leaves, needles) either alive in the canopy or recently abscised and deposited as litter. |
| 5. Bryophilous | Living moss gametophytes and moss-covered substrata. |
| 6. Herbaceous | Aerial parts (stems, shoots) of non-woody vascular plants, including grasses, forbs, ferns and dwarf shrubs, whether alive or senescent. |
| 7. Terricolous | Upper soil horizons, humus layers and surface litter composed of fragmented plant detritus on the forest floor. |
| 8. Saxicolous | Exposed mineral substrata such as rocks, stones and boulders, whether bare or cryptogam-colonised. |
| 9. Xylophilous | Anthropogenically processed wood (e.g., sawn timber, boards, wooden constructions) undergoing natural weathering and decay. |
| 10. Miscellaneous/Unspecified | Rare, atypical or indeterminate substrata not assignable to the above categories, including unspecified decaying organic matter. |
Table 3.
PERMANOVA with bootstrap 95% confidence intervals for pseudo- (999 replicates).
Table 3.
PERMANOVA with bootstrap 95% confidence intervals for pseudo- (999 replicates).
| Factor | df | (95% CI) | F | p |
|---|
| Habitat | 7 | 0.428 (0.37–0.48) | 3.94 | 0.0001 |
| Substrate | 9 | 0.248 (0.19–0.30) | 2.17 | 0.0001 |
| Residual | 23 | 0.324 | — | — |
Table 4.
Inertia (variance) captured by the RDA model and its first two axes. Total unconstrained variance is 68.25.
Table 4.
Inertia (variance) captured by the RDA model and its first two axes. Total unconstrained variance is 68.25.
| Component | Inertia | Proportion of Total (%) |
|---|
| Constrained fraction (all predictors) | 71.83 | 51.3 |
| – RDA1 | 45.08 | 32.2 |
| – RDA2 | 8.07 | 5.8 |
| Unconstrained fraction | 68.25 | 48.7 |
Table 5.
Permutation tests (9999 permutations) for the RDA constrained by habitat and substrate. Boldface marks the marginally significant global effect.
Table 5.
Permutation tests (9999 permutations) for the RDA constrained by habitat and substrate. Boldface marks the marginally significant global effect.
| Effect Tested | df | F | p |
|---|
| Habitat + Substrate (global) | 15 | 1.614 | 0.0596 |
| First canonical axis (RDA1) | 1 | 15.19 | 0.0772 |
| Second canonical axis (RDA2) | 1 | 2.72 | 0.9800 |
Table 6.
Top habitat indicator species ranked by IndVal. Habitat categories follow the abbreviations defined in the main text.
Table 6.
Top habitat indicator species ranked by IndVal. Habitat categories follow the abbreviations defined in the main text.
| Species | Indicator Habitat | IndVal | p |
|---|
| Diderma niveum | MGG | 0.791 | |
| Fuligo septica var. septica | BMF | 0.745 | |
| Ceratiomyxa fruticulosa var. fruticulosa | BDF | 0.743 | |
| Stemonitis pallida | BDF | 0.667 | 0.0011 |
| Lycogala epidendrum | BDF | 0.667 | |
| Diderma alpinum | MGG | 0.628 | 0.0010 |
| Physarum conglomeratum | BMF | 0.577 | 0.0097 |
| Amaurochaete atra | BDF | 0.577 | 0.0103 |
| Physarum leucophaeum | BDF | 0.577 | 0.0096 |
| Diderma globosum var. europaeum | BDF | 0.577 | 0.0078 |
Table 7.
Significant substrate indicator species. Substrate categories follow the abbreviations defined in the main text.
Table 7.
Significant substrate indicator species. Substrate categories follow the abbreviations defined in the main text.
| Species | Target Substrate | IndVal | p |
|---|
| Hemitrichia clavata | LIG | 0.831 | 0.0296 |
| Lycogala epidendrum | LIG | 0.807 | 0.0296 |
| Metatrichia floriformis | LIG | 0.791 | 0.0286 |
| Collaria arcyrionema | LIG | 0.791 | 0.0286 |
| Cribraria vulgaris | LIG | 0.791 | 0.0461 |
| Metatrichia vesparia | LIG | 0.752 | 0.0300 |
| Cribraria argillacea | LIG | 0.750 | 0.0405 |
| Physarum album | LIG | 0.722 | 0.0303 |
| Stemonitis axifera | LIG | 0.690 | 0.0292 |
| Cribraria rufa | LIG | 0.681 | 0.0452 |
| Licea parasitica | COR | 0.649 | 0.0310 |
| Trichia decipiens | LIG | 0.619 | 0.0451 |
| Arcyria denudata | LIG | 0.612 | 0.0488 |
| Arcyria ferruginea | LIG | 0.612 | 0.0488 |
| Cribraria intricata | LIG | 0.612 | 0.0488 |
