Abstract
A common challenge faced by global wood-processing enterprises (WPEs) is their frequent exposure to external shocks. The improvement of regional financial development (RFD) may help WPEs enhance their resilience, thereby enabling them to mitigate external shocks. Against this backdrop, it is worth investigating whether RFD’s improvement can enhance WPEs’ resilience. However, the literature that addresses this issue is scarce. Based on the data of WPEs in mainland China from 2008 to 2016, we evaluate RFD’s effect on WPEs’ resilience. The findings are as follows: RFD can positively affect WPEs’ resilience, and multi-dimensional stability tests confirm the robustness of this result. RFD produces indirect positive effects by enhancing WPEs’ financing capacity and reducing their financing costs. Heterogeneity tests reveal that the RFD’s positive effect manifests in three distinct wood-processing sub-sectors. Crucially, its impact proves significantly greater on small and micro WPEs than on medium and large-sized ones. Furthermore, the positive effects are stronger for WPEs located in central and western provinces and non-municipal districts versus those situated in eastern provinces and municipal districts. Compared with technology- and capital-intensive WPEs, labor-intensive ones benefit more from RFD’s improvement.
1. Introduction
Relying on institutional dividends and low-cost advantages, China’s wood-processing industry has been continuously integrating into the global value chain division system after joining the WTO. China has become the largest producer and an important node in the global supply chain of wood-based forest products. However, this development process has been fraught with difficulties and external negative shocks, such as foreign investigations on anti-dumping and anti-subsidy and the COVID-19 pandemic. Some wood-processing enterprises (WPEs) have effectively resisted adverse changes in the external environment and even transitioned into new development trajectory. In contrast, some have been eliminated from the market or “zombified” [1,2]. The heterogeneous performance of enterprises stems from differences in resilience, which refers to the ability to maintain operational stability and quickly adjust and recover to normal performance levels after encountering disruptive events [3]. The report of “the 20th National Congress of the Communist Party of China” has pointed out that China’s development has entered a period where strategic opportunities and risks coexist, with an increase in unpredictable and uncertain factors. The global marketing environment, which is characterized by uncertainty, instability, volatility, complexity, and ambiguity, has become the new normal that WPEs in China must face. Among them, de-globalization is an important external environment that the WPEs must confront in the world. Therefore, identifying the factors that influence the resilience of WPEs holds significant value for decision-making and has important global implications.
The enhancement of WPEs’ resilience requires continuous technological innovation, equipment upgrades and renovations, and investments in hardware and software for operational management. Most enterprises cannot complete these investments by relying solely on internal capital accumulation [4]. When WPEs encounter external shocks and during the recovery phase after a shock, the local well-developed financial system may quickly provide targeted financial service solutions to enhance firms’ ability and resilience [5]. Regional Financial Development (RFD) refers to the overall accessibility and development level of financial resources within a region, typically measured by the number, diversity, and distribution of financial institutions in that area. From the perspective of financial geographic structure, the spatial mobility and substitutability of financial resources are limited by geographic distance [6]. Financial institutions in the same county should be the optimal suppliers of financial services for WPEs [7]. The competition in China’s financial market has become increasingly intense, which prompts various financial institutions to accelerate their expansion into county markets, thereby leading to a continuous increase in FIBs in a county. The average number of FIBs in our sampled counties increased from 77 in 2008 to 124 in 2016. The increase in FIBs and the growing diversity of financial institutions in a county have significantly enhanced the speed and convenience with which WPEs can access financial services, offering a wider range of financial products and services. However, the geographical distribution of financial resources is uneven. In the sampled counties, the average number of FIBs in municipal and non-municipal areas in 2016 was 195 and 77, respectively. The existing literature is mostly based on provincial-level macro data (such as loan-to-deposit ratio/GDP), which masks the heterogeneity of county-level financial resource distribution [6], while wood-processing enterprises (WPEs) highly rely on county-level financial outlets [7]. As a typical labor-intensive and collaterally scarce industry, the financing constraint mechanism of the wood-processing industry is significantly different from that of high-tech manufacturing, but there is no targeted research to test it. In addition, existing research either relies on a single financial indicator (such as ROA volatility) or uses questionnaire scales, lacking composite indicators that balance survival ability and recovery pathways. Therefore, it is worth studying whether the differences in RFD between counties will lead to differences in WPE elasticity, which has significant international implications.
To sum up, this article uses the natural logarithm of FIB to measure the RFD of a county, enriching the theoretical insights on how RFD enhances firm resilience. Simultaneously examining the development of county-level finance eliminates the interference of differences in the level of county-level financial development, which can more accurately measure the level of regional financial development and its impact on WPE resilience. Combining the theory of financial geographic structure with the three-dimensional framework of enterprise resilience, this study reveals how the density of county-level financial outlets enhances the resilience of WPEs by alleviating financing constraints and reducing financing costs, providing micro evidence for inclusive policies in rural finance in developing countries.
2. Literature Review
2.1. Controversy over the Measurement of Corporate Resilience
A large amount of the literature examines the RFD’s economic effects or identifies key factors affecting enterprise resilience. However, relatively few studies focus specifically on the empirical relationship between RFD and enterprise resilience, particularly within the Chinese market context. This gap in the literature is critical, given the importance of financial development in enhancing firm resilience, especially during external shocks like the COVID-19 pandemic.
Xiao and Xie [8] used data from A-share listed manufacturing companies in China between 2012 and 2019 to examine the impact of RFD on enterprise resilience. Their findings suggest that RFD positively influences resilience, with better access to financial resources helping enterprises recover from disruptions. However, Yang et al. [9], based on data from privately listed companies in the Shanghai and Shenzhen stock markets from 21 January 2020 to 31 July 2020, found that RFD did not have a significant effect on enterprise resilience during the COVID-19 pandemic. These studies primarily measured RFD using the ratio of loan and deposit balances of financial institutions to GDP at the provincial level. While this method provides a broad overview of financial development, it overlooks the spatial distribution of FIBs within provinces and their subsequent effects on firms’ access to financial resources. In addition, the loan and deposit balances of financial institutions in the statistics do not include data from certain types of financial institutions, such as financing companies, financial leasing companies, consumer finance companies, and loan companies. Our survey finds that some WPE owners obtain personal credit loans through financial institutions such as consumer finance and loan companies to support their business operations. Therefore, the measurement methods of the above research cannot fully reflect the financial environment faced by WPEs and cannot scientifically assess the real impacts on their resilience.
2.2. The Application Boundaries of Financial Geography Theory
The existing literature largely overlooks the “polarization effect” of county-level financial agglomeration in China. The geographical distribution of financial resources is uneven, with some counties having significantly more financial institutions than others [6]. Studies based at the provincial level do not capture these variations within provinces, particularly at the county level, where the financial resources available to enterprises may differ drastically. This is particularly relevant for WPEs, which are often located in non-municipal districts or counties with abundant forest resources. In these areas, the number of FIBs varies significantly, and this variation is likely to affect the resilience of WPEs. It is critical to measure RFD at the county level to accurately reflect the financial environment that WPEs face. Our study aims to address this gap by examining the impacts of county-level financial development on WPEs’ resilience, offering a more granular perspective than provincial-level data can provide.
Some of the literature focuses on similar variables, such as the development of the banking market [10], supply chain finance [11,12,13,14], digital finance [15,16], financial support policies [17], and Mutual Credit Systems [18], all of which show positive effects on enterprise resilience. Xia et al. [19] found that enterprises in regions with higher levels of digital financial development experienced fewer losses during the COVID-19 pandemic and recovered faster. Laeven et al. [20] found that digital financial development helps reduce financial risks for enterprises. However, these studies primarily focus on large-scale industrial enterprises or listed companies. The impact of RFD on the resilience of SMEs, particularly in labor-intensive sectors like wood-processing, remains underexplored. Our study specifically aims to address this gap by assessing whether RFD can alleviate the challenges of “difficult financing” and “expensive financing” faced by small and micro WPEs. These enterprises play a crucial role in China’s wood-processing industry, and understanding how RFD supports their resilience is vital for informed policy-making. Additionally, the existing literature has not addressed the imbalance in financial development between municipal and non-municipal districts, nor its impact on enterprise resilience, thus failing to provide realistic evidence for optimizing regional balance policies in financial development. As noted earlier, WPEs are primarily located in non-municipal districts. If the effects of non-municipal districts’ financial development on WPEs’ resilience are ignored, the decision-making basis for designing financial support policies for the wood-processing industry will be insufficient and not entirely scientific.
3. Theoretical Analysis and Research Hypothesis
The core of enhancing WPEs’ resilience lies in strengthening three abilities: Defense and resistance, recovery and adaptation, and development and transformation [21]. As a key production factor, capital accessibility may directly influence these three abilities. According to the perspective of financial geographic structure, financial institutions’ lending and investment have a “local preference” [22], which is influenced by the project’s geographic location rather than solely considering the project’s risk–return ratio [23]. Compared to large banks, local financial institutions are more adept at providing loans and financial services tailored to the specific needs of businesses, particularly during external economic shocks. This flexibility plays a crucial role in helping enterprises maintain liquidity during challenging times. Our survey has found that most WPEs are sparsely distributed in remote timber-producing areas far from cities, making it difficult to meet their financial needs due to the geographical distance from the financial institutions. RFD that involves increasing FIBs at the county level may raise the density of financial institutions within a county, which may intensify market competition [24]. In labor-intensive industries such as wood processing, RFD not only facilitates improvements in capital operations but also offers more opportunities for businesses to respond to market fluctuations. With the support of local financial institutions, many WPEs are able to improve production efficiency and maintain operations during economic downturns, thus strengthening their overall resilience. As a result, these enterprises extend their geographic service radius to rural areas, innovate financial products, and enhance service efficiency. This enables WPEs to gain easier access to external financial support, thereby allowing them to better defend, adapt, and transform in response to external shocks. In summary, a hypothesis is proposed:
H1:
The RFD can enhance WPEs’ resilience.
According to the theory of financial geographic structure, the geographic distribution of financial resources and the geographical proximity between banks and enterprises determine the efficiency of enterprise access to credit resources, as well as the effectiveness of banks’ risk control [25,26]. Petersen and Rajan [27] categorized financial information into hard information, such as standardized financial statements, and soft information that can only be obtained through face-to-face interactions. The more FIBs in a county, the closer the various types of FIBs are to the location of WPEs. This shortens information transmission distance and significantly improves the ability of financial institutions to obtain soft information such as the integrity of business owners, management capabilities, and upstream and downstream cooperation relationships [28]. This may alleviate credit decision risks caused by information asymmetry [27,29], which helps improve the WPEs’ credit accessibility and expand financing channels, thus helping them allocate more financial resources to cope with external shocks. The increase in the number of FIBs within one county may establish information-sharing mechanisms between these branches, which allows for cooperation to optimize credit risk control strategies and respond quickly to WPEs’ financing demands [30,31]. Despite the fact that the data used in this study ends in 2016, the financial systems established before this period continue to have a lasting influence on firms today. The foundational financial structures, particularly those related to regional financial development, have helped create stable relationships between small and medium-sized enterprises (SMEs) and local financial institutions. These long-standing relationships have provided continuous access to financing, especially in areas where financial resources were previously scarce. The mechanisms, such as government-backed credit subsidies, targeted loans, and regional financial cooperation, were established well before 2016 and continue to support businesses today, particularly in maintaining liquidity and financial stability in the face of external shocks, including the ongoing effects of the COVID-19 pandemic. This may alleviate the misallocation of financial resources, enhance both short-term and long-term financing capacity, and reduce the risk of a funding chain breakdown caused by external shocks. In summary, the second hypothesis is proposed:
H2:
The RFD can enhance WPEs’ resilience by strengthening their financing capacity.
The theory of monetary non-neutrality suggests that there are significant differences in credit allocation efficiency among regions, which is caused by the limited geographical mobility of financial resources, information asymmetry, and transaction costs [32]. Financial institutions tend to disperse within their territories, providing proximity-based products to their regional consumer markets, thereby saving on trade costs [31]. The increase in the number of FIBs in a county shortens the geographical distance between the branches and WPEs, thereby reducing the transaction costs incurred when negotiating with distant enterprises. Banks tend to provide loans to enterprises in close proximity [30]. WPEs that are farther from financial institutions need to incur additional costs to obtain loans, such as higher interest rates, resulting in higher overall financing costs for the enterprises. The increase in the number of FIBs in a county stimulates competition in the financial market, which may cause the credit market to gradually shift from a “seller’s market” to a “buyer’s market”. This forces financial institutions to lower loan interest rates, simplify approval processes, and relax collateral requirements. Financial resources being allocated more heavily to large and favorable enterprises and less to small or weaker ones helps reduce WPEs’ financing costs [33,34]. In summary, the increase in county-level FIBs may help WPEs reduce financing costs and provide financial support for enhancing their defense, resilience, and adaptability. Specifically, it may help WPEs access external financial resources at low costs to expand production and sales. In summary, the third hypothesis is proposed:
H3:
RFD can enhance WPEs’ resilience by reducing financing costs.
4. Variable Selection and Data Sources
4.1. Variable Selection
(1) Dependent variable (Y): Common methods for measuring enterprise resilience include the following: First, the scale development method involves designing a measurement scale for enterprise resilience and collecting data through surveys and field interviews [35]. Second, the counterfactual analysis method measures the performance and recovery of enterprises after an external shock, such as anti-dumping investigations [36]. Third, the single- and multiple-indicator measurement methods are based on market and financial indicators. The single-indicator method commonly uses operating income [37], annual volatility of stock returns of listed companies [12], cumulative sales revenue growth over three years [38], the growth rate of sales revenue [39], etc. The multiple-indicator measurement method, such as the one designed by Zou Ying et al. [40], creates an enterprise resilience measurement indicator system based on five dimensions: adaptability, innovation ability, absorptive capacity, recovery ability, and financial capacity. These measurement indicators include absolute and relative indicators, stock and incremental indicators, operational performance, and cash flow indicators, among others. Referring to the studies of Reyns et al. [18] and Xu et al. [16], this paper selects three indicators—main business income, total profit, and net cash flow—for a comprehensive evaluation. The main reason is that enterprise resilience focuses on the survival and long-term development of the enterprise, using the state prior to external shocks as a baseline, emphasizing the examination of the enterprise’s ability to withstand adverse shocks [5]. This is more suitable for capturing the immediate effects of shocks while assuming that every enterprise faces the same crisis, which does not fully align with economic reality. Changes in the main business income and total profit are the most direct indicators of an enterprise’s survival and development, and they simultaneously reflect the enterprise’s short-term performance and long-term development capacity. Net cash flow is a key safeguard for enterprises to cope with unexpected events or economic cycle fluctuations directly related to the enterprise’s capital reserves and debt risks, influencing the enterprise’s ability to respond to emergencies [40]. After calculating the weights of the three indicators based on the entropy weight method, the standardized values of the three indicators are multiplied to obtain a comprehensive evaluation value as the observed value of WPEs’ resilience. This value ranges from 0 to 1, with higher values indicating stronger resilience in the sample enterprise. Subsequently, using the same method, the combined evaluation value of the three indicators and their respective growth rates will be calculated as proxy indicators of enterprise resilience to conduct a robustness test.
(2) Explanatory variable (RFD): Taking the county as the research area and following the studies by Zhou [41] and Chen et al. [7], the natural logarithm of the number of FIBs within the county is chosen to measure RFD. The number of FIBs in each county is calculated as (the number of FIBs in the previous year + the number of newly approved FIBs in the current year—the number of FIBs that are out of control or have exited in the current year). The types of FIBs include development financial institutions, policy banks, commercial banks, rural cooperative banks, urban credit cooperatives, rural credit cooperatives, mutual funds, postal savings outlets, financial asset management companies, trust companies, financial companies, financial leasing companies, auto finance companies, consumer finance companies, loan companies, money brokerage companies, village and town banks, and other financial institutions. The number of FIBs in a county reflects the degree of financial concentration, market competition, and the geographical penetration of financial services, covering the density of financial institution coverage and geographic accessibility in a specific area.
(3) Control variables: Relevant variables that may affect the WPEs’ resilience are included in the model to reduce the endogeneity issues arising from omitted variables. Enterprise size (Size) mainly examines the impact of the size of WPEs on their resilience [42]. Labor input (Labor), technological innovation (Tech), and capital intensity (Capital) mainly investigate the effects of labor, technology, and capital inputs on the WPEs’ resilience, focusing on the impact of development models on enterprise resilience and its differences. Advertising expenditure (Adve) and export volume (Export) mainly examine the impact of marketing strategies and export activities on WPEs’ resilience. Debt capacity (Debt) examines the ability of WPEs to use external capital (debt) to support their operations and expansion, as well as their ability to continuously secure long-term high-quality capital, measured by the debt-to-asset ratio [43]. Financing cost (Finan) reflects the practical situation of “difficult financing” and “expensive financing” for WPEs and its impact on resilience. Given the severe lack of data on interest expenses and the fact that financial expenses include interest expenses and fees from financial institutions, the net value of financing costs is more comprehensively presented by measuring the ratio of financial expenses to main business income. The management expense ratio (Expen) and operating cost (Cost) mainly explore the impact of internal operational management ability and cost control ability on the resilience of enterprises. Policy support (Subsidy) and tax burden (Tax) mainly examine the impact of financial subsidies, tax incentives, and other support policies on WPEs’ resilience and the impact of tax and other institutional costs. The variable names and explanations are shown in Table 1.

Table 1.
Variable interpretation.
4.2. Research Methodology
Considering the unbalanced panel data from 2008 to 2016 for WPEs in 1374 counties of mainland China, the panel data model is selected to examine RFD’s effect on WPEs’ resilience. This approach helps reduce the interference of inter-enterprise heterogeneity and multicollinearity issues of independent variables in model estimation, yielding more robust model estimation results. WPEs have many unobserved factors or factors that cannot be observed due to data source limitations, which remain constant over time and affect the resilience of sample enterprises. In the panel model, the impact of these omitted factors on the robustness of model estimation can be mitigated by controlling individual fixed effects. Therefore, a panel model with both individual and time-fixed effects is constructed as follows:
In this model, Y is the explained variable; RFD is the core explanatory variable. ω represents the impact effect of RFD on Y. α1 and α2 are the coefficients of debt capacity (Debt) and financing cost (Finan) on Y, with these two variables acting as mediators. Control represents control variables, including Size, Labor, Tech, Capital, etc. , , and represent individual fixed effects, time-fixed effects, and error terms, respectively.
4.3. Data Sources
The dataset used in this study, sourced from the National Tax Survey Database, includes data up to 2016. While it is true that this data is somewhat dated, the foundational financial structures and institutional setups that were in place during this period continue to influence the resilience of wood-processing enterprises. The database includes annual surveys of more than 600,000 enterprises since 2008, with tracking survey samples, making it possible to construct (un)balanced panel data. It covers large, medium, small, and micro enterprises, allowing for a more accurate analysis of the heterogeneous effects by enterprise size. Data processing includes removing samples with an operating income or main business income of less than 0, which violate accounting principles or contain obvious logical errors; removing samples with an operating income equal to 0; removing samples with operating costs, total year-end assets, and average annual number of employees equal to 0. When the original data for variables such as export volume, R&D expenses, financing costs, subsidy income, tax refunds, and advertising expenditures are missing, they are assigned a value of 0.
The data for county-level FIBs comes from the China Banking and Insurance Regulatory Commission’s Financial License website (https://xkz.nfra.gov.cn/jr/), with manual retrieval and organization of detailed data on the admission, loss of control, and exit of county-level financial institutions. Based on the four-digit industry code provided by the “Notes on the National Economic Industry Classification 2011 (accessed on 3 January 2025) [44]” and the “National Tax Survey Database”, the research subjects are identified as wood-processing and wood, bamboo, rattan, palm, and straw product manufacturing enterprises; wood furniture manufacturing enterprises; paper and paper product manufacturing enterprises. The data of WPEs is matched and merged with county-level FIB data using the county (district and city) administrative division codes. Enterprises in some prefecture-level cities, such as Guigang city, where the county administrative division codes cannot be extracted, are excluded.
Finally, an unbalanced panel dataset of WPEs from 2008 to 2016 is constructed, with a total of 49,650 observations, covering 31 provinces, 270 prefecture-level cities, and 1374 counties. The research conclusions based on the above data have sufficient representativeness. Between 2008 and 2016, China’s financial industry was in a phase of rapid expansion, with the rapid development of financial business types and new models. The number of traditional and emerging FIBs has increased and penetrated county-level areas. China’s wood-processing industry has also been in a period of industrial-scale expansion. Therefore, based on the observations during this sample period, assessing the empowering effect of county-level FIB expansion on the WPEs’ resilience provides reliable and representative conclusions.
4.4. Descriptive Statistical Analysis
Descriptive statistical analysis based on the 2016 observational data in Table 2 indicates that there are significant differences between the maximum and minimum values of the explanatory and control variables. The observed values of the variables in the sample enterprises exhibit heterogeneous characteristics, and the heterogeneity of these variables may lead to differences in the resilience of the sample enterprises. It is statistically meaningful and necessary to involve these variables in the econometric model.
Table 2.
Descriptive statistical analysis.
As shown in Table 2, the mean values for 2008, 2012, and 2016 indicate a gradual improvement in the regional financial environment, with the average number of county-level FIBs steadily increasing. WPEs’ resilience has significantly improved but with some fluctuation. The average observation value of resilience for sample WPEs is not distinguished by region. For that, the differences in the evolutionary trends between RFD and resilience cannot determine the absence of a positive or negative causal relationship. Further econometric analysis is needed for verification. For example, based on the fitted value curve with a positive slope in the scatterplot of Figure 1, it can be preliminarily concluded that RFD is positively correlated with WPEs’ resilience. That is, WPEs in regions with higher levels of financial development tend to have stronger resilience, and improvements in financial development may promote resilience in WPEs. Further econometric analysis will provide more reliable verification.
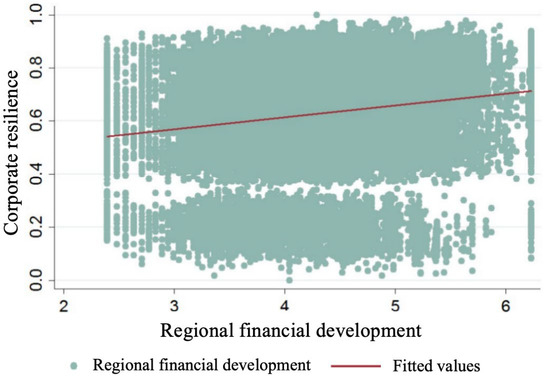
Figure 1.
Scatterplot of sample firm resilience and RFD.
5. Analysis of Validation Results
5.1. Results of Benchmark Regression
Table 3 presents the estimation results of the pooled model, random-effects model, and fixed-effects model. At the 1% significance level, the coefficient of regional financial development (RFD) is positive in all models. However, the coefficient in the fixed-effects model differs significantly from those in the other models. Further tests indicate that it is necessary to eliminate the interference of individual heterogeneity and time inertia. This is supported by Column 4 of Table 3, which shows that the F-statistic of the fixed-effects model is 7187.51, with a corresponding p-value of 0, indicating that the goodness of fit of the fixed-effects model is better than that of the pooled model. The Hausman test shows that the χ2 statistic is 22.0321, with a corresponding p-value of 0, suggesting that the fixed-effects model has a better fit than the random-effects model. Therefore, the estimation results of the fixed-effects model will be discussed.
Table 3.
Results of benchmark regression.
According to the fitting results of the fixed-effects model, the RFD’s coefficient is 0.0312, which is significant at the 1% statistical level. Hypothesis 1 is validated, indicating that RFD significantly enhances WPEs’ resilience. As the number of FIBs increases in a county, it creates a favorable investment and financing environment that provides WPEs with better access to convenient, low-cost, and diversified financial products and services. This improved financial accessibility plays a crucial role in strengthening their ability to withstand and recover from internal and external shocks, supporting their defense, recovery, adaptation, and even development during times of crisis. Our findings are consistent with the financial geographic structure theory, which emphasizes the importance of financial proximity in supporting business resilience [8,19,20]. Moreover, this result confirms the monetary non-neutrality theory and opposes the “geography is dead” argument that claims the development of information technology can replace the importance of geographical factors in the financial industry [45]. As the number of FIBs increases in county areas, the closer WPEs are to financial institutions geographically; thus, the easier it is for them to access convenient, low-cost, and diversified financial products (services). In the face of internal and external shocks, they can obtain external financial support for defense, recovery, and adaptation, as well as for development and transformation. However, this conclusion is inconsistent with the findings of the literature [46,47], which suggest that increased competition in the banking industry is detrimental to enterprise growth. It also contrasts with the conclusions of Yang et al. [9], which state that the level of RFD during the COVID-19 pandemic had no significant impact on enterprise resilience. However, contrary to the results of this study, the post-2016 economic disruptions, particularly the COVID-19 pandemic, have significantly impacted global economies, and regional financial development mechanisms have played a critical role in helping businesses navigate these challenges. During the COVID-19 pandemic, local financial institutions were able to quickly adjust their services, providing low-interest loans, repayment deferrals, and government-subsidized credit to businesses facing liquidity constraints. These support systems were pivotal in helping enterprises mitigate the adverse effects of the pandemic and maintain operations, thereby strengthening their resilience. As external shocks like the pandemic continue to affect global supply chains and markets, these financial mechanisms remain indispensable in ensuring that businesses can quickly adapt to and recover from such disruptions. Over the past decade, financial institutions such as financial companies, consumer finance companies, and loan companies have developed rapidly in China, becoming important financing channels for some WPEs and their founders. Cetorelli and Strahan [46] and Leroy [47] only considered competition within the banking sector, failing to fully represent the financial environment in the area where the enterprise is located.
Regarding control variables, the coefficients of enterprise size (Size), labor input (Labor), technological innovation (Tech), financing capacity (Debt), export volume (Export), and policy support (Subsidy) are all significantly positive at the 1% level. These results indicate that the larger the WPE, the stronger its capital reserves, the more diversified its business layout, the greater its research and development advantages, and so on. This provides enough resources and capacity to maintain operations and avoid the risk of a broken capital chain. Labor input and technological innovation are promoting factors for WPEs, enhancing resilience. Technological innovation helps WPEs break the limitations of a traditional business, opening up “emerging tracks” while utilizing digitalization and intelligence to improve operational efficiency. The “learning by doing” effects of export business and the export financial support effects help WPEs alleviate the risks of sales decline and capital chain breakage. The cost–compensation and investment incentive effects of production subsidies, tax refunds, and other preferential policies help WPEs improve profitability and sales growth potential. The four variables representing the enterprises’ cost structure—operating cost ratio (Cost), tax burden (Tax), management expense ratio (Expen), and financing cost (Finan)—have significantly negative coefficients at the 1% statistical level, indicating that the deterioration of cost control and the increase in operating costs negatively affect WPEs’ resilience. The enhancement of internal management capabilities and operational efficiency is crucial for improving WPEs’ resilience.
To examine RFD’s sustained effects on WPEs’ resilience, the explanatory variables for lagged one period (RFDt-1), lagged two periods (RFDt-2), and lagged three periods (RFDt-3) are set to identify lagged or sustained effects. Table 4 shows that the estimated coefficients of RFDt-1 and RFDt-2 are 0.0011 and 0.0007, respectively, but they are insignificant at the 10% statistical level. However, the estimated coefficient of RFDt-3 is 0.0079, which is significant at the 5% statistical level, indicating that the positive effect of RFD on WPEs’ resilience can continue until the third year.
Table 4.
Testing results of RFD’s sustained effects.
5.2. Robustness Check
First, an instrumental variable test is conducted. To address the endogeneity issue, RFDt-1 is introduced as an instrumental variable for RFD, and Equation (1) is refitted. Table 5 shows that the estimated coefficient of RFD is 7.2995, which is significant at the 1% statistical level, indicating a significant positive effect of RFD on WPEs’ resilience. The direction of the coefficient is consistent with that of the baseline regression model, suggesting that the results of the baseline regression analysis are robust and the selected econometric method is reliable. Second, the dependent variable is replaced. As mentioned, the comprehensive evaluation value (Y1) for the growth rates of the three variables—main business income, total profit, and net cash flow—is calculated using the entropy weight method. Additionally, the comprehensive evaluation value (Y2) for the six indicators is calculated—main business income, total profit, net cash flow, and their respective growth rates. Y1 and Y2 are used to replace Y in the baseline regression model, and Equation (1) is refitted. The results show that RFD’s estimated coefficients are 0.0023 and 0.0162, both significant at the 5% statistical level. These results are consistent with those of baseline regression. Third, the econometric model is replaced. The panel Tobit regression model is used to account for potential model specification errors. After adding individual fixed and time-fixed effects, RFD’s estimated coefficient is 0.0162, which is significant at the 1% statistical level. This indicates that the research conclusions are not affected by the choice of the specific regression model. Fourth, winsorization is applied. To account for the potential impact of outliers on the research results, winsorization is applied to the key variables at the 1% and 99% percentiles, and Equation (1) is re-estimated. The results show that the estimated coefficient for RFD is 0.0312, which is significant at the 1% statistical level, confirming the positive effect of RFD. The above test results indicate that the research conclusions are not influenced by potential extreme values, further validating the robustness of the baseline test results.
Table 5.
Results of robustness tests.
5.3. Heterogeneity Test
Considering that RFD’s effect on the resilience of different types of WPEs may vary, sub-sample tests are conducted from five dimensions: enterprise size, niche industries, geographic location, urban–rural difference, and development model. The results are detailed in Table 6.
Table 6.
Results of heterogeneity tests.
First, in terms of enterprise size, smaller enterprises benefit more. Significant business operations and internal management differences among enterprises of different sizes have led to varying effects on RFD. According to the “Standards for Classifying Small and Medium Enterprises” (MIIT [2011] No. 300), the sample enterprises are divided into large, medium, small, and micro enterprises. The sub-sample tests show that RFD has no significant impact on the resilience of large WPEs, while the coefficients for medium, small, and micro enterprises are 0.0105, 0.0123, and 0.0358, respectively, and are significant at the 95% confidence level. These results indicate that RFD’s positive effect on sample enterprises’ resilience increases as the enterprises’ size decreases. It is more helpful in resolving the “difficult financing” and “expensive financing” issues faced by medium, small, and micro enterprises, demonstrating a strong inclusive effect consistent with the findings of [48]. Table 7 shows that between 2008 and 2016, smaller WPEs have had higher average financing costs (i.e., financial expense ratios). Additionally, the “elite capture” phenomenon of financial resources is evident; therefore, market competition effects caused by the increasing number of FIBs led to lower loan interest rates and more optimal financial products (services). The weaker the enterprise in the financial market, the greater the marginal benefit it gains.
Table 7.
Financing costs of sample firms of different sizes; unit: %.
Second, in sub-industries, paper and paper product enterprises benefit the most. WPEs are divided into three categories: Wood-processing and wood, bamboo, rattan, palm, and straw product manufacturing enterprises; wood furniture manufacturing enterprises; and paper and paper product manufacturing enterprises. As shown in Table 6, the coefficients of the three sub-industries are all significantly positive and significant at the 1% statistical level, indicating that RFD has an inclusive effect on different sub-industries. Among these, RFD’s coefficient of the resilience of paper and paper product manufacturing enterprises is higher than that of the other two types of WPEs. This may be because the former has a higher capital intensity and greater financial demands, and the improvement in the level of RFD has a stronger marginal contribution.
Third, regarding geographic location, enterprises in the central and western regions benefit more. As shown in Table 6, RFD’s coefficients on WPEs’ resilience in the eastern, central, and western provinces are 0.0130 and 0.0548, respectively, both significant at the 1% statistical level. This indicates that the improvement of RFD has an inclusive effect in different regions, which is consistent with the findings of [49]. However, RFD has a greater promotional effect on enterprises in the central and western regions. Table 8 shows that between 2008 and 2016, the stock of county-level FIBs in the eastern region was much higher than in the central and western regions. The nine-year average in the eastern region was 133 branches; in the central and western regions, they were, respectively, 67 and 68. The number and density of FIBs in the central and western regions were significantly lower than in the eastern region. The increase in the number of FIBs strengthens the effect of increasing the supply of financial products and service innovation in the region, which is more beneficial for alleviating the supply–demand imbalance. It also has a greater marginal contribution to resolving the problem of “difficult financing” and “expensive financing” in the region.
Table 8.
Number of branches of financial institutions in different regions of the county.
Fourth, regarding urban–rural difference, enterprises in non-municipal districts benefit more. “Municipal districts” are considered “urban”, and “non-municipal districts” as “rural”. As shown in Table 6, RFD’s coefficients on WPEs’ resilience in municipal districts and non-municipal districts are 0.0271 and 0.0320, respectively, both being significant at the 1% statistical level. The results indicate that RFD has an inclusive effect on enhancing the resilience of urban and rural enterprises, which is consistent with the conclusions of [50]. However, WPEs in non-municipal districts can benefit more from improved local financial development. Due to various distance-related costs and differences in the scale of financial market demand, there are fewer FIBs in non-municipal districts. Between 2008 and 2016, the number of county-level FIBs in municipal districts was almost double that in non-municipal districts (Table 8). Therefore, WPEs in non-municipal districts face a less favorable financial resource supply environment. The competition effects and the diversification of financial services caused by the entry of different types of financial institutions have a greater marginal effect on easing financing constraints for enterprises.
Fifth, labor-intensive enterprises benefit the most from RFD’s improvement. Table 9 shows that the estimated coefficients for RFD × Capital, RFD × Tech, and RFD × Labor are 0.0031, 0.0046, and 0.0089, respectively, all being significant at the 1% statistical level. The results indicate that RFD has inclusive but differentiated effects on WPEs with different development models. Among them, the promotion of resilience improvement is greatest for labor-intensive WPEs, followed by technology-intensive and capital-intensive enterprises. Compared to capital-intensive enterprises, labor-intensive enterprises have a lower proportion of fixed assets, and the stock of fixed assets available for collateral is limited. On the other hand, technology-intensive enterprises require more stable and continuous capital for long-cycle innovation activities, and they have a higher proportion of intangible assets (such as patents, trademarks, and intellectual property) that are harder to pledge, assess, and monetize. Labor- and technology-intensive enterprises face higher credit barriers [51]. The increase in the number of FIBs in the region leads to increased credit resource supply. Banks enhance their information acquisition capabilities, reduce reliance on traditional collateral, and lower the financing difficulty and cost for labor- and technology-intensive enterprises [52]. The results above indicate that RFD helps resolve the “difficult financing” and “expensive financing” issues faced by WPEs with limited collateral, thus promoting the resilience of these enterprises.
Table 9.
Differentiated effects of RFD on WPEs with different development models.
5.4. Mechanism Checking
Based on the previous assumptions, this section will test whether RFD can improve WPEs’ resilience by enhancing financing capacity and reducing financing costs. The three-step method, the Sobel test, and the Bootstrap test proposed by Wen and Ye [53] will be used, and the mathematical formulas for the test steps include (1)~(4). In this, Equation (2) does not include the two mediating variables (Debt and Finan), where the coefficient φ represents the coefficient of RFD on Y. In Equations (3) and (4), β1 and β2 represent the coefficients of RFD on Debt and Finan, respectively. In Equation (1), ω is the coefficient of RFD on Y after including Debt and Finan. In Equation (1), α1 and α2 are the coefficients of Debt and Finan on Resi, while α1 × β1 and α2 × β2 represent the indirect effects of F.
Taking Debt as an example, the sequential conditions for applying the three methods are as follows: First, the three-step method involves fitting Equations (1)–(3), testing the significance of coefficients φ, β1, and α1 in turn. If all are significant, hypothesis 1 is confirmed. Second, if coefficient φ is significant but at least one of β1 or α1 is insignificant, the Sobel test method [54] is used. Third, if φ is not significant, the Bootstrap test method is used. This method treats the research sample as the sampling population and repeatedly selects a certain number of samples according to a predetermined number of iterations. The parameters obtained from the repeated sampling are used as the final estimation results. The optimal method will be chosen based on the actual situation to test RFD’s influencing mechanisms. The results are shown in Table 10.
Table 10.
Results of influencing mechanism tests.
Fitting Equation (2), which excludes Debt and Finan, the results reveal that the coefficient of RFD on Y is still 0.0312, being significant at the 1% statistical level, indicating that the impact mechanism test applies to the three-step method and the Sobel test method. First, for financing capacity (Debt), fitting Equation (3) shows that the coefficient of RFD on Debt (β1) is 18.8572, being significant at the 1% statistical level, suggesting that RFD can significantly enhance WPEs’ financing capacity. Combining the significant positive impact coefficient of Debt on Y (α1 = 0.0249) from Table 2, φ, β1, and α1 all pass the significance tests in sequence, and all are positive. Therefore, the results of the three-step method can be adopted, indicating that RFD can enhance WPEs’ resilience by improving financing capacity, thus confirming hypothesis H2. Second, for financing costs (Finan), the fitting results of Equation (4) show that the impact coefficient of Finan on Y (β2) does not reach significance at the 90% confidence level. Thus, the Sobel test method is used for further testing. The results show that Sobel test’s Z statistic is 6.53 and the p-value is 0, indicating that the coefficient of α2 × β2 is significant. This means that RFD can enhance WPEs’ resilience by reducing financing costs, thus confirming hypothesis H3.
6. Conclusions and Implications
6.1. Conclusions
Based on a county-level perspective, this study constructs a dataset of RFD and WPE data from 2008 to 2016 in mainland China. Then it examines RFD’s effects, influencing pathways, and heterogeneous effects on WPEs’ resilience. The results show as follows: RFD can positively impact WPEs’ resilience, and multi-dimensional stability tests confirm the robustness of this result. The mechanism tests reveal that RFD produces indirect positive effects by enhancing financing capacity and reducing financing costs, which provides micro-level evidence that RFD alleviates the “difficult financing” and “expensive financing” issues. Heterogeneity tests find that RFD’s positive effect exists in three sub-sectors of the wood-processing industry, and the positive effects on small and micro enterprises are greater than those on medium and large-sized enterprises. The positive effects on enterprises in central and western provinces and non-municipal districts are greater than those on enterprises in eastern provinces and municipal districts. The promotion of resilience improvement is greatest for labor-intensive WPEs, followed by technology- and capital-intensive enterprises.
6.2. Inspiration
To enhance the resilience of WPEs, local governments should accelerate the establishment of a diversified financial system tailored to the specific needs of the sector. Governments in wood-processing industrial clusters should consider the industrial development stage and improve market access for both traditional and emerging financial institutions, such as fintech and peer-to-peer lending. Local governments should eliminate institutional barriers to the flow of financial resources while continuously optimizing the spatial layout of financial institutions. They should guide the orderly development of traditional financial institutions, as well as emerging financial institutions. This will help build a multi-tiered, multi-type, and widely distributed financial institution system, and then enhance the accessibility of financial resources for these enterprises. In addition, the special financial support policies for the wood-processing industry should be improved. For example, the provincial finance of Fujian province has arranged 20 million CNY to provide 1% loan discount for WPEs, which may encourage banking institutions to extend their service radius to rural areas where WPEs are concentrated, thereby improving the external financing accessibility of WPEs.
In areas with a shortage of financial resources, especially central and western provinces and non-municipal districts, local authorities should relax entry requirements for financial institutions, lowering capital requirements and offering government-backed guarantees to encourage investment. To further support financial inclusion, governments should introduce financial district subsidies, such as rent subsidies, to attract financial institutions to underserved areas. To address this, the financial sector and local authorities should focus on the financing needs of small and micro WPEs and businesses in remote areas where financial services are not readily accessible. This can be achieved by setting region-specific market access conditions and appropriately relaxing the entry standards for financial institutions in areas with scarce financial resources. Of course, local governments should promote financial literacy by offering training on bank credit requirements and establishing information-sharing platforms to help WPEs access and compare available financial products. Additionally, governments should create specialized financial products, such as working capital loans and disaster recovery funds, tailored to the needs of small and micro enterprises. To further enhance financial accessibility, governments in these regions should improve policies that provide financial space, such as establishing financial districts and offering rent or purchase price subsidies to attract financial institutions. Efforts should also be made to accelerate the regionally balanced development of financial services. WPEs should be guided to align with bank credit requirements, actively seek cooperation with banks, and adopt robust information disclosure systems.
6.3. Limitations and Future Research Directions
The dataset used in this study is limited to China and covers a limited time span up to 2016. Therefore, this study did not consider the economic damage after 2016, such as the COVID-19 pandemic, or other recent technological and geopolitical changes that may affect the resilience of wood-processing enterprises (WPEs) in different ways. In addition, the research model does not include key social, institutional, and technological factors that may significantly affect WPE resilience, such as digital finance, technological innovation, or government policies. These factors should be included in future research to provide a more comprehensive understanding. Although the study focuses on Chinese wood-processing enterprises, the mechanism of enhancing enterprise resilience through regional financial development has a broader impact on developing economies with similar financial structures. Many developing countries face similar challenges, such as limited access to financial resources, especially in rural areas. Therefore, the relationship between local financial development and the resilience of small and medium-sized enterprises can be applied to other sectors and regions with similar financial constraints and geographical differences. Future research can explore the generalizability of our findings in different contexts, particularly in countries with developed financial systems or limited financial services.
Author Contributions
Conceptualization, W.L. and Z.L.; methodology, Y.L.; software, Y.L.; validation, W.L., Z.L. and Y.L.; formal analysis, W.L., Z.L. and Y.L.; investigation, W.L., Z.L. and Y.L.; resources, W.L., Z.L. and Y.L.; data curation, W.L., Z.L. and Y.L.; writing—original draft preparation, Y.L.; writing—review and editing, W.L., Z.L. and Y.L.; visualization, W.L., Z.L. and Y.L.; supervision, W.L., Z.L. and Y.L. All authors have read and agreed to the published version of the manuscript.
Funding
This research was funded by National Natural Science Foundation of China (No.72404232), Fujian Provincial Natural Science Foundation (No.2023J05011), and Major Project of Social Science Research Base of Fujian Province (FJ2023JDZ028). The APC was funded by the Special Fund Project of the Fujian Provincial Department of Finance [Fujian Finance Allocation Instruction in 2021 No.848 and in 2024 No.900].
Data Availability Statement
All raw data contained in this study can be provided on demand based on editorial needs. If in doubt, please consult the corresponding author.
Conflicts of Interest
The research was conducted in the absence of any commercial or financial relationships that could be construed as a potential conflict of interest.
References
- Hertzel, M.G.; Li, Z.; Officer, M.S.; Rodgers, K.J. Inter-Firm Linkages and the Wealth Effects of Financial Distress Along the Supply Chain. J. Financ. Econ. 2008, 87, 374–387. [Google Scholar] [CrossRef]
- Zhou, W.; Feng, C. The Risk Contagion Effect of Zombie Firms: Evidence from the Supply Chain Mechanism. World Econ. 2022, 11, 101–124. [Google Scholar]
- Van Der Vegt, G.S.; Essens, P.; Wahlström, M.; George, G. Managing Risk and Resilience. Acad. Manag. J. 2015, 58, 971–980. [Google Scholar] [CrossRef]
- Musso, P.; Schiavo, S. The Impact of Financial Constraints on Firm Survival and Growth. J. Evol. Econ. 2008, 18, 135–149. [Google Scholar] [CrossRef]
- Albuquerque, R.; Koskinen, Y.; Yang, S.; Zhang, C. Resiliency of Environmental and Social Stocks: An Analysis of the Exogenous COVID-19 Market Crash. Rev. Corp. Financ. Stud. 2020, 9, 593–621. [Google Scholar] [CrossRef]
- Klagge, B.; Martin, R. Decentralized versus Centralized Financial Systems: Is There a Case for Local Capital Markets? J. Econ. Geogr. 2005, 5, 387–421. [Google Scholar] [CrossRef]
- Chen, J.; Zhong, Y.; Dai, Y.; Lin, W. The Effect of the Availability of County Finance on the Growth of Wood Processing Enterprises. Issues For. Econ. 2024, 44, 261–272. [Google Scholar]
- Xiao, X.Z.; Xie, W.M. Artificial Intelligence and Enterprise Resilience—Empirical Evidence Based on the Application of Industrial Robots. Syst. Eng. Theory Pract. 2024, 44, 2456–2474. [Google Scholar]
- Yang, Y.; Li, J.W.; Zhang, Y.; Sun, L. Empirical Study on the Resilience of Chinese Private Enterprises under the Impact of COVID-19—A Perspective Based on Financing Constraints. J. Beijing Union Univ. Humanit. Soc. Sci. 2021, 19, 64–75. [Google Scholar]
- Jin, X.; Zhang, W. Financial Market Structure and Enterprise Survival. Issues Chin. Econ. 2019, 3, 108–121. [Google Scholar]
- Luo, X.; Li, Z. Supply Chain Finance, Supply Chain Sustainability, and Corporate Resilience. Financ. Econ. 2024, 12, 24–36. [Google Scholar]
- Pan, W.H.; Luo, H.Y. Supply Chain Finance and Corporate Resilience: A Perspective Based on Collaborative Innovation and Risk-Taking. Financ. Econ. Theory Pract. 2024, 45, 10–17. [Google Scholar]
- Tao, Z.; Song, H. How Does Supply Chain Finance Enhance the Resilience of Small and Medium-sized Enterprises?—A Process Based on Paradox Management. J. Manag. Case Stud. Rev. 2024, 17, 774–792. [Google Scholar]
- Song, H.; Tao, Z.; Yang, Y.D. The Impact Mechanism of Supply Chain Finance on Enhancing Corporate Organizational Resilience. China Circ. Econ. 2024, 38, 103–114. [Google Scholar]
- Li, M.Q.; Ke, X.L.; Kang, K.; Guo, P. Digital Inclusive Finance and the Economic Resilience of New-Type Agricultural Operating Entities: Empowerment or Disempowerment? J. China Agric. Univ. 2024, 29, 40–53. [Google Scholar]
- Xu, Q.; Zhong, M.; Dong, Y. Digital finance and rural revitalization: Empirical test and mechanism discussion. Technol. Forecast. Soc. Change 2024, 201, 123248. [Google Scholar] [CrossRef]
- Pathak, S.; Ahmad, M.M. Role of Government in Flood Disaster Recovery for SMEs in Pathumthani Province, Thailand. Nat. Hazards 2018, 93, 957–966. [Google Scholar] [CrossRef]
- Reyns, A.; Hudon, M.; Schoors, K. For Better or for Worse: How Mutual Credit Systems Bolster Resilience of Small Firms. J. Econ. Behav. Organ. 2025, 230, 106861. [Google Scholar] [CrossRef]
- Xia, Y.; Qiao, Z.; Xie, G. Corporate Resilience to the COVID-19 Pandemic: The Role of Digital Finance. Pac. Basin Financ. J. 2022, 74, 101791. [Google Scholar] [CrossRef]
- Laeven, L.; Levine, R.; Michalopoulos, S. Financial Innovation and Endogenous Growth. J. Financ. Intermediat. 2015, 24, 1–24. [Google Scholar] [CrossRef]
- Smith, L.C.; Frankenberger, T.R. Does Resilience Capacity Reduce the Negative Impact of Shocks on Household Food Security: Evidence from the 2014 Floods in Northern Bangladesh. World Dev. 2017, 102, 358–376. [Google Scholar] [CrossRef]
- Presbitero, A.F.; Rabellotti, R. Geographical Distance and Moral Hazard in Microcredit: Evidence from Colombia. J. Int. Dev. 2014, 26, 91–108. [Google Scholar] [CrossRef]
- Butler, A.W.; Cornaggia, J. Does Access to External Finance Improve Productivity? Evidence from a Natural Experiment. J. Financ. Econ. 2011, 99, 184–203. [Google Scholar] [CrossRef]
- Shaffer, S. The Winner’s Curse in Banking. J. Financ. Intermediation 1998, 7, 359–392. [Google Scholar] [CrossRef]
- Cai, Q.F.; Chen, Y.H.; Lin, K. Credit Availability and Corporate Innovation: Incentive or Inhibition?—Micro Evidence Based on Bank Branch Data and Financial Geography Structure. J. Econ. 2020, 55, 124–140. [Google Scholar]
- Kärnä, A.; Manduchi, A.; Stephan, A. Distance still matters: Local bank closures and credit availability. Int. Rev. Finan. 2021, 21, 12329. [Google Scholar] [CrossRef]
- Petersen, M.A.; Rajan, R.G. Does Distance Still Matter? The Information Revolution in Small Business Lending. J. Financ. 2002, 57, 2533–2570. [Google Scholar] [CrossRef]
- Berger, A.N.; Miller, N.H.; Petersen, M.A.; Rajan, R.G.; Stein, J.C. Does Function Follow Organizational Form? Evidence from the Lending Practices of Large and Small Banks. J. Financ. Econ. 2005, 76, 237–269. [Google Scholar] [CrossRef]
- Hsu, P.H.; Tian, X.; Xu, Y. Financial Development and Innovation: Cross-Country Evidence. J. Financ. Econ. 2014, 112, 116–135. [Google Scholar] [CrossRef]
- Degryse, H.; Ongena, S. Distance, Lending Relationships, and Competition. J. Financ. 2005, 60, 231–266. [Google Scholar] [CrossRef]
- Agarwal, S.; Hauswald, R. Distance and Private Information in Lending. Rev. Financ. Stud. 2010, 23, 2757–2788. [Google Scholar] [CrossRef]
- Crocco, M.; Santos, F.; Amaral, P.V. The Spatial Structure of Financial Development in Brazil. Spat. Econ. Anal. 2010, 5, 181–203. [Google Scholar] [CrossRef]
- Béné, C.; Headey, D.; Haddad, L.; Grebmer, K. Is Resilience a Useful Concept in the Context of Food Security and Nutrition Programmes: Some Conceptual and Practical Considerations. Food Secur. 2013, 8, 123–138. [Google Scholar] [CrossRef]
- Sheng, B.; Wang, H. The Expansion of Bank Branches and the Domestic Value-Added Rate of Firm Exports—A Perspective Based on the Geographical Structure of Financial Supply. China Ind. Econ. 2022, 2, 99–117. [Google Scholar]
- Tian, D.; Ding, B. Measuring and Mechanisms of High-Quality Firm Development: A Perspective Based on Organizational Resilience. China Soft Sci. 2023, 9, 154–170. [Google Scholar]
- Zhang, P.Y.; Liu, W.G.; Tang, Y.H. Enhancing Export Resilience of Firms under Trade Frictions: The Role of Digital Transformation. China Ind. Econ. 2023, 5, 155–173. [Google Scholar]
- Zhang, L.; Wang, S.Y. The Impact of Technology Sanctions on Firm Resilience. J. South-Cent. Univ. Financ. Econ. 2023, 6, 102–114. [Google Scholar]
- Chen, Q.; Li, M.H. Can ESG Ratings Improve Corporate Resilience?—A Quasi-Natural Experiment Based on ESG Rating Events. Res. Dev. Manag. 2024, 36, 132–145. [Google Scholar]
- Ren, G.Q.; Zhao, M.J.; Li, J.C. How Does Reverse Mixed Ownership Reform Affect the Resilience of Private Firms?—A Perspective Based on the Director Relationship Network. Financ. Econ. Sci. 2023, 5, 92–110. [Google Scholar]
- Zou, Y.; Shi, F.; Wu, Y. The Enabling Effect of Enterprise Resilience in “New Infrastructure” under the “Three Chain” Collaborative Vision: A Quasi-Natural Experiment Based on China’s “Smart City” Pilot. J. Financ. Econ. 2024, 50, 79–93. [Google Scholar]
- Zhou, T. Financial Density, Service Accessibility, and County-Level Finance in China. J. Financ. Dev. Res. 2018, 9, 16–23. [Google Scholar]
- Hu, H.F.; Bai, Z.H.; Wang, A.P. Supply Chain Shareholding and High-Quality Firm Development—A Perspective Based on Total Factor Productivity. China Ind. Econ. 2024, 9, 137–155. [Google Scholar]
- He, J.; He, G.W. Government Shareholding, Financing Capability, and Social Performance of Microfinance Companies. J. Nanjing Agric. Univ. Soc. Sci. Ed. 2017, 17, 91–99, 147. [Google Scholar]
- National Bureau of Statistics. Notes on the National Economic Industry Classification 2011; China Statistics Press: Beijing, China, 2011. [Google Scholar]
- O’Brein, R. Global Financial Integration: The End of Geography. Council on Foreign Relations Press: New York, NY, USA, 1992. [Google Scholar]
- Cetorelli, N.; Strahan, E.P. Finance as a Barrier to Entry: Bank Competition and Industry Structure in Local U.S. Markets. J. Financ. 2006, 61, 437–461. [Google Scholar] [CrossRef]
- Leroy, A.; Lucotte, Y. Is There a Competition-Stability Trade-Off in European Banking? J. Int. Financ. Mark. Inst. Money 2016, 46, 199–215. [Google Scholar] [CrossRef]
- Cai, J.; Dong, Y. The Development of Regional Banks and SME Financing—An Empirical Study Based on the Statistical Data of Chinese Industrial Enterprises. China Econ. Issues 2017, 2, 16–28. [Google Scholar]
- Sun, L.P.; Yi, D. The Impact of Digital Inclusive Finance in Western China on Regional High-Quality Economic Development—An Empirical Study Based on Spatial Spillover and Mediating Effect Tests. J. Qujing Norm. Univ. 2024, 43, 82–92. [Google Scholar]
- Zhang, Z.; Bu, X.P.; Li, M.Z. Empirical Study on Financial Technology, Rural Industries, and Farmers’ Income Increase. J. Northwest Minzu Univ. Philos. Soc. Sci. Ed. 2024, 6, 104–116. [Google Scholar]
- Wu, M.G.; Lei, J.S.; Feng, T.; Shen, Y. High-Quality Development of China’s Finance: Theoretical Connotations, Measurement Logic, and Regional Differences. Int. Financ. Res. 2024, 8, 3–14. [Google Scholar]
- Xie, Y.; Hong, Z. Does Financial Agglomeration in Urban Clusters Alleviate the Financing Problems of Small and Medium-Sized Enterprises? Financ. Trade Econ. 2023, 44, 106–122. [Google Scholar]
- Wen, Z.L.; Ye, B.J. Mediation Effect Analysis: Method and Model Development. Adv. Psychol. Sci. 2014, 22, 731–745. [Google Scholar] [CrossRef]
- Sobel, M.E. Asymptotic Confidence Intervals for Indirect Effects in Structural Equation Models. Sociol. Methodol. 1982, 13, 290–293. [Google Scholar] [CrossRef]
Disclaimer/Publisher’s Note: The statements, opinions and data contained in all publications are solely those of the individual author(s) and contributor(s) and not of MDPI and/or the editor(s). MDPI and/or the editor(s) disclaim responsibility for any injury to people or property resulting from any ideas, methods, instructions or products referred to in the content. |
© 2025 by the authors. Licensee MDPI, Basel, Switzerland. This article is an open access article distributed under the terms and conditions of the Creative Commons Attribution (CC BY) license (https://creativecommons.org/licenses/by/4.0/).