Abstract
The Grain for Green Program (GGP), one of the world’s largest soil and water conservation initiatives, has been implemented in China as a representative payment for environmental service program. This study aims to evaluate the ecosystem service value (ESV) of forests established under the GGP in five representative provinces (Hebei, Liaoning, Hubei, Yunnan, Gansu), using a systematic methodology that integrates ecologic and economic dimensions for large-scale ecological projects. Between 1999 and 2013, a total of 717.67 × 10⁴ ha of forests were established. Barren land served as the primary land source, with ecological forest being the dominant forest type within the program. The ESV assessment encompassed key services, including water conservation, soil conservation, carbon sequestration, nutrient retention, air quality improvements, and biodiversity improvements. Based on our estimates, the total annual ESV of the afforested areas under GGP in the five representative provinces is 3604.99 × 108 Yuan, with water conservation representing the largest share among all ecosystem services. Moreover, the cumulative ESV generated by these forests over the 14-year period exceeded the total payments made by the central government to farmers. To ensure the long-term success and sustainability of the GGP, a more equitable cost–benefit sharing mechanism is recommended.
1. Introduction
Massive deforestation has led to a range of environmental issues, including soil erosion, frequent floods, and accelerated desertification [1]. In response to global ecosystem degradation, the 21st century has witnessed a proliferation of large-scale ecological restoration programs worldwide [2], such as the Central American Dry Corridor Initiative, Sri Lanka’s Mangrove Regeneration Program, and the Terai Arc Landscape Wildlife Recovery Plan [3,4,5]. Many of these initiatives are often conceptualized within the framework of Payments for Ecosystem Services (PES), a global policy mechanism designed to incentivize conservation by compensating landowners for maintaining or enhancing ecosystem services [6,7]. While community-based monitoring is common in many international programs, China’s Grain for Green Program (GGP) distinguishes itself through its exceptional spatial scale and centralized, long-term investment in ecological monitoring networks, offering a unique case for evaluating state-led PES effectiveness [8]. Recognized as one of the world’s most ambitious soil and water conservation projects in terms of scale, investment, and societal impact [2,9]. The GGP provides financial subsidies to farmers to incentivize them to convert cropland, barren land (currently grassland suitable for planting trees), and poorly preserved forest (currently with sparsely distributed trees and low productivity) into ecological forest (mainly providing ecological functions and services), economic forest (for producing fruit, edible oil, raw material for the wood industry, medicinal herbs, and other products, but not wood), and shrub forest (the dominant species are shrubs) [8]. By retiring croplands on steep slopes vulnerable to erosion [10], this typical PES program had successfully increased vegetation cover, reversed ecological degradation, and contributed to rural livelihoods [11,12].
Although the primary objective of the GGP was to mitigate soil erosion and flood risks, the established vegetation also delivers a range of additional ecosystem services [13]. Ecosystem services (ESs) are products and services generated by ecosystems and ecological processes, which are essential for human well-being [14]. A growing body of research has begun to quantify the ESs and trade-offs among them [15,16]. Studies based largely on remote sensing and land-use data have revealed that the GGP enhances regulating services such as carbon sequestration and soil retention, though often at the cost of provisioning services such as food production and water yield [17,18,19]. Research on ES trade-offs and synergies has further elucidated the complex interactions driven by the program [19,20].
However, while this pattern of trade-offs is consistent with findings from other large-scale afforestation programs globally [21], a critical gap remains between spatially explicit models and the actual ecological processes they represent. Most previous assessments have relied heavily on proxy data and model simulations. Although useful for identifying broad spatiotemporal trends, these approaches lack empirical validation and mechanistic insights derived from long-term, field-based monitoring [14,22]. As a result, the functional mechanisms underlying ecosystem services under the GGP remain inadequately explained [23]. Key challenges in ES valuation for the GGP include the program’s vast spatial extent, high climatic variability, diverse ecosystem compositions, and pronounced regional socioeconomic differences [24]. These factors complicate the establishment of baseline data across broad regions. Moreover, ecosystem diversity climatic variation, and divergent management practices make it difficult to collect representative data that accurately reflect different GGP interventions [13,25]. Furthermore, comparative analyses linking the GGP outcomes to other international PES and afforestation programs remain scarce, limiting its relevance to global discourse on ecological restoration [26,27]. For instance, while meta-analyses have synthesized the impacts of PES schemes on forest cover and livelihoods across multiple countries [28], and case studies have examined specific programs like Sri Lanka’s mangrove regeneration [29], there is still a lack of direct, methodologically rigorous comparisons that situate the GGP’s large-scale, state-led model within this broader international context. This gap prevents the identification of transferable lessons and the general principles of effective PES design across diverse governance and ecological settings [24].
A pivotal step toward addressing this data gap came in 2013, with China’s first national survey on GGP implementation progress [30]. Capitalizing on this unique opportunity, our study moves beyond remote sensing proxies by integrating long-term ecological station data, forest resource data, and public statistics—a multi-source empirical dataset that was used to evaluate the ESV of the GGP from 1999 to 2013. This approach aligns with emerging methodologies in ecosystem service assessment that emphasize the integration of empirical measurements to quantify the actual flow of services from ecosystems to people [31,32]. We focus on five key provinces-Hebei, Liaoning, Hubei, Gansu, and Sichuan- which represent typical ecotones in China. Our objectives are threefold: (1) to analyze the afforestation progress of different vegetation types under the GGP; (2) to quantify the magnitude of key ecosystem services using empirical and resource data; and (3) to assess the resulting ecosystem services value. By grounding our analysis in a robust, multi-source dataset, this study aims to provide empirically driven insights into the GGP’s ecological effectiveness, fill a critical methodological gap in the literature, and offer policy-relevant conclusions positioned within the global context of ecosystem services valuation and comparative PES program analysis.
2. Materials and Methods
2.1. Study Area
The provinces of Hebei, Liaoning, Hubei, Yunnan, and Gansu represent typical eco-zones in China, each characterized by distinct climatic, topographic, and soil conditions (Figure 1) [30]. Gansu province is located in arid to semi-arid northwest, encompassing steep mountains and parts of the Loess Plateau, where severe soil erosion is mainly caused by wind and water. The mean annual precipitation in Gansu is 386 mm. Liaoning and Hebei provinces are situated in northeastern and northern China, with mean annual precipitation of 660 mm and 507 mm, respectively. Their topography consists mainly of low mountains, hills, and plateaus, and soil erosion results from both wind and water action. Hubei Province is located in central-south China, experiences a subtropical climate with an annual precipitation of 1088 mm. The terrain is dominated by hills and plateaus, and soil erosion is mainly water-induced. Yunnan province, in the tropical to subtropical southwest, receives 1077 mm of annual precipitation and features steep, high mountain landscapes where water is the main driver of soil erosion.
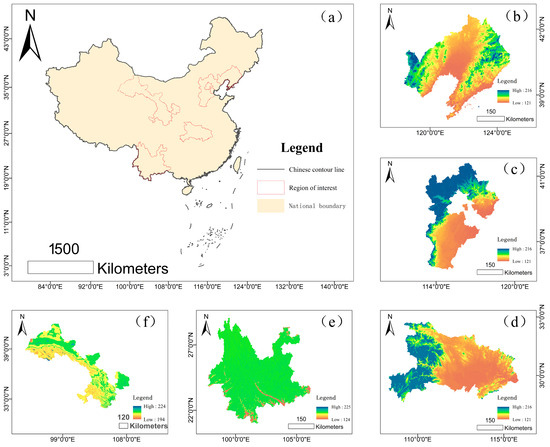
Figure 1.
Study area. Note: The map is produced based on the standard map with review number GS(2024)0650 downloaded from the Standard Map Service website https://map.tianditu.gov.cn/ (accessed on 28 October 2025), with no modifications to the base map. (a) Study area distribution; (b) Liaoning Province; (c) Hebei Province; (d) Hubei Province; (e) Yunnan Province; (f) Gansu Province.
2.2. Distributed Method for Assessing Ecosystem Services
A spatially distributed method was used to estimate the long-term ecological effects of GGP over large areas [30]. The specific steps of the distributed measurement method adopted in this report are (Figure 2): (i) divided into 5 level 1 measurement units according to the provincial administrative divisions; (ii) each level 1 measurement unit is divided into several units according to the counties administrative divisions; (iii) each level 2 measurement unit is divided into 3 level 3 measurement units according to their pre-forestation land types (cropland, barren land, and mountain closing land); and (iv) each level 3 measurement unit is divided into 3 level 4 measurement units according to the functional types of forests established by GGP (ecological forest, economic forest, and brush) (Figure 2). Finally, 6327 ecological units of relatively homogenized ecological service assessment units were determined by combining comparative observations of different stand conditions.
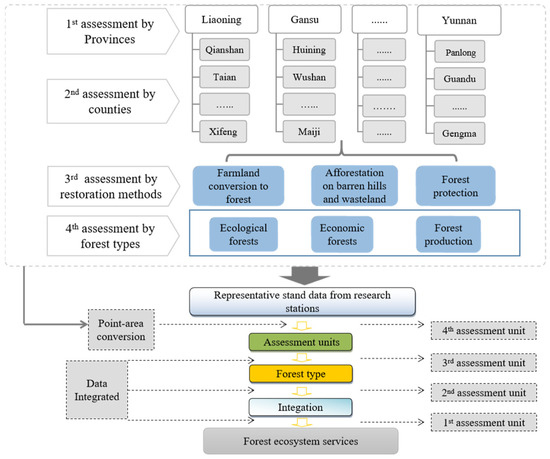
Figure 2.
Distributed method of forest ecosystem services.
2.3. Data Sources
To evaluate the ecological benefits of the GGP, we applied an integrated framework combining physical quantification and monetary valuation of ecosystem services. This study draws on a unique, comprehensive dataset synthesized from the following three main sources: (1) ecological station monitoring data, (2) GGP forest resource inventory data, and (3) publicly available socioeconomic data (Figure 3). The specific origins, content, and spatiotemporal scope of each dataset are described below.
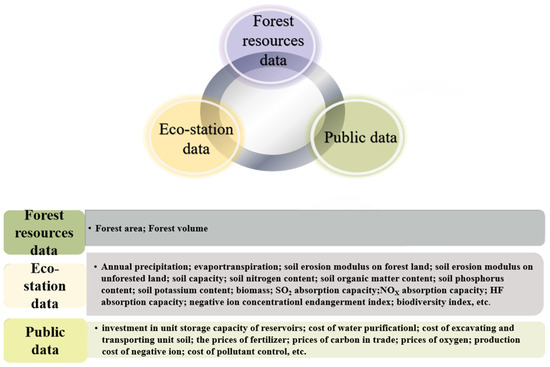
Figure 3.
Data sources and integrated of this study.
The data for quantifying the physical quantities of ecosystem services were derived from a national network of long-term observational stations. This network comprises over 100 core forest ecosystem stations under the China Forest Ecosystem Research Network (CFERN), supplemented by over 400 auxiliary observation points and more than 7000 permanent sample plots specifically established for GGP monitoring. The data cover the critical period of GGP implementation from 1999 to 2013. All monitoring followed strict protocols defined by national standards to ensure consistency and reliability. Key parameters measured included meteorology, hydrology, soil properties, and vegetation characteristics. All field data collection and processing adhered to the Specification for Monitoring and Evaluation of Ecological Benefits of Returning Farmland to Forest Project (LY/T 2573-2016) [33] and the Methodology for Long-Term Observation of Forest Ecosystems (GB/T 33027-2016) [34].
The Resource Inventory of the GGP is primarily led by the Office of the Grain for Green Program of the National Forestry and Grassland Administration. Each provincial-level program management agency organizes relevant departments and supporting scientific and technological institutions to conduct annual inventories. These inventories record afforested area and tree age for various species under the three main vegetation restoration types within the program. The data for each preceding year are finalized by the end of March and submitted to the national Office of the Grain for Green Program.
The public dataset used in this study incorporates authoritative socioeconomic data released by Chinese institutions, including the China Statistical Yearbook, and official websites of the Ministry of Agriculture and Rural Affairs, the National Health Commission, Ministry of Water Resources, and the Ministry of Ecology and Environment.
2.4. Assessment of Ecosystem Services
According to the Specification of Monitoring and Evaluation of Ecological Benefits of Returning Farmland to Forest Project (LY/T 2573-2016), the ESVs, including water conservation, soil conservation, carbon sequestration and oxygen release, nutrient fixation, purification of atmospheric environment, and biodiversity conservation, were calculated in this study.
In the monetary valuation of the ecological benefits of the GGP, when converting physical quantities into monetary values, some price parameters are not based on the assessment year’s prices. Therefore, it is necessary to use a discount rate to convert these non-assessment-year price parameters into assessment-year price parameters, in order to calculate the present value of the various functional benefits as follows:
where d, I, n, and i are the discount rate, equilibrium interest rate, the year of price obtained, the year of assessment, the i-th year from the year of price obtained, respectively; Dr and Lr are the annual average interest rates on deposits and loans, respectively.
The ESV was assessed based on six environmental benefits, including the following: water conservation (flood regulation and water quality improvement), soil conservation (reduction in soil erosion), carbon sequestration and oxygen release, nutrient retention, air quality improvements, and biodiversity improvements.
ESV of water conservation. The recovered forests reduce surface storm flow and increase available water resources by increasing effective soil water storage, base flow. Forests also improve water quality by reducing non-point source water pollution. The amount of water regulation by the GGP forests was calculated with the following:
where Gw, P, E, C, and A are the mass of water regulated (m3 year−1), annual precipitation (mm year−1), annual evapotranspiration (mm year−1), ground surface runoff (mm year−1), and forest stand area (ha), respectively.
Two indicators, namely, water regulating value (Uwr) and water purification value (Uwp) were selected to measure the water conservation function of the GGP. The water regulation value of the ecosystem service in the GGP is calculated according to the cost-based method of water storage for reservoir projects. Which was calculated with the following:
where Cdam is the costs of dam construction (yuan year−1).
The WPV is calculated according to the cost of water quality purification by engineering.
where K is water sanitization cost (yuan m−3).
ESV of soil conservation. Soil conservation effects considered in the ESV include reducing soil loss by water or wind erosion and associated nutrient loss associated with soil erosion. The soil conservation effects were estimated by measuring surface soil erosion and the concentration of nutrients in the eroded soil before and after the GGP [24]. The amount of solid soil preserved by the GGP forests was calculated with the following:
where Gsf is the mass of solid soil conserved (t year−1); Xb the mass of soil erosion rate before and Xa after the GGP project implementation (t year−1 ha−1).
The ESV of solid soil conservation. The eroded soil from the upland will be deposited in the reservoir or stream beds which need to be cleaned in order to protect the function of reservoirs and stream channels. The ESV of solid soil conservation was estimated based on the cost to remove the sediment from the reservoir and stream channels.
where Usf is the solid soil fixing value (yuan year−1); C is the cost to remove solid soil from dam or reservoir for one cubic meter (yuan m−3) is soil bulk density (g cm−3).
The mass of soil nutrients conservation is calculated with the following:
where GNi is soil nutrients conservation mass for nitrogen, phosphorus, and potassium, respectively (t year−1); Ni represents the three nutrients content in soil, respectively.
Annual value of soil nutrients conservation is calculated based on corresponding fertilizer cost. The cost of nitrogen, phosphorus and potassium is calculated based on the fertilizer value of diammonium phosphate fertilizer and potassium chloride, respectively. The value of soil nutrients conservation is calculated with the following:
where UN is soil nutrient conservation (yuan year−1); Ri is the content of nutrient in each corresponding fertilizer (%); Ci is the price of the three fertilizers (yuan ton−1).
The ESV of carbon sequestration and oxygen release. Carbon sequestration and oxygen release were estimated based on the Net Primary Productivity (NPP). Commonly used stand volume was not used in order to avoid the specific density variations among the tree species. The NPP values for different plot types were estimated based on measurements of typical plots and the long-term forest observation stations and the corresponding methods [30]. The value of carbon sequestration is calculated with the following:
where GC is the mass of carbon sequestration annually (t yaer−1); BA is the net productivity of forest stand per hectare (t ha−1 yaer−1); FSC is the net carbon sequestration by forest soil per hectare per year (t ha−1 year−1); RC is the carbon content in carbon dioxide (27.27%).
The annual value of carbon sequestration is calculated with the following:
where UC is the value of annual carbon sequestration (yuan year−1); CC is the value of carbon sequestration (yuan t−1).
While photosynthesis of forest produces 1.0 g of dry matter, it can absorb 1.63 g of carbon dioxide and release 1.19 g of oxygen. The annual oxygen release mass is calculated with the following:
where Go is the mass of annual oxygen release mass (t year−1).
The annual value of oxygen release is calculated with the following:
where Uo is annual value of oxygen release (yuan year−1); Co is the cost to make oxygen (yuan t−1).
The nutrient retention. The growing forests assimilate nutrients from the environment and increase total nutrient contents in the ecosystem continuously. The nutrient retention by plants was estimated based on NPP and plant tissue nutrient content by species. The nutrient mass of nitrogen, phosphorus and potassium absorbed annually by forest is calculated with the following:
where i represents the nutrient of nitrogen, phosphorus and potassium elements, respectively; GNi is the mass of nutrient i absorbed annually (t year−1); Ni is average content of nutrient i in trees (%).
The ESV for retention. Based on the respective nitrogen, phosphorous, and potassium content in urea, diammonium phosphate and potassium chloride fertilizers, the nutrient absorption value is calculated with the following:
where UN is the annually nutrient absorption value (yuan year−1); N1, N2 and N3 are average content of nitrogen, phosphorus and potassium in trees, respectively (%); R1 is Nitrogen content in urea fertilizer (%); R2 is phosphorus content in diammonium phosphate fertilizer (%); R3 is potassium content in potassium chloride fertilizer (%); C1 is the price of urea fertilizer (yuan t−1); C2 is the price of diammonium phosphate fertilizer (yuan t−1); C3 is the price of potassium chloride fertilizer (yuan t−1).
The ESV of atmosphere purification. Atmospheric purification effects of GGP forests considered in this study include aero-anion production, and retention of dusts and other air pollutants. The aero-anion benefits were estimated based on measured aero-anion concentrations in specific forest species, canopy height and anion life. The pollutant absorption capacity of sulfur dioxide, nitrogen oxidation, fluoride, fine dust particles were estimated based on measured adsorption capacity and forest area. The value of atmosphere purification is estimated based on three indicators, the cost of producing air anion, adsorbing pollutant and dust.
The number of air anion produced by forest annually as follows:
where Gan is the number of air anion produced by forest annually (ions year−1); Qan is the concentration of air anion concentration in forest (ions cm−3); H is the average height of forest (m); L is the longevity of air anion (min).
When the air anion concentration is above 600 ions per cubic centimeter, it can benefit human body [35,36]. The value of air anion produced by forest annually is calculated with the following:
where Uan is the value of air anion produced by forest annually (Yuan year−1); Kan is the cost to produce air anion (yuan ion−1).
Atmospheric gas pollutants of sulfur dioxide, fluoride and nitrogen oxides and heavy metals of lead, cadmium, and nickel are the main pollutants in China.
The annual absorption of sulfur dioxide, fluoride and nitrogen oxides and lead, cadmium, and nickel as follows:
where Gpi is the air pollutant absorbed or adsorbed by forest annually (t year−1); i represents any one pollutant of sulfur dioxide, fluoride and nitrogen oxides and lead, cadmium, and nickel. Qpi is the mass of i pollutant absorbed by forest stand per hectare (t ha−1 year−1).
The value of pollutant absorption annually is evaluated with the following:
where Upi is the value of i pollutant absorption annually (yuan year−1); Kpi is the expense of i pollutant control (yuan t−1).
The annual dust detention is calculated with the following:
where Gdst is the annual dust detention by forest (t year−1); Qdst is the mass of dust detention by forest stand per hectare (t ha−1 year−1).
The value of dust detention annually is calculated based on the expense of dust clearance. Its annual value is evaluated with the following:
where Udst is the value of dust detention (yuan year−1); Kdst is the cost of dust clearance (yuan t−1).
The ESV of biodiversity conservation. The biodiversity benefits of GGP forests were measured based on a modified Shannon-Wiener index. The modified biodiversity index takes into account of the special value of endangered species and unique high value plant species preserved by the GGP forests [36]. The ESV of biodiversity conservation is calculated with the following:
where UT is the value of biodiversity conservation (yuan year−1); Em is the score of specific endangered species; Bn is the level of the specific endemic species; Or is the age index of old trees r; X is the number of endangered species; y is the number of endemic species; SI is the annual value of biodiversity conservation per hectare (yuan ha−1 year−1); z is the number of old trees, which was set to zero because there were no trees established by GGP had reach old stage by 2013.
The total ESV of the GGP in China reforestation of farmland. The total ecological service value of the converting farmland to forest project is the sum of each service item as follows:
where UI is the total ESV of GGP (yuan year−1); Ui is the value of each service (yuan year−1).
3. Results
3.1. The Progress of the Grain for Green Program in Five Provinces
The land types and forest types after GGP in 2013 are shown in Table 1. As shown, 717.67 × 10⁴ ha of forests had been established since the project launched in the five provinces to the year end of 2013. The distribution of this area reveals distinct regional strategies shaped by local environmental and socio-economic conditions. Gansu and Hebei provinces hosted the largest project areas, reflecting their critical roles in national soil and water conservation agendas, particularly within the ecologically fragile Loess Plateau and North China regions.

Table 1.
The area of the project in five provinces. Unit: (×104 ha).
A critical analysis of the land sources shows that barren land was the primary contributor (58.20%), significantly surpassing cropland (31.12%) and poorly preserved forest land (10.68%). This indicates that the GGP has been strategically focused on restoring the most degraded landscapes, thereby maximizing the potential for ecological gain. In terms of forest types, ecological forests dominated (67.04%), aligning with the program’s primary environmental objectives. The significant regional variation in forest type selection also reflected the environmental conditions. Gansu province had the highest proportion and area of brush (12.54% of the total area in the five provinces), a direct adaptation to its arid and semi-arid climate with annual precipitation below 400 mm and prevalent sandy, aeolian soils. This pattern is consistent with global restoration principles that prioritize drought-tolerant native species in water-limited regions.
3.2. The Amount of ESV of the Grain for Green Program in Five Provinces
The physical quantities of ecosystem services provided by the GGP forests are substantial and vary considerably across provinces (Table 2). These variations are not random but are closely linked to biophysical factors and forest structure. Gansu province, despite its lower precipitation, showed the highest level of soil conservation, which can be attributed to the extensive coverage of brush and ecological forests on formerly barren, erosion-prone lands. Conversely, Hebei province demonstrated the highest water conservation capacity, likely due to a combination of higher forest cover and more favorable hydrological conditions. The data on carbon sequestration reveal a relatively narrow range across provinces with vastly different areas, suggesting that forest age and type, rather than just area, are critical determinants.
Table 2.
The amount of ecosystem services for five provinces.
3.3. The Economic Value of ESV of the Grain for Green Program in Five Provinces
The total ESV generated by GGP in the five provinces was 3604.99 × 108 yuan per year (Table 3). Water conservation emerged as the most valuable service, contributing 46.21% of the total ESV (Figure 4), followed by biodiversity conservation (16.15%) and carbon sequestration and oxygen release (16.12%). The high value for water conservation underscores the program’s critical role in safeguarding regional water security, a benefit that extends far beyond the project sites to downstream communities and economic activities. The results demonstrate that restoring degraded lands yields the highest marginal ecological returns (Figure 5). Across all provinces, ecological forests contributed over 60% of the total ESV (Table 4), overwhelmingly dominating the provision of regulating and supporting services. This proves that the program’s design priority—emphasizing ecological functions—is effectively translated into tangible economic value.
Table 3.
The value of ecosystem services in five provinces. Unit: (×108 Yuan).
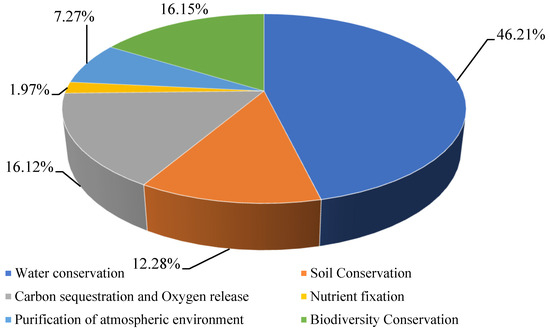
Figure 4.
Different types of ecosystem services value of the five provinces.
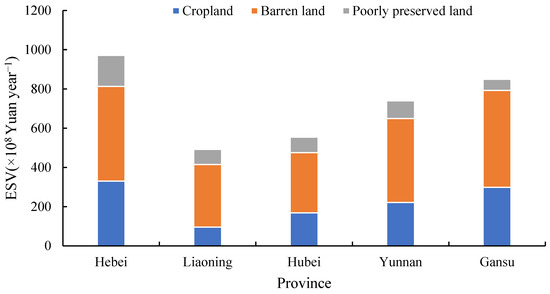
Figure 5.
Ecosystem services value of different land sources in the five provinces.
Table 4.
Ecosystem services value of different forest types in the five provinces.
4. Discussion
The forest areas established under the Grain for Green Program (GGP) in this study were classified into three categories based on their primary functional objectives: ecological forests, economic forests, and brush. This functional classification is central to interpreting program outcomes, as each forest type generates distinct bundles of ecosystem services and involves different trade-offs with local livelihoods [35]. Ecological forests refer to artificially planted or naturally recovered forests dedicated to soil and water conservation and desertification control [30]. Brushes are fast-growing short-statured shrubs adapted to arid and nutrient-poor soils, primarily aimed at reducing wind and water erosion, and are commonly established in northern and northwestern China [36]. Economic forests are plantations managed mainly for timber and non-timber products such as fruits, edible oils, beverages, condiments, industrial raw materials, and medicinal materials, serving as an important source of food and income for local residents. Our findings confirm that the GGP has generated substantial ecosystem service value (ESV), largely driven by water and soil conservation which aligns with its core policy objectives [9]. Yet a deeper comparative analysis reveals critical nuances and challenges that must be addressed in future policy design.
Water conservation (1665.90 × 108 yuan) and soil conservation (442.63 × 10⁸ yuan) together accounted for 58.49% of the total ESV, highlighting the program’s success in addressing its primary goals [9]. The scale of soil conservation value we report is consistent with the findings of Bai et al. [37], who found that vegetation restoration effectively reduces erosion and increases organic carbon storage. This consistency across different methodologies strengthens the evidence for the program’s effectiveness in sediment control. Tao et al. also found that increasing vegetation coverage in Loess Plateau is recommended to control soil erosion [38]. The mechanism underlying improved water conservation, supported by our data, relates to the role of vegetation in regulating surface runoff. Our finding that GGP increases effective water availability by enhancing baseflow aligns with hydrological modeling studies conducted in the upper Yangtze River basin [39,40]. However, these benefits must be interpreted within the broader scientific discourse. While our study highlights the regulatory benefits, our results also indirectly support the well-documented “trade-off” between water yield and vegetation cover, particularly in arid and semi-arid regions. For instance, afforestation in water limited areas such as Gansu may reduce total runoff due to increased evapotranspiration [41,42], a contrast to more humid regions like Yunnan, where such trade-offs are less pronounced. This spatial variation highlights the necessity for region-specific management strategies. Beyond these core services, our assessment captured substantial ESV from carbon sequestration. The projected rise in carbon fixation rates as forests mature is supported by longitudinal studies on forest carbon sinks [43]. Our estimated trajectory of carbon accumulation is comparable to that observed in other young to middle-aged afforestation projects worldwide [44,45,46].
A key finding of our study is the pronounced spatial variation in ESV per unit area and its relationship with regional GDP. Higher ESV in provinces such as Yunnan, compared to Gansu and Liaoning, can be primarily attributed to biophysical factors such as higher precipitation and temperature, which support higher biomass productivity [30,47]. This positive correlation between climatic factors and ESV per unit area is a well-established pattern in large-scale ESV assessments, mirroring findings from global studies like that of Costanza et al., which showed higher service values in tropical moist forests compared to temperate ones [15]. However, a purely biophysical explanation is insufficient. The striking disparity in the ratio of total ESV to provincial GDP [48]—ranging from 15.16% in Gansu to 1.98% in Liaoning—demands a socioeconomic contextualization. This pattern echoes findings from other developing economies, where natural capital often constitutes a larger share of wealth in less industrialized regions [49]. Our results provide a concrete Chinese case study that reinforces the global paradigm of the “Environmental Kuznets Curve”, where the relative importance of natural capital to economic wealth decreases in the early stages of industrial development [50]. This underscores that although ESV is not directly reflected in conventional GDP accounting, its contribution to human well-being and economic resilience is disproportionately vital in less developed areas. Therefore, the GGP’s role in poverty alleviation and regional inequality reduction, through both direct subsidies and the provision of vital ecosystem services, should be recognized as a key co-benefit [35].
The long-term success of the GGP depends on addressing ecological risks and ensuring socio-economic equity [35]. Early reliance on monocultures of fast-growing species (e.g., poplar in the north, Chinese fir in the south) introduced recognized vulnerabilities to pests and diseases, threatening the program’s ecological stability [30]. This issue is not unique to China; other large-scale afforestation programs have faced similar challenges, underscoring the global importance of using diverse, native species to build resilient ecosystems [51,52]. For instance, studies of monoculture plantations in other regions have revealed comparable susceptibilities to disturbances, reinforcing that biodiversity is a key insurance policy for maintaining ecosystem functions under global change [53]. Furthermore, the sustainability of the GGP is intrinsically linked to the support of local residents. As a Payment for Ecosystem Services (PES) scheme, its continuity depends on perceived fairness and tangible benefits [12,54]. A critical challenge lies in the spatial mismatch between those who bear the costs and those who enjoy the broader benefits—a common issue in PES programs worldwide, where defining and financing equitable compensation remains complex [9,55]. The success of PES programs often hinges on “additionality” and “conditionality”, ensuring that payments lead to verifiable conservation outcomes that would not have occurred otherwise [56]. Our findings suggest that while the initial central government subsidies effectively launched the program, a transition toward more diversified and sustainable incentive structures is needed. This could include, as implied by our study, policies that facilitate rural-urban migration, provide social security, and foster alternative livelihoods, thereby reducing the direct dependence on land-based income [30,35]. Equitable cost and benefit sharing among local, regional, and national stakeholders remains a pivotal issue that requires innovative institutional and financial mechanisms [57].
Based on our empirical findings, we propose the following concrete policy recommendations: (1) prioritize ecological forest types: future subsidy schemes and planning should explicitly favor the establishment and maintenance of ecological forests over purely economic plantations in ecologically sensitive areas, given their superior performance in delivering key services like water conservation; (2) implement differentiated regional strategies: policy support should be tailored to regional contexts. In arid and semi-arid provinces, the focus should be on drought-tolerant species for soil and wind erosion control, while in humid provinces, strategies can maximize a broader suite of services, including water regulation and carbon sequestration; and (3) establish long-term maintenance mechanisms: to secure the continued flow of these valuable services, a transition towards a sustainable, multi-stakeholder ecological compensation mechanism is essential. This would ensure long-term funding for forest management beyond the initial afforestation subsidies.
This assessment, while comprehensive, has several limitations that should be acknowledged. First, it is limited to a set of key, quantifiable ESV indicators. Important cultural services, such as aesthetic and recreational values, were not included due to data constraints. Second, the ESV calculation relies on unit value transfers and price parameters that, despite adjustments, may not fully capture local market dynamics or ecological complexities. Finally, as most GGP forests were still in juvenile stages during our study period, the full magnitude of their ecosystem service potential, particularly for carbon sequestration, is yet to be realized. Future research should therefore aim at the following: (1) incorporate cultural service indicators and refine valuation methods to reduce uncertainty; (2) extend the temporal scope of analysis to track the maturation of GGP forests; and (3) employ more spatially explicit modeling to identify ecosystem service hotspots for targeted policy intervention.
5. Conclusions
This study demonstrates that the Grain for Green Program (GGP) in the five representative provinces has successfully established 717.67 × 10⁴ ha of forest, generating a substantial total ecosystem service value (ESV) of 3604.99 × 108 yuan per year. Crucially, the program has not only fulfilled its original soil and water conservation goals but also delivered significant additional benefits, including biodiversity conservation, carbon sequestration, and atmospheric purification through the absorption of pollutants and dust. Our analysis confirms that water conservation constitutes the largest share of the total ESV, underscoring the critical role of GGP forests in regional water security. Furthermore, the ESV is primarily influenced by the target forest type rather than the origin of the land, providing a key insight for future policy design: the ecological function of the restored vegetation is more important than the previous land use.
Author Contributions
Validation, M.J.; Formal analysis, M.J.; Investigation, H.L.; Resources, T.X.; Data curation, M.J.; Writing—original draft, T.X.; Writing—review & editing, T.X.; Visualization, H.L.; Supervision, H.L. All authors have read and agreed to the published version of the manuscript.
Funding
This research was funded by Assessment and Valuation of Forest-Grassland Ecosystems, grant number 2021ZDKT003-2 and The APC was funded by National Forestry and Grassland Administration.
Data Availability Statement
Data are contained within the article.
Acknowledgments
Xiang Niu and Bing Wang (Ecology and Nature Conservation Institute, Chinese Academy of Forestry) were acknowledged to provide data source, scientific guidance and methodology.
Conflicts of Interest
The authors declare no conflicts of interest.
References
- Portmann, R.; Beyerle, U.; Davin, E.; Fischer, E.M.; Hertog, S.D.; Schemm, S. Global forestation and deforestation affect remote climate via adjusted atmosphere and ocean circulation. Nat. Commun. 2022, 13, 5569. [Google Scholar] [CrossRef]
- Wang, B.; Gao, P.; Niu, X.; Sun, J.N. Policy-driven China’s grain to green program: Implications for ecosystem services. Ecosyst. Serv. 2017, 27, 38–47. [Google Scholar] [CrossRef]
- Gotlieb, Y.; Garcia, G.J.D. The role of land use conversion in shaping the land cover of the Central American Dry Corridor. Land Use Policy 2020, 94, 104351. [Google Scholar] [CrossRef]
- Veettil, B.K.; Wickramasinghe, D.; Amarakoon, V. Mangrove forests in Sri Lanka: An updated review on distribution, diversity, current state of research and future perspectives. Reg. Stud. Mar. Sci. 2023, 62, 102932. [Google Scholar] [CrossRef]
- Ferreira, G.B.; Thomas, L.; Ingram, D.J.; Bevan, P.A.; Madsen, E.K.; Thanet, D.R.; Rayamajhi, S.; Jones, K.E. Wildlife response to management regime and habitat loss in the Terai Arc Landscape of Nepal. Biol. Conser. 2023, 288, 110334. [Google Scholar] [CrossRef]
- Yan, H.M.; Yang, H.C.; Guo, X.N.; Zhao, S.Q.; Jiang, Q.O. Payments for ecosystem services as an essential approach to improving ecosystem services: A review. Ecol. Econ. 2022, 201, 107591. [Google Scholar] [CrossRef]
- Engel, S.; Pagiola, S.; Wunder, S. Designing payments for environmental services in theory and practice: An overview of the issues. Ecol. Econ. 2008, 65, 663–674. [Google Scholar] [CrossRef]
- Li, S.D.; Liu, M.C. The development process, current situation and prospects of the conversion of farmland to forests and grasses project in China. J. Resour. Ecol. 2022, 13, 120–128. [Google Scholar] [CrossRef]
- Song, W.Q.; Feng, Y.H.; Wan, Z.H. Ecological restoration programs dominate vegetation greening in China. Sci. Total Environ. 2022, 848, 157729. [Google Scholar] [CrossRef]
- Zhang, X.; Deng, Y.J.; Hou, M.Y.; Yao, S.B. Response of land use change to the Grain for Green Program and its driving forces in the Loess Hilly-Gully region. Land 2021, 10, 194. [Google Scholar] [CrossRef]
- Chen, Y.P.; Wang, K.B.; Lin, Y.S.; Shi, W.Y.; Song, Y.; He, X.H. Balancing green and grain trade. Nat. Geosci. 2015, 10, 739–741. [Google Scholar] [CrossRef]
- Xu, T.Y.; Niu, X.; Wang, B. The Grain for Green Project in contiguous poverty-stricken regions of China: A nature-based solution. Sustainability 2022, 14, 7755. [Google Scholar] [CrossRef]
- Yuan, W.G.; Zheng, J.W.; Gu, J.C.; Lu, G.Q. Responses of forest eco-service values to biotopes in the China’s Conversion of Cropland to Forest Program. Environ. Earth Sci. 2019, 78, 147. [Google Scholar] [CrossRef]
- Zhang, M.Y.; Zhang, L.; He, H.L.; Ren, X.L.; Lv, Y.; Niu, Z.E.; Chang, Q.Q.; Xu, Q.; Liu, W.H. Improvement of ecosystem quality in National Key Ecological Function Zones in China during 2000–2015. J. Environ. Manag. 2022, 324, 116406. [Google Scholar] [CrossRef]
- Costanza, R. Valuing natural capital and ecosystem services toward the goals of efficiency, fairness, and sustainability. Ecosyst. Serv. 2020, 43, 101096. [Google Scholar] [CrossRef]
- MEA (Millennium Ecosystem Assessment). Ecosystems and Human Well-Being; Island Press: Washington DC, WA, USA, 2005; pp. 25–60. [Google Scholar]
- Peng, J.; Hu, X.X.; Wang, X.Y.; Meersmans, J.; Liu, Y.X.; Qiu, S.J. Simulating theimpact of Grain-for-Green Programme on ecosystem services trade-offs in Northwestern Yunnan, China. Ecosyst. Serv. 2019, 39, 100998. [Google Scholar] [CrossRef]
- Gong, J.; Liu, D.Q.; Zhang, J.X.; Xie, Y.C.; Cao, E.J.; Li, H.Y. Tradeoffs/synergies of multiple ecosystem services based on land use simulation in a mountain-basin area, westemm China. Ecol. Indic. 2019, 99, 283–293. [Google Scholar] [CrossRef]
- Peng, J.; Wang, X.Y.; Zheng, H.N.; Xu, Z.H. Applying production-possibility frontier based ecosystem services trade-off to identify optimal scenarios of Grain-for-Green Program. Landsc. Urban Plan. 2024, 242, 104956. [Google Scholar] [CrossRef]
- He, J.; Shi, X.Y.; Fu, Y.J.; Yuan, Y. Evaluation and simulation of the impact of land use change onecosystem services trade-offs in ecological restoration areas, China. Land Use Policy 2020, 99, 105020. [Google Scholar] [CrossRef]
- Niu, X.; Wang, B.; Liu, S.R.; Liu, C.J.; Wei, W.J.; Kauppi, P.E. Economical assessment of forest ecosystem services in China: Characteristics and implications. Ecol. Complex. 2012, 11, 1–11. [Google Scholar] [CrossRef]
- Pérez-Silos, I.; Álvarez-Martíne, J.M.; Barquín, J. Large-scale afforestation for ecosystem service provisioning: Learning from the past to improve the future. Landsc. Ecol. 2021, 36, 3329–3343. [Google Scholar] [CrossRef]
- Hollister, R.D. Why we need long-term monitoring to understand ecosystem change. Proc. Natl. Acad. Sci. USA 2024, 121, e2409666121. [Google Scholar] [CrossRef]
- State Forestry Administration of China. National Report of Ecological Benefit Monitoring for the Natural Forest Protection Project: 2015; China Forestry Press: Beijing, China, 2016.
- Sun, Y.; Li, H. Data mining for evaluating the ecological compensation, static and dynamic benefits of returning farmland to forest. Environ. Res. 2021, 201, 111524. [Google Scholar] [CrossRef]
- Brownson, K.; Anderson, E.P.; Ferreira, S.; Wenger, S.; Foweler, L.; German, L. Governance of Payments for Ecosystem Ecosystem services influences social and environmental outcomes in Costa Rica. Ecol. Econ. 2020, 174, 106659. [Google Scholar] [CrossRef]
- Dong, S.K.; Xu, Y.D.; Li, S.; Shen, H.; Yang, M.Y.; Xiao, J.N. Restoration actions associated with payment for ecosystem services promote the economic returns of alpine grasslands in China. J. Clean. Prod. 2024, 458, 142439. [Google Scholar] [CrossRef]
- Seema, J.; Joost, D.L.; Eric, F.L.; Charlotte, Y.S.; Robin, A.; Nancy, E.T. Cash for carbon: A randomized trial of payments for ecosystem services to reduce deforestation. Science 2017, 357, 267–273. [Google Scholar] [CrossRef] [PubMed]
- Sarujan, S.; Takeshi, S. Effectiveness of community participation in Mangrove restoration: The evidence from northern Sri Lanka. Environ. Econ. Policy 2024, 26, 759–779. [Google Scholar]
- State Forestry Administration of China. National Report of Ecological Benefit Monitoring for the Grain for Green Project: 2013; China Forestry Press: Beijing, China, 2014.
- Tiina, H.; Pier, P.F. Ecosystem services assessment: A review under an ecological-economic and systems perspective. Ecosyst. Serv. 2014, 289, 124–132. [Google Scholar]
- Kenneth, J.B.; Darius, J.S.; Sissel, W.; Robert, W. A comparative assessment of tools for ecosystem services quantification and valuation. Ecosyst. Serv. 2013, 5, 27–39. [Google Scholar]
- LY/T 2573-2016; State Forestry Administration of China. Specification of Monitoring and Evaluation of Ecological Benefits of Returning Farmland to Forest Project. China Standard Press: Beijing, China, 2016.
- GB/T 33027-2016; State Forestry Administration of China. Methodology for Field Long-Term Observation of Forest Ecosystem. China Standard Press: Beijing, China, 2016.
- State Forestry Administration of China. National Report of Comprehensive Benefit Monitoring for the Grain for Green Project: 2017; China Forestry Press: Beijing, China, 2020.
- State Forestry Administration of China. National Report of Comprehensive Benefit Monitoring for the Grain for Green Project: 2020; China Forestry Press: Beijing, China, 2023.
- Bai, R.H.; Zhao, X.N.; Wang, X.Z.; Lv, W.W.; Li, J.W.; Yang, F.; Shangguan, Z.P.; Deng, L. SOC erosion reduction of the “Grain for green” program on the Loess Plateau, China. Soil Till. Res. 2026, 256, 106863. [Google Scholar] [CrossRef]
- Tao, W.H.; Liu, S.Y.; Wang, Q.J.; Sun, L.J.; Sun, Y. Spatiotemporal characteristics of soil erosion on the Chinese Loess Plateau and strategies for vegetation management. J. Soil Sci. Plant Nutr. 2024, 24, 4439–4456. [Google Scholar] [CrossRef]
- Liu, S.Z.; Seybold, H.; Meerveld, I. Tree planting and soil conservation measures have strongly attenuated storm runoff responses on the Chinese Loess Plateau. J. Hydrol. 2025, 662, 134039. [Google Scholar] [CrossRef]
- Wang, A.; Wang, J.Y.; Luan, B.J.; Zhang, M.; Wang, X.; Yu, P. Quantifying the impact of land use changes on surface runoff in the Loess Plateau area of Northwest China by SWAT. J. Environ. Manag. 2025, 377, 124641. [Google Scholar] [CrossRef]
- Yu, Y.P.; Yu, P.T.; Wang, Y.H.; Wan, Y.F.; Wang, B.; Han, X.S.; Tu, X.W.; Li, J.M.; Xu, L.H.; Wang, X.; et al. Natural revegetation has dominated annual runoff reduction since the Grain for Green Program began in the Jing River Basin, Northwest China. J. Hydrol. 2023, 625, 129978. [Google Scholar] [CrossRef]
- Feng, X.M.; Fu, B.J.; Piao, S.L.; Wang, S.; Ciais, P.; Zeng, Z.Z.; Lv, Y.H.; Zeng, Y.; Li, Y.; Jiang, X.H.; et al. Revegetation in China’s Loess Plateau is approaching sustainable water resource limits. Nat. Clim. Chang. 2016, 6, 1019–1022. [Google Scholar] [CrossRef]
- Zhang, M.Y.; He, H.L.; Zhang, L.; Yu, G.R.; Ren, X.L.; Huang, Y.Y.; Yuan, W.P.; Niu, Z.E. A Terrestrial Ecosystem Carbon Sink Assessment Model Considering Forest Age Dynamics (CEVSA-AgeD). J. Adv. Model. Earth Syst. 2024, 17, e2024MS004575. [Google Scholar] [CrossRef]
- Guo, B.Q.; Fang, M.J.; Yang, L.L.; Guo, T.; Ma, C.; Hu, X.Y.; Guo, Z.X.; Ma, Z.M.; Li, Q.; Wang, Z.L.; et al. Remapping carbon storage change in retired farmlands on the Loess Plateau in China from 2000 to 2021 in high spatiotemporal resolution. Earth Syst. Sci. Data 2025, 222, 1–19. [Google Scholar]
- Pang, L.H.; Tian, C.J.; Yuan, Q.Z.; Deng, W. Effects of different restoration years on soil carbon sequestration and water retention capacity in bamboo forest: A case study in Southwest China Karst. Ecol. Eng. 2025, 210, 107434. [Google Scholar] [CrossRef]
- Nave, L.E.; Swanston, C.W.; Mishra, U.; Nadelhoffer, K.J. Afforestation effects on soil carbon storage in the United States: A synthesis. Soil Sci. Soc. Am. J. 2013, 77, 1035–1047. [Google Scholar] [CrossRef]
- Wang, X.T.; He, H.L.; Zhang, M.Y.; Deng, J.M.; Ren, X.L.; Lv, Y.; Liu, W.H.; Lin, Z.N.; Dong, S.Y. Grain for Green Project dominates greening in afforested areas rather than that in grass revegetation areas of the Loess Plateau China—using Deep Crossing LSTM Age network. Environ. Res. Lett. 2025, 20, 084068. [Google Scholar] [CrossRef]
- National Bureau of Statistics of China. China Statistical Yearbook; China Statistics Press: Beijing, China, 2013.
- Zheng, H.; Wu, T.; Ouyang, Z.Y.; Polasky, S.; Ruckelshaus, M.; Wang, L.J.; Xiao, Y.; Gao, X.L.; Li, C.; Daily, G.C. Gross ecosystem product (GEP): Quantifying nature for environmental and economic policy innovation. Ambio 2023, 52, 1952–1967. [Google Scholar] [CrossRef]
- Dasgupta, S.; Laplante, B.; Wang, H.; Wheeler, D. Confronting the Environmental Kuznets Curve. J. Econ. Perspect. 2002, 16, 147–168. [Google Scholar] [CrossRef]
- Yin, C.C.; Zhao, W.W.; Pereira, P. Ecosystem restoration along the “pattern-process-service-sustainability” path for achieving land degradation neutrality. Landsc. Urban Plan. 2025, 253, 105227. [Google Scholar] [CrossRef]
- MacKenzie, W.H.; Mahony, C.R. An ecological approach to climate change-informed tree species selection for reforestation. For. Ecol. Manag. 2021, 481, 118705. [Google Scholar] [CrossRef]
- Jactel, H.; Moreira, X.; Castagneyrol, B. Tree diversity and forest resistance to insect pests: Patterns, mechanisms, and prospect. Annu. Rev. Entomol. 2021, 66, 277–296. [Google Scholar] [CrossRef]
- Li, L.C.; Liu, C.; Liu, J.L.; Cheng, B.D. Has the Slope Land Conversion Program in China impacted the income and employment of rural households? Land Use Policy 2021, 109, 105648. [Google Scholar] [CrossRef]
- Naime, J.; Angelsen, A.; Molina-Garzon, A.; Carrilho, C.D.; Selviana, V.; Demarchi, G.; Duchelle, A.E.; Martius, C. Enforcement and inequality in collective PES to reduce tropicaldeforestation: Effectiveness, efficiency and equity implications. Glob. Environ. Chang. 2022, 74, 102520. [Google Scholar] [CrossRef]
- Wunder, S. Revisiting the concept of payments for environmental services. Ecol. Econ. 2015, 117, 234–243. [Google Scholar] [CrossRef]
- Wang, C.M.; Maclaren, V. Evaluation of economic and social impacts of the sloping land conversion program: A case study in Dunhua County, China. For. Policy Econ. 2012, 14, 50–57. [Google Scholar] [CrossRef]
Disclaimer/Publisher’s Note: The statements, opinions and data contained in all publications are solely those of the individual author(s) and contributor(s) and not of MDPI and/or the editor(s). MDPI and/or the editor(s) disclaim responsibility for any injury to people or property resulting from any ideas, methods, instructions or products referred to in the content. |
© 2025 by the authors. Licensee MDPI, Basel, Switzerland. This article is an open access article distributed under the terms and conditions of the Creative Commons Attribution (CC BY) license (https://creativecommons.org/licenses/by/4.0/).