Article

Disentangling the Cooling Effects of Transpiration and Canopy Shading: Case Study of an Individual Tree in a Subtropical City

1
School of Environment and Energy, Peking University, Shenzhen 518055, China
2
Shenzhen Campus of Sun Yat-sen University, Shenzhen 518107, China
3
School of Ecology, Sun Yat-sen University, Guangzhou 510275, China
*
Author to whom correspondence should be addressed.
Forests 2025, 16(10), 1564; https://doi.org/10.3390/f16101564
Submission received: 1 September 2025 / Revised: 25 September 2025 / Accepted: 8 October 2025 / Published: 10 October 2025

Abstract

Transpiration and canopy shading are the main ways that trees cool urban environments; this is crucial to human survival and improving urban livability in the context of global warming and rapid urbanization. So far, most studies focus on the combined cooling effect of transpiration and canopy shading, but their individual contributions have not been widely explored. Therefore, a quantitative framework was developed by carrying out a long-term field experiment and microenvironment simulations to investigate the cooling effect of a single Ficus concinna. The results show that the annual mean cooling effects of shading and transpiration are 0.17 ± 0.27 °C and 0.30 ± 0.13 °C, accounting for 21.2 ± 51.6% and 44.7 ± 26.3% of total cooling, respectively. Shade cooling demonstrates strong radiative dependence, reaching a peak of 0.63 °C with a cooling contribution of 77.1% during summer at noon due to solar radiation interception. In contrast, nighttime and winter conditions revealed shading-induced temperature increases up to 0.52 °C via longwave radiation reflection. By contrast, transpiration cooling demonstrated temperature dependence, which increased with air temperature and peaked at 1.03 °C (contributing 70.0% to the total cooling) before stomata closing. This mechanistic analysis quantitatively reveals that F. concinna provides cooling effects through a dynamic complementarity between transpiration and shading. These findings could offer a biophysically grounded basis for optimizing urban greening strategies and contribute to the theoretical advancement of nature-based urban climate solutions.

1. Introduction

Subtropical cities are among the areas most severely affected by the urban heat island effect and heat waves [1] due to their higher air temperature, denser population, and increasing impermeable materials [2,3,4]. This situation could become more severe with ongoing global warming and the increasing frequency of heat waves [5,6,7]. Elevated urban temperatures not only reduce thermal comfort but also pose serious public health risks, notably elevated mortality rates in vulnerable groups such as older adults [8,9,10]. In response, policymakers and urban planners have sought strategies to mitigate urban heat island effects [11] and green infrastructures have been recognized as an effective approach [12,13,14,15].
Trees are one of the most important components of urban green infrastructures and play a significant role in thermal environment regulation. Extensive studies have shown that urban areas with tree cover exhibit lower temperatures compared to treeless urban green spaces [16,17,18]. Trees regulate temperatures in two major ways [19]: a well-known process is shading, where tree canopies intercept solar radiation to reduce heat absorption on underlying surfaces and lower temperatures [20,21]. In addition to shading, trees can cool the atmosphere through transpiration, a process in which water is released from leaf surfaces. Transpiration can utilize nearly all available net radiation through latent heat, thereby decreasing sensible heat and cooling both the canopy and the surrounding air [22,23]. Collectively, shading and transpiration enable trees to intercept approximately 50%–90% of incoming shortwave radiation [24], reduce air temperatures by an average of 0.5–3.0 °C [25], and lower ground surface temperatures by as much as 3–20 °C between shaded and exposed asphalt [26].
Although the biophysical cooling processes of trees are well understood, a quantitative study on the individual cooling potential of shading and transpiration remains limited. Most research focuses on their combined effects, with relatively few studies attempting to isolate and evaluate their individual contributions [27,28,29]. Furthermore, the tree cooling effect is influenced by many factors such as tree-specific traits, background climate conditions, and green space configuration [30,31]. Crucially, shading and transpiration exhibit divergent responses to the same environmental variables. For instance, increased green cover enhances canopy shading but may reduce transpiration rates [32,33], which means that the dominant cooling mechanism varies with environmental conditions. Separate quantification of tree shading and transpiration cooling effects can deepen our understanding of tree cooling mechanisms, allowing for more economical and effective strategies for mitigating urban heat stress.
So far, several investigations have applied experimental or modeling approaches to understand these effects. For example, Tan et al. [34] assessed the role of transpiration by severing plant roots to inhibit water uptake; Pace et al. [35] used an energy budget analysis to estimate the energy expended through shading and transpiration; and Manickathan et al. [36] employed a computational fluid dynamics model to investigate the cooling effects of tree transpiration and shading. These studies offer innovative, valuable methodological advancements for quantifying the cooling contributions of shading and transpiration. However, most of the studies identify shading as the dominant mechanism in tree-induced cooling, while the temperature regulation of transpiration processes received limited attention. As a matter of fact, these findings are often based on short-term measurements conducted during sunny summer days or heatwave periods [37,38], when transpiration may be constrained by stomatal closure under high temperature conditions [39], whereas shading effects are amplified due to heightened solar radiation. Such temporal limitations can lead to an incomplete understanding of the cooling mechanisms of urban trees.
In this study, we propose the following hypotheses for a tree in a subtropical city: (1) transpiration would be the dominant cooling mechanism with ample water availability, and (2) the relative contributions of shading and transpiration would shift dynamically with meteorological conditions, exhibiting a complementary relationship. To test these hypotheses, we conducted a year-long field experiment in Shenzhen, a subtropical city characterized by intense solar radiation and abundant precipitation, which create favorable conditions for canopy shading and vegetation transpiration [40,41]. The climatic conditions in this city offer a unique opportunity to examine the effects of tree transpiration and canopy shading across different environmental conditions. To disentangle the intertwined effects of transpiration and shading—which is challenging through field measurements alone—we employed the ENVI-met microclimate model (version 5.1.1). This tool allows for the creation of controlled, idealized scenarios (e.g., simulating a tree without transpiration) that are infeasible in real-world experiments. By integrating continuous in situ monitoring with ENVI-met microclimate simulations, we independently quantified the cooling contributions of tree shading and transpiration and analyzed their temporal dynamics over an annual cycle. The objectives of this study are to (1) investigate the combined cooling effects across various temporal scales, (2) qualify the relative contributions of tree transpiration and canopy shading, and (3) analyze the response mechanisms of tree cooling processes to environmental changes.

2. Materials and Methods

2.1. Study Area and Field Experiments

This study was conducted in Shenzhen, China (22°35′ N, 113°58′ E, Figure 1a), a subtropical coastal city characterized by a mild winter and hot summer, with average temperatures of 14.9 °C in January (coldest month) and 28.6 °C in July (hottest month). The study area is located in a university campus, with the coverage of buildings, paved surfaces, grasslands and woodlands being about 25.68%, 4.65%, 24.43% and 30.72% (Figure 1b). The campus vegetation is representative of urban green spaces in subtropical South China, dominated by species such as the evergreen Ficus concinna (the primary street tree), Terminalia neotaliala, Araucaria cunninghamii, and Albizia julibrissin. F. concinna is a native and universal tree species that is commonly cultivated in subtropical areas. Its prevalence and use in numerous urban ecological studies make it a representative and ecologically significant subject for investigating tree cooling mechanisms. In this study, an individual 12-year-old F. concinna was chosen for detailed observation. The tree has a height of 5 m, a diameter at the breast (DBH) of 0.32 m, and a crown area of 29 m2 (Figure 1d). It is situated on an open lawn with no surrounding structures or nearby trees, ensuring minimal external interference with microenvironmental measurements. To account for the influence of lawn evapotranspiration beneath tree canopies, an adjacent lawn area within the same campus was selected as the control site (Figure 1c).
In this study, the air temperature at pedestrian height was used as an indicator to evaluate the cooling effect of the tree. Air temperature and relative humidity were measured simultaneously in both direct sunlight and beneath the tree canopy using sensors (225-050YA, Novalynx, Grass Valley, CA, USA) installed at a height of 2 m above the ground at both experiment sites. Shortwave and longwave radiation were measured at both sites using radiometers (PYP-PA, Apogee, Santa Monica, CA, USA) mounted at a height of 2 m. These instruments captured radiation conditions under both sunlight and shaded areas. Wind speed and direction were monitored using an anemometer (03002L, Campbell Scientific, Logan, UT, USA) mounted 3 m above the ground at the lawn experiment site. In addition, we conducted transpiration measurements of the F. concinna using a sap flow system (SF-G type probes, Ecomatic, Munich, Germany). All measurements were recorded at 1 min intervals, averaged over 10 min periods, and stored using a data logger (CR1000, Campbell Scientific, Logan, UT, USA).
This study conducted a year-long continuous observation, collecting meteorological data from January to December in 2022, to analyze the dynamic variations in the tree cooling effect. Sap flow data were continuously collected from July to November.

2.2. Microclimate Simulation

In existing studies, the cooling effects of transpiration and shading are usually separated through experimental approaches or model simulations. Experimental approaches often require direct intervention to suppress the transpiration process, such as halting water supply or severing root systems, which can cause detrimental damage to the plants. In contrast, microclimate models provide a more flexible and non-invasive means of simulating idealized scenarios. Among them, Computational Fluid Dynamics (CFD) is widely used to simulate heat transfer and airflow dynamics across spatial scales ranging from street canyons to entire urban districts [42].
A commonly adopted CFD model is ENVI-met, which is specifically designed to simulate surface–plant–air interactions in urban environments at high spatial and temporal resolutions. ENVI-met employs the numerical solution of a set of governing physical equations to derive key microclimatic variables, such as air temperature, surface temperature, wind speed, relative humidity, and various thermal comfort indices [43]. ENVI-met has been proven to be reliable for simulating air temperature and relative humidity, showing high agreement with measured data [44]. Its capacity to capture fine-scale environmental variables allows for detailed assessments of urban design impacts on local climate conditions and human thermal comfort [45]. ENVI-met facilitates the creation of “ideal scenarios” through its advanced modeling capabilities, allowing researchers to quantify the benefits of different green infrastructure and surface material strategies on microclimate and thermal comfort, ultimately informing sustainable urban design [46].
In this study, ENVI-met version 5.1.1 was employed to simulate the cooling capacity of an individual tree. The ENVI-met simulation was conducted following a systematic workflow: spatial scenario design, parameterization, model execution, and result extraction. The model domain consisted of 40 × 40 × 20 three-dimensional grid cells, with a spatial resolution of 0.5 × 0.5 × 0.5 m. The physical properties of surface covers, including albedo, thermal conductivity, heat capacity, and initial soil moisture, were parameterized based on field measurements from our previous study [47]. A custom-designed F. concinna tree model was incorporated at the center of the domain. Its height and leaf area density (LAD) were assigned based on field measurements, while its root depth and density were referenced from studies on the same species in a similar climatic zone [27,48]. Finally, the meteorological data (air temperature, relative humidity, wind speed/direction, and solar radiation) measured over the lawn area (Section 2.1) were used as driving forces for the simulation. The simulations were initialized using fully forced lateral boundary conditions to maintain realistic meteorological inputs. For the analysis of the tree’s cooling effect, the simulated air temperature at a height of 1.75 m from the grid cell nearest to the observation point was extracted and used for subsequent calculation.
Due to the high sensitivity of the ENVI-met model to input driving data, excessively high wind speeds can cause model divergence, leading to computational instability. While rainfall introduces an additional source of evaporation, it complicates the isolation of the transpiration cooling effect. Therefore, data from days with severe winds (wind speeds exceeding 8 m/s) and rainy conditions were excluded from the analysis. Meteorological data from 195 days in 2022 with complete observational records were used as input for the simulations. During the study period, air temperatures ranged from 6.9 °C to 38.7 °C, and relative humidity varied between 32.1% and 100%. Each simulation was run for a 24 h period (from 00:00 to 24:00), with model outputs generated at hourly intervals.

2.3. Designing the Simulation Scenarios

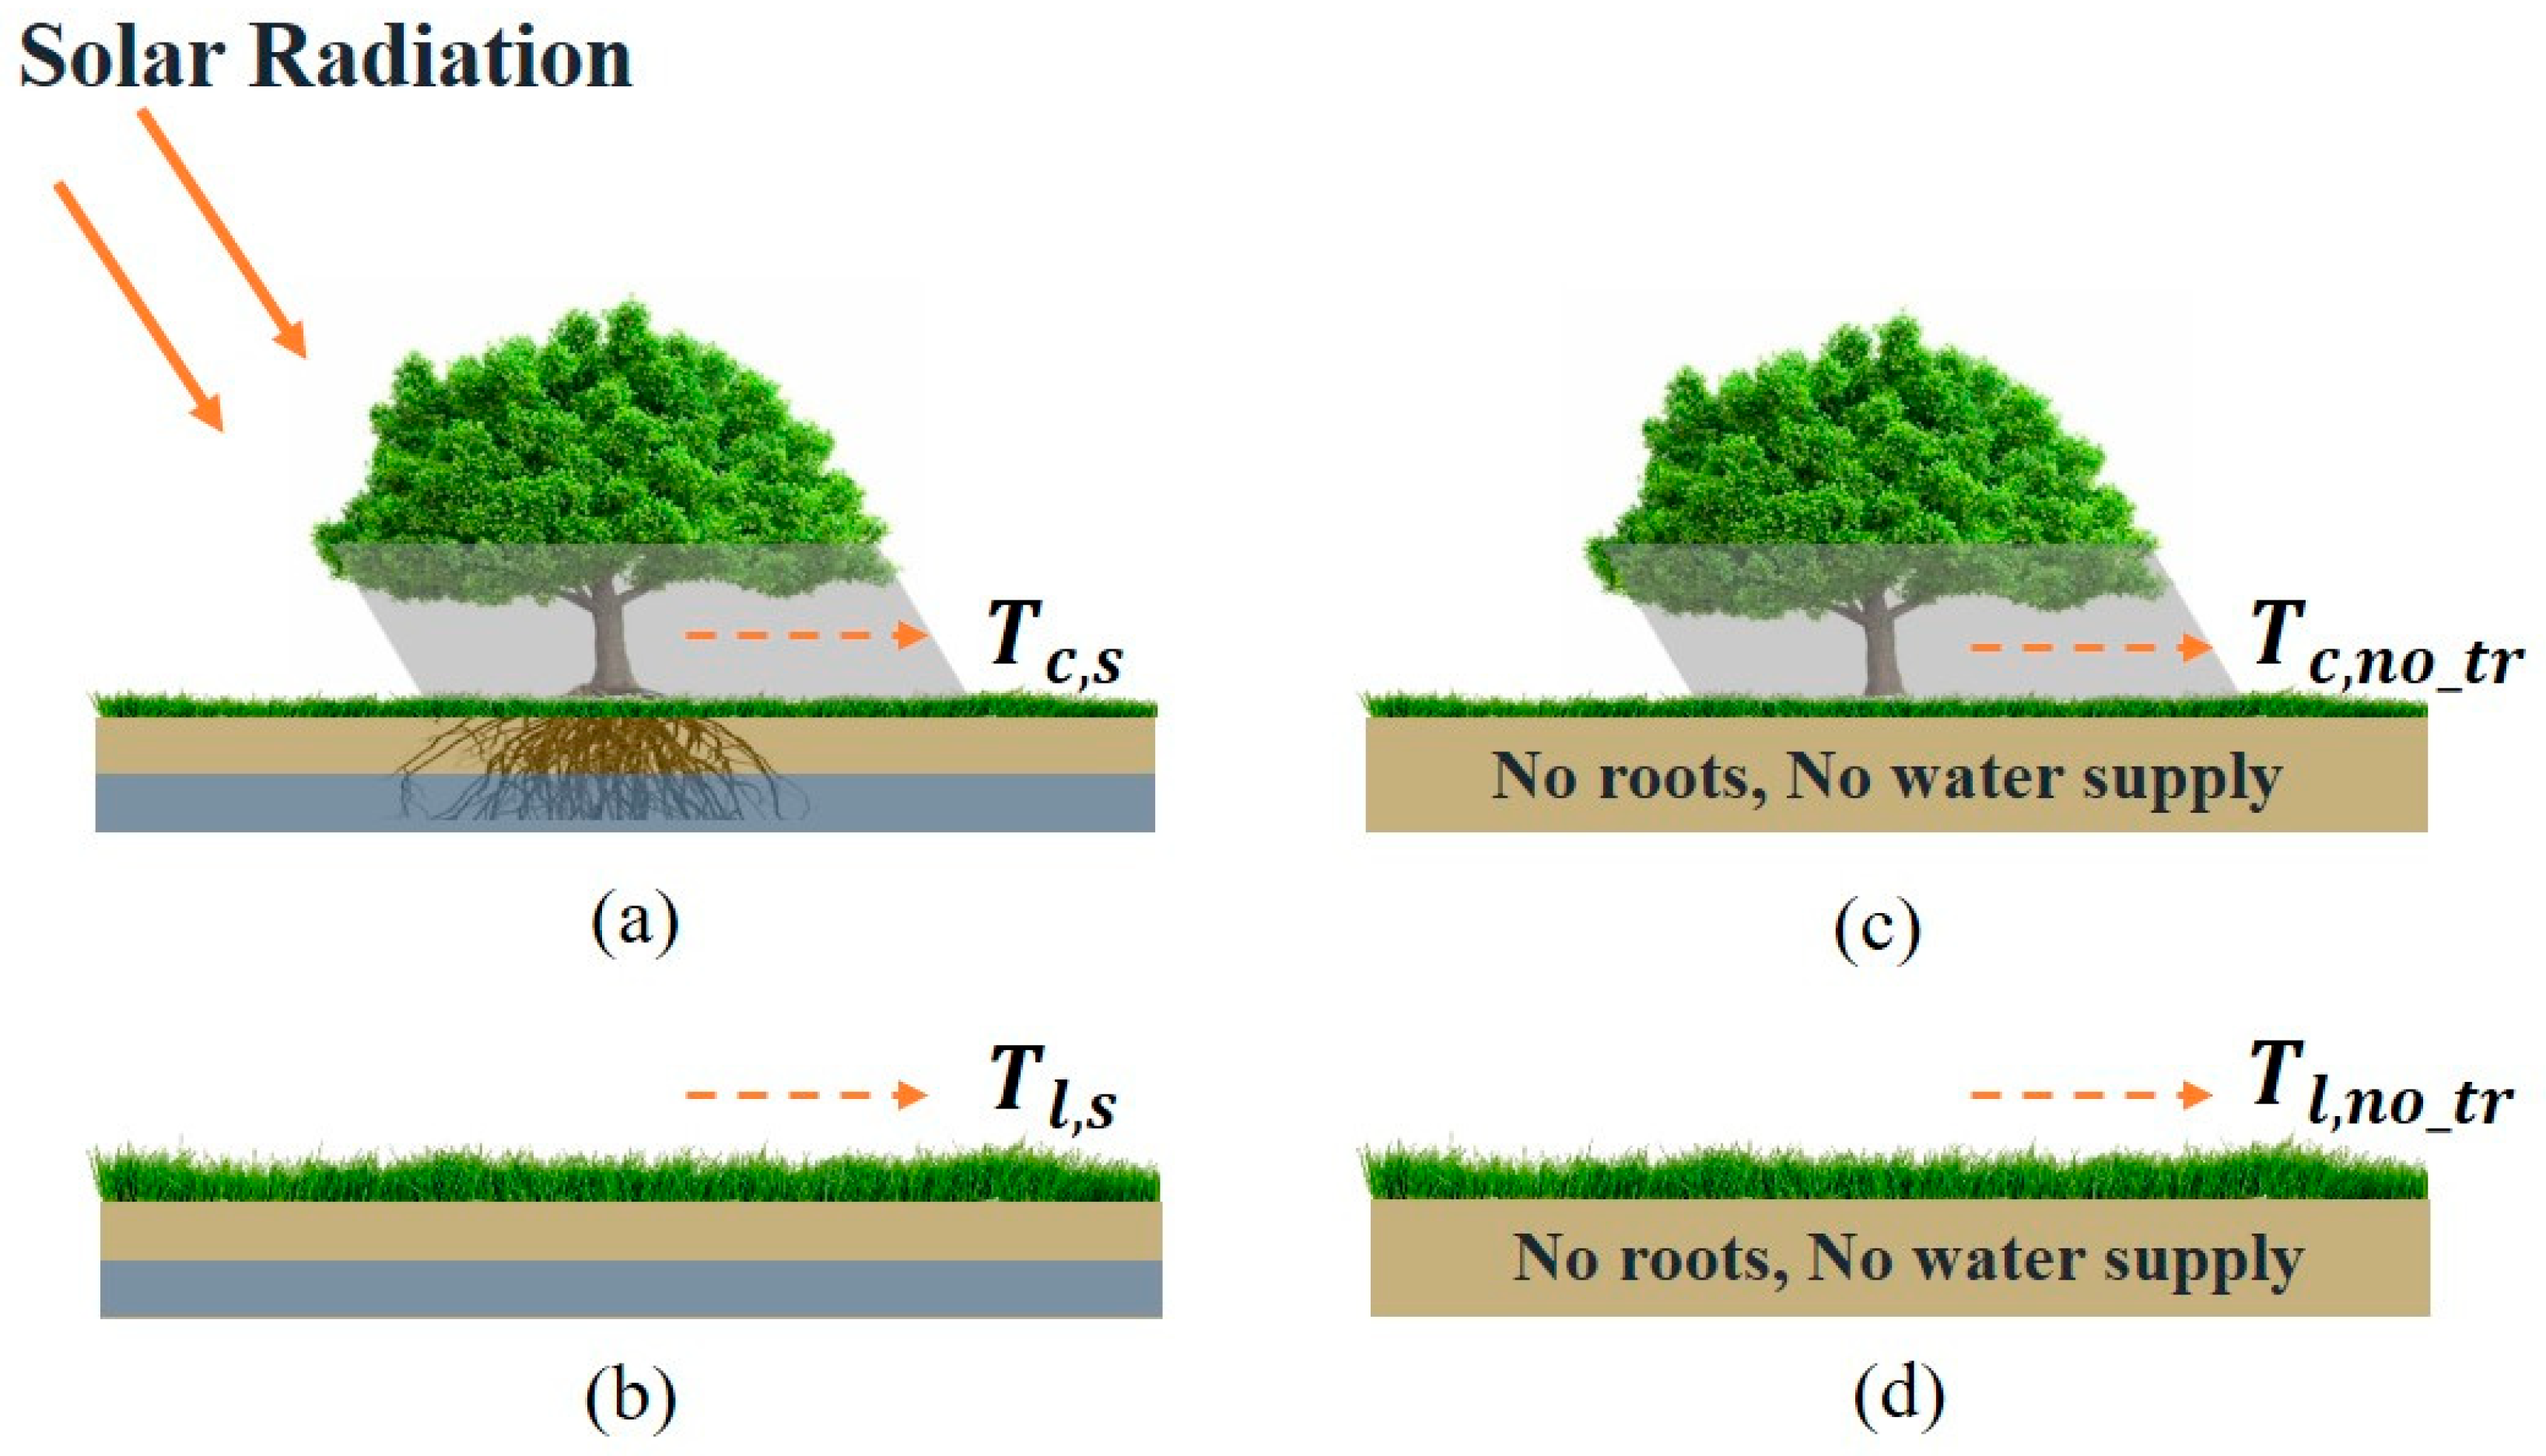
To assess the individual effects of tree transpiration and shading on air temperature, four idealized scenarios were established within the ENVI-met model framework (Figure 2): (a) transpiring tree; (b) transpiring lawn; (c) non-transpiring tree; (d) non-transpiring lawn. Scenarios (a) and (b) represent actual conditions of a tree and lawn under normal physiological states and were used to replicate real-world microclimatic conditions. Simulated temperature outputs ( T c , s , T l , s ) from the two scenarios were compared with field measurements ( T c , m , T l , m ) to validate the model’s performance, where subscript “c” refers to the canopy, “l” to the lawn, “s” to the simulated results, and “m” to the measured data. Scenario (c), which limits the transpiration process of the tree in the model, was designed to isolate the shading effect of tree transpiration on temperature. By comparing the temperature under the tree with and without transpiration (scenario a and scenario c), the specific cooling effect from transpiration could be determined. Scenario (d), a lawn without transpiration, served as the baseline for assessing the shading-induced cooling. The comparison between scenarios (c) and (d) allowed for quantification of the net cooling effect attributable to tree shading alone.
As plant transpiration in ENVI-met is a function of stomatal conductance and soil moisture availability, direct control over this process is not an inherent model feature [49]. To simulate non-transpiring conditions for comparative analysis, a methodological approach was employed to induce an extreme hydrological limitation. This was implemented by setting the volumetric water content of the entire 0–50 cm soil profile to 0%, in conjunction with specifying a Root Area Density (RAD) of zero for the target tree. This parameter combination eliminates both soil water availability and the plant’s capacity for water uptake, thereby precluding transpiration. All other biophysical parameters (e.g., leaf area density, albedo) were held at a constant relative to the baseline scenarios. Thus, the resultant differences in microenvironmental variables are unequivocally attributable to the suppression of transpiration cooling.

2.4. Estimation of the Cooling Effect of Tree Transpiration and Canopy Shading

In this study, air temperature ( T a ) differences are used to evaluate the cooling effects of the individual tree. The measured temperature differences between the shade ( T c , m ) and the lawn ( T l , m ) are the combined cooling effect of the tree due to shading and transpiration ( T c ):
T c = T l , m T c , m
The four simulated temperatures are utilized to calculate the temperature variations induced by tree shading and transpiration. The shade cooling effect ( T S h ) is determined by simulating the temperature differential between the non-transpiring lawn ( T l , n o _ t r ) and the non-transpiring tree ( T c , n o _ t r ):
T S h = T l , n o _ t r T c , n o _ t r
The tree transpiration cooling effect ( T T r ) is quantified by the temperature differences between the simulated non-transpiring trees ( T c , n o _ t r ) and the transpiration tree ( T c , s ). In scenario c, the soil moisture content was set at 0, which inhibits tree transpiration as well as the transpiration effect of the grass, potentially resulting in an overestimation of the cooling effect attributed to tree transpiration. To minimize this effect, the temperature difference between the non-transpiring lawn ( T l , n o _ t r ) and the transpiration lawn ( T l , s ) is incorporated in the calculation of tree transpiration cooling:
T T r = T c , n o _ t r T c , s T l , n o _ t r T l , s
The contributions of the two processes of shading and transpiration to the combined cooling effect of the tree are calculated by Equations (4) and (5). Considering that the impact of individual processes on temperature may not always be a cooling effect, their absolute values are used when calculating the sum of their effects:
C o n S h = T S h / T S h + T T r
C o n T r = T T r / T S h + T T r
The simulated transpiration cooling contribution (Equation (5)) is further compared against an observation-based metric. This metric is defined as the proportion of latent heat (LE) attributable to tree transpiration within the net radiation (Rn), which was calculated from measured radiation and sap flow data:
C o n T r , E B = L E / R n

3. Results

3.1. Characteristics of Meteorological Conditions During the Experiment Period

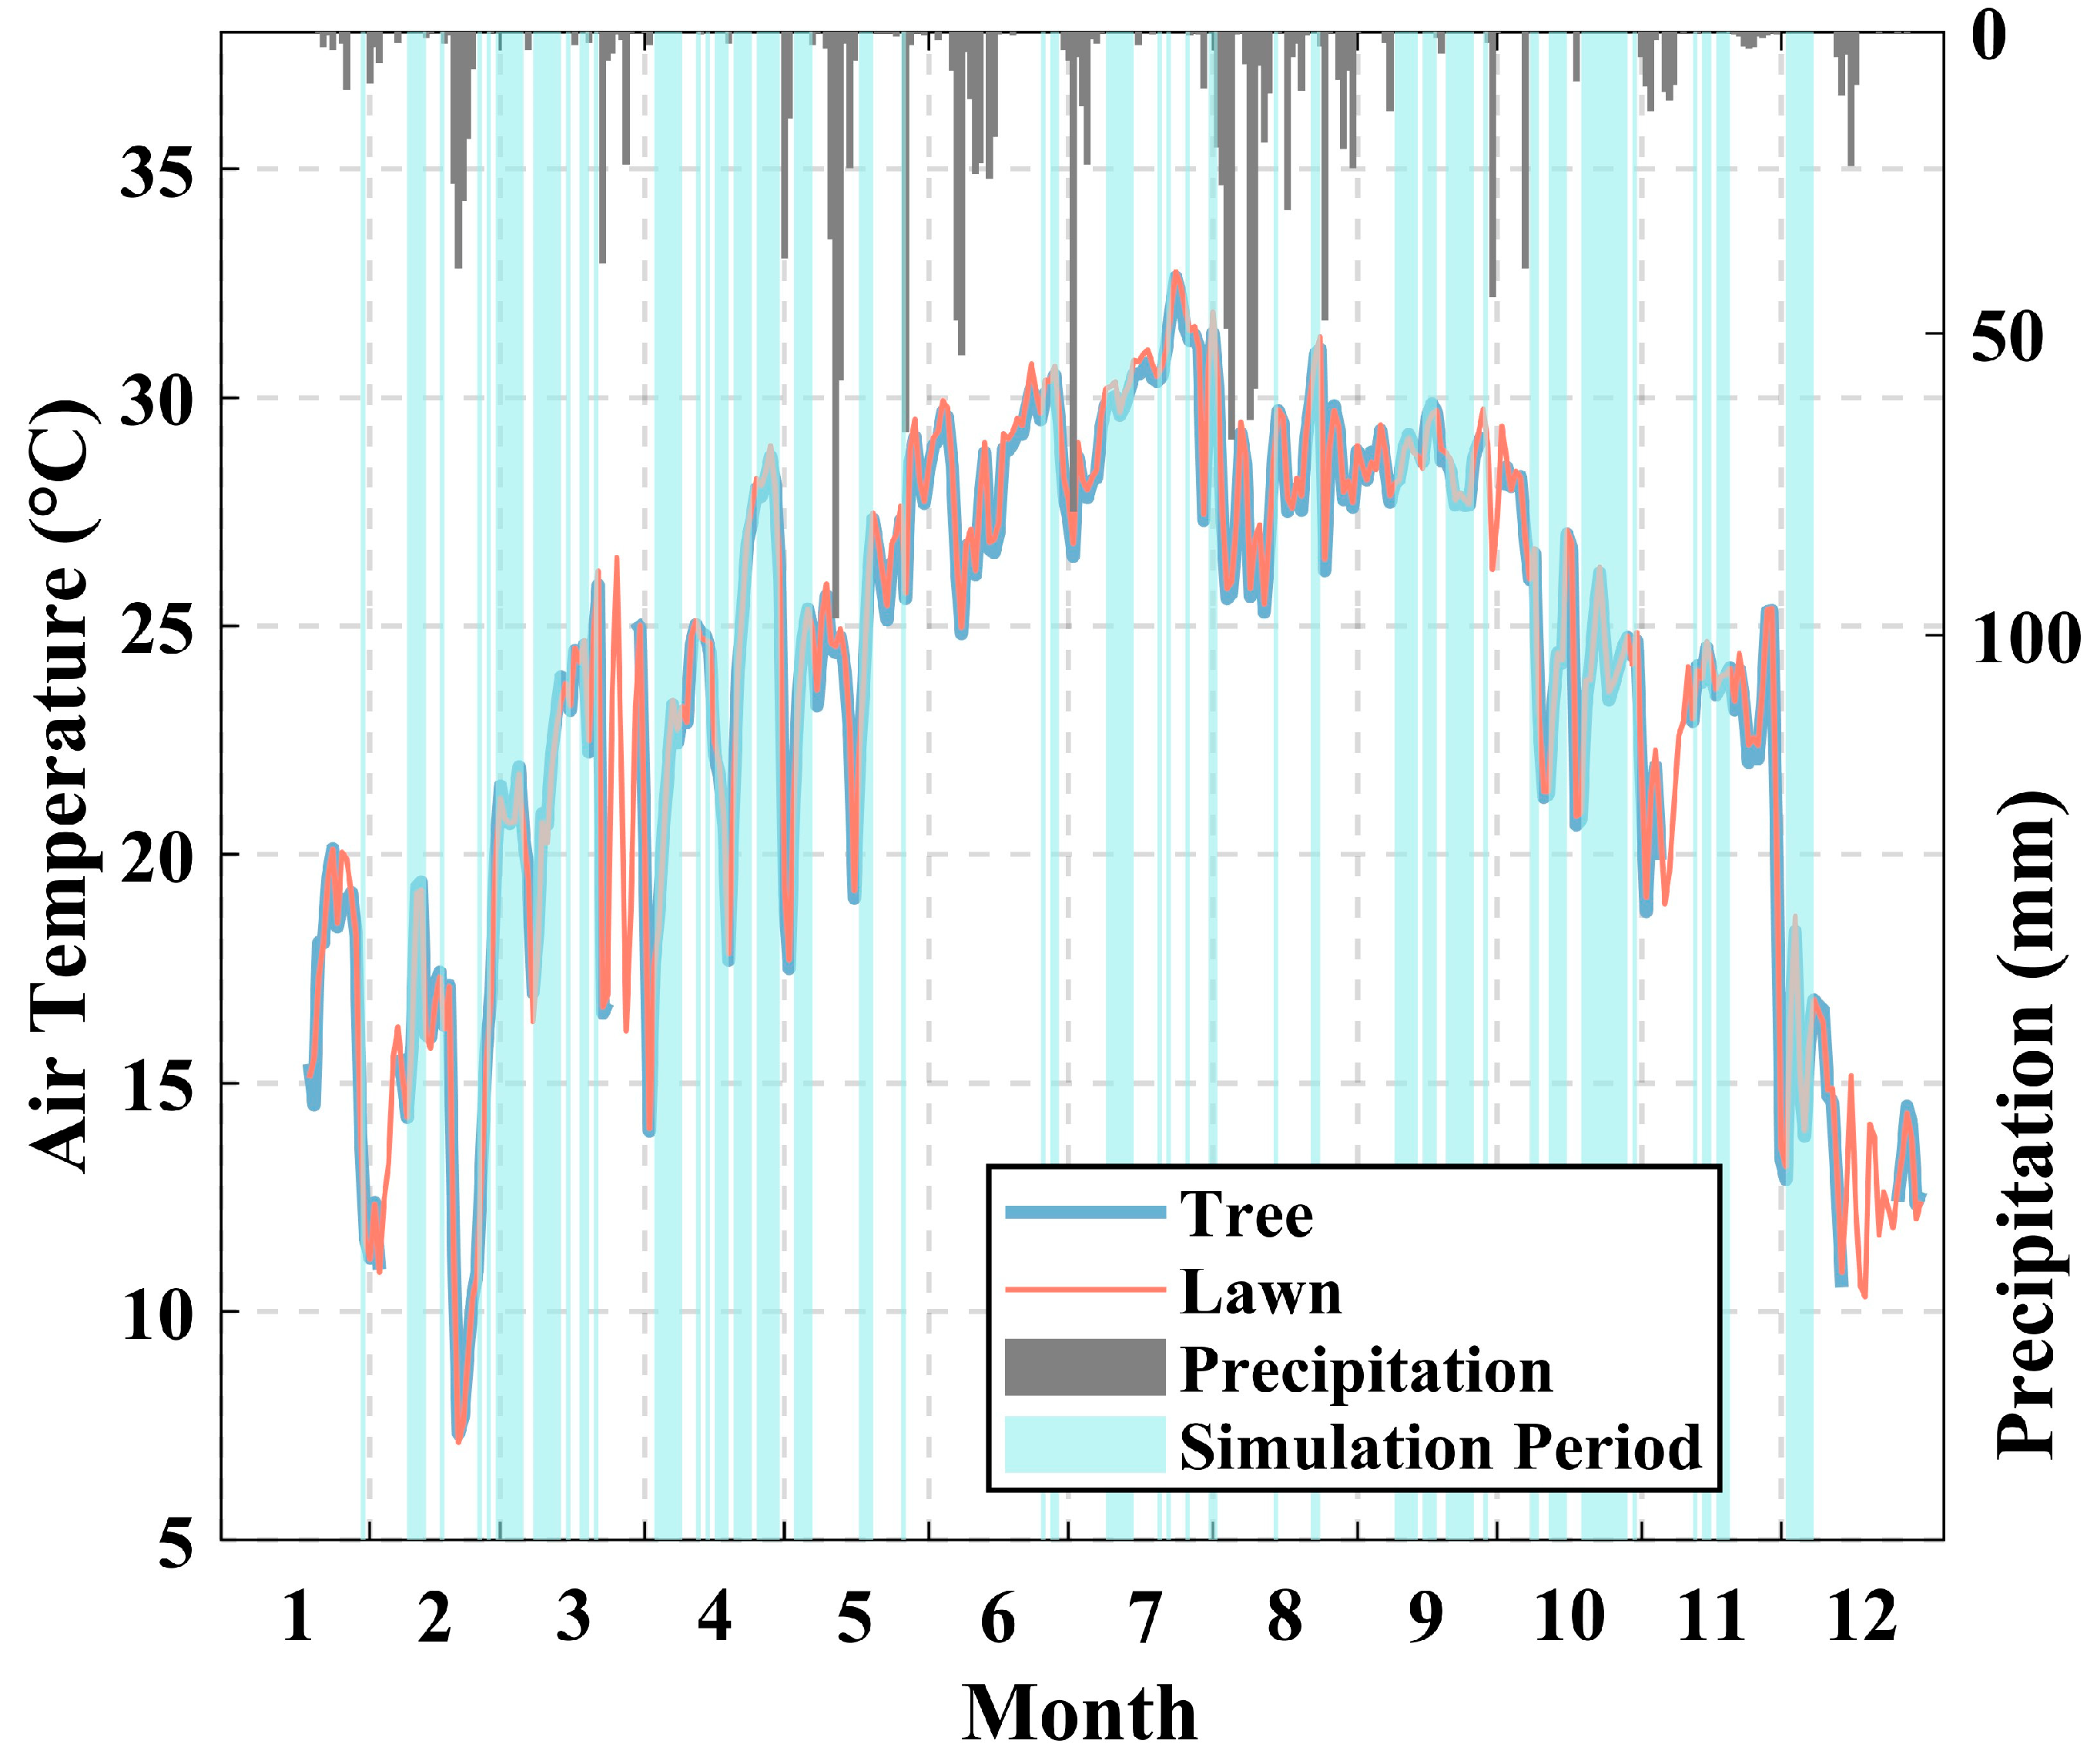
Daily average air temperature and precipitation at the two observation sites over the entire measurement period are shown in Figure 3. During the observation period, the study area exhibited distinct seasonal climatic patterns: winter (December to February) and spring (March to May) were characterized by pronounced temperature variability, while summer experienced frequent high-temperature events and concentrated precipitation. The mean annual air temperature recorded was 23.6 °C, with the maximum daily temperature of 32.7 °C on day 205 (July 24) of the observation year. In total, 32 days of daily temperatures above 30 °C were recorded. The cumulative annual precipitation was 1653.6 mm, with most of the rainfall occurring between May and September. Notably, August alone experienced 20 rainy days, which contributed to significantly lower air temperatures compared to July and September.

3.2. Characteristics of the Combined Cooling Effects of Tree Transpiration and Shading

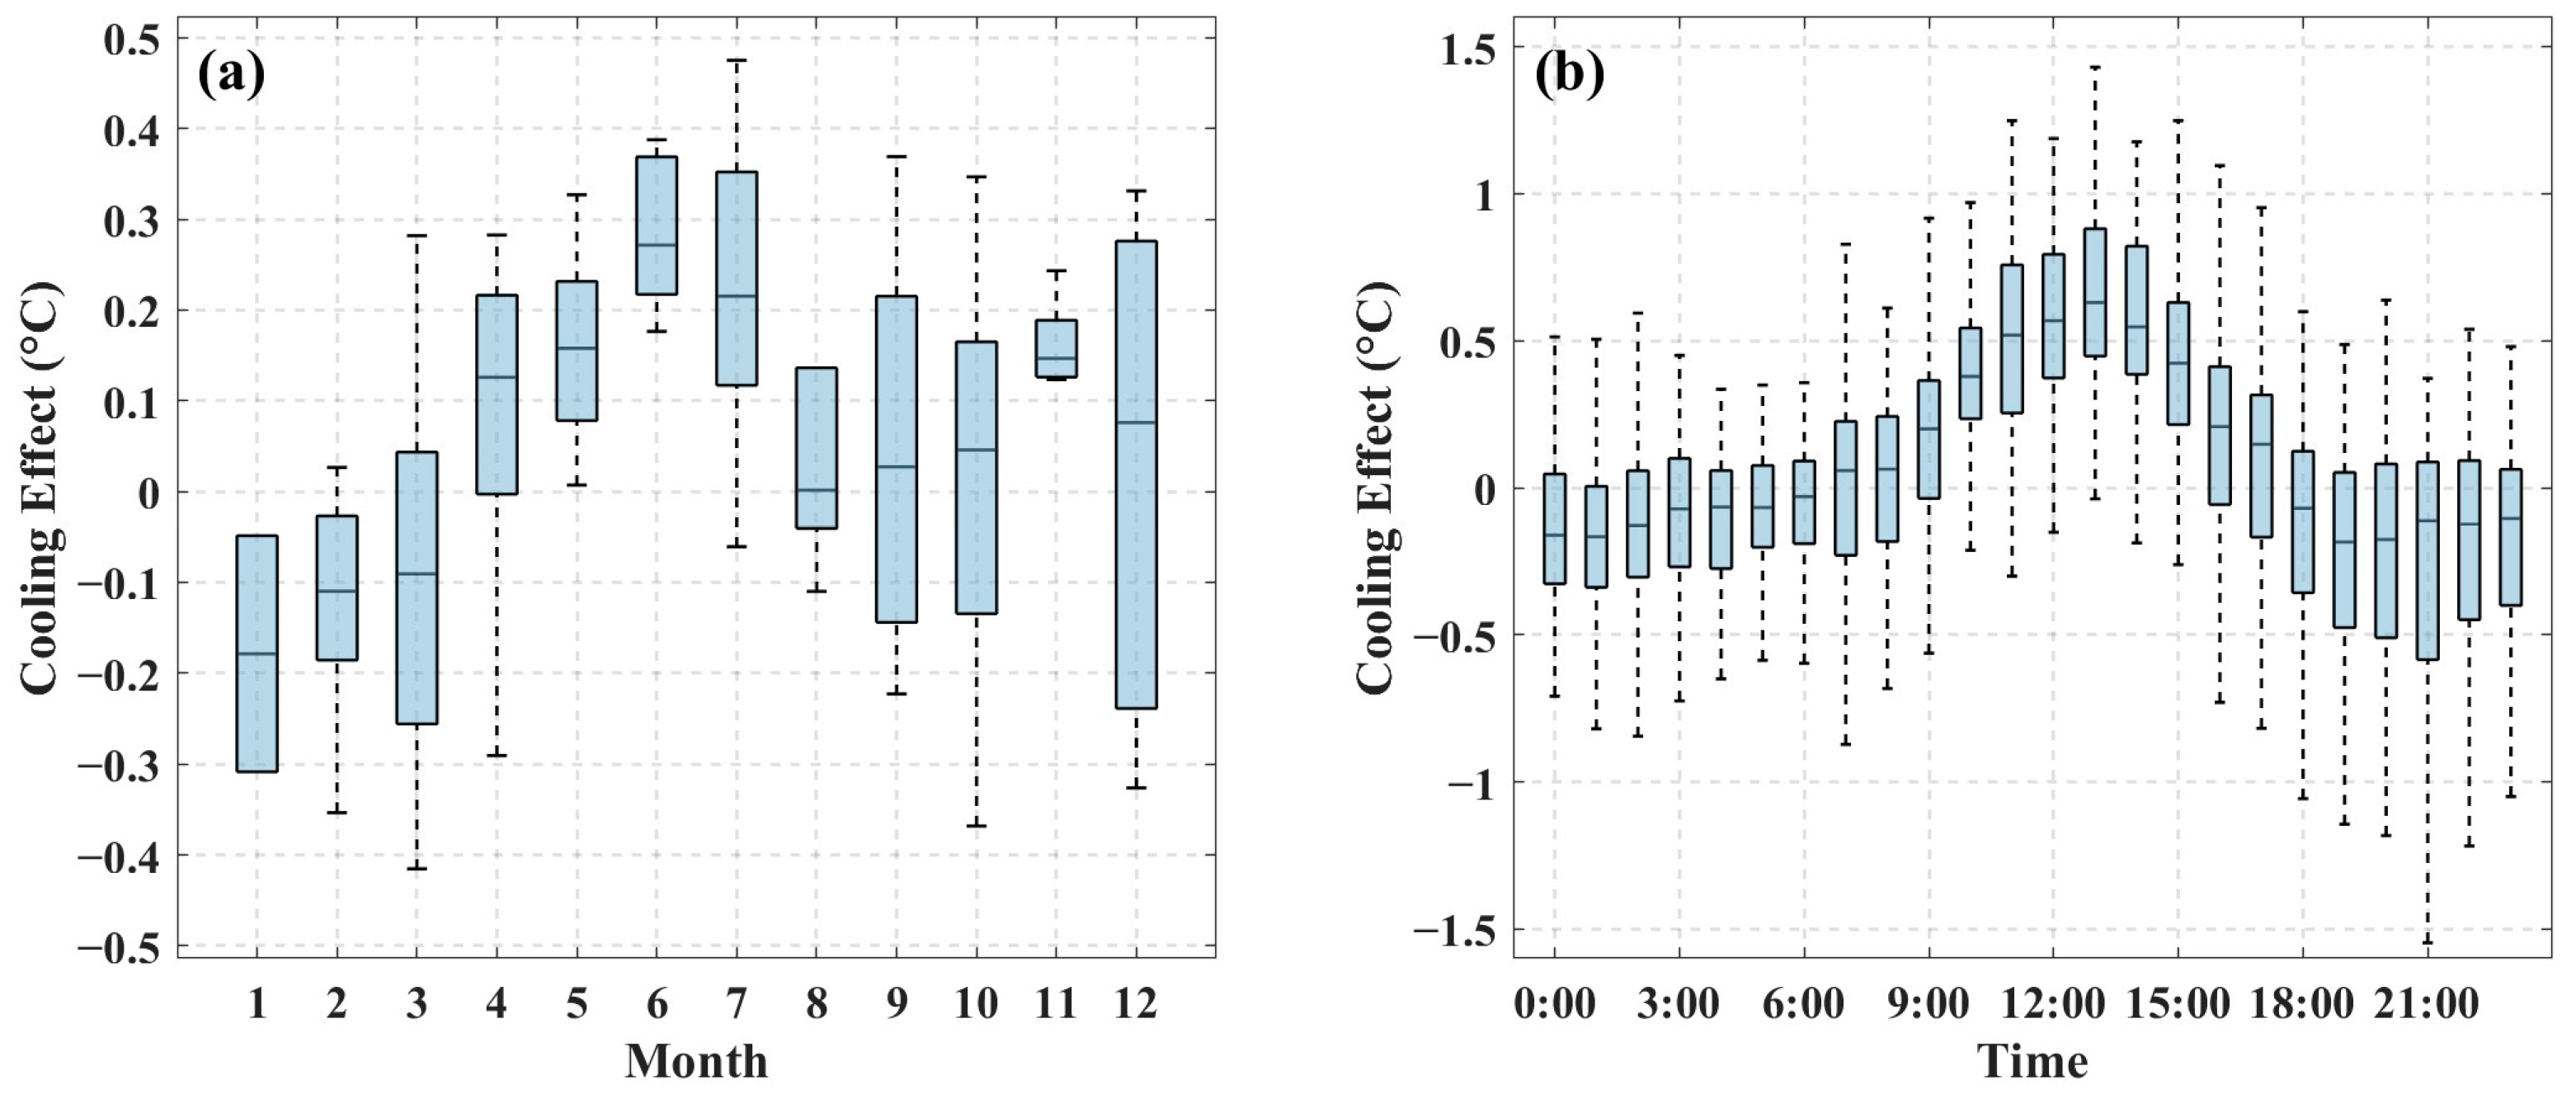
Field observations provide a robust foundation for quantifying the cooling effects of the tree. In this study, the combined cooling effect of trees was determined by calculating the temperature differences between in situ measurements taken beneath the tree canopy and those in the adjacent open lawn area. Figure 4 illustrates the annual and diurnal dynamics of T c during 2022, with an annual mean value of 0.31 ± 0.46 °C. Daily cooling intensity exhibited substantial intra-annual variability (Figure 4a), demonstrating enhanced cooling performance during summer months (May–September). The maximum daily cooling effect reached 0.47 °C in late July. In contrast, negative cooling values predominated during winter and early spring (December–March), with the minimum daily value of −0.41 °C recorded in early March. This suggests that trees may contribute to localized warming under certain seasonal conditions.
The diurnal cooling pattern followed a characteristic unimodal distribution (Figure 4b), with the peak cooling effect occurring at 13:00, reaching a maximum instantaneous value of 1.43 °C and a mean cooling intensity of 0.64 °C at noon. Positive cooling effects persisted throughout the daytime (09:00–16:00), while negative values, indicative of a warming effect, prevailed during the nighttime (17:00–08:00). The most pronounced nocturnal warming effect was recorded at 21:00 on April 3rd, with a temperature increase of 1.71 °C under the tree canopy relative to the open lawn.
Overall, the cooling effect of the tree exhibited pronounced thermal dependence, with enhanced cooling efficiency observed during hotter periods, particularly in summer and around midday. Conversely, the cooling capability was diminished during winter and nighttime, when the canopy covers frequently contributed to localized warming. Additionally, the cooling performance of the tree was strongly modulated by weather variability. For example, in March, cold air incursions led to substantial temperature fluctuations, with the daily average cooling effect ranging from −0.41 °C to 0.28 °C. In August, the occurrence of typhoons and frequent precipitation events significantly reduced the tree’s cooling capacity compared to the more stable and hotter conditions observed in July.

3.3. Model Validation of the Simulated Temperature

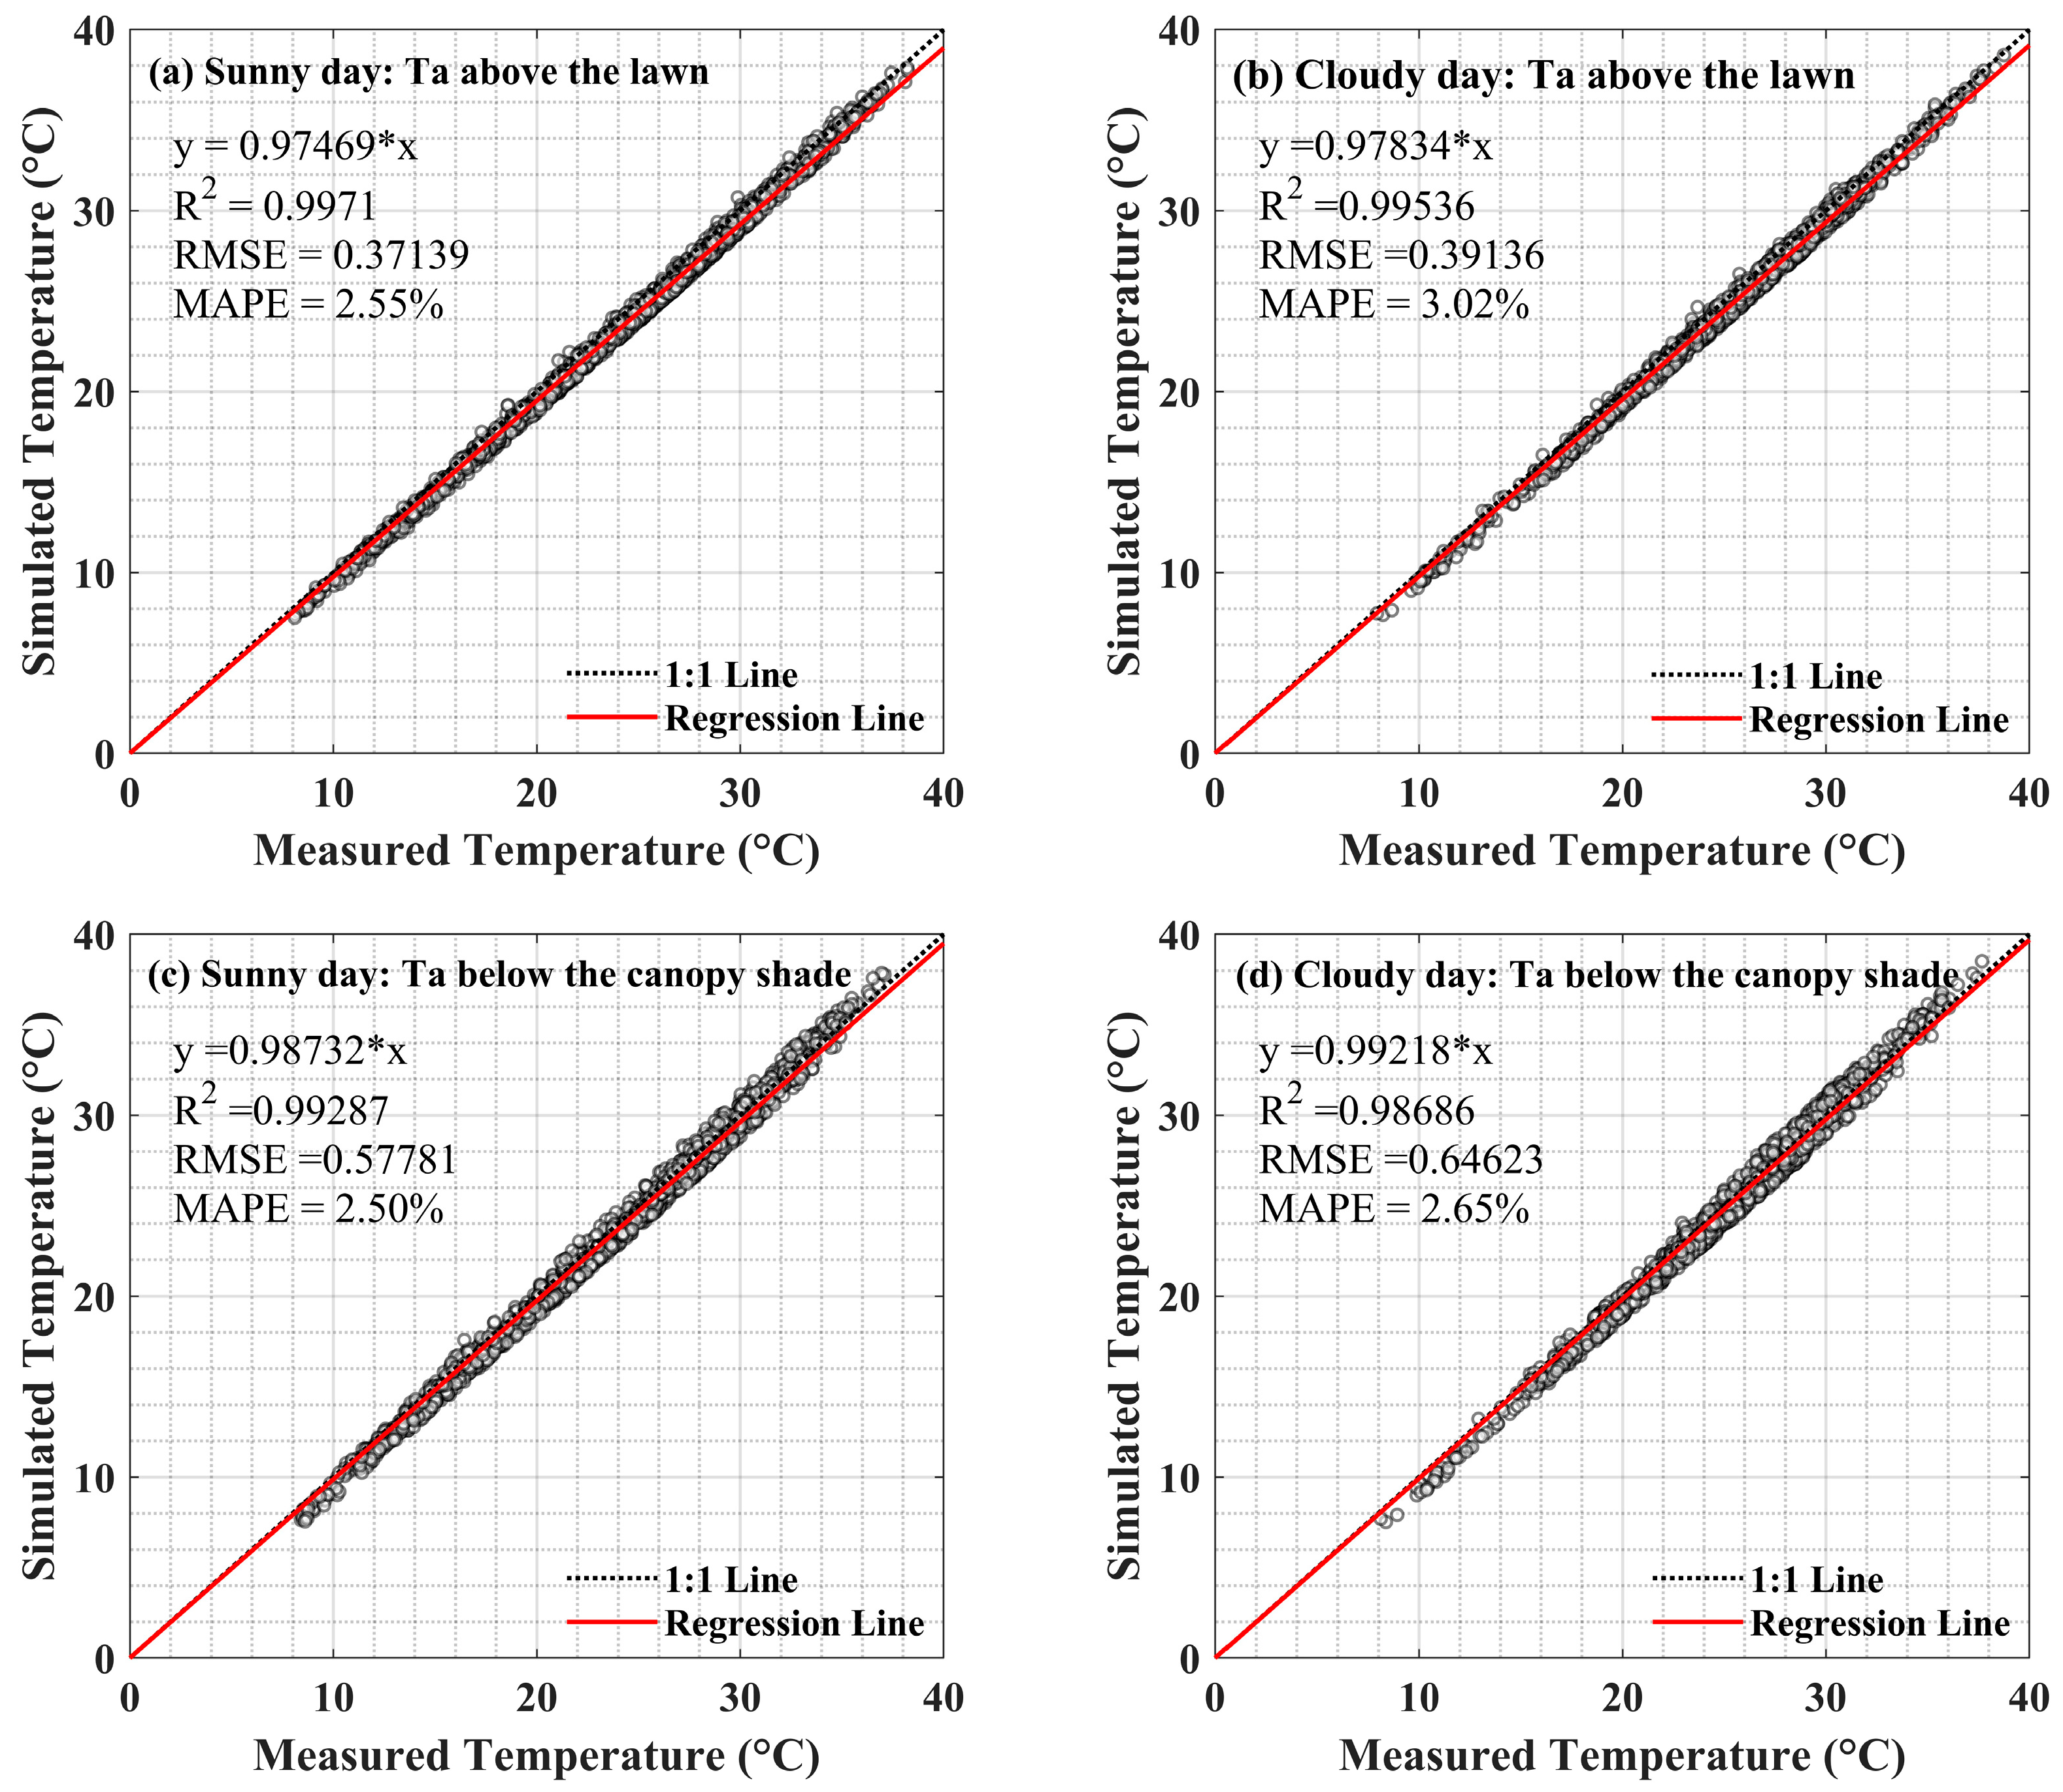
The observational experiment conducted across the tree canopy and lawn effectively quantified the cooling effects of the tree and established a robust data foundation for partitioning transpiration- and shading-induced cooling effects. To ensure the reliability of the ENVI-met model in replicating real-world microclimatic conditions, two representative simulation scenarios were configured: Scenario a (canopy-shading zones) and Scenario c (unobstructed lawn areas), both aligned with corresponding field observation sites. The model simulated hourly thermal conditions for 104 sunny days and 111 cloudy days throughout the study period. After excluding anomalous outputs, primarily induced by abrupt wind speed/direction changes that can cause numerical instability, 1718 valid hourly data points were retained for analysis.
Comparative validation against field measurements (Figure 5) demonstrated exceptional model performance, with coefficients of determination (R2) between simulated and observed temperatures exceeding 0.98 (0.986–0.997) in both shaded and unshaded areas, the slope coefficients approaching 1.0 (0.974–0.992), indicating strong agreement. Slightly higher discrepancies were observed during daytime hours on cloudy days, likely due to rapid and transient fluctuations in solar irradiance that are challenging to capture in simulations. Additionally, a systematic underestimation in simulated temperatures was attributed to the vertical resolution constraints of ENVI-met: observational data were recorded at 2 m above ground, whereas model outputs corresponded to the nearest vertical layer at 1.75 m within the 0.5 m grid resolution.
Overall, the detailed ENVI-met modeling accurately replicated air temperature dynamics and successfully achieved realistic representations of lawn and tree cover. This validation provides a critical foundation for the use of scenario-derived data in quantifying the tree cooling effect of transpiration and shading.

3.4. Respective Cooling Effects of Tree Transpiration and Canopy Shading

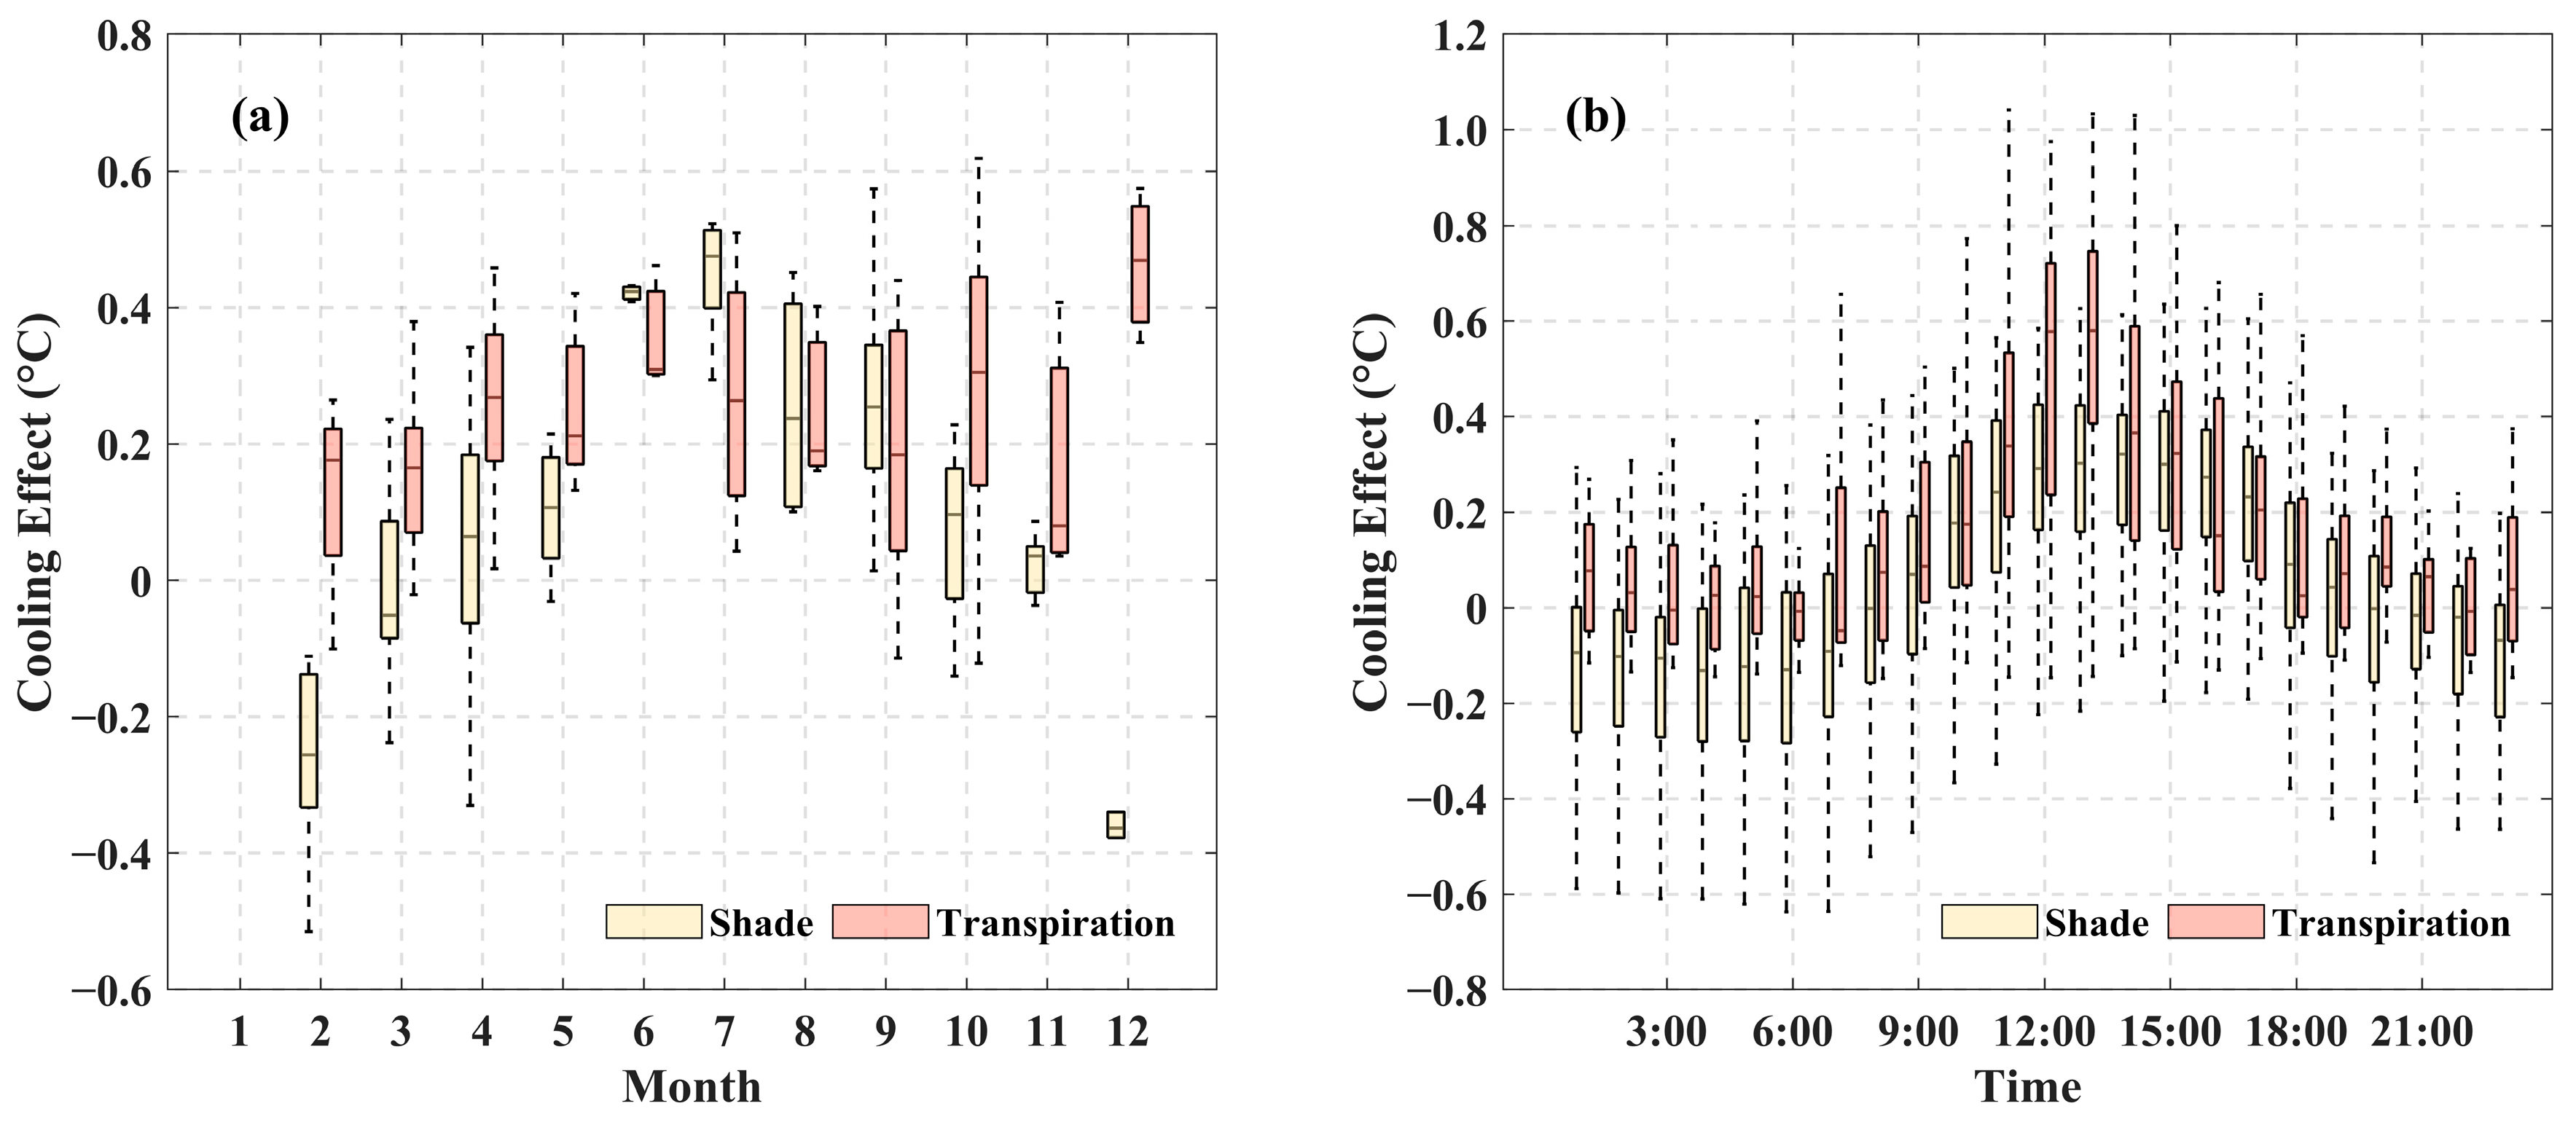
Based on the non-transpiring and lawn scenarios established in ENVI-met, we derived 1718 hourly transpiration and shade cooling effects. Figure 6 illustrates the annual and diurnal dynamics of partitioned cooling processes, revealing mean annual cooling intensities of 0.30 ± 0.13 °C for transpiration and 0.17 ± 0.27 °C for shading, corresponding to relative contributions of 44.7 ± 26.3% and 21.2 ± 51.6%, respectively. T S h followed a unimodal annual pattern (Figure 6a), peaking in July with a maximum daily mean of 0.57 °C, and showing significantly reduced or even negative effects during the winter months. Specifically, during winter (December–February), T S h exhibited net thermal accumulation, reaching a minimum value of −0.52 °C.
T T r displayed larger intra-annual variability, with daily means ranging from −0.12 °C to 0.82 °C. Positive cooling effects occurred in over 94% of cases, whereas negative anomalies were concentrated in February, September, and October. These instances were likely driven by increased evapotranspiration from lawn surfaces compared to tree transpiration, thereby amplifying the T l , n o _ t r T l , m differentials in Equation (3).
Diurnal patterns of both T S h and T T r exhibited sinusoidal patterns, with maximum cooling intensities observed at 13:00 ( T T r : 1.03 °C; T S h : 0.63 °C), followed by gradual declines to nocturnal minima around 06:00. Notably, transpiration consistently provided stronger cooling than shading throughout daytime hours, underscoring its dominant role in tree-mediated cooling.

4. Discussion

4.1. Tree Cooling Effects and Thermal Response Patterns

Traditionally, the cooling effect of trees is considered directly linked to background air temperature [50]. Our observations reveal a unimodal variation pattern in tree-induced cooling across both annual and diurnal cycles, peaking during summer (July) and midday (13:00), consistent with air temperature trends. Similar patterns have been reported in studies on green space cooling [51,52,53]. Figure 7a delineates the nonlinear thermal response function derived from 3246 valid hourly observations, revealing accelerated cooling intensification with rising ambient temperatures. The tree cooling effect intensifies with rising temperatures, particularly above 30 °C, where the average cooling reaches 0.47 °C.
To further elucidate the impact of background temperature on the cooling effect of trees, air temperature data were stratified into deciles, and the median cooling effect of tree transpiration and shading was evaluated within each bin (Figure 7b). The shade cooling effect exhibits quasi-linear enhancement with temperature. At lower temperatures (<23.1 °C, representing the bottom 30th percentile and encompassing 84.7% winter or nighttime data), shading produced net warming, with temperature differences ranging from −0.23 to −0.02 °C, contributing negatively (−51.3% to −15.7%) to combined cooling effects (Figure 7c). These results provide evidence for canopy-induced thermal inversions under low-temperature conditions. Above 31.1 °C, shading dominates with a median cooling of 0.56 °C with a cooling contribution of 56.9%. In contrast, transpiration cooling follows a near-exponential pattern, consistent with its regulation by stomatal behavior and vapor pressure deficit [54]. In the initial 50th percentile, transpiration cooling was minimal, with a median effect of only 0.1 °C. As temperatures increased, cooling via transpiration intensified, with peaking at 0.6 °C. However, above 31.1 °C, a slight decline was observed, with cooling stabilizing around 0.4 °C, likely due to partial stomatal closure under extreme heat stress, which limits water loss and reduces transpiration efficiency.
Correlational analysis revealed critical radiative drivers of arboreal cooling efficacy. The combined cooling effect demonstrated a significant positive correlation with air temperature (r = 0.56, p < 0.05), while solar radiation over open lawns exhibited the strongest association (r = 0.68, p < 0.05). Notably, a negative correlation emerged between the tree’s combined cooling effect and longwave radiation in shaded areas (r = −0.39, p < 0.05), revealing a trade-off in the surface energy budget. Specifically, canopy cover reduces daytime surface heating by attenuating shortwave radiation but concurrently results in nocturnal warming through longwave radiation trapping [55,56]. This dynamic alters the surface–atmosphere radiative exchange, especially within shaded microclimates. These findings quantitatively resolve the paradox of canopy thermal impacts, demonstrating how tree shade transitions from a cooling asset to a thermal liability depending on radiative regime and phenological state.
For transpiration cooling, the simulation results demonstrated a significant positive correlation with measured latent heat (r = 0.77, p < 0.01). The model-based estimates of its cooling contribution agreed well with flux-derived values, with median differences in less than 10% (Figure 7d). This consistency between methods partly underscores the robustness of the quantification approach. However, the contribution calculated from flux data exhibited greater variability. This discrepancy is likely attributable to the low and unstable nighttime energy fluxes, whereas the simulated temperatures remained relatively stable.

4.2. Dynamic Shifts in the Dominant Cooling Mechanism

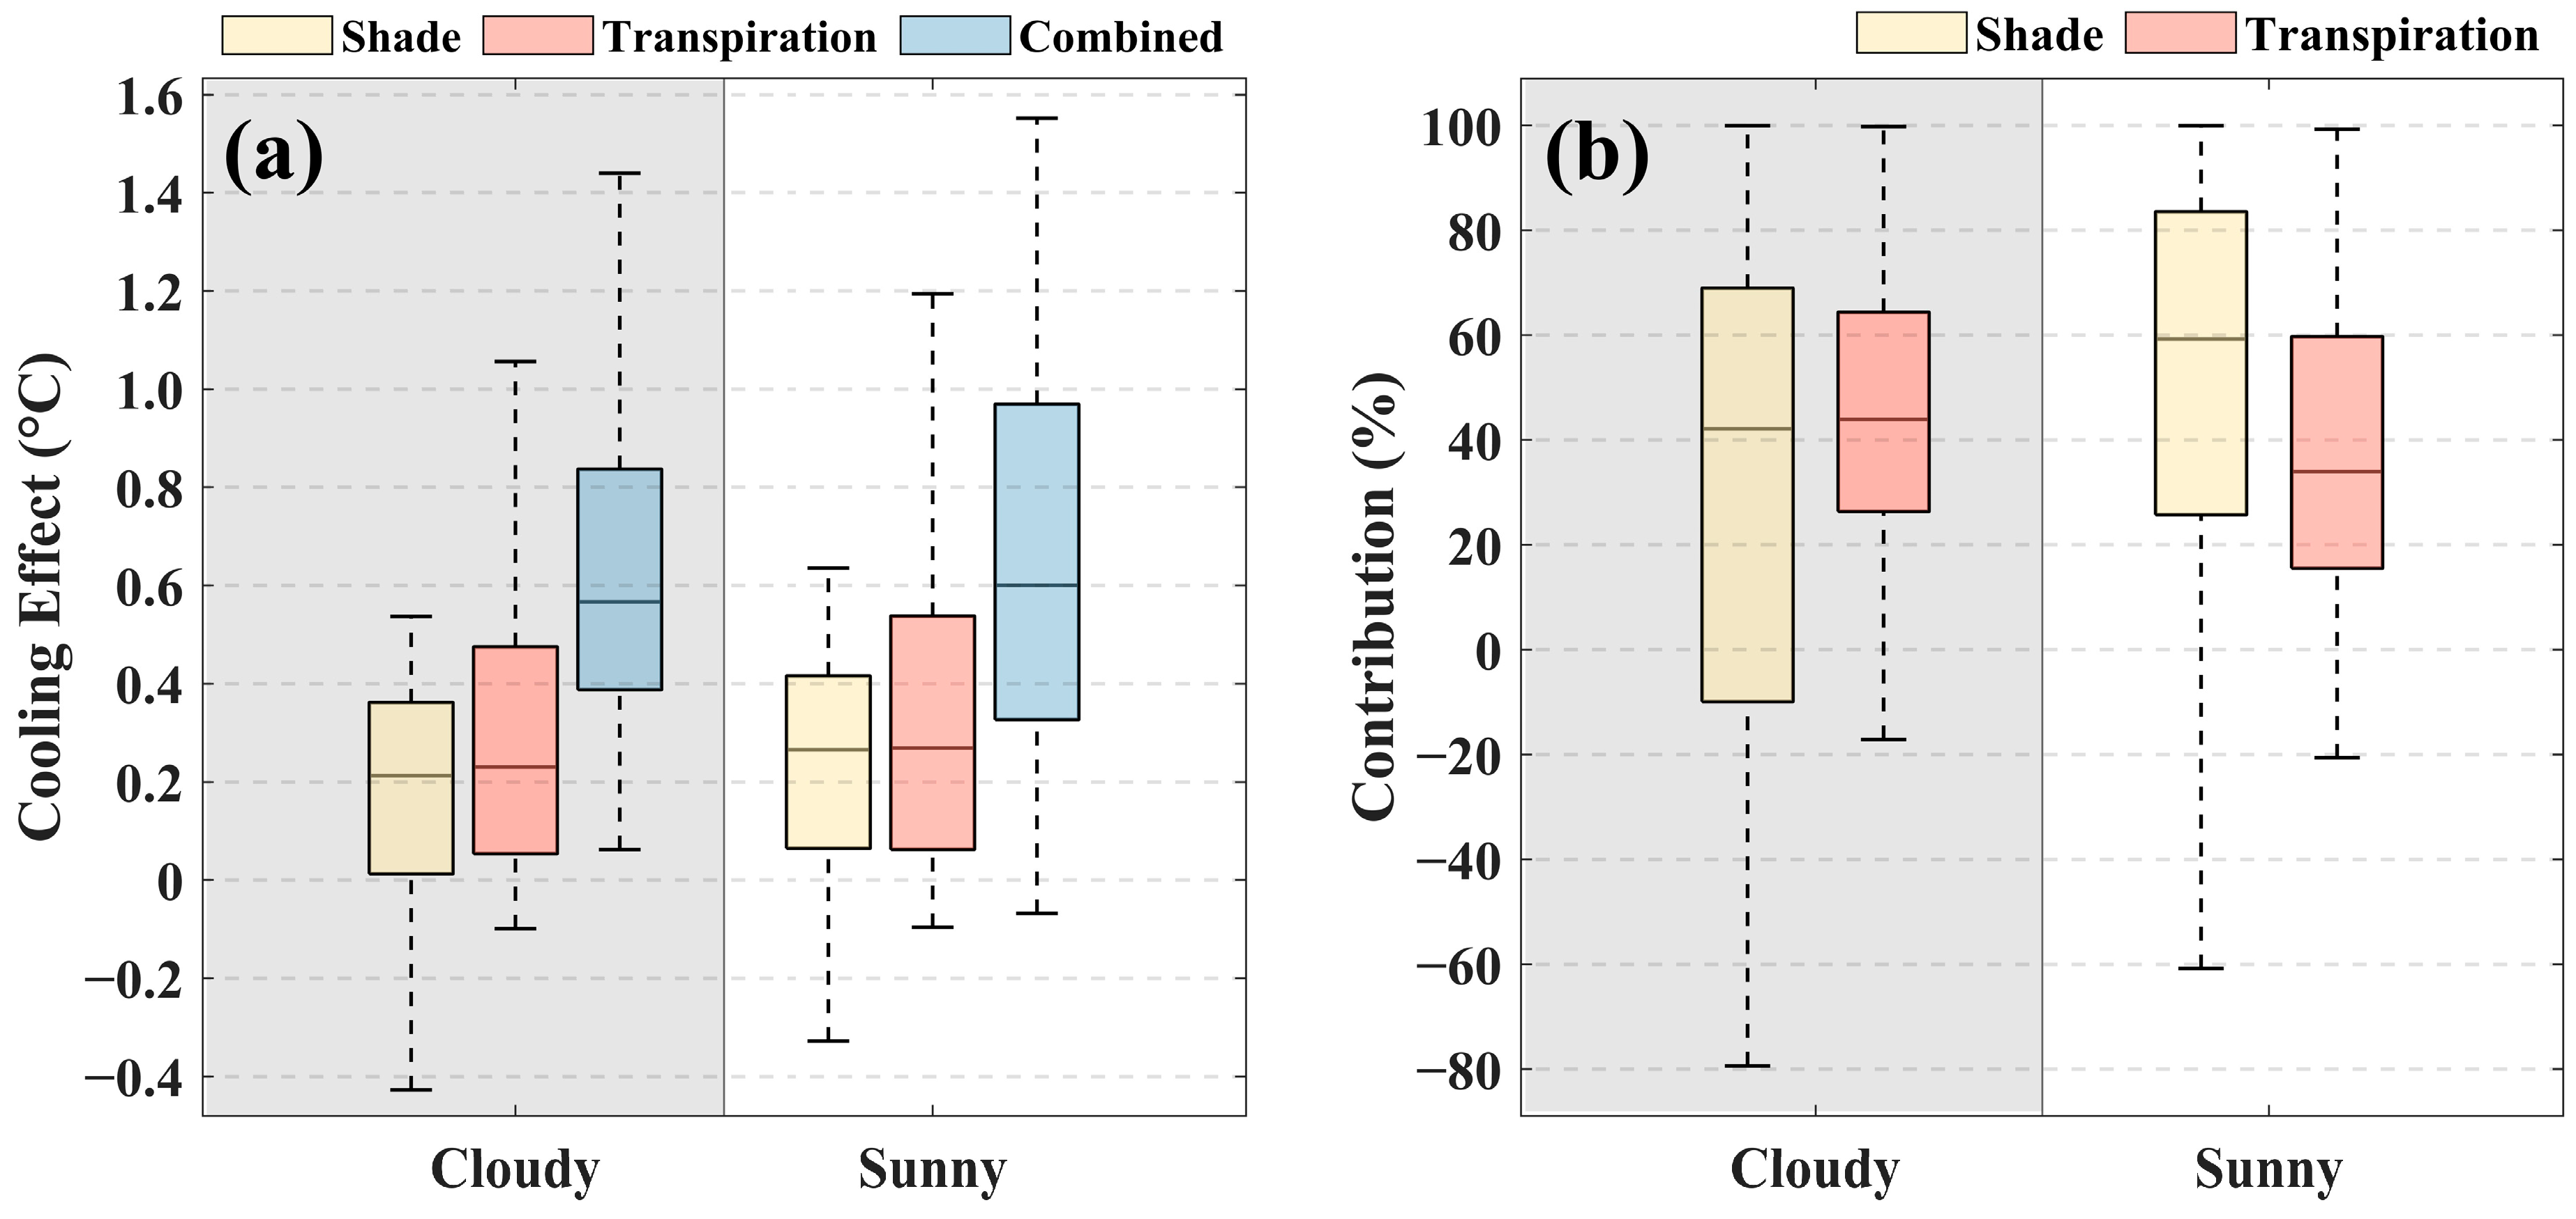
Over the course of the one-year observation experiment, the daily average cooling effects of trees exhibited remarkable variability (Figure 4). Based on the daily mean incoming clearness index, 215 observation days were categorized into 104 sunny days and 111 cloudy days, with sunny days defined as those having a daily average clearness index surpassing 0.80. Figure 8a compares the distributions of tree-induced cooling effects on both sunny and cloudy days. Overall, F. concinna provided stronger cooling under sunny conditions, with mean shading, transpiration and combined cooling effects reaching 0.25 ± 0.24 °C, 0.32 ± 0.31 °C, and 0.65 ± 0.38 °C, respectively. Under cloudy conditions, they decreased to 0.18 ± 0.24 °C, 0.29 ± 0.28 °C, and 0.62 ± 0.29 °C, respectively. The reduction in solar radiation not only limited the potential for shading-induced temperature regulation but also decreased the available energy for transpiration, thereby weakening both cooling pathways. Figure 8b further demonstrates the relative contributions of shading and transpiration to combined cooling across different weather scenarios. The median contribution of shading decreased from 60.0% in sunny days to 40.2% under cloudy conditions, while that of transpiration increased from 44.4% to 50.0%.
The dual roles of tree shading and transpiration in environmental cooling have long been central to urban climate research. In previous studies, shading has been considered the dominant cooling mechanism. For instance, a study conducted in Givatayim, Israel, found that direct shading accounted for approximately 80% of the cooling effect beneath the canopy, with transpiration contributing to a lesser extent [57]. Similarly, research conducted in Shanghai, China, reported that during heat waves, shading remained the principal mechanism for urban cooling at midday [58]. However, findings from the present study challenge this conventional view, highlighting the substantial and often dominant role of transpiration—particularly during nighttime periods. The observed higher contribution of transpiration in this study is likely attributable to the high transpiration capacity of F. concinna. It was demonstrated that F. concinna was among the highest transpiration rates across fifteen urban tree species in Los Angeles [59]. In subtropical climates, ample precipitation ensures consistent soil moisture, while elevated air temperatures increase the vapor pressure deficit—together enhancing the transpiration-driven cooling effect.
Trees regulate urban thermal environments through two primary biophysical mechanisms: passive radiative shading and active evaporative cooling via transpiration. F. concinna shows distinct responses of these processes to environmental drivers. Shading reduces solar heat gain through canopy interception, exhibiting a near-linear relationship with ambient temperature and solar irradiance. In contrast, transpiration operates as an active physiological process, governed by more complex interactions among air temperature, humidity, wind speed, and vapor pressure deficit, all of which influence stomatal conductance and latent heat flux [26,60]. The synergistic interaction between these mechanisms creates temperature-dependent compensatory effects. During periods of extreme heat, stomatal closure can limit transpiration, thereby amplifying the relative importance of shading. Conversely, at night or on cloudy days, when shading becomes less effective or may even induce warming through longwave radiation trapping, transpiration can continue to provide cooling. This temporal and phenological variation in thermal regulation underscores the necessity of species-specific and site-specific strategies in urban greening. To maximize thermal mitigation, urban design should integrate both canopy structure and physiological function: ensuring continuous shading coverage while also selecting species with high transpiration potential. Adopting the “right tree, right place” principle, planners should prioritize transpiration-efficient species in areas prone to thermal accumulation, and shade-dominant species (e.g., large tree canopy) in highly irradiated zones. These findings provide actionable insights for enhancing the resilience of urban environments under intensifying climate extremes such as heatwaves and urban heat islands.

4.3. Limitations and Future Research

This study has several limitations that should be acknowledged. The most significant limitation is its focus on a single tree species at one location. While this allowed for a controlled, year-long analysis, the findings’ generalizability to other species with different physiological traits (e.g., deciduous habits, varying stomatal regulation) or in different urban contexts requires further investigation. Future studies could encompass a broader range of species and urban settings to develop more universally applicable guidelines. Secondly, the results of this study, such as the individual cooling effects and contributions of transpiration and shading, were derived exclusively from ENVI-met simulations. Although sap flow and radiation flux data were collected during the observation period, their utility for direct comparison and validation of the model results was limited due to the amount of valid data. Future research should prioritize obtaining a more comprehensive flux observation dataset to enable robust comparison and mutual validation of these two methodologies. Finally, this study focused on the biophysical mechanisms of shading and transpiration. Other factors influencing urban tree cooling, such as the impact of particulate matter deposition on leaf albedo and physiological function [61,62], were not considered. Investigating the interplay between these additional factors and the fundamental cooling mechanisms quantified here presents a promising avenue for future work.

5. Conclusions

This study proposed a quantitative framework to determine tree transpiration and canopy shading-induced cooling effects through high-frequency microclimate monitoring and scenario-based modeling. The key findings are as follows:
(1)
The annual combined cooling effect of F. concinna is 0.31 ± 0.46 °C. This combined cooling effect has a clear unimodal variation pattern both seasonally and diurnally. The combined cooling effect exponentially increases as air temperatures rise and notably increases under higher temperature conditions (such as during heat waves).
(2)
The shade cooling effect of the F. concinna is highly sensitive to solar radiation. Canopy shading could substantially reduce the amount of shortwave radiation reaching the ground surface during the daytime, especially on clear summer days when peak cooling could reach up to 0.63 °C. During the night, however, the canopy attenuates longwave radiation loss and results in local warming.
(3)
F. concinna has a significant transpiration cooling effect, and it has a strong positive correlation with air temperature, with a maximum cooling effect of 1.03 °C.
Annually, the average contributions of shading and transpiration to combined cooling were 21.2 ± 51.6% and 44.7 ± 26.3%, respectively. The high transpiration rate of F. concinna and the favorable climatic conditions of the study area (i.e., warm temperatures and abundant soil moisture) facilitated dominant transpiration-driven cooling. Notably, during heatwave events, shading emerged as the predominant mechanism due to the decline in stomatal conductance under extreme stress.

Author Contributions

Conceptualization, G.Y.Q. and Z.S.; Funding acquisition, C.Y. and G.Y.Q.; Investigation, Z.S. and Z.L.; Methodology, Z.S.; Visualization, Z.S. and W.H.; Writing—original draft, Z.S.; Writing—review and editing, G.Y.Q., C.Y. and W.H. All authors have read and agreed to the published version of the manuscript.

Funding

This research was funded by the Science, Technology and Innovation Commission of Shenzhen Municipality, grant number GXWD20201231165807007-20200827105738001, the Chinese Ministry of Science and Technology Projects, grant number 2017FY100206-03, and the National Natural Science Foundation of China, grant number 42571024.

Data Availability Statement

Data is contained within the article. Further inquiries can be directed to G.-Y.Q. (qiugy@pkusz.edu.cn) and Z.S. (shiz@pku.edu.cn).

Conflicts of Interest

The authors declare no conflicts of interest.

References

  1. Yuan, Y.; Santamouris, M.; Xu, D.; Geng, X.; Li, C.; Cheng, W.; Su, L.; Xiong, P.; Fan, Z.; Wang, X.; et al. Surface urban heat island effects intensify more rapidly in lower income countries. npj Urban Sustain. 2025, 5, 11. [Google Scholar] [CrossRef]
  2. Portela, C.I.; Massi, K.G.; Rodrigues, T.; Alcântara, E. Impact of urban and industrial features on land surface temperature: Evidences from satellite thermal indices. Sust. Cities Soc. 2020, 56, 102100. [Google Scholar] [CrossRef]
  3. Rajagopal, P.; Priya, R.S.; Senthil, R. A review of recent developments in the impact of environmental measures on urban heat island. Sust. Cities Soc. 2023, 88, 104279. [Google Scholar] [CrossRef]
  4. Wang, J.; Zhou, W.; Pickett, S.T.A.; Yu, W.; Li, W. A multiscale analysis of urbanization effects on ecosystem services supply in an urban megaregion. Sci. Total Environ. 2019, 662, 824–833. [Google Scholar] [CrossRef]
  5. Guerreiro, S.B.; Dawson, R.J.; Kilsby, C.; Lewis, E.; Ford, A. Future heat-waves, droughts and floods in 571 European cities. Environ. Res. Lett. 2018, 13, 34009. [Google Scholar] [CrossRef]
  6. IPCC. Climate Change 2021: The Physical Science Basis. Contribution of Working Group I to the Sixth Assessment Report of the Intergovernmental Panel on Climate Change; Cambridge University Press: Cambridge, UK; New York, NY, USA, 2021. [Google Scholar]
  7. Kim, S.W.; Brown, R.D. Urban heat island (UHI) intensity and magnitude estimations: A systematic literature review. Sci. Total Environ. 2021, 779, 146389. [Google Scholar] [CrossRef]
  8. Buchin, O.; Hoelscher, M.; Meier, F.; Nehls, T.; Ziegler, F. Evaluation of the health-risk reduction potential of countermeasures to urban heat islands. Energy Build. 2016, 114, 27–37. [Google Scholar] [CrossRef]
  9. Scherer, D.; Fehrenbach, U.; Lakes, T.; Lauf, S.; Meier, F.; Schuster, C. Quantification of heat-stress related mortality hazard, vulnerability and risk in Berlin, Germany. Die Erde 2014, 144, 238–259. [Google Scholar]
  10. Schinasi, L.H.; Benmarhnia, T.; De Roos, A.J. Modification of the association between high ambient temperature and health by urban microclimate indicators: A systematic review and meta-analysis. Environ. Res. 2018, 161, 168–180. [Google Scholar] [CrossRef] [PubMed]
  11. Kumar, P.; Sharma, A. Study on importance, procedure, and scope of outdoor thermal comfort—A review. Sust. Cities Soc. 2020, 61, 102297. [Google Scholar] [CrossRef]
  12. Deilami, K.; Kamruzzaman, M.; Liu, Y. Urban heat island effect: A systematic review of spatio-temporal factors, data, methods, and mitigation measures. Int. J. Appl. Earth Obs. Geoinf. 2018, 67, 30–42. [Google Scholar] [CrossRef]
  13. Georgescu, M.; Morefield, P.E.; Bierwagen, B.G.; Weaver, C.P. Urban adaptation can roll back warming of emerging megapolitan regions. Proc. Natl. Acad. Sci. USA 2014, 111, 2909–2914. [Google Scholar] [CrossRef] [PubMed]
  14. Lai, D.; Lian, Z.; Liu, W.; Guo, C.; Liu, W.; Liu, K.; Chen, Q. A comprehensive review of thermal comfort studies in urban open spaces. Sci. Total Environ. 2020, 742, 140092. [Google Scholar] [CrossRef] [PubMed]
  15. Sadeghi, M.; Chaston, T.; Hanigan, I.; de Dear, R.; Santamouris, M.; Jalaludin, B.; Morgan, G.G. The health benefits of greening strategies to cool urban environments–A heat health impact method. Build. Environ. 2022, 207, 108546. [Google Scholar] [CrossRef]
  16. Paschalis, A.; Chakraborty, T.C.; Fatichi, S.; Meili, N.; Manoli, G. Urban forests as main regulator of the evaporative cooling effect in cities. Agu Adv. 2021, 2, e2020AV000303. [Google Scholar] [CrossRef]
  17. Schwaab, J.; Meier, R.; Mussetti, G.; Seneviratne, S.; Bürgi, C.; Davin, E.L. The role of urban trees in reducing land surface temperatures in European cities. Nat. Commun. 2021, 12, 6763. [Google Scholar] [CrossRef]
  18. Ziter, C.D.; Pedersen, E.J.; Kucharik, C.J.; Turner, M.G. Scale-dependent interactions between tree canopy cover and impervious surfaces reduce daytime urban heat during summer. Proc. Natl. Acad. Sci. USA 2019, 116, 7575–7580. [Google Scholar] [CrossRef]
  19. Bowler, D.E.; Buyung-Ali, L.; Knight, T.M.; Pullin, A.S. Urban greening to cool towns and cities: A systematic review of the empirical evidence. Landsc. Urban Plan. 2010, 97, 147–155. [Google Scholar] [CrossRef]
  20. Sabrin, S.; Karimi, M.; Nazari, R.; Pratt, J.; Bryk, J. Effects of Different Urban-Vegetation Morphology on the Canopy-level Thermal Comfort and the Cooling Benefits of Shade Trees: Case-study in Philadelphia. Sustain. Cities Soc. 2021, 66, 102684. [Google Scholar] [CrossRef]
  21. Wang, C.; Wang, Z.H.; Yang, J. Cooling effect of urban trees on the built environment of contiguous United States. Earth’s Future 2018, 6, 1066–1081. [Google Scholar] [CrossRef]
  22. Qiu, G.Y.; Yu, X.; Wen, H.; Yan, C. An advanced approach for measuring the transpiration rate of individual urban trees by the 3D three-temperature model and thermal infrared remote sensing. J. Hydrol. (Amst.) 2020, 587, 125034. [Google Scholar]
  23. Winbourne, J.B.; Jones, T.S.; Garvey, S.M.; Harrison, J.L.; Wang, L.; Li, D.; Templer, P.H.; Hutyra, L.R. Tree transpiration and urban temperatures: Current understanding, implications, and future research directions. Bioscience 2020, 70, 576–588. [Google Scholar] [CrossRef]
  24. Massetti, L.; Petralli, M.; Napoli, M.; Brandani, G.; Orlandini, S.; Pearlmutter, D. Effects of deciduous shade trees on surface temperature and pedestrian thermal stress during summer and autumn. Int. J. Biometeorol. 2019, 63, 467–479. [Google Scholar] [CrossRef]
  25. Rahman, M.A.; Moser, A.; Rötzer, T.; Pauleit, S. Microclimatic differences and their influence on transpirational cooling of Tilia cordata in two contrasting street canyons in Munich, Germany. Agric. For. Meteorol. 2017, 232, 443–456. [Google Scholar] [CrossRef]
  26. Rahman, M.A.; Stratopoulos, L.M.F.; Moser-Reischl, A.; Zölch, T.; Häberle, K.; Rötzer, T.; Pretzsch, H.; Pauleit, S. Traits of trees for cooling urban heat islands: A meta-analysis. Build. Environ. 2020, 170, 106606. [Google Scholar] [CrossRef]
  27. Chen, X.; Zhao, P.; Hu, Y.; Ouyang, L.; Zhu, L.; Ni, G. Canopy transpiration and its cooling effect of three urban tree species in a subtropical city-Guangzhou, China. Urban For. Urban Green. 2019, 43, 126368. [Google Scholar] [CrossRef]
  28. Lindén, J.; Fonti, P.; Esper, J. Temporal variations in microclimate cooling induced by urban trees in Mainz, Germany. Urban For. Urban Green. 2016, 20, 198–209. [Google Scholar] [CrossRef]
  29. Shashua-Bar, L.; Hoffman, M.E. Vegetation as a climatic component in the design of an urban street: An empirical model for predicting the cooling effect of urban green areas with trees. Energy Build. 2000, 31, 221–235. [Google Scholar] [CrossRef]
  30. Kim, J.; Khouakhi, A.; Corstanje, R.; Johnston, A.S.A. Greater local cooling effects of trees across globally distributed urban green spaces. Sci. Total Environ. 2024, 911, 168494. [Google Scholar] [CrossRef] [PubMed]
  31. Li, H.; Zhao, Y.; Wang, C.; Ürge-Vorsatz, D.; Carmeliet, J.; Bardhan, R. Cooling efficacy of trees across cities is determined by background climate, urban morphology, and tree trait. Commun. Earth Environ. 2024, 5, 754. [Google Scholar] [CrossRef]
  32. Jiao, M.; Zhou, W.; Zheng, Z.; Wang, J.; Qian, Y. Patch size of trees affects its cooling effectiveness: A perspective from shading and transpiration processes. Agric. For. Meteorol. 2017, 247, 293–299. [Google Scholar] [CrossRef]
  33. Wu, Z.; Shi, Y.; Ren, L.; Hang, J. Scaled outdoor experiments to assess impacts of tree evapotranspiration and shading on microclimates and energy fluxes in 2D street canyons. Sust. Cities Soc. 2024, 108, 105486. [Google Scholar] [CrossRef]
  34. Tan, P.Y.; Wong, N.H.; Tan, C.L.; Jusuf, S.K.; Chang, M.F.; Chiam, Z.Q. A method to partition the relative effects of evaporative cooling and shading on air temperature within vegetation canopy. J. Urban Ecol. 2018, 4, 1–11. [Google Scholar] [CrossRef]
  35. Pace, R.; De Fino, F.; Rahman, M.A.; Pauleit, S.; Nowak, D.J.; Grote, R. A single tree model to consistently simulate cooling, shading, and pollution uptake of urban trees. Int. J. Biometeorol. 2021, 65, 277–289. [Google Scholar] [CrossRef] [PubMed]
  36. Manickathan, L.; Defraeye, T.; Allegrini, J.; Derome, D.; Carmeliet, J. Parametric study of the influence of environmental factors and tree properties on the transpirative cooling effect of trees. Agric. For. Meteorol. 2018, 248, 259–274. [Google Scholar] [CrossRef]
  37. Yu, H.; Zhang, T.; Fukuda, H.; Ma, X. The effect of landscape configuration on outdoor thermal environment: A case of urban Plaza in Xi’an, China. Build. Environ. 2023, 231, 110027. [Google Scholar] [CrossRef]
  38. Zheng, X.; Chen, L.; Yang, J. Simulation framework for early design guidance of urban streets to improve outdoor thermal comfort and building energy efficiency in summer. Build. Environ. 2023, 228, 109815. [Google Scholar] [CrossRef]
  39. Marchin, R.M.; Backes, D.; Ossola, A.; Leishman, M.R.; Tjoelker, M.G.; Ellsworth, D.S. Extreme heat increases stomatal conductance and drought-induced mortality risk in vulnerable plant species. Glob. Change Biol. 2022, 28, 1133–1146. [Google Scholar] [CrossRef]
  40. Hayat, M.; Xiang, J.; Yan, C.; Xiong, B.; Wang, B.; Qin, L.; Saeed, S.; Hussain, A.; Zou, Z.; Qiu, G.Y. Environmental control on transpiration and its cooling effect of Ficus concinna in a subtropical city Shenzhen, southern China. Agric. For. Meteorol. 2022, 312, 108715. [Google Scholar] [CrossRef]
  41. Zhang, Y.; Chiew, F.H.S.; Peña-Arancibia, J.; Sun, F.; Li, H.; Leuning, R. Global variation of transpiration and soil evaporation and the role of their major climate drivers. J. Geophys. Res. Atmos. 2017, 122, 6868–6881. [Google Scholar] [CrossRef]
  42. Toparlar, Y.; Blocken, B.; Maiheu, B.; van Heijst, G.J.F. A review on the CFD analysis of urban microclimate. Renew. Sustain. Energy Rev. 2017, 80, 1613–1640. [Google Scholar] [CrossRef]
  43. Salata, F.; Golasi, I.; de Lieto Vollaro, R.; de Lieto Vollaro, A. Urban microclimate and outdoor thermal comfort. A proper procedure to fit ENVI-met simulation outputs to experimental data. Sust. Cities Soc. 2016, 26, 318–343. [Google Scholar] [CrossRef]
  44. Le, A.; Chan, Y. Comparison between ENVI-met and ANSYS-fluent when used for microclimate simulation. J. Phys. Conf. Ser. 2023, 2600, 82019. [Google Scholar] [CrossRef]
  45. Simon, H.; Lindén, J.; Hoffmann, D.; Braun, P.; Bruse, M.; Esper, J. Modeling transpiration and leaf temperature of urban trees–A case study evaluating the microclimate model ENVI-met against measurement data. Landsc. Urban Plan. 2018, 174, 33–40. [Google Scholar] [CrossRef]
  46. Liu, Z.; Cheng, W.; Jim, C.Y.; Morakinyo, T.E.; Shi, Y.; Ng, E. Heat mitigation benefits of urban green and blue infrastructures: A systematic review of modeling techniques, validation and scenario simulation in ENVI-met V4. Build. Environ. 2021, 200, 107939. [Google Scholar] [CrossRef]
  47. Wang, B.; Yan, C.; Shi, Z.; Ding, J.; Zhang, T.; Qin, L.; Qiu, G.Y. Seasonal variation in water uptake patterns of two greening species and their responses to rainfall events in a subtropical megacity of China. J. Hydrol. 2023, 618, 129262. [Google Scholar] [CrossRef]
  48. Cheng, K.Y.; Lau, K.; Shek, Y.T.; Liu, Z.; Ng, E. Evaluation on the performance of tree view factor in a high-density subtropical city: A case study in Hong Kong. Build. Environ. 2023, 239, 110431. [Google Scholar] [CrossRef]
  49. Bruse, M. ENVI-Met Implementation of the Jacobs A−gs Model to Calculate the Stomata Conductance. Available online: http://www.envi-met.net/documents/new_a_gs.pdf (accessed on 16 February 2004).
  50. Cheng, X.; Peng, J.; Dong, J.; Liu, Y.; Wang, Y. Non-linear effects of meteorological variables on cooling efficiency of African urban trees. Environ. Int. 2022, 169, 107489. [Google Scholar] [CrossRef] [PubMed]
  51. de Abreu-Harbich, L.V.; Labaki, L.C.; Matzarakis, A. Effect of tree planting design and tree species on human thermal comfort in the tropics. Landsc. Urban Plan. 2015, 138, 99–109. [Google Scholar] [CrossRef]
  52. Kong, F.; Yan, W.; Zheng, G.; Yin, H.; Cavan, G.; Zhan, W.; Zhang, N.; Cheng, L. Retrieval of three-dimensional tree canopy and shade using terrestrial laser scanning (TLS) data to analyze the cooling effect of vegetation. Agric. For. Meteorol. 2016, 217, 22–34. [Google Scholar] [CrossRef]
  53. Zhang, L.; Zhan, Q.; Lan, Y. Effects of the tree distribution and species on outdoor environment conditions in a hot summer and cold winter zone: A case study in Wuhan residential quarters. Build. Environ. 2018, 130, 27–39. [Google Scholar] [CrossRef]
  54. Lambers, H.; Chapin, F.S.; Pons, T.L. Plant Water Relations. In Plant Physiological Ecology; Lambers, H., Chapin, F.S., Pons, T.L., Eds.; Springer: New York, NY, USA, 2008; pp. 163–223. [Google Scholar]
  55. Morakinyo, T.E.; Kong, L.; Lau, K.K.; Yuan, C.; Ng, E. A study on the impact of shadow-cast and tree species on in-canyon and neighborhood’s thermal comfort. Build. Environ. 2017, 115, 1–17. [Google Scholar] [CrossRef]
  56. Wujeska-Klause, A.; Pfautsch, S. The best urban trees for daytime cooling leave nights slightly warmer. Forests. 2020, 11, 945. [Google Scholar] [CrossRef]
  57. Shashua-Bar, L.; Pearlmutter, D.; Erell, E. The cooling efficiency of urban landscape strategies in a hot dry climate. Landsc. Urban Plan. 2009, 92, 179–186. [Google Scholar] [CrossRef]
  58. Yu, Z.; Chen, J.; Chen, J.; Zhan, W.; Wang, C.; Ma, W.; Yao, X.; Zhou, S.; Zhu, K.; Sun, R. Enhanced observations from an optimized soil-canopy-photosynthesis and energy flux model revealed evapotranspiration-shading cooling dynamics of urban vegetation during extreme heat. Remote Sens. Environ. 2024, 305, 114098. [Google Scholar] [CrossRef]
  59. Pataki, D.E.; McCarthy, H.R.; Litvak, E.; Pincetl, S. Transpiration of urban forests in the Los Angeles metropolitan area. Ecol. Appl. 2011, 21, 661–677. [Google Scholar] [CrossRef] [PubMed]
  60. Zhu, Y.; Cheng, Z.; Feng, K.; Chen, Z.; Cao, C.; Huang, J.; Ye, H.; Gao, Y. Influencing factors for transpiration rate: A numerical simulation of an individual leaf system. Therm. Sci. Eng. Prog. 2022, 27, 101110. [Google Scholar] [CrossRef]
  61. Rai, P.K.; Chutia, B.M.; Patil, S.K. Monitoring of spatial variations of particulate matter (PM) pollution through bio-magnetic aspects of roadside plant leaves in an Indo-Burma hot spot region. Urban For. Urban Green. 2014, 13, 761–770. [Google Scholar] [CrossRef]
  62. Rai, P.K. Impacts of particulate matter pollution on plants: Implications for environmental biomonitoring. Ecotoxicol. Environ. Saf. 2016, 129, 120–136. [Google Scholar] [CrossRef]
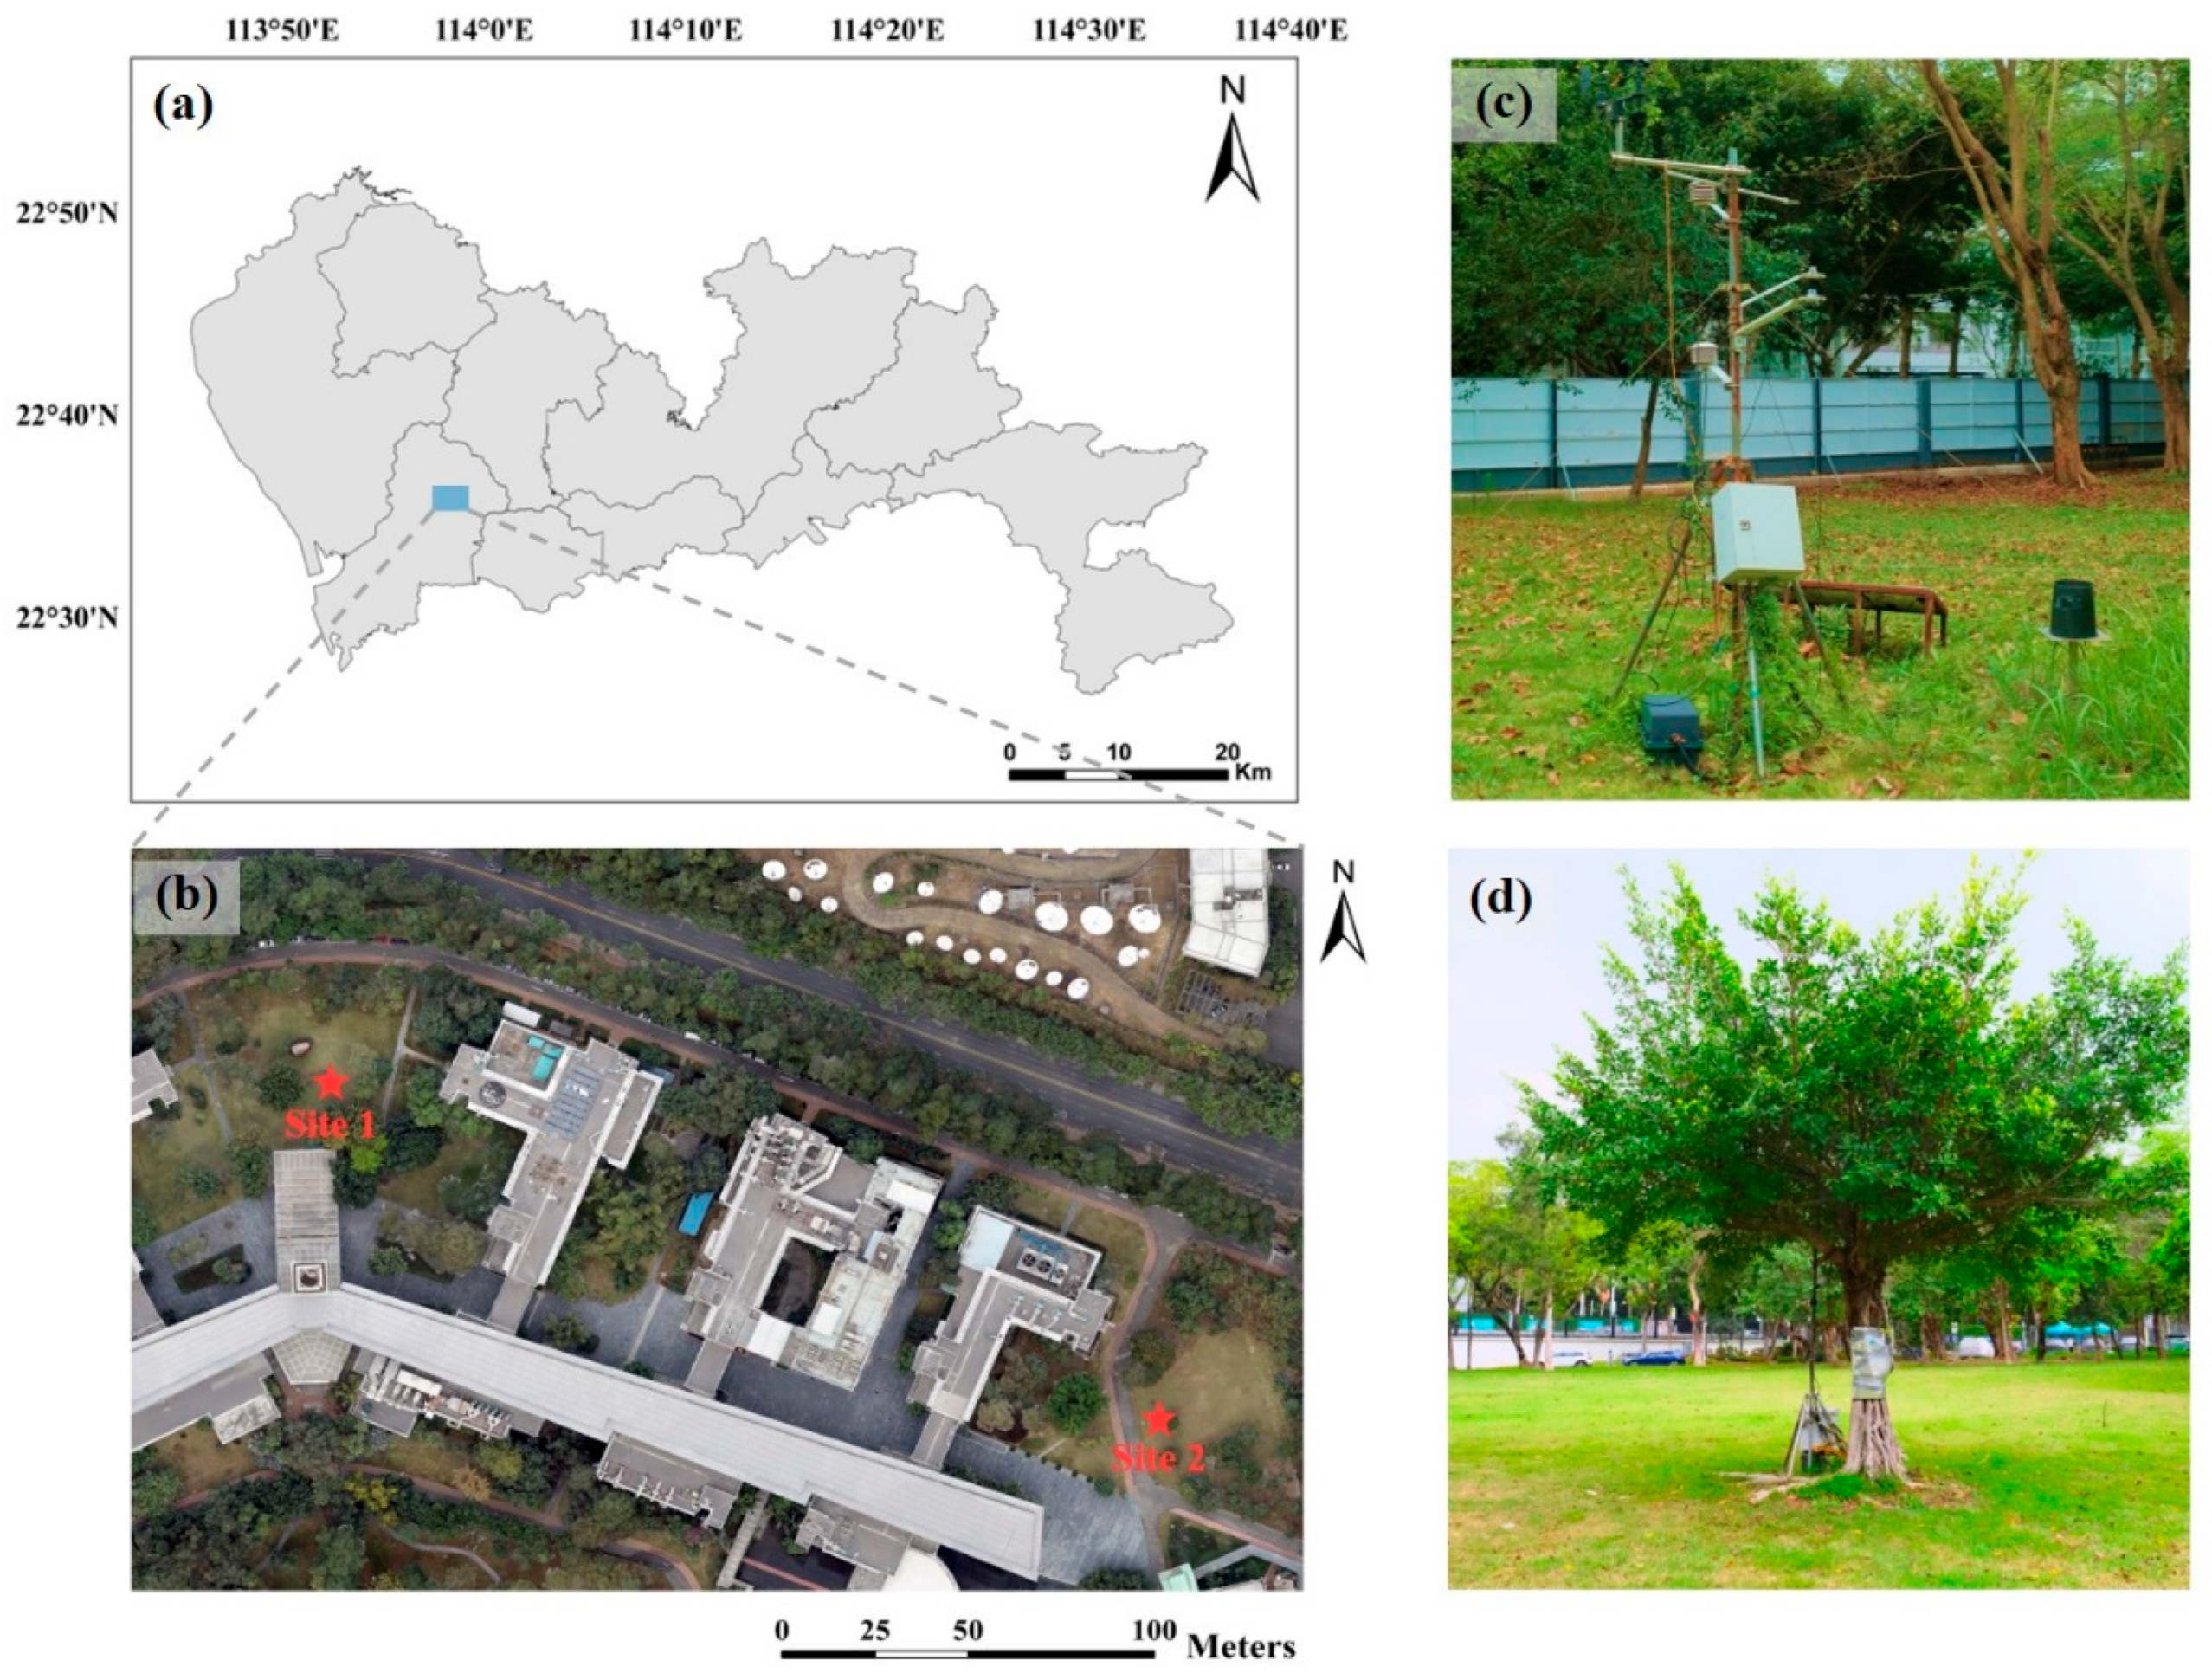
Figure 1. (a) Location of the study area in Shenzhen City; (b) plan view of the study area and the location of the two experiment sites; (c) Site 1, an urban lawn (Zoysia matrella); and (d) Site 2, the experimental target tree (Ficus concinna).
Forests 16 01564 g001
Figure 2. Schematic diagram of the 4 designed simulated scenarios: (a) transpiring tree with normal roots and water supply; (b) transpiring lawn; (c) non-transpiring tree without roots and water supply; (d) non-transpiring lawn. The subscript “no_tr” refers to the simulation results under non-transpiring conditions.
Forests 16 01564 g002
Figure 3. Air temperatures and precipitation of the study area during the observation period from January to December 2022, the blue shaded areas indicate the days that are used for ENVI-met simulations.
Forests 16 01564 g003
Figure 4. Combined cooling effect of the individual tree. (a) Annual variations in the tree cooling effect on a daily scale. (b) Intraday variations in the tree cooling effect on an hourly scale. The boxplots for each time illustrate the 25th, 50th, and 75th quantiles of the data.
Forests 16 01564 g004
Figure 5. Comparison of the measured and simulated air temperatures. (a) Lawn on sunny days; (b) lawn on cloudy days; (c) canopy shade on sunny days; (d) canopy shade on cloudy days. RMSE: root mean square error; MAPE: mean absolute percentage error.
Forests 16 01564 g005
Figure 6. Shading and transpiration cooling effect of the individual tree. (a) Annual variations in the tree cooling effect on a daily scale. (b) Intraday variations in the tree cooling effect on an hourly scale.
Forests 16 01564 g006
Figure 7. (a) Scatter plot of the combined cooling effect and air temperature, the black line represents the regression line. (b) Cooling effect of transpiration and shading under different air temperature ranges. (c) Cooling contribution of transpiration and shading. (d) Comparisons of transpiration cooling contribution between the ENVI-met simulation and flux measured data.
Forests 16 01564 g007
Figure 8. (a) The shading, transpiration and combined cooling effect of a tree under different weather conditions. (b) The cooling contribution of shading and transpiration under different weather conditions.
Forests 16 01564 g008
Disclaimer/Publisher’s Note: The statements, opinions and data contained in all publications are solely those of the individual author(s) and contributor(s) and not of MDPI and/or the editor(s). MDPI and/or the editor(s) disclaim responsibility for any injury to people or property resulting from any ideas, methods, instructions or products referred to in the content.