Article

Spatiotemporal Distribution Analysis of Spatial Vitality of Specialized Garden Plant Landscapes during Spring: A Case Study of Hangzhou Botanical Garden in China

1
College of Landscape Architecture, Zhejiang Agriculture and Forestry University, Hangzhou 311300, China
2
Huayong Engineering Design Group Co., Ltd., Ningbo 315000, China
*
Authors to whom correspondence should be addressed.
Forests 2024, 15(1), 208; https://doi.org/10.3390/f15010208
Submission received: 28 December 2023 / Revised: 14 January 2024 / Accepted: 18 January 2024 / Published: 20 January 2024
(This article belongs to the Special Issue Landsenses in Green Spaces)

Abstract

:
Specialized gardens, as integral components of botanical gardens, bear multiple functions, encompassing plant collection and conservation, scientific research, and public education, as well as serving aesthetic and recreational purposes. Their quality profoundly reflects the landscape artistry of botanical gardens, directly influencing the quality of visitors’ enjoyment and the overall experience within the botanical garden. This study aims to investigate the spatial vitality of specialized garden plant landscapes, effectively assessing the usage patterns of plant landscape spaces and promoting the optimal utilization of underutilized spaces. Taking Hangzhou Botanical Garden as a case study, considering the warming climate and suitable temperatures in spring, when most plants enter the flowering period and outdoor visitor frequency increases, the primary observational period focuses on spring to measure the spatial vitality of specialized garden plant landscapes. We obtained data through field measurements and on-site observations. Specifically, We measured and recorded information on plant species, quantity, height, crown width, and growth conditions within the plots. Additionally, we employed ground observations and fixed-point photography to document visitor numbers and activity types. We quantified spatial vitality through four indicators: visitor density, space usage intensity, diversity of age group, and richness of activity type. We explored the spatiotemporal distribution patterns of spatial vitality and investigated the relationship between plant landscape characteristics and spatial vitality using variance analysis and correlation analysis. The results indicate that, in spring, the average spatial vitality index of specialized gardens ranks from highest to lowest as follows: Lingfeng Tanmei (1.403), Rosaceae Garden (1.245), Acer and Rhododendron Garden (0.449), and Osmanthus and Crape Myrtle Garden (0.437). Additionally, the spatial vitality of specialized garden plant landscapes in spring is significantly positively correlated with the ornamental period of specialized plants, characteristics of plant viewing, accessible lawn area, spatial accessibility, and spatial enclosure. Therefore, to create vibrant specialized plant landscapes, managers and planners, when engaging in the planning and design of specialized garden plant landscapes, need to fully consider and respect the visual aesthetics and functional needs of visitors. This study will serve as a theoretical reference for subsequent research on the vitality of plant landscape spaces and other small-scale spaces. It will also provide practical guidance for the construction of plant landscapes in specialized gardens within botanical gardens and other urban green spaces.

1. Introduction

The World Botanical Gardens have long played an active role in conducting scientific research and education, maintaining plant diversity, and monitoring climate change [1,2,3]. With the establishment of two national botanical gardens in Beijing and South China, along with the emergence of botanical gardens across various regions, the Chinese botanical garden industry is experiencing robust development [4]. Specialized gardens, as the core of botanical gardens, are characterized by specific landscape themes, featuring plants with similar traits as the primary thematic elements [5,6,7]. These gardens serve as the main venues for plant collection and conservation, scientific research, and education within botanical gardens. Additionally, they encompass functions of leisure and aesthetics, directly influencing the quality of visitors’ experiences in botanical gardens. In recent years, some urban parks and scenic areas have increasingly focused on the creation of specialized plant landscapes. Notable examples include the Peony Garden in Heze City in northern China and the Plum Garden in the Taihu Scenic Area in southern China, both renowned tourist destinations, exerting a significant impact on the aesthetic shaping of urban green spaces.
Numerous researchers have conducted research on the plant landscapes of specialized gardens, such as those dedicated to wetland woody plants [8], vine plants [9], and medicinal plants [10]. They have proposed planning and design strategies for specialized gardens, addressing aspects such as plant arrangement, ornamental design, plant culture expression, and regional characteristics prominence. However, existing studies are often confined to individual types of specialized gardens. Moreover, some research has revealed an uneven distribution of visitors in many specialized gardens [11]. This manifests as overcrowding during specific periods and areas, while other periods and areas witness sparse visitor activity, resulting in the underutilization of many spaces. Addressing the issue of improving spatial vitality and creating specialized garden plant landscapes that meet the needs of visitors is a crucial consideration.
Spatial vitality refers to the capacity of urban public spaces to attract human activities [12,13,14]. Numerous scholars have conducted research on the relationship between environmental factors and spatial vitality in various urban public spaces, such as urban parks [15,16,17], historic districts [18], streets [19], night markets [20], and urban underground spaces [21]. In the context of this study, spatial vitality refers to the intensity of use in spaces primarily composed of plants. Plant landscape spaces provide the material environment for various outdoor activities, and visitor behavior characteristics reflect the quality and attractiveness of the spaces [22]. Existing vitality studies primarily focus on medium to large-scale urban public spaces, with vitality measurements primarily considering a single indicator, such as population density, lacking the exploration of indicators that can reflect the quality and attractiveness of spaces. Some scholars have studied the vitality distribution of small-scale spaces like plant landscape spaces. However, the majority of these studies have focused on urban park plant landscapes [23,24,25], with a limited exploration into the plant landscapes of specialized gardens. Moreover, existing research predominantly emphasizes the spatial distribution and variations in vitality, paying relatively less attention to the temporal fluctuations and seasonal changes in vitality.
The research methods for spatial vitality can be broadly categorized into two types: traditional methods and novel methods based on multi-source data analysis [26,27]. Traditional methods include questionnaire surveys, interviews, behavior observations, behavior mapping, etc. [28,29,30]. With the development and widespread use of Internet big data, new methods based on multi-source data analysis, such as mobile signaling data [31] and social media network data [32], have gradually emerged. These methods enable the collection and visualization of massive sample data in a short period with a low consumption [33,34], providing convenience for vitality research in medium to large-scale spaces. However, current research on the spatiotemporal distribution of vitality in plant landscapes still predominantly relies on traditional methods such as behavior observation and behavior mapping. This is primarily due to the difficulty of meeting the precision requirements for studying vitality in small-scale spaces using current analysis methods based on mobile communication and location navigation data. Additionally, obtaining detailed information about visitor behavior activities, which are integral components of the spatial vitality [35,36], proves challenging with these methods.
In light of the aforementioned, we conducted a study on the spatial vitality of specialized garden plant landscapes in the Hangzhou Botanical Garden, situated in the southeastern coastal region of China. Our objectives were to address the following issues: (1) To clarify the spatiotemporal distribution patterns of spatial vitality of specialized garden plant landscapes in spring based on visitor behavior characteristics. (2) To explore the differences in spatial vitality of specialized garden plant landscapes in spring and the related landscape factors. (3) To provide recommendations on how to stimulate visitor participation, create vibrant specialized garden plant landscapes, and enhance the utilization and participation rates of specialized garden plant landscape spaces.

2. Materials and Methods
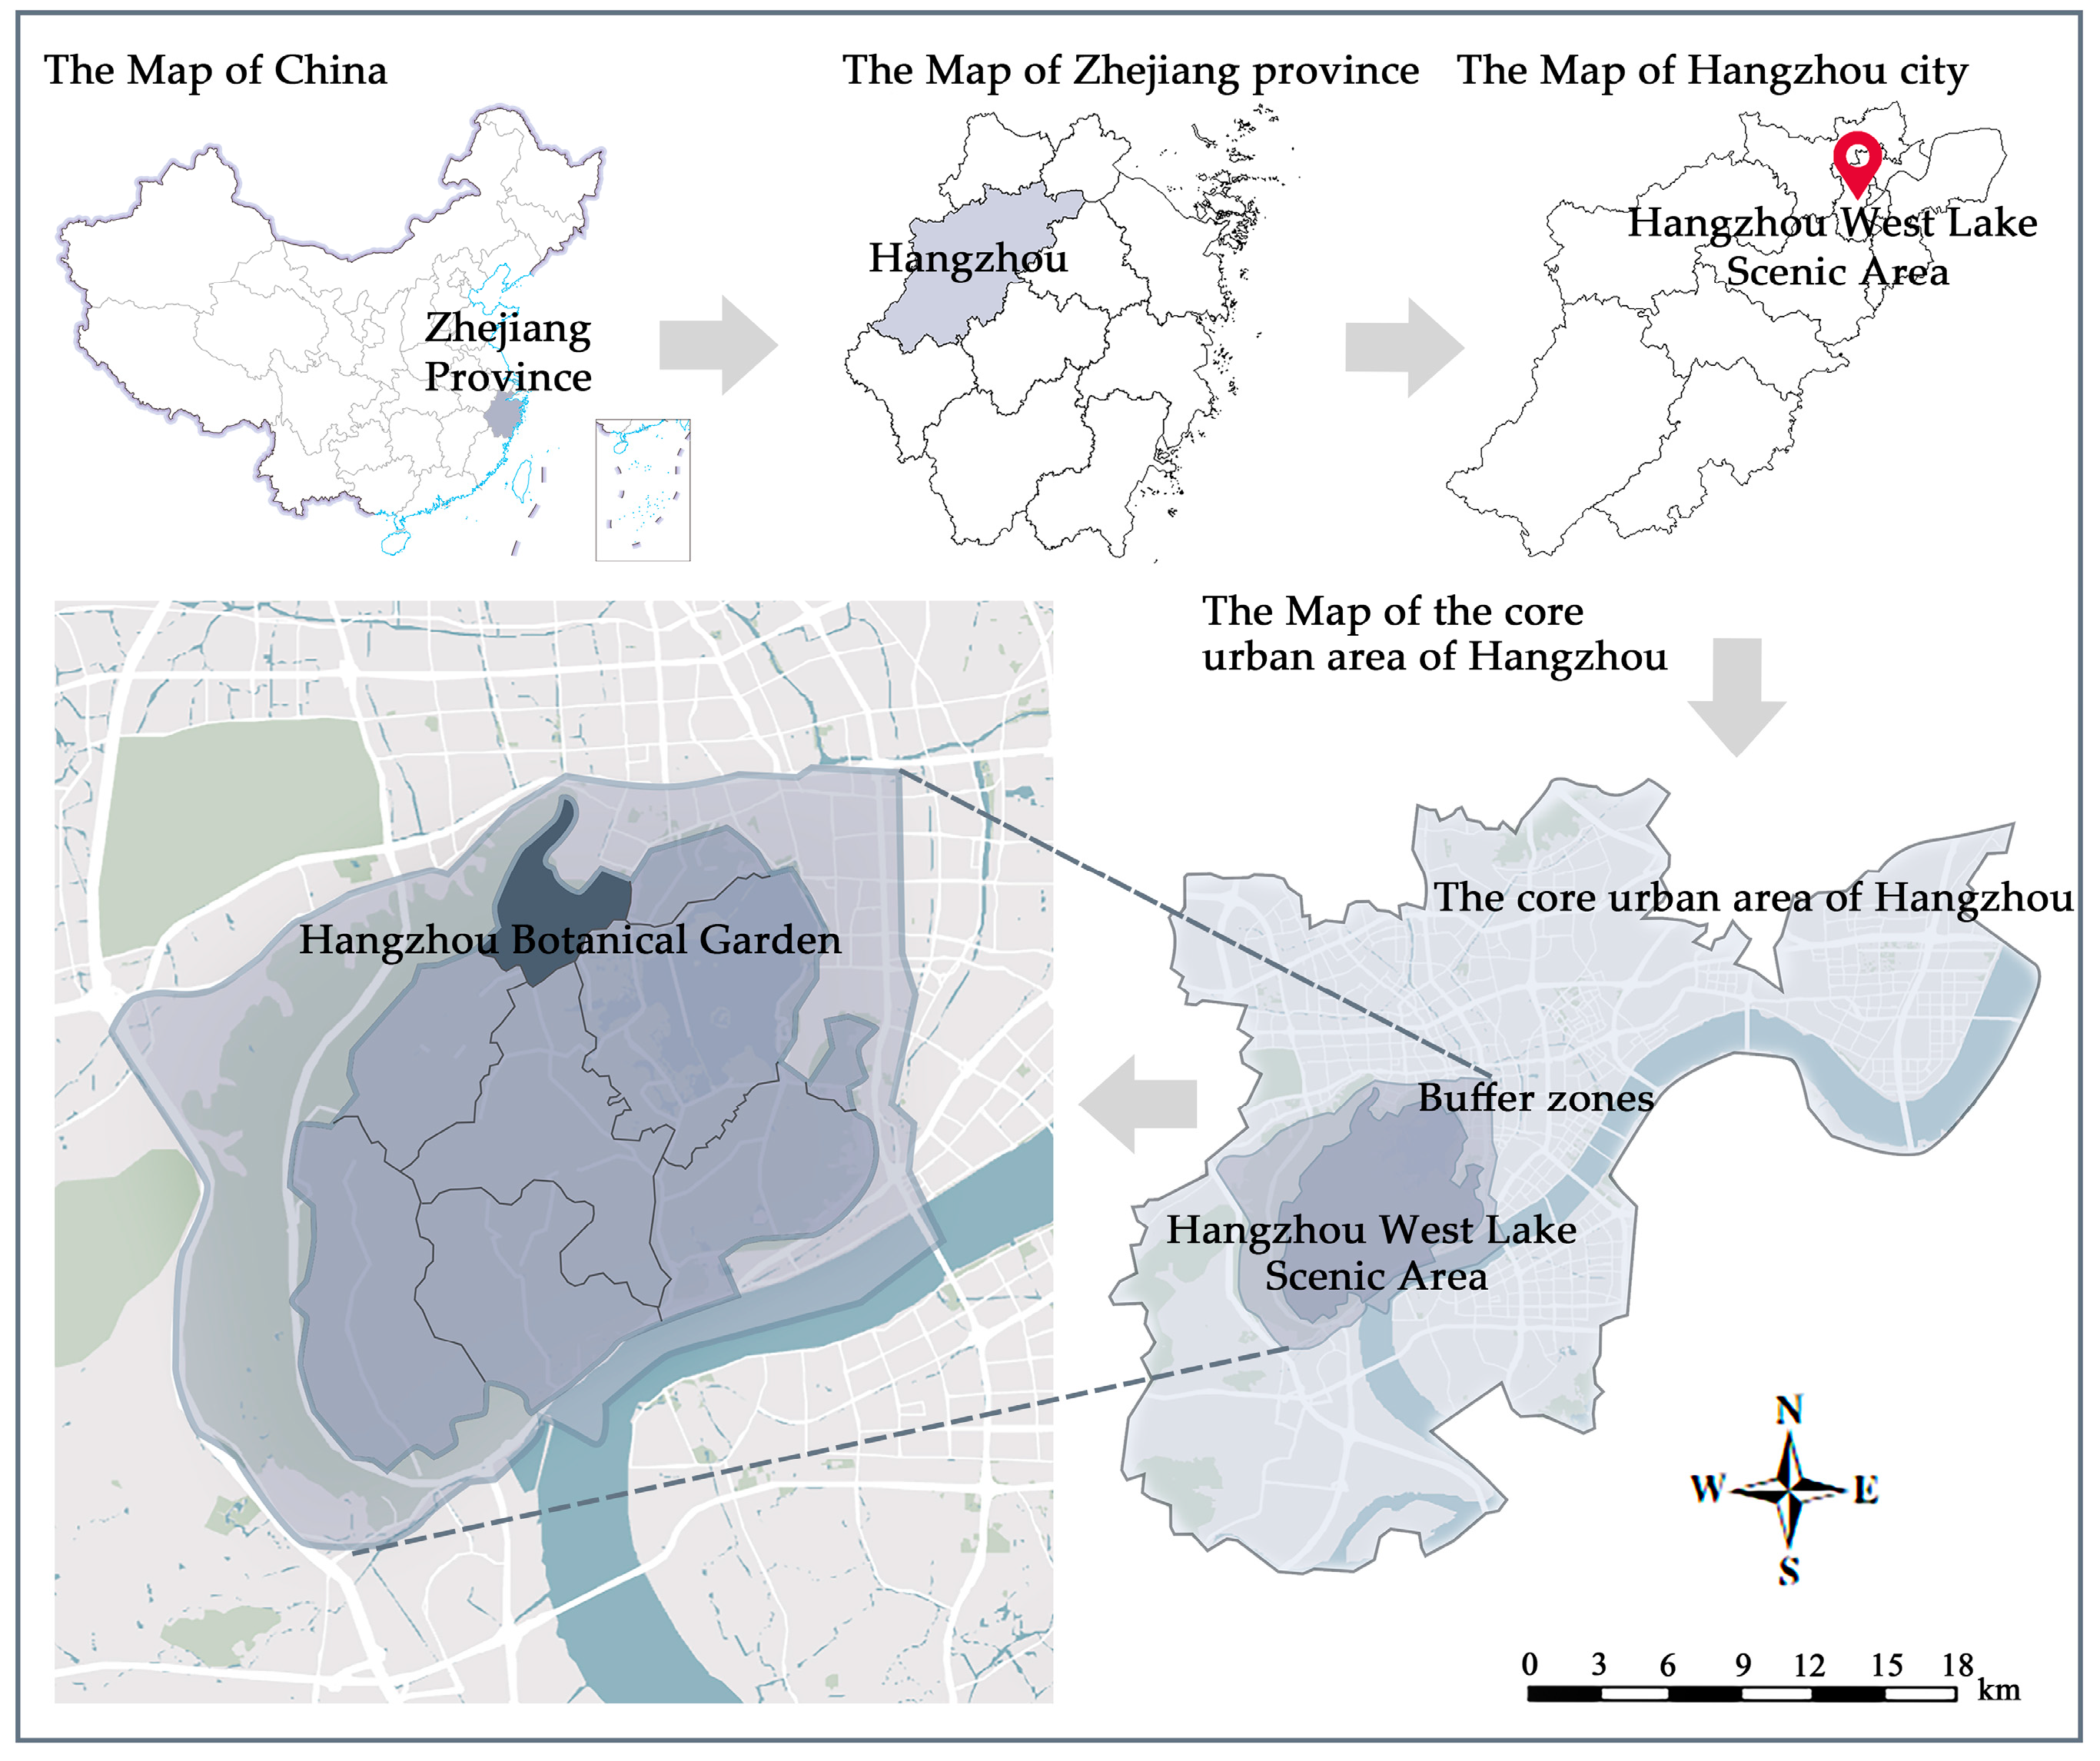
2.1. Study Area

Hangzhou (29°11′–30°34′ N; 118°20′–120°37′ E), situated in the southeastern coastal region of China, serves as the capital of Zhejiang Province and is renowned for its picturesque natural landscapes and rich historical and cultural heritage. Embracing a subtropical monsoon climate, Hangzhou experiences distinct seasons with abundant rainfall and ample sunlight. During spring, the average temperature hovers around 17 °C, accompanied by precipitation ranging from 330 to 450 mm. This pleasant climate marks the prime period for outdoor activities, sightseeing, and flower appreciation as numerous plants enter their blooming phase.
Hangzhou Botanical Garden is situated in the northwest of the West Lake Scenic Area in Hangzhou, covering an area of 284.64 hm2 (Figure 1). The topography within the garden is undulating and adorned with lush vegetation. In the northern region, two primary residential areas coexist, complemented by a surrounding array of dining and office spaces. Established as one of the most influential botanical gardens in China since the founding of the People’s Republic, after more than 60 years of transformation and development, it has gradually evolved into a comprehensive botanical garden integrating plant conservation, scientific research, popular science education, tourism, and ecological leisure, holding a significant impact both domestically and internationally.

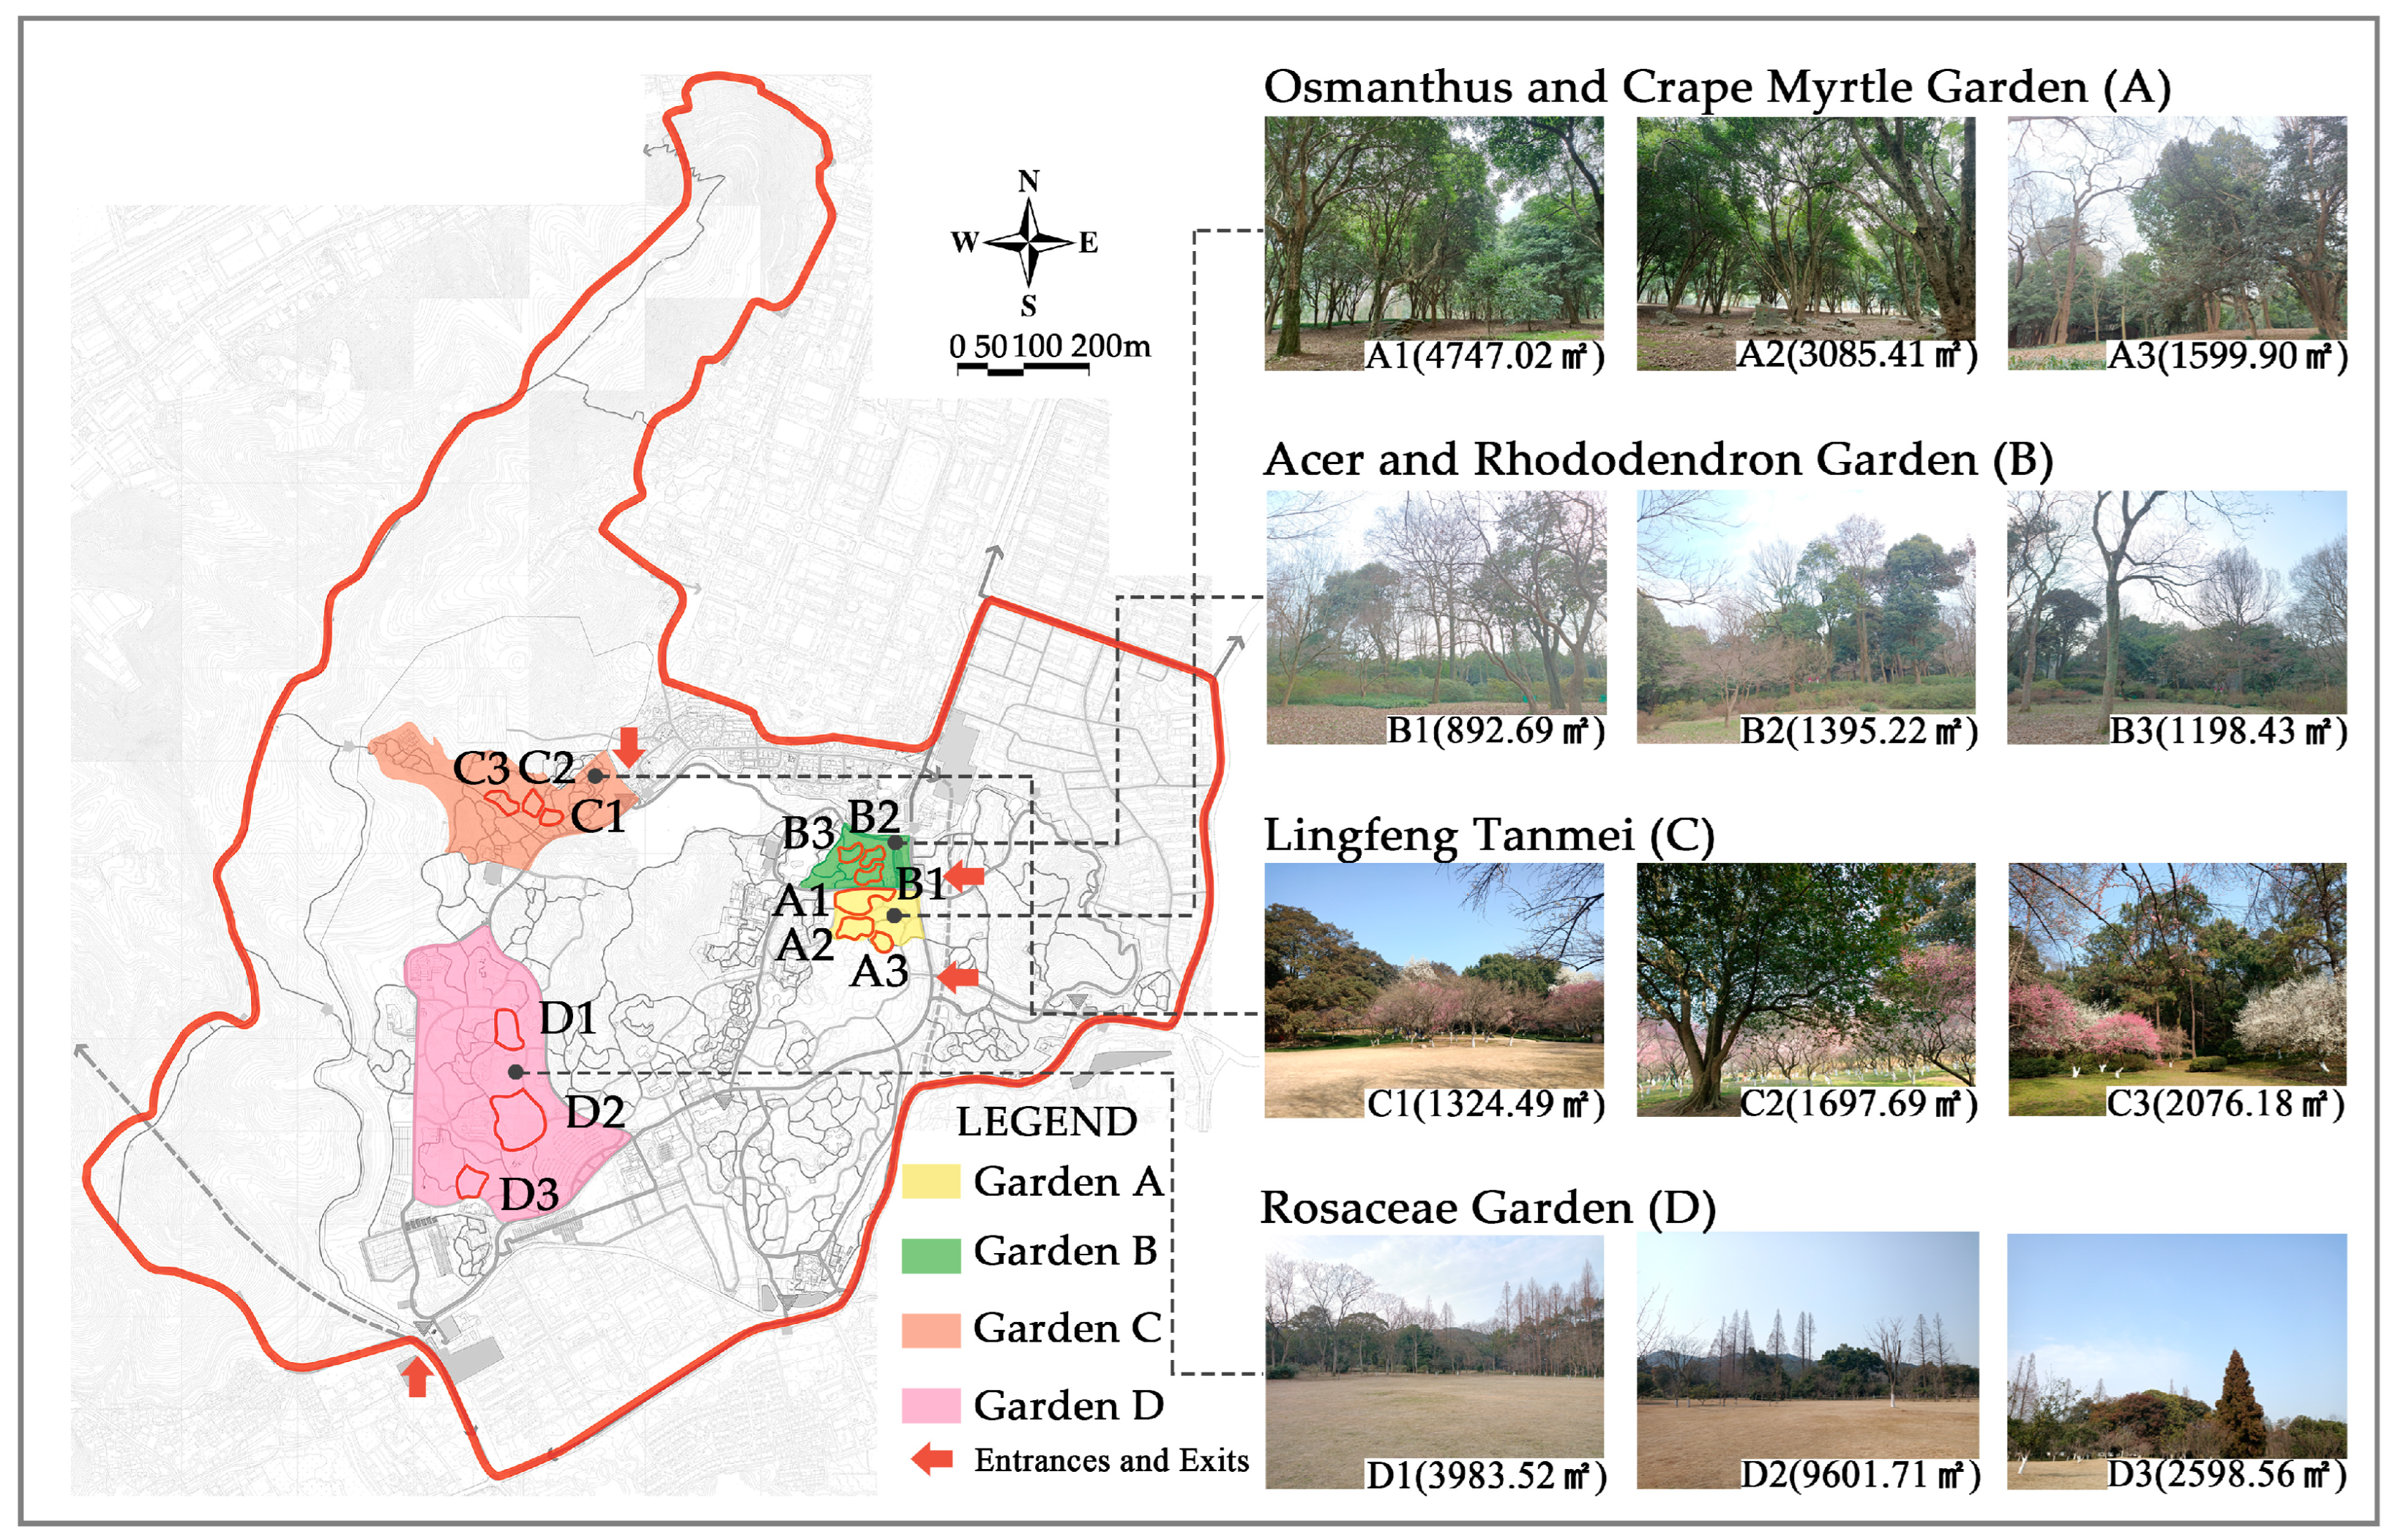
2.2. Selection of Research Subjects and Plots

Four specialized gardens were selected as research subjects based on well-defined themes, distinctive features, and pronounced seasonal variations. These include Osmanthus and Crape Myrtle Garden, primarily featuring summer and autumn landscapes; Acer and Rhododendron Garden, emphasizing spring and autumn landscapes; Lingfeng Tanmei, showcasing winter and spring landscapes; and Rosaceae Garden (aquatic plants area), predominantly exhibiting spring and summer landscapes.
Osmanthus and Crape Myrtle Garden prominently features various Osmanthus varieties, such as Osmanthus fragrans var. thunbergii, Osmanthus fragrans ‘Latifolius’, Osmanthus fragrans var. aurantiacus and Osmanthus fragrans ‘Semperflorens’. Simultaneously, the peripheral areas are landscaped with clusters of Lagerstroemia indica, creating a picturesque scene in the summer and autumn seasons. It stands out as an excellent location for enjoying osmanthus blossoms in the autumn. Acer and Rhododendron Garden features primarily plants of the Rhododendron and Acer in the middle and lower layers. Leveraging the existing upper-layer Liquidambar taiwaniana and Fagaceae plants, it collaboratively creates a plant landscape for enjoying rhododendron blooms in spring and appreciating red leaves in autumn. Lingfeng Tanmei has a rich history and profound cultural heritage, forming a plant landscape primarily centered around Prunus mume. It has earned a reputation as a renowned destination for appreciating plum blossoms. Rosaceae Garden focuses on cultivating plants from the Rosaceae, such as Prunus salicina, Prunus serrulata, and Malus halliana, complemented by various aquatic plants, contributing to the landscape during the spring and summer seasons.
To ensure the continuity of plant landscapes and the integrity of their spatial representation, three locations reflecting the themes and features of specialized plant landscapes, possessing typical characteristics of plant landscape spaces and allowing visitor access were chosen within each of the four specialized gardens demarcated by the forest edge and pathway edge [24]. The total area of the plots is 3.42 hm2, with an average size of 2850 m2 (Figure 2). The plots predominantly feature plants and exclude elements such as water bodies, buildings, structures, large paved squares, etc., aiming to minimize interference from non-plant landscape elements on visitor behavior [11].

2.3. Data Acquisition

2.3.1. Plant Landscape Space Characteristics

This study, based on existing research on plant landscape surveys in urban public spaces such as parks [37,38] and water bodies [39], along with studies on individual landscape preference and perception [40,41], identified the specific indicators of specialized garden plant landscape characteristics that need to be collected. A field survey was conducted to investigate the plant landscape space characteristics of each plot. The survey covered a total of 14 landscape variables, comprising both plant and spatial factors. The concepts and quantification methods for each specific indicator are outlined in Table 1 below.

2.3.2. Visitor Behavior Characteristics

In this study, visitor behavior primarily refers to recreational activities. As individual behaviors often exhibit variations, the similarities manifested collectively represent visitor behavior characteristics [42]. Behavior observations were conducted to observe and record visitor behavior characteristics within each plot. Visitors’ gender, age, and activity type were recorded as a set of data. Based on visitors’ behavioral purposes, their activities were categorized into four types: Leisure and Relaxation (chatting, sitting, lying down, picnicking), Sightseeing and Touring (walking, photography, enjoying the scenery), Physical Exercise (Tai Chi, ball sports), and Experience and Entertainment (games, music, chess, picking, kite flying, outdoor education), encompassing a total of 15 visitor behaviors.
Data collection occurred from 4 February 2023 (Start of Spring) to 6 May 2023 (Start of Summer). Observations were conducted on two weekdays and two weekends each month. To ensure sufficient and valid data, observations were carried out on clear weather days conducive to outdoor activities. Observers followed a fixed path and locations, conducting observations from 8:30 a.m. to 16:30 p.m. with a 2-h interval. Each site was observed for 15 min. After 12 rounds of on-site observations, a total of 3367 sets of visitor behavior characteristics data were collected, forming the foundational data for quantifying spatial vitality.

2.4. Data Processing and Analysis

2.4.1. Quantification of Spatial Vitality

Through multiple observations of visitor behavior, we acquired a substantial dataset of visitor behavior characteristics. Firstly, we performed preliminary summarization and processing of the data using SPSS 26.0, establishing it as the foundational dataset for quantifying spatial vitality. Subsequently, we employed four indicators, namely visitor density, space usage intensity, diversity of age group, and richness of activity type, as measures of spatial vitality. The first two emphasize the quantity of individuals in space, while the latter two primarily reflect the quality of space. Finally, we utilized formulas to calculate the spatial vitality index for each specialized garden and plot, thereby assessing and evaluating the spatial vitality. The following outlines the concepts and calculation formulas for the four-vitality metrics and the spatial vitality index.
Visitor density refers to the number of visitors per unit area, providing a direct reflection of spatial vitality.
Space usage intensity is calculated using the average area occupied per person during peak hours, expressed as:
An = 100/(A/Np)
where A is the plot area and Np is the number of visitors during peak hours [43].
Diversity of age group refers to the richness of age group types among visitors, calculated using the Shannon–Wiener diversity index, expressed as:
D = i = 1 n P i l n p i
where Pi is the ratio of visitors in each age group to the total number of visitors [24]. Higher values indicate a more balanced distribution of visitors across different age groups.
Richness of activity type represents the number of simultaneously occurring activity types in space. Higher values indicate that the space can fulfill a more diverse range of functional needs for visitors.
The average values of each indicator on weekdays and weekends for each plot were obtained. These values were standardized, and the entropy method and CRITIC weighting method were employed to determine the weights for each indicator (Table 2). Using the comprehensive weights, the spatial vitality index for each plot was calculated as follows:
Spatial Vitality Index = (Visitor Density × 0.271) + (Space Usage Intensity × 0.215) + (Diversity of Age Group × 0.306) + (Richness of Activity Type × 0.208)
and then the average spatial vitality index for each specialized garden is presented.

2.4.2. Analysis of Spatial Vitality Differences and Correlations

The spatial vitality index data passed tests for normality and homogeneity of variance. Single-factor analysis of variance (ANOVA) was conducted to compare the differences in spatial vitality among different types of specialized gardens, and Post hoc tests were performed to explore specific differences. A Spearman correlation analysis was conducted to explore the correlation between the 14 plant landscape space characteristics and spatial vitality. All these analyses were carried out using SPSS 26.0.

3. Results

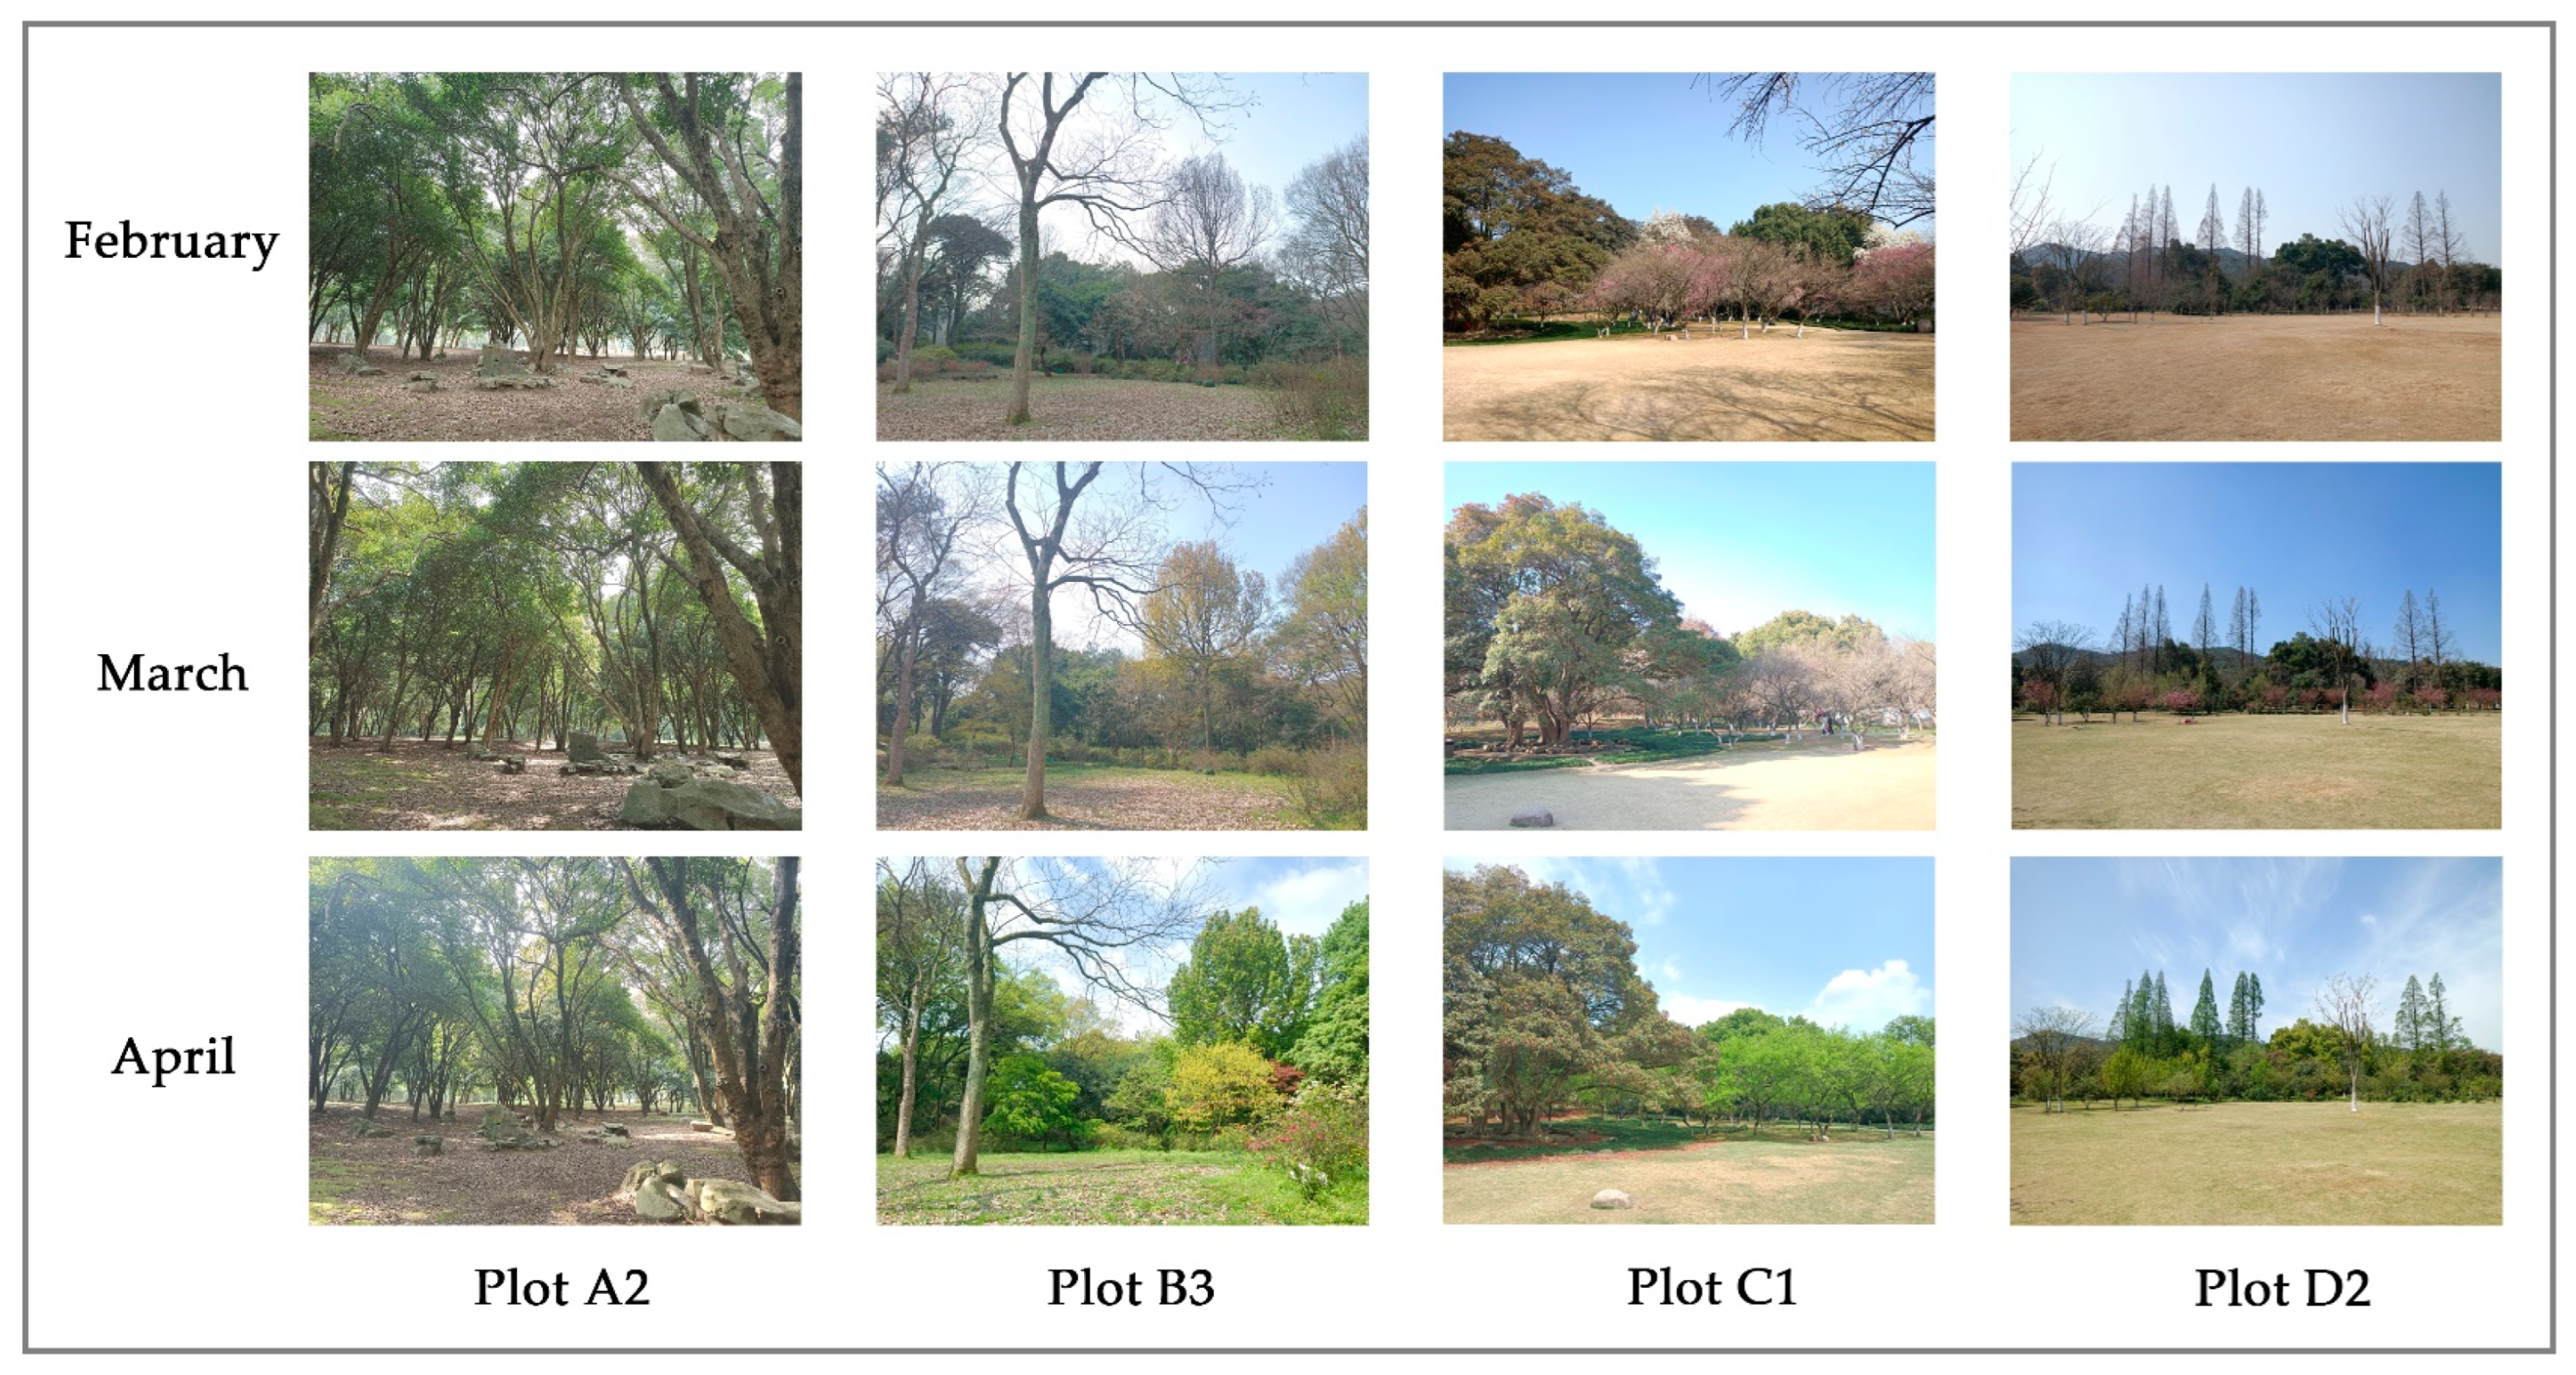
3.1. Analysis of Plant Landscape Space Characteristics

During the spring, Garden A remains in a non-ornamental phase with minimal changes in plant landscapes. Gardens B, C, and D exhibit significant transformations over time (Figure 3). Field measurements and subsequent calculations were conducted to assess the spatial characteristics of plant landscapes in each specialized garden and plot (Table 3). The specific variations in each indicator are outlined as follows.
In Garden A, the average spatial area is 3144.11 m2, with an average accessible grassland area of 2402.14 m2. The average spatial enclosure degree is 5.35, and the average spatial shape coefficient is 1.21. The average length of the nearest pathway to the entrance/exit is 155.32 m. For Plot A1, the community structure is Magnolia soulangeana—Osmanthus fragrans + Lagerstroemia indica—Ophiopogon bodinieri (R = 0.816; H = 0.213). For Plot A2, the community structure is Osmanthus fragrans + Lagerstroemia indica (R = 0.573; H = 0.066), lacking shrubs and ground cover plants, with the largest grassland area. For Plot A3, the community structure is Magnolia grandiflora + Ginkgo biloba + Celtis sinensis—Osmanthus fragrans + Podocarpus macrophyllus + Euonymus carnosus—Lycoris radiata (R = 1.873; H = 0.412), with the smallest grassland area. The D/H values for Plot A1 and A2 are both greater than 5, indicating open spaces, while the D/H value for Plot A3 is much smaller, indicating a stronger sense of spatial enclosure.
In Garden B, the average spatial area is 1162.11 m2, with an average accessible grassland area of 789.66 m2. The average spatial enclosure degree is 3.35, and the average spatial shape coefficient is 1.19. The average length of the nearest pathway to the entrance/exit is 126.13 m. The middle and lower layers feature plants from the Rhododendron and Acer, creating a plant landscape for enjoying rhododendrons in spring and red leaves in autumn. For Plot B1, the upper layer consists of Liquidambar taiwaniana (R = 4.067; H = 0.645). For Plot B2, the upper layer includes Altingia gracilipes, Yulania denudata, and Liquidambar taiwaniana (R = 4.134; H = 0.683). For Plot B3, the upper layer features Sapindus Saponaria and Liquidambar taiwaniana (R = 3.248; H = 0.583). The canopy closure decreases successively across plots while accessible lawn area increases. D/H values are close, indicating a strong sense of spatial enclosure similar to Garden A.
In Garden C, the average spatial area is 1699.45 m2, with an average accessible grassland area of 1205.60 m2. The average spatial enclosure degree is 5.51, and the average spatial shape coefficient is 1.16. The average length of the nearest pathway to the entrance/exit is 291.26 m. For Plot C1, the community structure is Elaeocarpus glabripetalus—Prunus mume + Acer palmatum + Illicium henryi—Camellia japonica + Ophiopogon bodinieri (R = 1.602; H = 0.252). For Plot C2, the community structure is Elaeocarpus glabripetalus + Magnolia soulangeana—Prunus mume + Michelia figo + Ilex hylonoma var. glabra—Ophiopogon bodinieri (R = 1.548; H = 0.176). For Plot C3, the community structure is Liquidambar taiwaniana + Pinus elliottii + Magnolia soulangeana—Prunus mume + Michelia figo + Acer palmatum + Podocarpus macrophyllus—Rhododendron × pulchrum + Ophiopogon bodinieri + Hedera nepalensis var. sinensis + Trachelospermum jasminoides (R = 3.617; H = 0.426).The D/H values for all plots are close and greater than 5, indicating open spatial configurations.
In Garden D, the average spatial area is 5394.60 m2, with an average accessible grassland area of 5243.16 m2. The average spatial enclosure degree is 10.58, and the average spatial shape coefficient is 1.12. The average length of the nearest pathway to the entrance/exit is 570.76 m. For Plot D1, the plant community structure is Sapindus saponaria—Prunus mume ‘Danban Xing’ + Prunus conradinae + Prunus serrulate var. lannesiana —Camellia uraku (R = 2.222; H = 0.449). For Plot D2, the plant community structure is Ginkgo biloba + Sapindus saponaria—Eriobotrya japonica + Pseudocydonia sinensis + Malus halliana—Rosa chinensis + Chaenomeles cathayensis + Chaenomeles speciosa (R = 2.511; H = 0.471). For Plot D3, the community structure is Elaeocarpus glabripetalus + Cryptomeria japonica—Prunus salicina + Eriobotrya japonica + Pyrus pyrifolia + Prunus ‘Yoko’—Photinia serratifolia + Camellia japonica + Rhaphiolepis umbellate + Liriope spicata (R = 2.928; H = 0.572). D/H values for Plots D1 and D2 are both greater than 10, suggesting broad visibility and a spacious feel.

3.2. Analysis of Visitor Behavior Characteristics

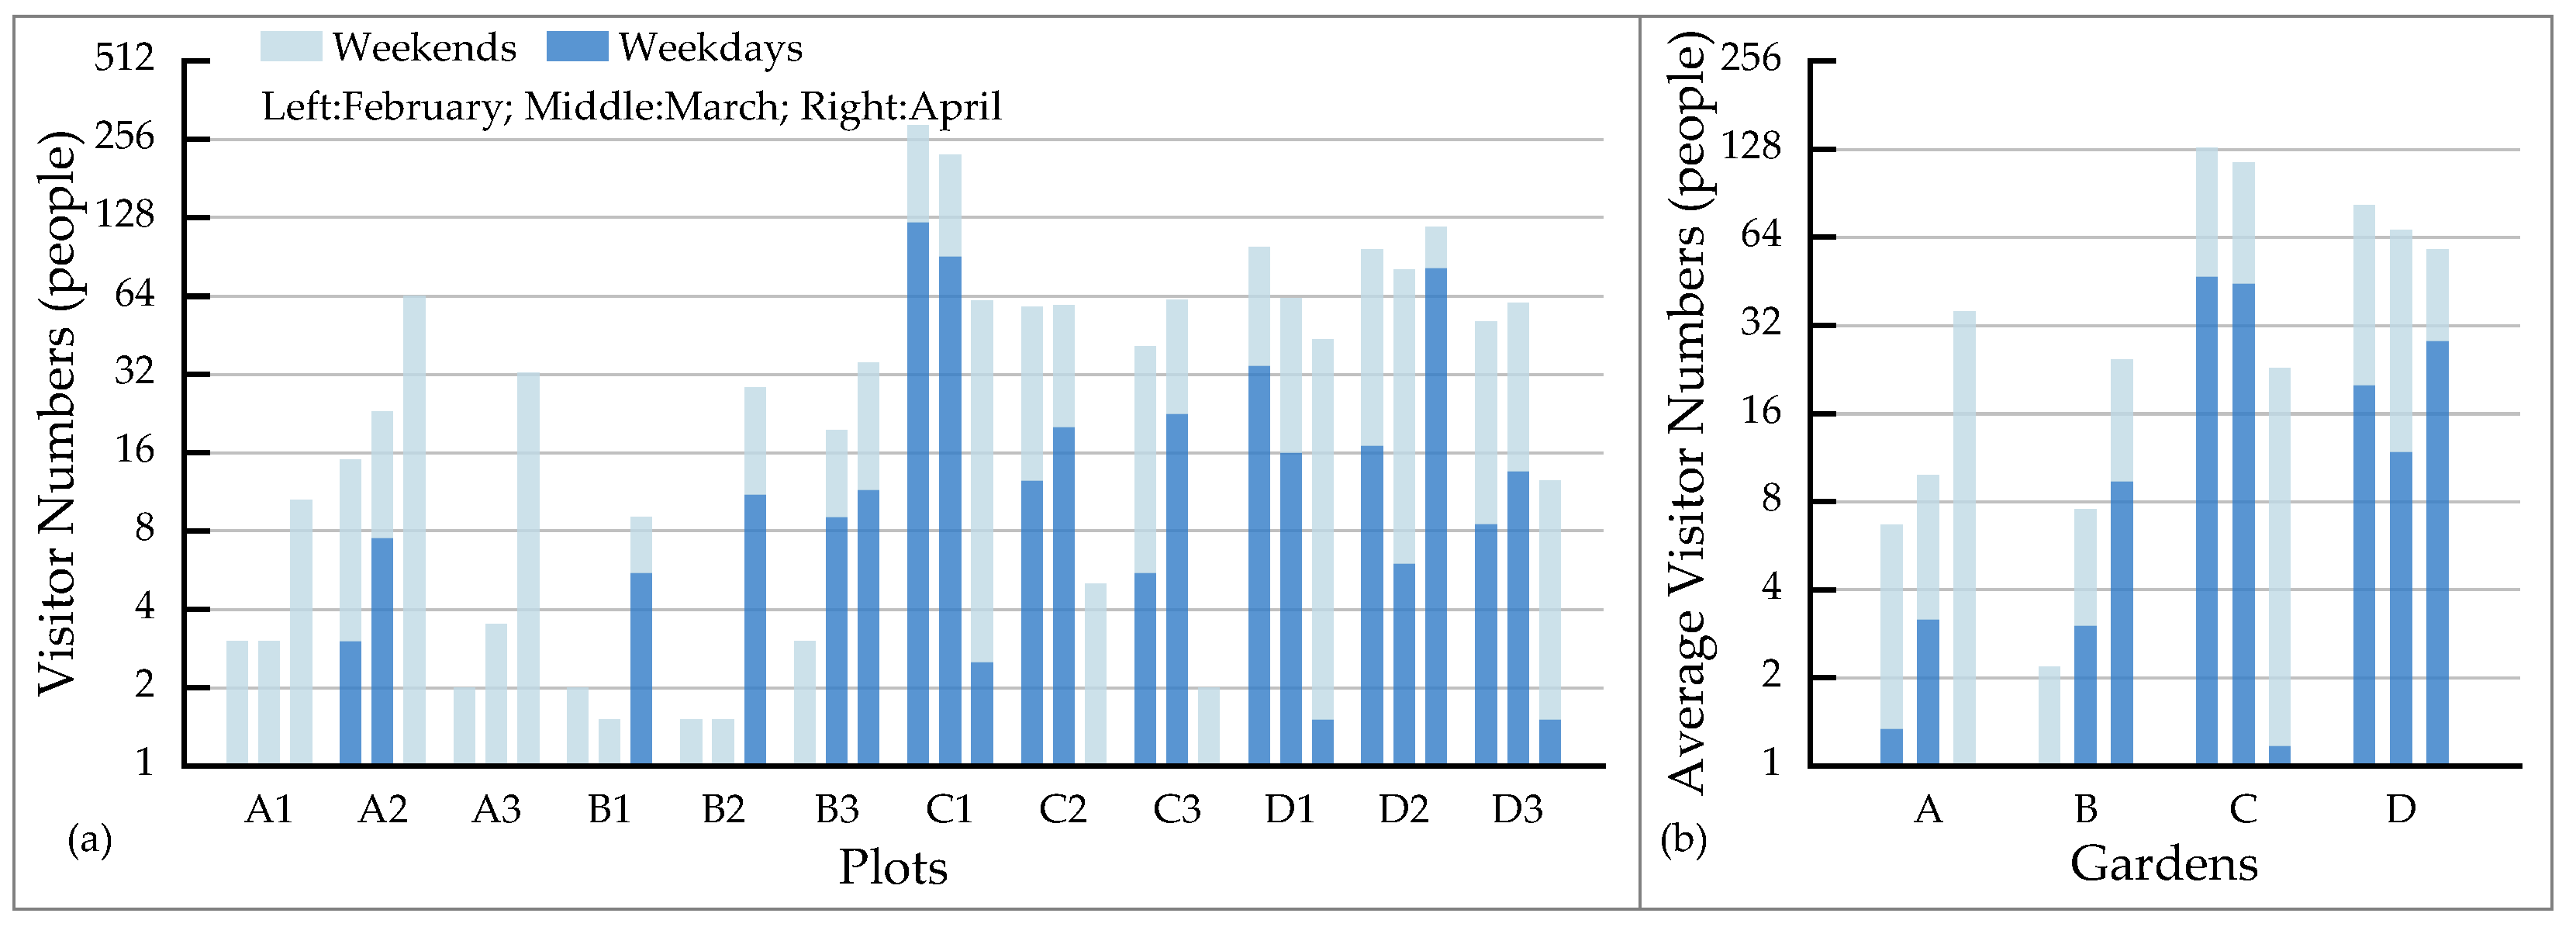
3.2.1. Distribution of Visitor Numbers

Figure 4 illustrates the temporal variations in the number of visitors across various specialized gardens and plots. Each stacked bar in this chart represents data for both weekends and weekdays, progressing from left to right to correspond to various specialized gardens and plots across different months in spring. Generally, Garden A and Garden B show an increasing trend in visitor numbers, while Garden C and Garden D exhibit a decreasing trend. On weekends, the number of visitors is generally higher than on weekdays. From February to early March, Garden C is in its main viewing period, with a significantly higher number of visitors compared to other specialized gardens. Among them, Plot C1 has the highest number of visitors. In mid-March, as the Prunus mume completely withers, the number of visitors to Garden C sharply declines. Meanwhile, in Garden D, with Prunus salicina, Pyrus pyrifolia, Malus spectabilis, Prunus serrulata, and other Rosaceae plants blooming, the number of visitors is significantly higher than in other specialized gardens.
Figure 5 presents the temporal variations in visitor density and spatial usage intensity for each specialized garden and plot. Generally, the indicators on weekends are higher than on weekdays and show the same changing trend. Garden A and Garden B show an increasing trend, while Garden C and Garden D exhibit a decreasing trend. In February and March, Garden C has the highest indicators, with Plot C1 having the highest. In April, Garden B has the highest indicators, with Plot B3 having the highest. Although Garden D has the highest number of visitors due to its large area, both visitor density and spatial usage intensity are the lowest.

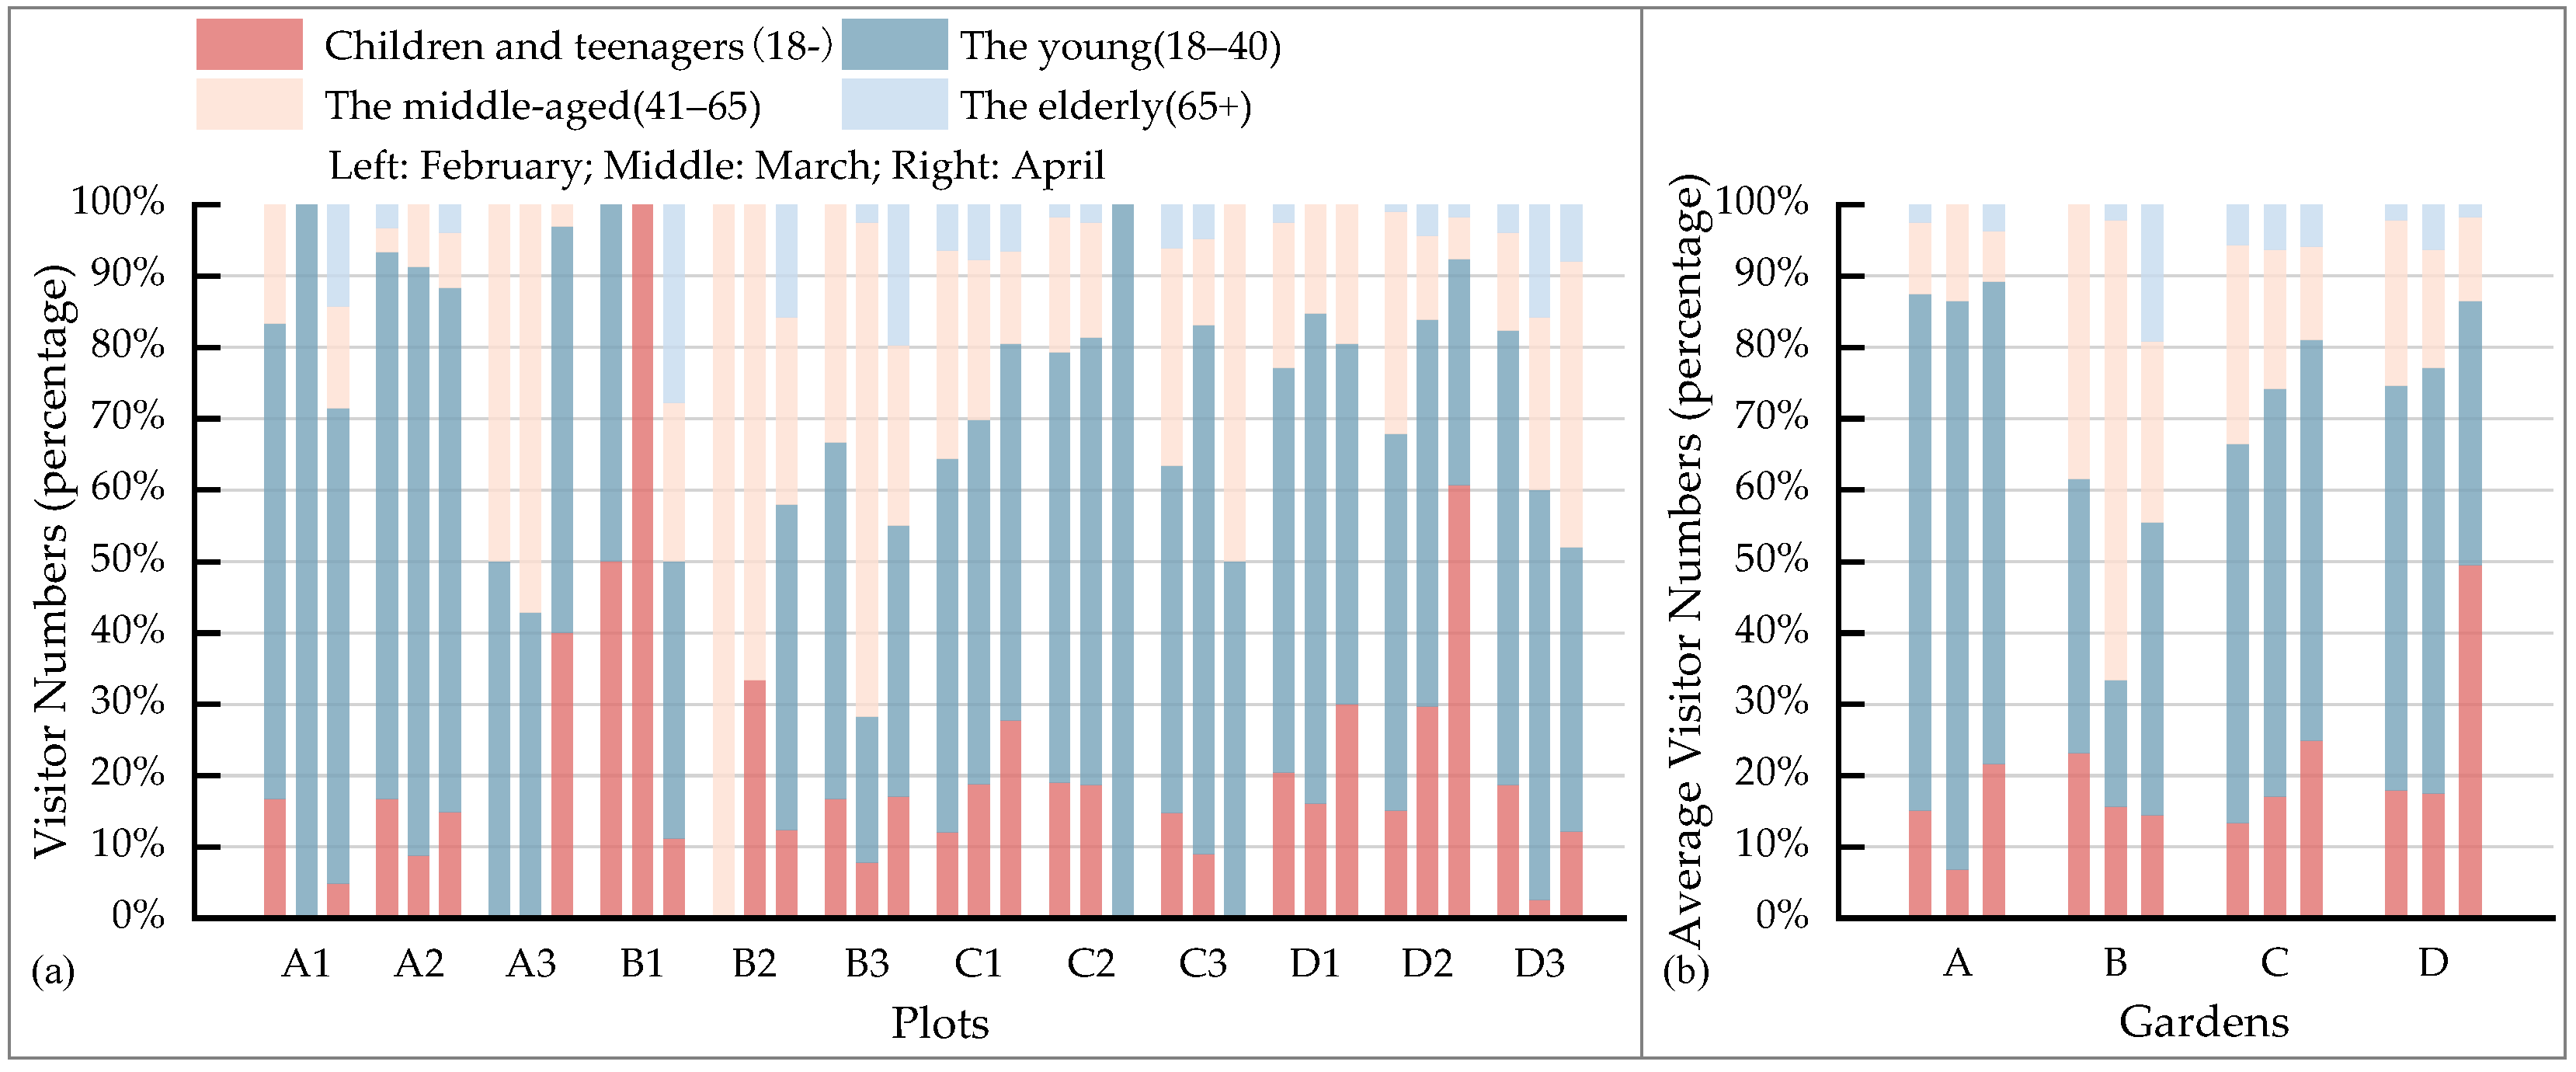
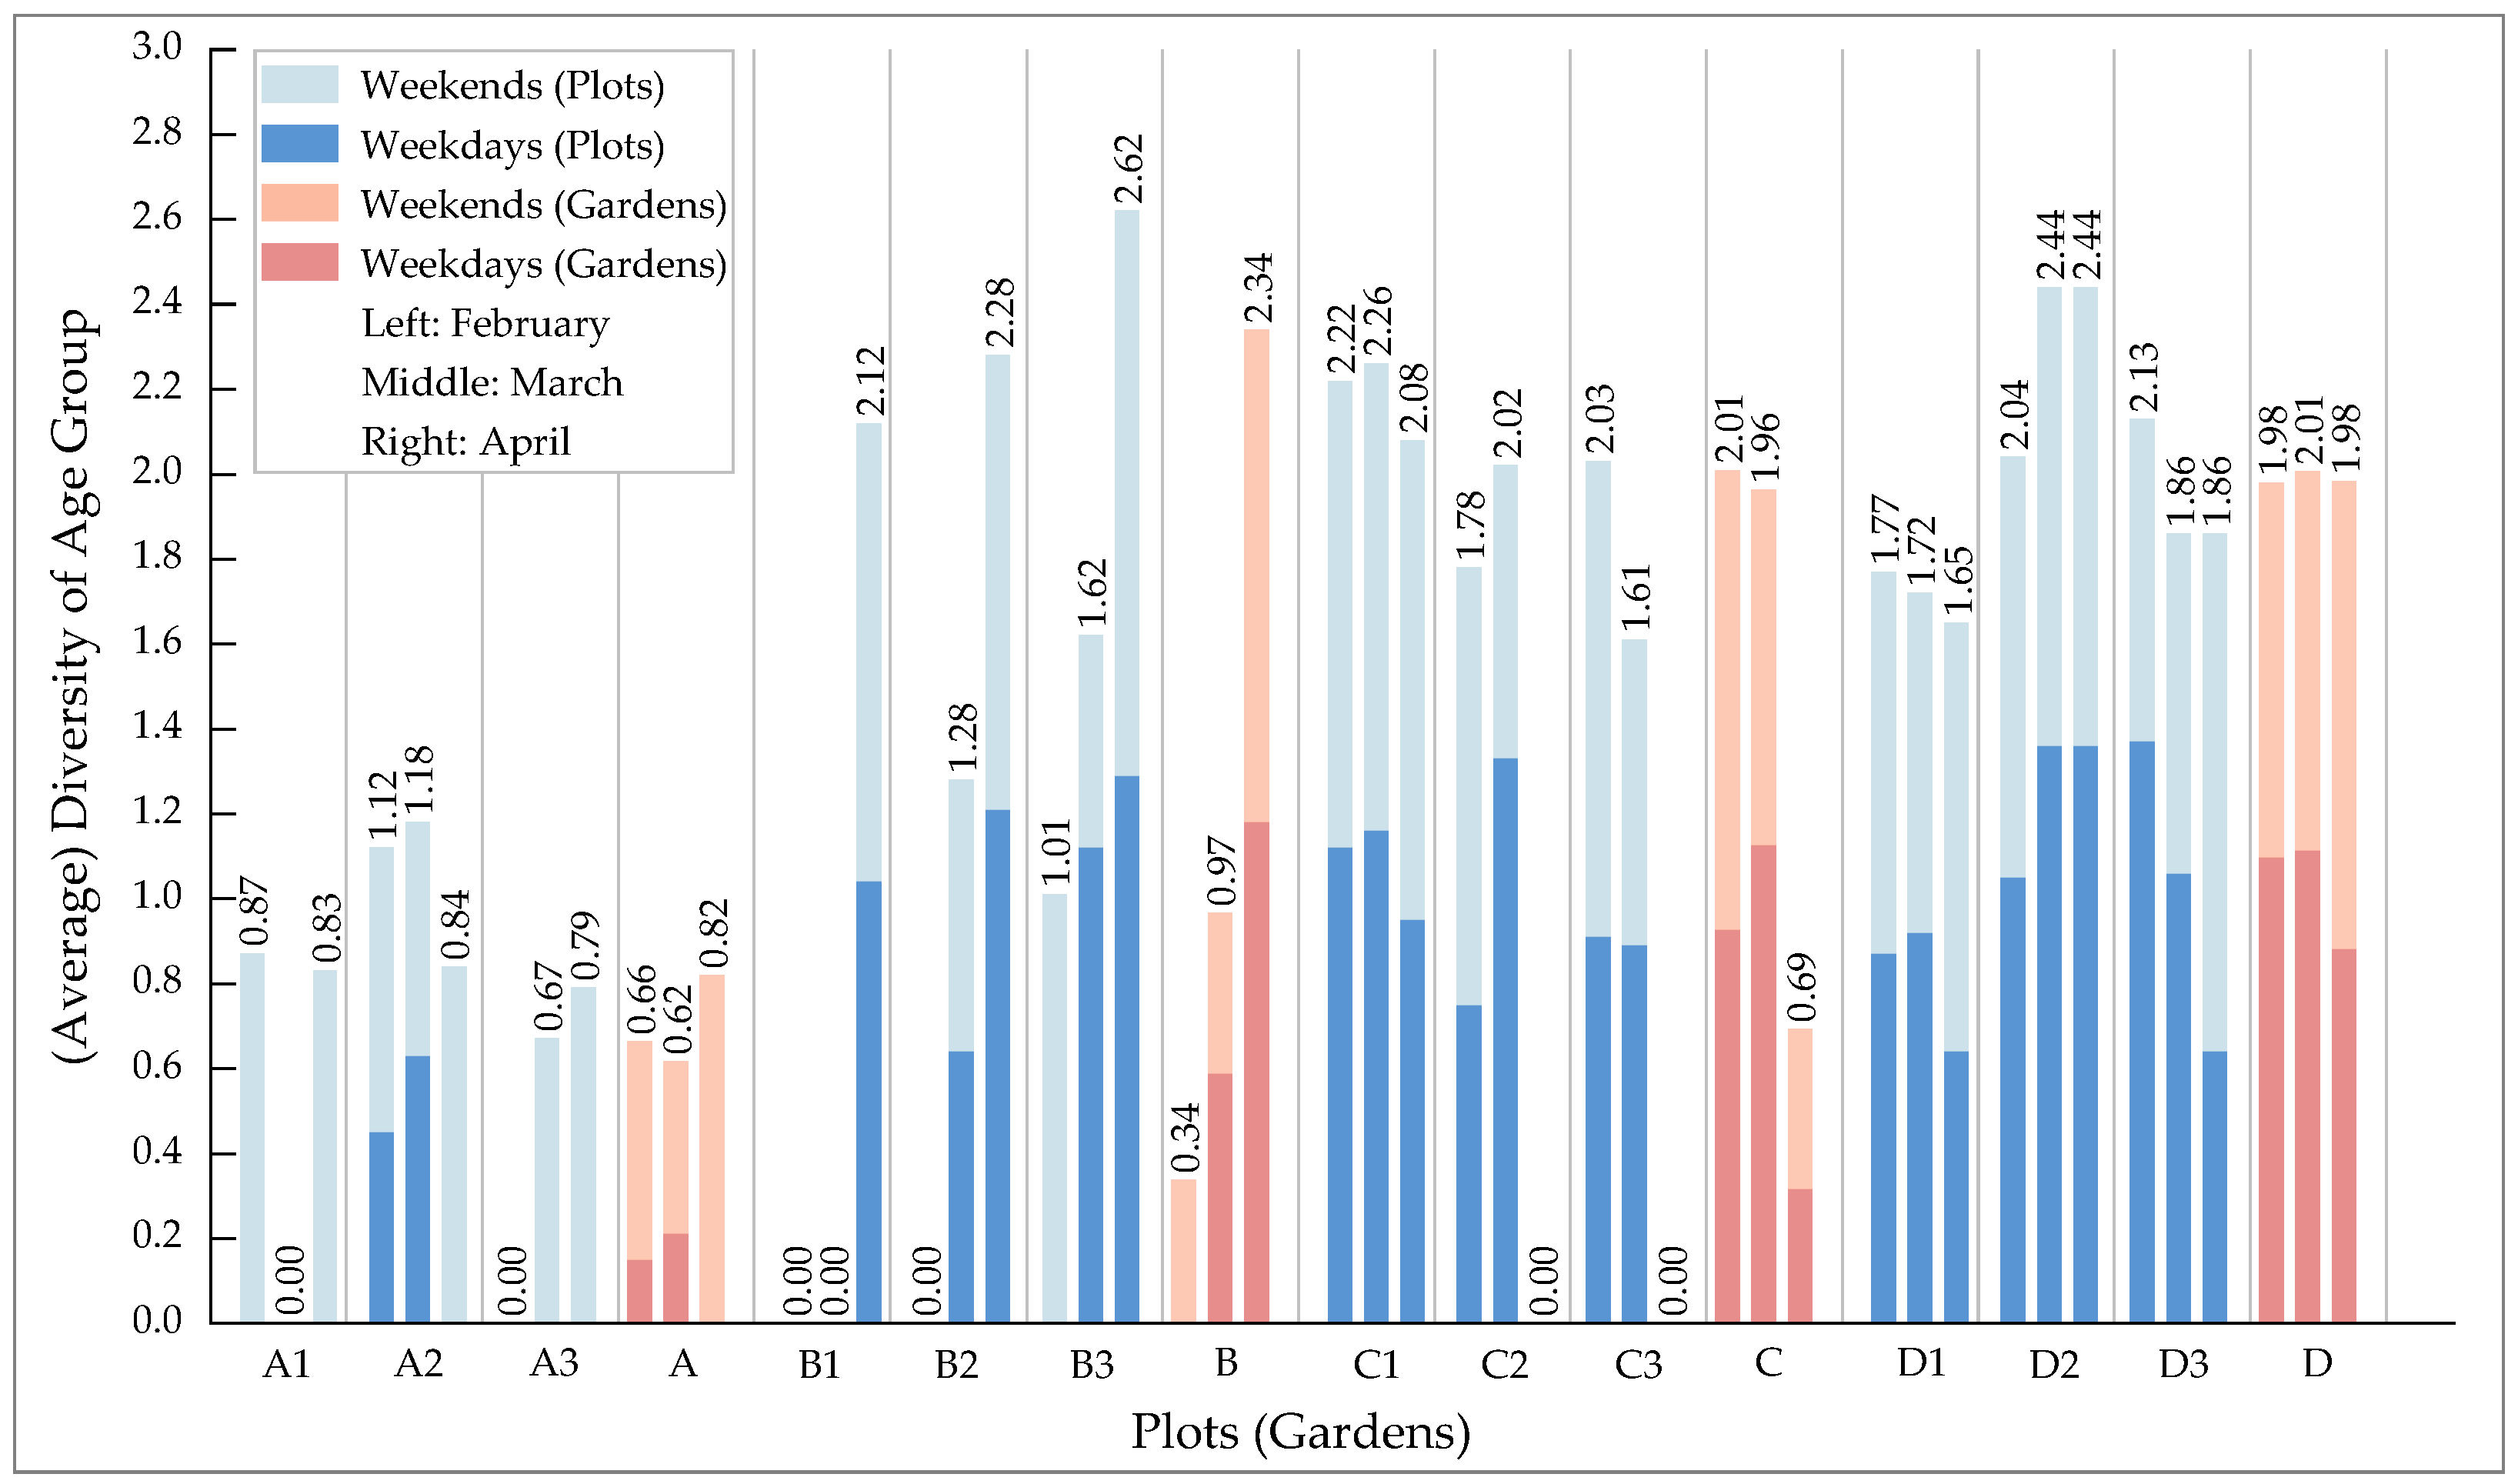
3.2.2. Distribution of Visitor Age Composition

Figure 6 illustrates the proportion of visitors in different age groups for each specialized garden and plot. Generally, in spring, the majority of visitors in specialized gardens are young and middle-aged individuals, accounting for over 65% of the total visitors. The next most prominent group is children and teenagers, constituting 5% to 25% of the total visitors, while the elderly make up around 2%. In April, Garden D exhibits a unique distribution in the age composition of visitors. Due to frequent spring activities, children and teenagers constitute over 50% of the total visitors, surpassing the number of young and middle-aged individuals. This is especially concentrated in Plot D2, where over 80% of Garden D’s total child visitors gather.
Figure 7 illustrates the temporal variations in the diversity of age groups for each specialized garden and plot. In February, Garden C exhibits the highest diversity of age composition. In March, Garden D shows the highest diversity, and in April, Garden B demonstrates the highest diversity. It is evident that the diversity of age groups for each specialized garden peaks during its main viewing period. This suggests that specialized gardens can cater to a broader range of age groups during these peak viewing periods, whereas during non-viewing periods, they are more favored by specific age groups of visitors.

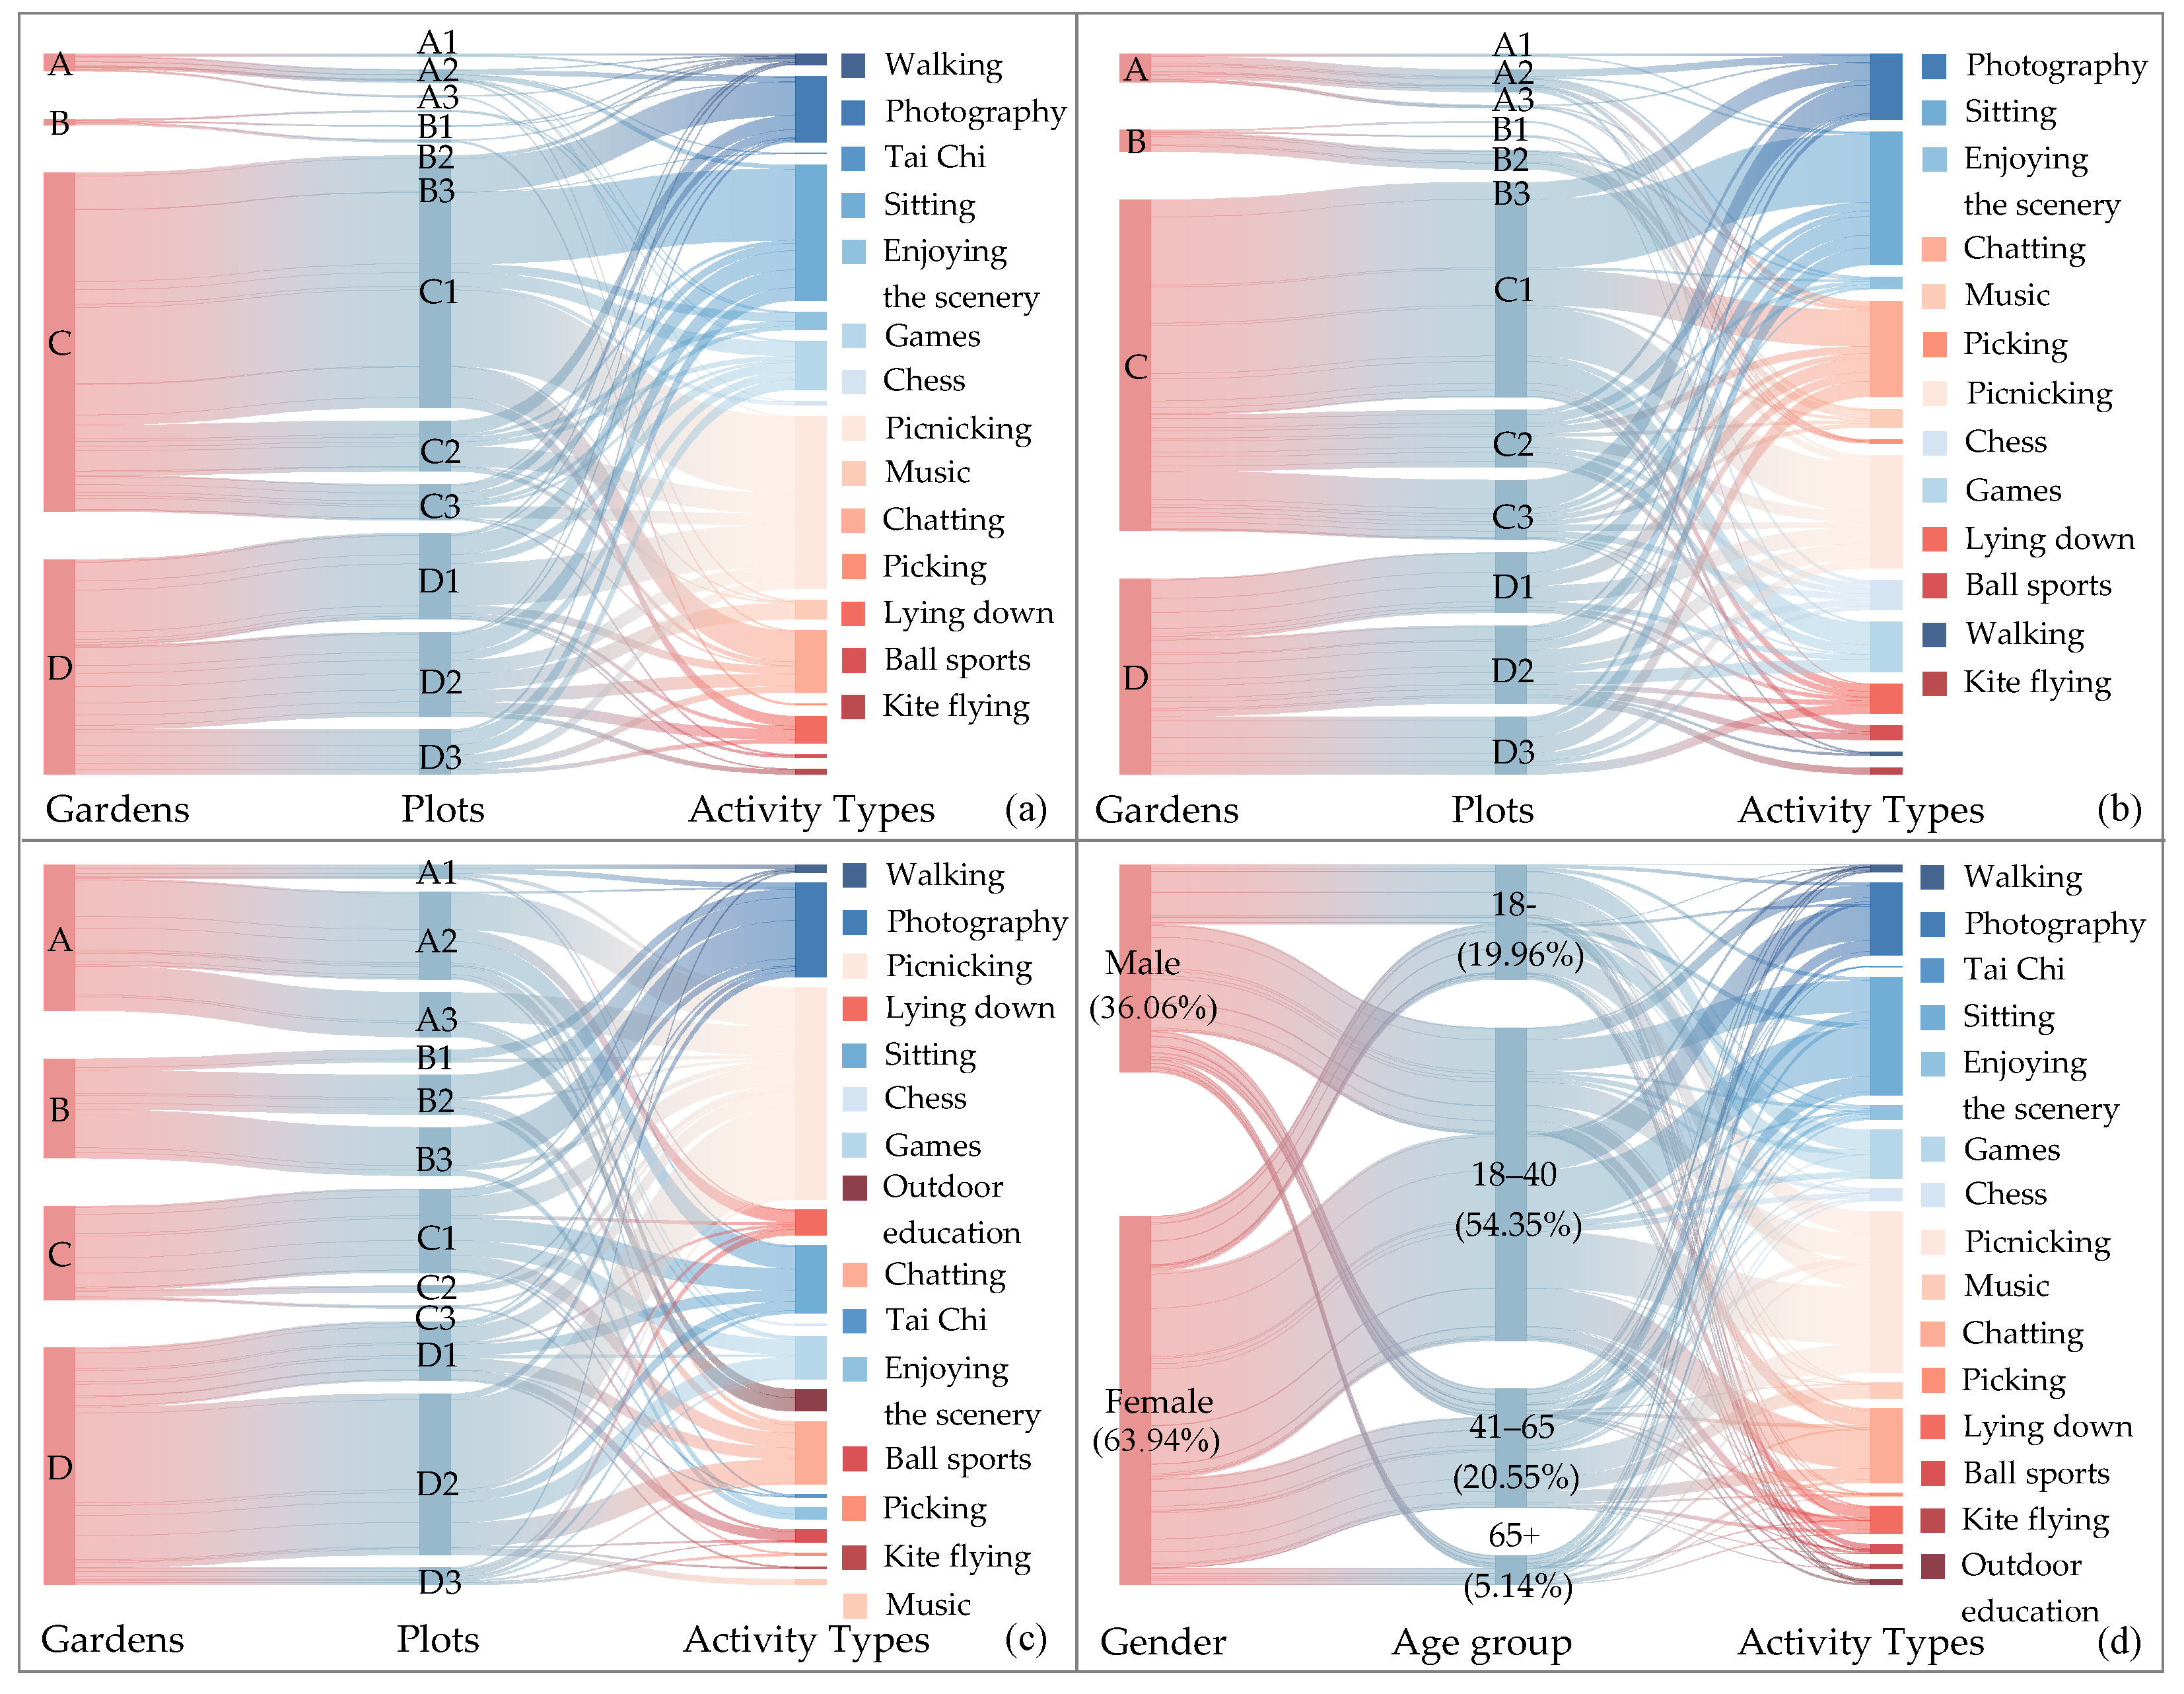
3.2.3. Distribution of Visitor Activity Types

Figure 8 presents the common activity types in specialized gardens during spring, along with the participation of visitors of different genders and age groups. Observing the common activity types in each specialized garden, visitors in Garden A predominantly gather around Plot A2, engaging primarily in activities such as sitting and picnicking. In Garden B, visitors are mostly concentrated around Plot B3, participating in activities like photography and scenic appreciation. Garden C attracts visitors mainly to Plot C1, where a diverse range of activities such as sitting, picnicking, chatting, and photography take place. Visitors to Garden D tend to concentrate around Plot D2, engaging in activities such as games, kite flying, and ball sports. The survey indicates that in specialized gardens during spring, female visitors aged 18–40 are the main visitors, engaging primarily in activities such as sitting, chatting, picnicking, and photography, falling under the categories of leisure and relaxation and sightseeing and touring.
Figure 9 illustrates the temporal variations in the richness of activity type for each specialized garden and plot. It is evident that the richness of activity type on weekends generally surpasses that on weekdays. In February and March, Garden C exhibits the highest richness of activity type, followed by Garden D, with Plot C1 and Plot D2 having the highest richness, exceeding that of Garden A and Garden B by more than twice. In April, Garden D attains the highest richness of activity type, with Plot D2 exhibiting the highest richness, while the other specialized gardens exhibit similar levels.

3.3. Spatiotemporal Distribution Characteristics of Spatial Vitality

3.3.1. Temporal Distribution Characteristics

The temporal distribution characteristics of spatial vitality of specialized garden plant landscapes during spring are primarily reflected in monthly variations. As indicated in Table 4, overall, spatial vitality is higher on weekends than on weekdays. Garden A and Garden B exhibit a monthly increasing trend in spatial vitality. Garden C experienced a slight increase in spatial vitality in March, followed by a sharp decline in April. Meanwhile, Garden D shows a decreasing trend in spatial vitality each month. In February and March, the spatial vitality rankings, from high to low, are Garden C (1.801; 1.845), Garden D (1.271; 1.416), Garden A (0.330; 0.482) and Garden B (0.177; 0.373). The spatial vitality of Garden C and Garden D is more than three times higher than that of Garden A and Garden B. In April, Garden D achieves the highest spatial vitality with an index of 1.048, a slight decrease from February to March. Following is Garden B, with a spatial vitality index of 0.796, more than four times higher than in February and over twice as much as in March. Garden C experiences a sharp decline in spatial vitality with an index of 0.561, slightly higher than Garden A.

3.3.2. Spatial Distribution Characteristics

During spring, there exists variation in spatial vitality across different specialized garden types and within the same garden type’s distinct landscape areas. Upon observing the Average Spatial Vitality Index ( S V ), it is evident that Garden C has the highest spatial vitality. Specifically, Plot C1 is identified as a high-vitality area, with an average spatial vitality index of 2.251, more than twice that of Plot C2 and Plot C3. Garden D followed closely, with Plot D2 recognized as a high-vitality area, boasting an average spatial vitality index of 1.495, higher than Plot D1 and Plot D3. Garden B demonstrates spatial vitality comparable to Garden A, with average spatial vitality indices for all sites being less than one and decreasing progressively from Plot B3 to Plot B1. Garden A exhibits the lowest spatial vitality, with Plot A2 registering an average spatial vitality index of 0.762, more than 2.5 times that of Plot A1 and Plot A3.

3.4. Analysis of Spatial Vitality Differences

In order to explore the difference of spatial vitality of specialized garden plant landscapes in spring, a one-way analysis of variance (ANOVA) was conducted. The results indicate significant differences in spatial vitality of specialized garden plant landscapes (Table 5). Post-hoc tests further revealed pronounced differences, particularly between Garden C and Garden A, as well as Garden B. Additionally, differences were observed between Garden D and Garden A, along with Garden B (Table 6). These findings suggest a potential connection between the distinct plant landscape space characteristics in each specialized garden and the distribution of spatial vitality. Further analysis is required to elucidate this relationship more comprehensively.

3.5. Correlation Analysis between Plant Landscape Characteristics and Spatial Vitality

Table 7 presents the results of the correlation analysis between 14 landscape variables and spatial vitality. The results indicate significant correlations between spring-specialized garden plant landscape spatial vitality and the ornamental period of specialized plants, characteristics of plant viewing, accessible lawn area, spatial accessibility, and spatial enclosure. Except for accessible lawn area, the correlation coefficients for other indicators with spatial vitality index are all higher than 0.7, suggesting a very close positive correlation. In other words, areas with prolonged specialized plant viewing periods, rich plant viewing characteristics, larger accessible lawn areas, greater distance from entrances, and more open and spacious landscape regions are more favored by visitors, resulting in higher spatial vitality. Additionally, the analysis results indicate that there is no significant correlation between indicators such as the proportion of specialized plants, color composition of specialized plants, plant growth potential, types of plant community structure, and canopy closure with spatial vitality. This suggests that the spatial vitality of each specialized garden and plot during the spring season is not influenced by the aforementioned factors.

4. Discussion

4.1. Spatiotemporal Distribution Characteristics of Spatial Vitality

During spring, there is a pronounced spatiotemporal fluctuation in the spatial vitality of specialized garden plant landscapes. Temporally, the spatial vitality of Osmanthus and Crape Myrtle Garden (A) and Acer and Rhododendron Garden (B) shows a monthly increasing trend. In contrast, the spatial vitality of Lingfeng Tanmei (C) experiences a slight initial rise followed by a rapid decline to approximately one-third of its initial level. The Rosaceae Garden (D) exhibits a monthly decreasing trend. Spatially, the spatial vitality ranks from high to low as follows: Lingfeng Tanmei, Rosaceae Garden, Acer and Rhododendron Garden, and Osmanthus and Crape Myrtle Garden. The regions with the highest spatial vitality are identified as Plot A2, Plot B3, Plot C1, and Plot D2, respectively.
The renowned tradition of appreciating plum blossoms, both in ancient and modern times, attracts a large number of visitors and promotes various activities. During this period, Lingfeng Tanmei exhibited the highest spatial vitality, with an overall enhancement observed in the spatial vitality of other specialized gardens. It can be inferred that seasonal flower exhibitions significantly captivate visitors, markedly elevating spatial vitality. Research indicates that incorporating a moderate amount of cold-toned flowering plants in urban greenery positively impacts the mental and physical health of the public [44]. Rahnema highlights that flowering plants influence visitors’ preferences and emotional perceptions [45]. Ozer also asserts that vibrant flowering plants significantly stimulate activities like photography and appreciation [46]. These findings align with the results of this study.
In comparison to Lingfeng Tanmei, the specialized plants in Rosaceae Garden fail to form a concentrated display during their flowering period. Additionally, some plants exhibit suboptimal maintenance, leading to underutilized spaces. However, the Rosaceae Garden secures the second-highest spatial vitality, likely attributed to its ample grassy areas that cater to recreational and exercise activities such as games, kite-flying, and sports, contributing substantially to spatial vitality enhancement. Previous research has confirmed the attractiveness of grassy spaces to individuals and groups, fulfilling diverse functional needs [47].
The lower level of Acer and Rhododendron Garden predominantly features Rhododendron species with rich, vibrant colors during the flowering period, attracting visitors for activities like photography and scenic appreciation. While there is an improvement in spatial vitality, it remains lower than that of Lingfeng Tanmei and Rosaceae Garden, possibly due to the shorter flowering period and comparatively lower promotional efforts. Therefore, a suggestion is to consider conducting extensive and content-rich flower-related promotional activities to prevent visitors from missing the optimal viewing period [11]. Osmanthus and Crape Myrtle Garden undergo minimal changes in its landscape during spring, maintaining the lowest and most stable spatial vitality.

4.2. Factors Associated with Spatial Vitality

In spring, there is a significant disparity in spatial vitality among different specialized gardens, indicating an evident uneven distribution of visitor traffic. This phenomenon is influenced by the inherent characteristics of the site [48,49]. The spatial vitality of each specialized garden reaches its peak during its primary viewing period, signifying the ability of these gardens to attract more visitors and stimulate various activities during this time. Mao et al.’s research underscores the importance of the flowering period of specialized plants as a critical determinant of visitor behavior, aligning with the findings of this study [11].
Additionally, visitors tend to engage in various activities in plant landscape spaces that offer rich viewing characteristics, ample access to lawns, greater distance from entrances, and more open and spacious environments, resulting in higher spatial vitality. Interestingly, indicators such as canopy closure, species richness, species diversity, and plant community structure show no correlation with spatial vitality. However, Wang et al.’s investigation into campus landscapes suggests that increasing vegetation coverage promotes recreational activities [50]. Shanahan et al.’s research indicates that species richness and diversity are crucial factors in attracting visitors to parks [51]. People also exhibit preferences for different types of vegetation in green spaces. For instance, compared to tree-shrub-grass composite woodland, individuals prefer single-layer woodland [52].
Furthermore, Ekkel et al.’s study demonstrates that accessibility is a significant factor in increasing the frequency of green space use, with usage decreasing as distance increases [53]. Research by Mao and Liu on the behavior preference of plant landscapes in urban parks suggests that plant landscape spaces with good accessibility are more conducive to visitor participation [25]. However, in contrast to these conclusions, our study indicates that, compared to urban park plant landscapes, visitors place more emphasis on the aesthetic and functional characteristics of specialized plant landscapes rather than accessibility.

4.3. Improvement Strategies for Specialized Garden Plant Landscape Construction

Based on the age composition and activity distribution of visitors in specialized gardens and plots during spring, it is advisable to consider the activity needs of different age groups when planning and designing plant landscapes in specialized gardens. For instance, in the spring, the predominant visitors in specialized garden plant landscape spaces are females aged 18–40, engaging primarily in activities such as sitting, picnicking, and photography. Therefore, designers should allocate suitable spaces for lingering, such as shaded areas and lawns, and guide visitors’ sightlines through diverse plant arrangements to facilitate better relaxation and scenic enjoyment. Furthermore, considering that children often engage in games, kite-flying, and ball sports, increasing the area of lawns may be beneficial. Additionally, recognizing that the elderly often participate in activities such as Tai Chi and sitting, providing relatively private and quiet spaces for them is recommended.
Significant differences exist in spatial vitality among different specialized gardens and within different landscape areas of the same specialized garden when examining the spatiotemporal distribution characteristics of spatial vitality of specialized garden plant landscapes during spring. It is recommended that the construction of specialized gardens consider factors such as geographical location, historical and cultural features, and visitor interests and needs to maximize the utilization of underutilized spaces and comprehensively enhance spatial vitality. This approach helps avoid low-level redundant construction, which could lead to the wastage of plant and spatial resources. In the case of large-scale botanical gardens with multiple specialized gardens like the Hangzhou Botanical Garden, efforts should be directed not only at enhancing the vitality of individual specialized gardens but also at addressing the connections between these gardens.
Considering the factors related to the spatial vitality of specialized garden plant landscapes during spring, it is crucial for the planning and design of specialized garden plant landscapes to account for seasonal influences. It is essential to allocate and seamlessly connect plants based on their viewing periods, creating specialized garden plant landscapes with distinctive features and personalities while providing year-round attractions. Additionally, the cultivation of plants with rich ornamental characteristics can attract visitor attention and extend the viewing period of the plant landscape. Grassland spaces can fulfill various functional needs of visitors; therefore, expanding accessible lawn areas may be practical. The accessibility and enclosure of plant landscape spaces also influence visitor behavior and distribution. Therefore, careful consideration of these factors is essential in the planning and design of specialized plant landscapes. For specialized gardens with overlapping viewing periods but significant differences in spatial vitality, strategies such as organizing flower exhibitions and promoting floral events can attract visitors, guide the flow of people, and foster a comprehensive and balanced improvement of spatial vitality throughout the entire garden.

4.4. Limitations

This study has certain limitations. Firstly, the selected indicators for specialized garden plant landscape spaces are primarily based on existing research on urban park plant landscape spatial vitality, and further adjustments and refinements are needed to explore potential factors specific to specialized garden plant landscape spatial vitality. Secondly, despite the detailed information on individual social attributes, distribution, and behavior obtained through traditional behavior observation methods, they are relatively time and labor-intensive. The investigation into the relationship between plant landscape space characteristics and spatial vitality is limited to correlation without further exploration of other potential relationships between the two. Finally, seasonal variation is a crucial aspect of plant landscape research, and the spatial dynamics formed during this period can undergo significant changes in the short term. The study did not investigate spatial vitality in other seasons, and the limitations of focusing on a single season may result in non-significant outcomes for certain indicators, which nevertheless still hold value for discussion.

5. Conclusions

With the vigorous development of specialized garden landscaping forms in urban green spaces, the importance of creating specialized plant landscapes is increasing. Based on the behavior characteristics of visitors, this study investigated the measurement and spatiotemporal distribution patterns of spatial vitality of specialized garden plant landscapes during spring and explored the associated landscape variables. The primary findings are as follows:
  • The findings reveal a hierarchy of spatial vitality, with the order being Lingfeng Tanmei, Rosaceae Garden, Acer and Rhododendron Garden, and Osmanthus and Crape Myrtle Garden. The spatial vitality of Lingfeng Tanmei experiences a slight increase in the mid-term, followed by a sharp decline. Rosaceae Garden exhibits a monthly decreasing trend in spatial vitality, whereas both Acer and Rhododendron Garden and Osmanthus and Crape Myrtle Garden demonstrate a monthly increasing trend.
  • The ornamental period of specialized plants stands out as a pivotal determinant of spatial vitality. Additionally, features such as characteristics of plant viewing, accessible grassland area, spatial accessibility, and enclosure are associated with the spatiotemporal distribution of spatial vitality.
  • The seasonal flower exhibitions and floral event promotions have a significant allure for visitors and concurrently contribute to enhancing the spatial vitality of other specialized gardens.
In future research, exploration and improvement can be undertaken in the following aspects. Regarding indicator selection, consideration could be given to incorporating additional indicators related to plant landscape space characteristics, such as the olfactory features [54], acoustic characteristics [55], and thermal comfort [52]. In terms of method selection, insights from studies on street and urban park spatial vitality can be leveraged to identify other suitable quantifiable vitality indicators. Additionally, exploring the utilization of diverse data sources and investigating more convenient methods for data acquisition and analysis is essential [56,57]. The integration of on-site observations with multiple data sources should be further explored and refined, particularly when applied to the study of small-scale spatial vitality. Finally, given the significant impact of seasonal variations on plant landscape spatial vitality, conducting long-term field observations of visitor behavior in specialized garden plant landscape spaces across different seasons would be beneficial. This approach allows for a comprehensive analysis of the distribution patterns and fluctuation trends of spatial vitality across various time dimensions and spatial scales.
In comparison to existing studies on the vitality of urban public spaces, this research explores the distribution of vitality and related factors in small-scale spaces, specifically focusing on plant landscape spaces. It emphasizes the significance of visitor engagement in enhancing vitality. We believe these findings can assist planners and managers in constructing specialized plant landscapes that align with the preferences and needs of visitors.

Author Contributions

Conceptualization, T.L. and R.W.; methodology, T.L.; software, T.L.; validation, B.M., H.Y., and R.W.; formal analysis, T.L.; investigation, T.L. and S.W.; resources, Z.B.; data curation, T.L.; writing—original draft preparation, T.L.; writing—review and editing, B.M., H.Y., and R.W.; visualization, T.L.; supervision, R.W.; project administration, Z.B.; funding acquisition, R.W. All authors have read and agreed to the published version of the manuscript.

Funding

This research was funded by the Humanities and Social Science Fund of Ministry of Education of the People’s Republic of China (No. 21YJC770026).

Data Availability Statement

Data are contained within the article.

Acknowledgments

We sincerely thank the editor and anonymous reviewers for their constructive comments and suggestions.

Conflicts of Interest

Bingyi Mi was employed by the Huayong Engineering Design Group Co., Ltd. The remaining authors declare that the research was conducted in the absence of any commercial or financial relationships that could be construed as a potential conflict of interest.

References

  1. Chen, G.; Sun, W. The role of botanical gardens in scientific research, conservation, and citizen science. Plant Divers. 2018, 40, 181–188. [Google Scholar] [CrossRef]
  2. Dunn, C.P. Biological and cultural diversity in the context of botanic garden conservation strategies. Plant Divers. 2017, 39, 396–401. [Google Scholar] [CrossRef] [PubMed]
  3. Heywood, V.H. The future of plant conservation and the role of botanic gardens. Plant Divers. 2017, 39, 309–313. [Google Scholar] [CrossRef] [PubMed]
  4. Zhang, Y.; Tang, Y.; Yu, Q.; Bao, Z. Development Prospect of Local Botanical Gardens Under the Background of the Construction of China’s National Botanical Garden System: A Case Study of Hangzhou Botanical Garden. Landsc. Archit. 2023, 30, 52–56. [Google Scholar]
  5. Hu, Y. The Status and Function of Theme Garden in Botanical Garden and its Inspiration for Arrangement of Theme Garden for Chenshan Botanical Garden, Shanghai. Chin. Landsc. Archit. 2006, 7, 24–31. [Google Scholar]
  6. Zhu, J.; Yuan, L.; Chen, Y.; Liu, H. Discussion on several contents in design of Specified Plant Gardens Design Code. J. Cent. China Norm. Univ. (Nat. Sci.) 2022, 56, 635–640. [Google Scholar]
  7. Hu, L.; Gu, L.; Zhao, Y.; Chen, T. Research on the Establishment of Open-field Special Gardens in Urban Construction SystemBotanical Gardens—Taking Shaoxing Botanical Garden as an Example. Chin. Landsc. Archit. 2022, 38, 39–44. [Google Scholar]
  8. Rao, X.; Huang, R.; Shi, Y.; Wu, R.; Bao, Z. Condense Regional Characteristics and Construct the Forest on Water—Analysis of the Planning and Design and Construction of Wet Woody Plants Specialized Garden in Ningbo Botanical Garden. Chin. Landsc. Archit. 2020, 36, 116–121. [Google Scholar]
  9. Zhang, Y.; Liao, J.; Zhang, R.; Ning, Z. The Planning and Design of the Specialized Garden for Vine Plants in South China Botanical Garden. Chin. Landsc. Archit. 2020, 36, 92–97. [Google Scholar]
  10. Devkota, H.P.; Watanabe, M. Role of medicinal plant gardens in pharmaceutical science education and research: An overview of medicinal plant garden at Kumamoto University, Japan. J. Asian Assoc. Sch. Pharm. 2020, 9, 44–52. [Google Scholar]
  11. Mao, Y.; Chen, Y.; Wang, M. Behavioral Preference of Visitors on Special Categorized Plant Landscape. Chin. Landsc. Archit. 2021, 37, 121–126. [Google Scholar]
  12. Xu, X.; Xu, X.; Guan, P.; Ren, Y.; Wang, W.; Xu, N. The Cause and Evolution of Urban Street Vitality under the Time Dimension: Nine Cases of Streets in Nanjing City, China. Sustainability 2018, 10, 2797. [Google Scholar] [CrossRef]
  13. Jalaladdini, S.; Oktay, D. Urban Public Spaces and Vitality: A Socio-Spatial Analysis in the Streets of Cypriot Towns. Procedia—Soc. Behav. Sci. 2012, 35, 664–674. [Google Scholar] [CrossRef]
  14. Liu, S.; Zhang, L.; Long, Y.; Long, Y.; Xu, M. A New Urban Vitality Analysis and Evaluation Framework Based on Human Activity Modeling Using Multi-Source Big Data. ISPRS Int. J. Geo-Inf. 2020, 9, 617. [Google Scholar] [CrossRef]
  15. Zhai, Y.; Li, D.; Wu, C.; Wu, H. Spatial distribution, activity zone preference, and activity intensity of senior park users in a metropolitan area. Urban For. Urban Green. 2023, 79, 127761. [Google Scholar] [CrossRef]
  16. Liu, W.; Chen, W.; Dong, C. Spatial decay of recreational services of urban parks: Characteristics and influencing factors. Urban For. Urban Green. 2017, 25, 130–138. [Google Scholar] [CrossRef]
  17. Zhu, J.; Lu, H.; Zheng, T.; Rong, Y.; Wang, C.; Zhang, W.; Yan, Y.; Tang, L. Vitality of Urban Parks and Its Influencing Factors from the Perspective of Recreational Service Supply, Demand, and Spatial Links. Int. J. Environ. Res. Public Health 2020, 17, 1615. [Google Scholar] [CrossRef]
  18. Mao, Z.; Chen, X.; Xiang, Z. Research on the Measurement and Influencing Factors of Street Vigour in Historic Districts: A Case Study of Wenming Street Historic District in Kunming. South Archit. 2021, 4, 54–61. [Google Scholar]
  19. Li, Q.; Cui, C.; Liu, F.; Wu, Q.; Run, Y.; Han, Z. Multidimensional Urban Vitality on Streets: Spatial Patterns and Influence Factor Identification Using Multisource Urban Data. ISPRS Int. J. Geo-Inf. 2022, 11, 2. [Google Scholar] [CrossRef]
  20. Han, J.; Li, L.; Qiu, B.; Shen, H.; Peng, K. The Vitality of Night Market Space Based on Spatial Data and Influencing Factors: A Case Study Based on the Old City of Nanjing. South Archit. 2021, 6, 68–75. [Google Scholar]
  21. Xu, Y.; Chen, X. Quantitative analysis of spatial vitality and spatial characteristics of urban underground space (UUS) in metro area. Tunn. Undergr. Space Technol. 2021, 111, 103875. [Google Scholar] [CrossRef]
  22. Yao, W.; Yun, J.; Zhang, Y.; Meng, T.; Mu, Z. Usage behavior and health benefit perception of youth in urban parks: A case study from Qingdao, China. Front. Public Health 2022, 10, 923671. [Google Scholar] [CrossRef] [PubMed]
  23. Liu, R.; Xu, X.; Chen, L. Investigation of Plant Landscape Space in Urban Park Based on Users’ Behavior—The Case Study of Shenzhen Bay Park. Chin. Landsc. Archit. 2019, 35, 123–128. [Google Scholar]
  24. Liu, R.; Xu, X. Space Vitality and Environmental Impact of Plant Landscape in Urban Parks. Chin. Landsc. Archit. 2018, 34, 160–164. [Google Scholar]
  25. Mao, Y.; Zou, Y.; Zheng, Y.; Wang, M. Research on Visitors’ Preferences for Plant Landscape Spaces in Ulanqab. Chin. Landsc. Archit. 2022, 38, 123–128. [Google Scholar]
  26. Riungu, G.K.; Peterson, B.A.; Beeco, J.A.; Brown, G. Understanding visitors’ spatial behavior: A review of spatial applications in parks. Tour. Geogr. 2018, 20, 833–857. [Google Scholar] [CrossRef]
  27. Komossa, F.; Wartmann, F.M.; Kienast, F.; Verburg, P H. Comparing outdoor recreation preferences in peri-urban landscapes using different data gathering methods. Landsc. Urban Plan. 2020, 199, 103796. [Google Scholar] [CrossRef]
  28. Zhai, Y.; Li, K.; Liu, J. A Conceptual Guideline to Age-Friendly Outdoor Space Development in China: How Do Chinese Seniors Use the Urban Comprehensive Park? A Focus on Time, Place, and Activities. Sustainability 2018, 10, 3678. [Google Scholar] [CrossRef]
  29. Lv, G.; Zheng, S.; Hu, W. Exploring the relationship between the built environment and block vitality based on multisource big data: An analysis in Shenzhen, China. Geomat. Nat. Hazards Risk 2022, 13, 1593–1613. [Google Scholar] [CrossRef]
  30. Do, D.T.; Cheng, Y.; Shojai, A.; Chen, Y. Public park behaviour in Da Nang: An investigation into how open space is used. Front. Archit. Res. 2019, 8, 454–470. [Google Scholar] [CrossRef]
  31. Korpilo, S.; Virtanen, T.; Saukkonen, T.; Lehvävirta, S. More than A to B: Understanding and managing visitor spatial behaviour in urban forests using public participation GIS. J. Environ. Manag. 2018, 207, 124–133. [Google Scholar] [CrossRef] [PubMed]
  32. Chen, T.; Hui, E.C.M.; Wu, J.; Lang, W.; Li, X. Identifying urban spatial structure and urban vibrancy in highly dense cities using georeferenced social media data. Habitat Int. 2019, 89, 102005. [Google Scholar] [CrossRef]
  33. Guan, C.; Song, J.; Keith, M.; Zhang, B.; Akiyama, Y.; Da, L.; Shibasaki, R.; Sato, T. Seasonal variations of park visitor volume and park service area in Tokyo: A mixed-method approach combining big data and field observations. Urban For. Urban Green. 2021, 58, 126973. [Google Scholar] [CrossRef]
  34. Zhang, S.; Zhou, W. Recreational visits to urban parks and factors affecting park visits: Evidence from geotagged social media data. Landsc. Urban Plan. 2018, 180, 27–35. [Google Scholar] [CrossRef]
  35. Zhang, A.; Li, W.; Wu, J.; Lin, J.; Chu, J.; Xia, C. How can the urban landscape affect urban vitality at the street block level? A case study of 15 metropolises in China. Environ. Plan. B Urban Anal. City Sci. 2021, 48, 1245–1262. [Google Scholar] [CrossRef]
  36. Xia, C.; Yeh, A.G.; Zhang, A. Analyzing spatial relationships between urban land use intensity and urban vitality at street block level: A case study of five Chinese megacities. Landsc. Urban Plan. 2020, 193, 103669. [Google Scholar] [CrossRef]
  37. Wang, R.; Zhao, J. Demographic groups’ differences in visual preference for vegetated landscapes in urban green space. Sustain. Cities Soc. 2017, 28, 350–357. [Google Scholar] [CrossRef]
  38. Wang, X.; Wu, C. An Observational Study of Park Attributes and Physical Activity in Neighborhood Parks of Shanghai, China. Int. J. Environ. Res. Public Health 2020, 17, 2080. [Google Scholar] [CrossRef]
  39. Nazemi Rafi, Z.; Kazemi, F.; Tehranifar, A. Public preferences toward water-wise landscape design in a summer season. Urban For. Urban Green. 2020, 48, 126563. [Google Scholar] [CrossRef]
  40. Wang, X.; Rodiek, S. Older Adults’Preference for Landscape Features Along Urban Park Walkways in Nanjing, China. Int. J. Environ. Res. Public Health 2019, 16, 3808. [Google Scholar] [CrossRef]
  41. Schirpke, U.; Tappeiner, G.; Tasser, E.; Tappeiner, U. Using conjoint analysis to gain deeper insights into aesthetic landscape preferences. Ecol. Indic. 2019, 96, 202–212. [Google Scholar] [CrossRef]
  42. Zeng, Z.; Wang, Y.; Peng, H. Research on Tourist Recreation Behavior Based on SOPARC and KDE—Taking Wuhan East Lake Greenway as an Example. Chin. Landsc. Archit. 2019, 35, 58–62. [Google Scholar]
  43. Mu, B.; Liu, C.; Mu, T.; Xu, X.; Tian, G.; Zhang, Y.; Kim, G. Spatiotemporal fluctuations in urban park spatial vitality determined by on-site observation and behavior mapping: A case study of three parks in Zhengzhou City, China. Urban For. Urban Green. 2021, 64, 127246. [Google Scholar] [CrossRef]
  44. Zhuang, J.; Qiao, L.; Zhang, X.; Su, Y.; Xia, Y. Effects of Visual Attributes of Flower Borders in Urban Vegetation Landscapes on Aesthetic Preference and Emotional Perception. Int. J. Environ. Res. Public Health 2021, 18, 9318. [Google Scholar] [CrossRef]
  45. Rahnema, S.; Sedaghathoor, S.; Allahyari, M.S.; Damalas, C.A.; Bilali, H.E. Preferences and emotion perceptions of ornamental plant species for green space designing among urban park users in Iran. Urban For. Urban Green. 2019, 39, 98–108. [Google Scholar] [CrossRef]
  46. Ozer, B.; Baris, M.E. Landscape Design and Park Users’ Preferences. Procedia—Soc. Behav. Sci. 2013, 82, 604–607. [Google Scholar] [CrossRef]
  47. Goličnik, B.; Ward Thompson, C. Emerging relationships between design and use of urban park spaces. Landsc. Urban Plan. 2010, 94, 38–53. [Google Scholar] [CrossRef]
  48. Zhai, Y.; Baran, P.K. Urban park pathway design characteristics and senior walking behavior. Urban For. Urban Green. 2017, 21, 60–73. [Google Scholar] [CrossRef]
  49. Chuang, I.; Benita, F.; Tunçer, B. Effects of urban park spatial characteristics on visitor density and diversity: A geolocated social media approach. Landsc. Urban Plan. 2022, 226, 104514. [Google Scholar] [CrossRef]
  50. Wang, R.; Jiang, W.; Lu, T. Landscape characteristics of university campus in relation to aesthetic quality and recreational preference. Urban For. Urban Green. 2021, 66, 127389. [Google Scholar] [CrossRef]
  51. Shanahan, D.F.; Lin, B.B.; Gaston, K.J.; Bush, R.; Fuller, R.A. Erratum to: What is the role of trees and remnant vegetation in attracting people to urban parks? Landsc. Ecol. 2015, 30, 761–762. [Google Scholar] [CrossRef]
  52. Duan, Y.; Li, S. Study of Different Vegetation Types in Green Space Landscape Preference: Comparison of Environmental Perception in Winter and Summer. Sustainability 2022, 14, 3906. [Google Scholar] [CrossRef]
  53. Ekkel, E.D.; de Vries, S. Nearby green space and human health: Evaluating accessibility metrics. Landsc. Urban Plan. 2017, 157, 214–220. [Google Scholar] [CrossRef]
  54. Pálsdóttir, A.M.; Spendrup, S.; Mårtensson, L.; Wendin, K.; Food, A.M.I.E.; Department, O.F.A.M.; Högskolan, K.; Kristianstad, U.; Man, A.B.H.M.; Avdelningen, F.M.O.M.; et al. Garden Smellscape–Experiences of Plant Scents in a Nature-Based Intervention. Front. Psychol. 2021, 12, 667957. [Google Scholar] [CrossRef]
  55. Song, X.; Lv, X.; Yu, D.; Wu, Q. Spatial-temporal change analysis of plant soundscapes and their design methods. Urban For. Urban Green. 2018, 29, 96–105. [Google Scholar] [CrossRef]
  56. Marquet, O.; Aaron Hipp, J.; Alberico, C.; Huang, J.; Fry, D.; Mazak, E.; Lovasi, G.S.; Floyd, M.F. Park use preferences and physical activity among ethnic minority children in low-income neighborhoods in New York City. Urban For. Urban Green. 2019, 38, 346–353. [Google Scholar] [CrossRef]
  57. Yue, W.; Chen, Y.; Zhang, Q.; Liu, Y. Spatial Explicit Assessment of Urban Vitality Using Multi-Source Data: A Case of Shanghai, China. Sustainability 2019, 11, 638. [Google Scholar] [CrossRef]
Figure 1. Geographical location of Hangzhou Botanical Garden.
Forests 15 00208 g001
Figure 2. Plan and plot distribution of Hangzhou Botanical Garden.
Forests 15 00208 g002
Figure 3. Photographs of the plots with the highest spatial vitality in each garden.
Forests 15 00208 g003
Figure 4. Temporal changes in visitor numbers. (a) Visitor numbers of plots; (b) Visitor numbers of gardens.
Forests 15 00208 g004
Figure 5. Temporal changes of visitor density and space use intensity. (a) The indicators of plots; (b) The indicators of gardens.
Forests 15 00208 g005
Figure 6. Number of visitors of different age groups. (a) Number of visitors of different age groups in plots; (b) Number of visitors of different age groups in gardens.
Forests 15 00208 g006
Figure 7. Diversity of age groups.
Forests 15 00208 g007
Figure 8. Distribution of activity types. (a) Common activity types of gardens and plots in February; (b) Common activity types of gardens and plots in March; (c) Common activity types of gardens and plots in April; (d) Activity participation of visitors of different genders and ages in spring.
Forests 15 00208 g008
Figure 9. Richness of activity type. (a) Richness of activity type of plots; (b) Richness of activity type of gardens.
Forests 15 00208 g009
Table 1. Spatial characteristics of plant landscape of specialized gardens.
Types of IndicatorsNumberIndicatorsConcepts and Quantification Methods of Indicators
Plant
Factors
Specialized plant landscape featuresX1Proportion of specialized plantsThe number of specialized plant species as a percentage of total species. To survey the species of specialized plants and other plants and calculate the percentage.
X2Ornamental period
of specialized plants
Investigating the main flowering periods of specialized plants on a monthly basis.
X3Color composition
of specialized plants
Investigating the richness of color composition of specialized plants and assigning values based on the number of colors.
Plant monomer characteristicsX4Plant growth potentialJudging the health status of plant growth and assigning values as 1, 2, 3, and 4 according to the four criteria of poor, medium, good, and excellent.
X5Characteristics of plant viewingInvestigating the ornamental characteristics of plants and assigning values of 1, 2, 3, and 4 based on the number of ornamental parts.
Plant community characteristicsX6Types of plant community structureInvestigating the life form composition of plant communities and assigning values of 3, 2, and 1 based on the tree-shrub-herb, tree-herb, and tree-shrub structures, respectively.
X7Canopy closureThe ratio of the total ground projection area of the tree crown in direct sunlight to the total plot area is calculated using AutoCAD.
X8Species richnessThe number of species in the plant community. Using the Patrick index to calculate, the formula is R = S , where S is the number of species. Due to the difference in plot area, it needs to be converted using the formula T S R = R / l g A , where A is the plot area.
X9Species diversityThe richness of species in the plant community. Using the Shannon−Wiener index to calculate, the formula is H = i = 1 n P i l n p i , where Pi is the ratio of the quantity of each species to the total number of species in the plot. Due to the difference in plot area, it needs to be converted using the formula T S H = H / l g A , where A is the plot area.
Spatial FactorsPlane surfaceX10Gross areaDrawing the plot outline by combining the two-step APP and the plan, then using AutoCAD for calculations.
X11accessible lawn areaDrawing the contour of the accessible grassland area within the plot by combining the two-step APP and the plan, then using AutoCAD for calculations.
AccessibilityX12Spatial accessibilityDetermining the nearest pathway to the entrance/exit by combining the two-step APP and the plan, then using AutoCAD for calculations.
Functional use and psychological feelingsX13spatial enclosureDegree of openness and enclosure in space is calculated using D/H, where D is the distance between people and plants, and H is the plant height.
X14Spatial shape coefficientDegree of richness in space variation is calculated using the ratio of plot perimeter to the circumference of an equally sized circle, with the formula S = C / π A 2 , where C is the plot perimeter and A is the plot area.
Table 2. Weight values of 4 indicators to measure spatial vitality.
IndexEntropy MethodCRITIC Weighting MethodComprehensive Weights
Visitor Density0.3780.1510.271
Space Usage Intensity0.3080.1470.215
Diversity of Age Group0.1460.4410.306
Richness of Activity Type0.1680.2610.208
Table 3. Spatial characteristic indicators for plant landscapes in specialized gardens and plots.
GardenPlotPlant Landscape Space Characteristics
X1X2X3X4X5X6X7X8X9X10
(m2)
X11
(m2)
X12
(m)
X13X14
AA10.67 0.00 1.00 3.00 2.00 3.00 0.07 0.82 0.21 4747.02 2896.67 99.95 6.08 1.42
A21.00 0.00 1.00 4.00 2.00 2.00 0.09 0.57 0.07 3085.41 3085.41 225.44 6.58 1.15
A30.17 0.00 1.00 1.00 2.00 3.00 0.07 1.87 0.41 1599.90 1224.35 140.57 3.39 1.05
BB10.75 1.00 6.00 2.00 2.00 3.00 0.12 4.07 0.64 892.69 601.05 90.66 3.48 1.21
B20.69 1.00 8.00 3.00 2.00 3.00 0.06 4.13 0.68 1395.22 835.47 138.49 2.94 1.15
B30.70 1.00 5.00 3.00 2.00 3.00 0.06 3.25 0.58 1198.43 932.46 149.25 3.63 1.21
CC10.20 1.50 4.00 4.00 4.00 3.00 0.12 1.60 0.25 1324.49 1228.94 242.41 5.75 1.07
C20.20 1.50 3.00 3.00 3.00 2.00 0.19 1.55 0.18 1697.69 1162.44 296.79 5.31 1.11
C30.08 1.50 3.00 3.00 4.00 3.00 0.18 3.62 0.43 2076.18 1225.43 334.59 5.46 1.29
DD10.50 2.00 6.00 2.00 3.00 3.00 0.05 2.22 0.45 3983.52 3983.52 759.19 11.98 1.13
D20.70 1.50 8.00 2.00 3.00 3.00 0.01 2.51 0.47 9601.71 9601.71 551.88 13.02 1.08
D30.60 1.50 7.00 3.00 2.00 3.00 0.06 2.93 0.57 2598.56 2144.26 401.21 6.73 1.14
Table 4. Spatial vitality index of specialized garden and plots in spring.
GardenPlotFebruaryMarchApril S V
WeekdaysWeekendsMeanWeekdaysWeekendsMeanWeekdaysWeekendsMean
AA10.000 0.480 0.240 0.109 0.217 0.163 0.109 0.794 0.451 0.285
A20.468 0.797 0.632 0.744 1.168 0.956 0.000 1.396 0.698 0.762
A30.118 0.118 0.118 0.118 0.539 0.328 0.000 0.702 0.351 0.266
A0.195 0.465 0.330 0.323 0.641 0.482 0.036 0.964 0.500 0.437
BB10.128 0.128 0.128 0.000 0.141 0.070 0.623 0.599 0.611 0.270
B20.000 0.231 0.116 0.195 0.426 0.310 0.784 0.929 0.857 0.428
B30.000 0.572 0.286 0.841 0.638 0.739 0.800 1.044 0.922 0.649
B0.043 0.311 0.177 0.345 0.402 0.373 0.736 0.857 0.796 0.449
CC12.480 3.017 2.749 2.501 2.710 2.605 0.628 2.172 1.400 2.251
C20.912 1.498 1.205 1.759 1.314 1.537 0.000 0.338 0.169 0.970
C31.251 1.651 1.451 1.545 1.243 1.394 0.114 0.114 0.114 0.986
C1.547 2.055 1.801 1.935 1.756 1.845 0.247 0.875 0.561 1.403
DD11.178 1.665 1.422 0.949 1.391 1.170 0.408 1.759 1.084 1.225
D21.273 1.929 1.601 1.050 2.151 1.601 0.747 1.820 1.284 1.495
D30.997 1.452 1.225 1.003 1.081 1.042 0.311 1.245 0.778 1.015
D1.149 1.682 1.416 1.000 1.541 1.271 0.489 1.608 1.048 1.245
Table 5. Analysis of variance for spatial vitality.
Spatial VitalitySpecialized Gardens (Mean ± Standard Deviation)Fp
ABCD
Spatial vitality
index
0.44 ± 0.330.45 ± 0.301.40 ± 0.701.24 ± 0.466.9750.002 **
Note: ** indicates a significant difference at the 0.01 level.
Table 6. Post hoc tests for spatial vitality.
Spatial Vitality(I) Name(J) Name(I) Mean(J) MeanDifference (I–J)p
Spatial
Vitality index
AB0.4370.449−0.0120.967
AC0.4371.403−0.9650.002 **
AD0.4371.245−0.8070.008 **
BC0.4491.403−0.9540.002 **
BD0.4491.245−0.7960.009 **
CD1.4031.2450.1580.572
Note: ** indicates a significant difference at the 0.01 level.
Table 7. Correlation analysis between plant landscape space characteristics and spatial vitality.
X1X2X3X4X5X6X7X8X9X10X11X12X13X14 S V
X11.000
X2−0.3771.000
X30.2840.5261.000
X40.093−0.064−0.2391.000
X5−0.5640.747 **0.0500.1281.000
X6−0.1630.1360.426−0.4190.0001.000
X7−0.372−0.074−0.5630.4300.296−0.4531.000
X80.0740.2140.690 *−0.320−0.0790.583 *−0.2521.000
X90.2810.1550.807 **−0.388−0.2760.648 *−0.5170.923 **1.000
X100.0040.162−0.064−0.0750.158−0.130−0.322−0.462−0.3991.000
X110.0210.265−0.0570.0410.296−0.065−0.350−0.545−0.4410.888 **1.000
X12−0.3120.817 **0.297−0.0300.631 *−0.065−0.245−0.098−0.1260.5310.643 *1.000
X130.1190.4640.1350.0900.335−0.065−0.308−0.406−0.2940.797 **0.923 **0.727 **1.000
X140.326−0.302−0.1520.264−0.2960.0650.1260.2240.1400.000−0.182−0.371−0.0841.000
S V −0.1930.817 **0.3680.3020.749 **0.000−0.105−0.119−0.1260.3570.587 *0.846 **0.713 **−0.3431.000
Note: * indicates a significant association at the level of 0.05 (two-tailed) and ** indicates a significant association at the level of 0.01 (two-tailed).
Disclaimer/Publisher’s Note: The statements, opinions and data contained in all publications are solely those of the individual author(s) and contributor(s) and not of MDPI and/or the editor(s). MDPI and/or the editor(s) disclaim responsibility for any injury to people or property resulting from any ideas, methods, instructions or products referred to in the content.

