Article

Characterization of Soil Microbial Biomass Carbon and Nitrogen in Four Forest Types of Shushan Urban Forest Park

1
School of Forestry & Landscape Architecture, Anhui Agricultural University, Hefei 230036, China
2
School of Architecture & Urban Planning, Anhui Jianzhu University, Hefei 230009, China
3
College of Life and Environmental Science, Huangshan University, Huangshan 245061, China
*
Author to whom correspondence should be addressed.
Forests 2023, 14(7), 1498; https://doi.org/10.3390/f14071498
Submission received: 29 May 2023 / Revised: 30 June 2023 / Accepted: 6 July 2023 / Published: 21 July 2023
(This article belongs to the Special Issue Urban Forests and Landscape Ecology—Series II)

Abstract

:
This study aimed to investigate the role of plantation forests and natural secondary forests in controlling soil physicochemical properties and microbial biomass in urban forest ecosystems. (1) Background: Urban forests provide numerous benefits to urban ecosystems, but the interaction between forest stands and soil properties in controlling soil microbial biomass carbon (MBC) and nitrogen (MBN) remains poorly understood. The objective of this study was to examine how different forest types (plantation forests and natural secondary forests) influence soil physicochemical properties and microbial biomass in urban forest ecosystems. (2) Methods: We conducted a study in Shushan Urban Forest Park, Hefei, China, utilizing redundancy analysis and linear regression analyses to identify key environmental factors affecting the microbial distribution and significant correlations between soil properties and microbial biomass. (3) Results: Plantation forests generally had lower pH, water content, and organic carbon and nutrient content than natural forests. Natural forests exhibited higher microbial biomass and nutrient cycling capacity. Soil depth and forest type have significant effects on soil properties and microbial biomass in both growing and dormant seasons, with practical implications for forest management and soil conservation in similar ecosystems. Soil water content (SWC), pH, total nitrogen (TN), total phosphorus (TP), and soil organic carbon (SOC) were identified as key factors affecting microbial carbon and nitrogen distribution during both growing and dormant seasons. Our study provides important insights into the role of forest stands and soil physicochemical properties in controlling soil microbial biomass in urban forest ecosystems. Effective forest management strategies should be developed to promote sustainable and resilient forest ecosystems. Future research should investigate the underlying mechanisms driving these relationships and focus on promoting sustainable and resilient urban forest ecosystems.

1. Introduction

Urban forests are an important component of urban ecosystems, contributing to the improvement of urban environments and the enhancement of urban living quality, and have increasingly received attention from the fields of ecology and urban planning [1]. Due to their location in heterogeneous and highly variable urban environments, urban forest ecosystems are fragile and often subject to urban environmental pressures and varying degrees of human disturbance [2,3]. Large-scale afforestation is generally considered an effective measure to alleviate the negative impacts of such disturbances [4], and ecological restoration through tree planting can help mitigate climate change [5].
Soil microbes, as the main decomposers within terrestrial ecosystems, play an essential role in regulating carbon (C) and nutrient cycling [6]. Soil microbes can fix nutrients in the soil and act as temporary “sinks” while also releasing nutrients as “sources,” which can affect the material cycling and energy flow of the ecosystem, further influencing the nutrition and health of plants, as well as the soil structure and fertility within forest ecosystems [7,8,9]. Through the decomposition and synthesis of soil organic matter and humus, soil microbes participate in the carbon and nitrogen cycling of the ecosystem, thereby influencing the conversion and cycling of soil nutrients (such as nitrogen and phosphorus), as well as playing important roles in soil formation and development, ecosystem balance, soil environment purification, and biological restoration [10]. Among them, soil microbial biomass is a reservoir of active soil nutrients and an indicator of soil material metabolism, which is closely related to soil nutrients and health status [11]. The higher the content of soil microbial biomass, the higher the activity level of the microbial community, and thus it can reflect the material cycling ability of the ecosystem to a certain extent [12]. Although soil microbial biomass only accounts for a small part of soil organic matter, it is the most active part [13], and its important components are soil microbial biomass carbon (MBC) and soil microbial biomass nitrogen (MBN).
Soil microbes are influenced by multiple factors, such as soil, climate, and forest type. Even under the same site conditions, significant differences in soil microbial biomass can exist among different forest vegetation types [13,14]. Therefore, soil microbial biomass can serve as an important indicator of environmental change and can be used to evaluate the soil quality of different vegetation types [15,16]. Generally, artificial forests are inferior to natural regrowth forests in terms of nutrient cycling and soil quality [17,18]. For example, Behera et al. [19] compared the soil microbial characteristics of eucalyptus plantations, natural forests, and reforestation areas and found that soil organic carbon (SOC), total nitrogen (TN), and microbial biomass were the lowest in eucalyptus plantations. Similarly, Singh et al. [20] found that the levels of microbial biomass C and N were highest in natural forests. Furthermore, Hua et al. [21] found that, compared with structurally simple artificial forests, natural forests can better support biodiversity conservation and offer ecosystem services such as carbon storage, soil conservation, and water source regulation.
In addition to vegetation factors, soil physicochemical properties also have significant effects on soil MBC and MBN. Different dominant factors affect soil microbial biomass carbon and nitrogen in different soil ecosystems, such as soil moisture, organic matter content, and soil pH. Soil pH is one of the main factors affecting MBC and MBN, while carbon/nitrogen/phosphorus and inorganic substances (nutrients and toxic cations) also affect the structure of microbial communities [22,23,24,25]. Total soil organic carbon (SOC), total nitrogen (TN), and soil moisture are the main factors causing differences in soil MBC and MBN [26]. Day et al. [27] found that changes in microbial structure are related to aspects of soil C and N pools and cycling. Li et al. [28] also reported a significant positive correlation between MBC, MBN, and soil moisture. In addition, previous studies have shown that MBN is positively related to SOC, soil total phosphorus, and available phosphorus [29].
Soil MBC and MBN are important indices of soil biological status since they play a vital role in the transformation and cycling of organic matter and are sources of labile nutrients [30,31]. However, the majority of studies exploring plant–soil–microbe interactions are plant-centric, with a strong focus on measures of plant survival, productivity, and fitness. Shushan Urban Forest Park, the only urban forest park near Hefei, China, provides numerous ecological benefits, economic benefits, and social benefits. Currently, the vegetation of Shushan Forest Park is mainly composed of three artificial forests planted in the 1960s, including Pinus massoniana Lamb. (PM), Quercus acutissima Carruth. (QA), and Liquidambar formosana Hance (LF), as well as secondary deciduous broadleaved forests [32,33]. Different plant communities and diverse soil microbial communities constitute the main body of the Shusha urban forest ecosystem. Combining urban forests with ecological engineering can provide opportunities for coexistence between humans and nature and promote ecosystem protection. Despite research on forest landscape dynamics, community dynamics, material circulation, and soil characteristics in Shushan, our understanding of the interactive mechanisms between major forest stands and soil physicochemical properties on soil MBC and MBN in urban forest ecosystems is still incomplete. Therefore, we conducted a study on the soil physicochemical properties and MBC and MBN characteristics of four forest types in Shushan Urban Forest Park. Our work in this area has two main sub-fields. First, we systematically obtained the dynamic changes and clarified the relationship between forest community, soil physicochemical factors, and soil MBC and MBN. Second, this research result will provide the basis for the sustainable development of urban forests and the protection of the ecological environment. Our main hypothesis was that soil MBC and MBN in urban forest stands are influenced by soil physicochemical factors. To test this, we aimed to: (1) conduct a qualitative and quantitative assessment of plantation forests and natural secondary forests in controlling the main soil physicochemical property variability in urban forest communities; (2) identify the main soil physicochemical factors influencing soil MBC and MBN in four urban forest stands; and (3) detect the patterns of associations among differences in urban forest stands, soil physicochemical properties, and MBC and MBN characteristics at this site.

2. Materials and Methods

The Shushan Urban Forest Park (31°50′44″ N, 117°10′37″ E, altitude 97–110 m a.s.l.) is located in Hefei city, Anhui province, East China, and covers a total area of 1003.01 hectares (Figure 1). It is part of the Dabieshan Mountain range and is located in a transition zone from subtropical to warm temperate climates, characterized by distinct seasonality. The annual average rainfall is around 1000 mm, with the majority falling between April and September, accounting for over 70% of the total annual rainfall. The annual mean temperature ranges from −20.6 °C to 41.2 °C. The park is comprised of four main vegetation types, including three plantations (Pinus massoniana [PM], Quercus acutissima [QA], and Liquidambar formosana [LF]), and secondary deciduous broadleaved forest (DB). The DB forest also includes a diverse range of subcanopy tree species [34]. The three plantation stands, which are each approximately 60 years old, cover over 70% of the total forest area (Table 1). The soil type in the park is yellow-brown, developed from the weathered parent material of gabbroid. The soils are acidic and range in depth from 7 cm to over 100 cm [35].

2.1. Experimental Set-Up and Sample Collection

Sampling took place at the end of May 2018 and in January 2019. To minimize the potential impact of rainfall on soil samples, it is advisable to avoid taking samples immediately after rain. Surface soil samples from a depth of 0–10 cm, 10–20 cm, and 20–30 cm were collected from three plantation forests (PM, QA, and LF) and one secondary broadleaved forest, following the “5-location-isometric sampling method” described by Zhang et al. [36]. In each of the four forest types, three 30 m × 30 m replicate plots were established, with five 2 m × 2 m quadrats randomly placed within each plot. Soil samples were collected using a 6-centimeter-diameter auger after removing forest floor debris. All samples were passed through a 5-millimeter sieve to remove roots and other debris. A total of 180 samples were obtained, representing four forest types with fifteen replicates each. Each sample was divided into two portions: one half was transported on ice to the Anhui Agricultural University laboratory and stored at 4 °C for soil physicochemical property analysis, while the other half was used to determine MBC and MBN.

2.2. Soil Physicochemical Property Analyses

The collected fresh soil samples were measured for SWC. The remaining soil samples were air-dried, ground, and sieved with a 0.25-millimeter mesh screen. The processed subsamples were analyzed to determine soil pH, EC, organic carbon (SOC), TN, and TP. SWC was measured by oven-drying at 105 °C [37] until a constant weight was obtained. Soil pH was determined in 1:2.5 (w/v) soil solutions using a pH meter (PH8008, SMART SENSOR, CHN). EC was measured in 1:5 (w/v) soil solutions using a HORIBA B-173 conductivity meter. SOC and TN were measured with a CHN Analyzer (EA 3000, Vector, Milano, Italy). After micro-Kjeldahl digestion, TP was measured using a continuous flow-injection analyzer (FUTURA, ALLIANC, Paris, France).

2.3. Soil MBC and MBN Analyses

Soil MBC and MBN were treated by chloroform fumigation and leaching [38,39,40]. Fresh soil was removed from roots and gravel, passed through a 5 mm sieve, 30 g of fresh soil sample was weighed and placed on top of a desiccator, a small beaker containing 15 mL of chloroform was placed on the bottom of the desiccator, evacuated at 25 °C until the chloroform boiled, the desiccator was filled with chloroform gas, evacuation was stopped and placed in a constant temperature chamber. The desiccator was filled with chloroform gas, stopped evacuating, and placed in a thermostat for 24–36 h. After evacuating and boiling, 10 mL of chloroform was added and placed in the thermostat for 24 h. The desiccator was fully evacuated so that the chloroform was completely evacuated and then extracted with 0.5 mol L−1 K2SO4.
MBC was calculated as follows:
MBC = EC/kEC,
where EC = (organic C extracted from fumigated soils) − (organic C extracted from non-fumigated soils) and kEC = 0.45 [38].
MBN was calculated as:
MBN = EN/kEN,
where EN = (total N extracted from fumigated soils) − ((total N extracted from non-fumigated soils) and kEN = 0.54 [40].

2.4. Statistical Analysis

This study used Excel 2016, SPSS 19.0, and R 3.4.4 to conduct the statistical analyses. Before conducting the ANOVA, normality tests were performed on the variables to ensure that the assumptions of the analysis were met. A one-way ANOVA was used to evaluate differences among the four vegetation types, followed by a two-tailed Student’s t-Test to compare the means between each pair of the four vegetation types, with a significance level of 0.05. Furthermore, a one-way ANOVA was used to evaluate the differences in data between more than two groups. A significance level of p ≤ 0.05 was used to determine whether the differences or correlations between two groups of data were “significant” in statistical terms, while a significance level of less than 0.01 was considered “highly significant”. A multivariate analysis of variance (MANOVA) using SPSS 19.0 was conducted to assess the effects of Depth, Forest type, and their interaction term on the soil physicochemical properties and microbial biomass in both the growing and dormant seasons. All statistical tests were considered significant at p < 0.05. The “ggplot2” package in R [41] was used for correlation analysis between the soil physicochemical properties and MBC and MBN. The normality of the selected variables is tested, and if they do not follow a normal distribution, a logarithmic transformation is applied. The significance of the correlation coefficient was determined based on the p-value, usually with a significance level of 0.05. The RDA analysis of soil physicochemical properties and carbon source utilization efficiency during growth and dormant seasons used the “vegan” package in R [42]. RDA analysis was performed, including checking whether the data conforms to a unimodal model, standardizing the data, building the RDA model, performing forward and backward selection, checking collinearity, and obtaining the best model. In order to ensure the validity of the RDA analysis, the decorana function was used to determine whether a linear or unimodal model was more appropriate, and the data was then standardized for each season. The envfit function was used to perform a significant test on these explanatory variables.

3. Results

3.1. Soil Physicochemical Properties

In this study, it was observed that all samples were found to be acidic, with the soils of plantation forests exhibiting a more pronounced acidic nature compared to those of the DB stand. In three soil layers, the DB stand had the highest pH values, followed by the PM, LF, and QA stands (Table 2). During the growing season, a non-significant difference was noted in the soil pH between the PM and LF stands and the DB stand within the 0–10 cm soil layer (p = 0.995, p = 0.105). However, there was a highly significant difference between the QA stand and the other three stands (p < 0.001). In 10–20 cm, a significant difference in soil pH was noted between PM and QA stands (p < 0.001), but not between PM and the other two stands (p = 0.934, p = 0.685). The QA stand showed highly significant differences in soil pH from the other three stands in all three soil layers during the growing season. Additionally, it is noteworthy that during the dormant season, there was a significant difference in soil pH between the plantation QA and the other three stands, as presented in Table S1. During the growing season, the EC values of the four forest stands showed the highest values in QA across all three soil layers, with a gradual decrease in EC values as soil depth increased. The differences in EC values between QA and LF were highly significant in three soil layers (p < 0.05). Notably, within the 0–10 cm soil layer, a significant difference in EC values was found between QA and LF (p = 0.029), while no significant difference was observed between DB and the other three stands. In the 10–20 cm soil layer, significant differences in EC values were observed between QA and the other stands (p < 0.001 for QA vs. PM, and p = 0.002 and 0.037 for QA vs. DB and QA vs. LF, respectively). Similarly, in the 20–30 cm soil layer, significant differences were noted between QA and PM/LF (p = 0.009 for QA vs. PM and p = 0.002 for QA vs. LF), while no significant difference was found between DB and the other three stands (p > 0.05). Except for QA, no significant difference was found between PM and the other two stands (p = 0.704 for PM vs. DB, and p = 0.113 for PM vs. LF). Furthermore, during the dormant season, a significant difference in EC values was observed between DB and plantation QA/LF in the 0–10 cm soil layer (p = 0.025, 0.028, respectively), as well as between DB and plantation QA in the 10–20 cm soil layer (p < 0.05). During the growing season, we found that the DB had the highest SWC values in all three soil layers. A significant difference in SWC values was observed between DB and the plantations PM/QA soils in the 0–10 cm soil layer (p < 0.001). Similarly, in the 10–20 cm soil layer, significant differences in SWC values were found between DB and the other two stands, particularly with QA (p < 0.001). In the 20–30 cm soil layer, significant differences in SWC values were noted between QA and the other three forest stands, particularly with DB (p < 0.001). Furthermore, during the dormant season, the SWC values of natural forest DB and plantation LF were not significantly different in the three soil layers.
This study found that the SOC content gradually decreased with increasing depth across all four forest stands. During the growing season, the SOC content of QA soil was the highest among the four forest stands, while LF had the lowest SOC content. In the 0–10 cm soil layer, significant differences were observed between QA and DB (p < 0.001), while no significant differences were found between PM and DB (p = 0.226). Furthermore, LF and DB soils showed no significant difference in terms of SOC content (p = 0.255). In the 10–20 cm soil layer, significant differences were observed between the QA soil and the soils of the other three forest stands (p < 0.001). Similarly, in the 20–30 cm soil layer, significant differences were found between QA and the other three forest stands (Table 2). Moreover, during the dormant season, significant differences in SOC values were observed between natural forest DB and plantations (PM and LF) in three soil layers. During the growing season, there were significant differences in the TN values of DB and plantation LF soils across all three soil layers. Notably, in the 0–10 cm soil layer, significant differences were observed between LF and the other three forest stands (p < 0.001). In the 10–20 cm and 20–30 cm soil layers, significant differences were found between DB and the other two forest stands, LF and PM (p < 0.001). Furthermore, during the dormant season, significant differences in TN values were observed between DB and the other two forest stands, PM and QA (p < 0.001). This study found that during the growing season, LF had the lowest TP content across all three soil layers. Notably, significant differences in TP content were observed between LF and the other three forest stands in the 0–10 cm soil layers (p < 0.001). In the 10–20 cm soil layer, significant differences were found between PM and LF (p = 0.018), while in the 20–30 cm soil layer, significant differences were found between LF and QA (p = 0.019), as well as between PM and LF (p = 0.04). Furthermore, during the dormant season, significant differences in TP content were observed between natural forest DB and plantation PM in all three soil layers (p < 0.001) (Table S1).

3.2. Soil MBC and MBN Characterizations

MBC content showed a decreasing trend from PM to DB to LF to QA in all three soil layers during the growing season. In the 0–10 cm soil layer, plantation PM had the highest MBC and MBN values, 38.4 mg/kg and 12.52 mg/kg, respectively, while values decreased with increasing soil depth (Table S2). Plantation QA and LF also showed a decreasing trend in MBC and MBN content with increasing soil depth, while MBC content in LF showed a decreasing trend ranging from 26.05 mg/kg to 5.53 mg/kg. The MBC content in DB also decreased with soil depth, with a range of 26.46 mg/kg to 14.07 mg/kg, while the MBN content showed an increasing trend followed by a decreasing trend, with a range of 10.04 mg/kg to 3.81 mg/kg. During the dormant season, plantation LF had the highest MBC and MBN values in all three soil layers. The MBC and MBN values in plantation PM decreased with increasing soil depth, with MBC ranging from 26.89 mg/kg to 20.54 mg/kg and MBN ranging from 8.37 mg/kg to 5.25 mg/kg. The MBC and MBN contents in LF and DB also decreased with increasing soil depth, with the highest MBC value in LF being 36.83 mg/kg and the lowest being 32.08 mg/kg, and the highest MBN value in LF being 13.95 mg/kg and the lowest being 9.05 mg/kg. The highest MBC value in DB was 33.99 mg/kg, while the lowest was 19.66 mg/kg, and the highest MBN value in DB was 13.32 mg/kg, while the lowest was 6.46 mg/kg.
During the growing season, significant differences in MBC were observed between DB and plantation PM in all three soil layers (p < 0.001), while no significant differences were observed during the dormant season (Figure 2). In the 10–20 cm soil layer during the growing season, significant differences in MBC content were observed between DB and plantation QA and PM, with the difference between DB and QA being highly significant (p < 0.001). In the 20–30 cm soil layer, no significant differences in MBC were observed between DB and the three plantation stands (p = 0.781, 0.062, 0.072). In terms of MBN content, during the growing season, significant differences were observed between DB and plantation PM in the 0–10 cm soil layer (p < 0.001), between DB and plantation QA in the 10–20 cm soil layer (p = 0.0183), and between DB and plantation PM in the 20–30 cm soil layer (p = 0.0453). During the dormant season, significant differences in MBN content were observed between DB and plantation QA in the 0–10 cm soil layer (p < 0.001) and between DB and plantation LF in the 10–20 cm and 20–30 cm soil layers (p = 0.0313, 0.0082).

3.3. Impact of Forest Types and Soil Layers on Soil Properties and Microbial Biomass

The MANOVA results showed that both Depth and Forest type, as well as their interaction terms, have a significant effect on the soil physicochemical properties as well as the microbial biomass in both the growing and dormant seasons (Table 3). Specifically, in the growing season, the main effect of Depth was found to be significant for pH, SOC, TN, MBC, and MBN (p < 0.001), while the main effect of Forest type was significant for pH, EC, SWC, SOC, TN, TP, MBC, and MBN (p < 0.001). Moreover, the interaction between Depth and Forest type was found to be significant for MBN (p < 0.001). In the dormant season, Depth was found to be significant for pH, TN, and MBN (p < 0.001), as well as SOC (p = 0.02) and TP (p = 0.003), while Forest type was significant for pH, TN, TP, MBC, and MBN (p < 0.001), as well as EC (p = 0.009) and SOC (p = 0.041). Moreover, the interaction between Depth and Forest type was found to be significant for MBN (p < 0.001). Overall, these findings suggest that both Depth and Forest type play important roles in shaping the soil properties and nutrient cycling in this study area and that the effects may vary between the growing and dormant seasons. These findings have practical implications for forest management and soil conservation practices in similar ecosystems.

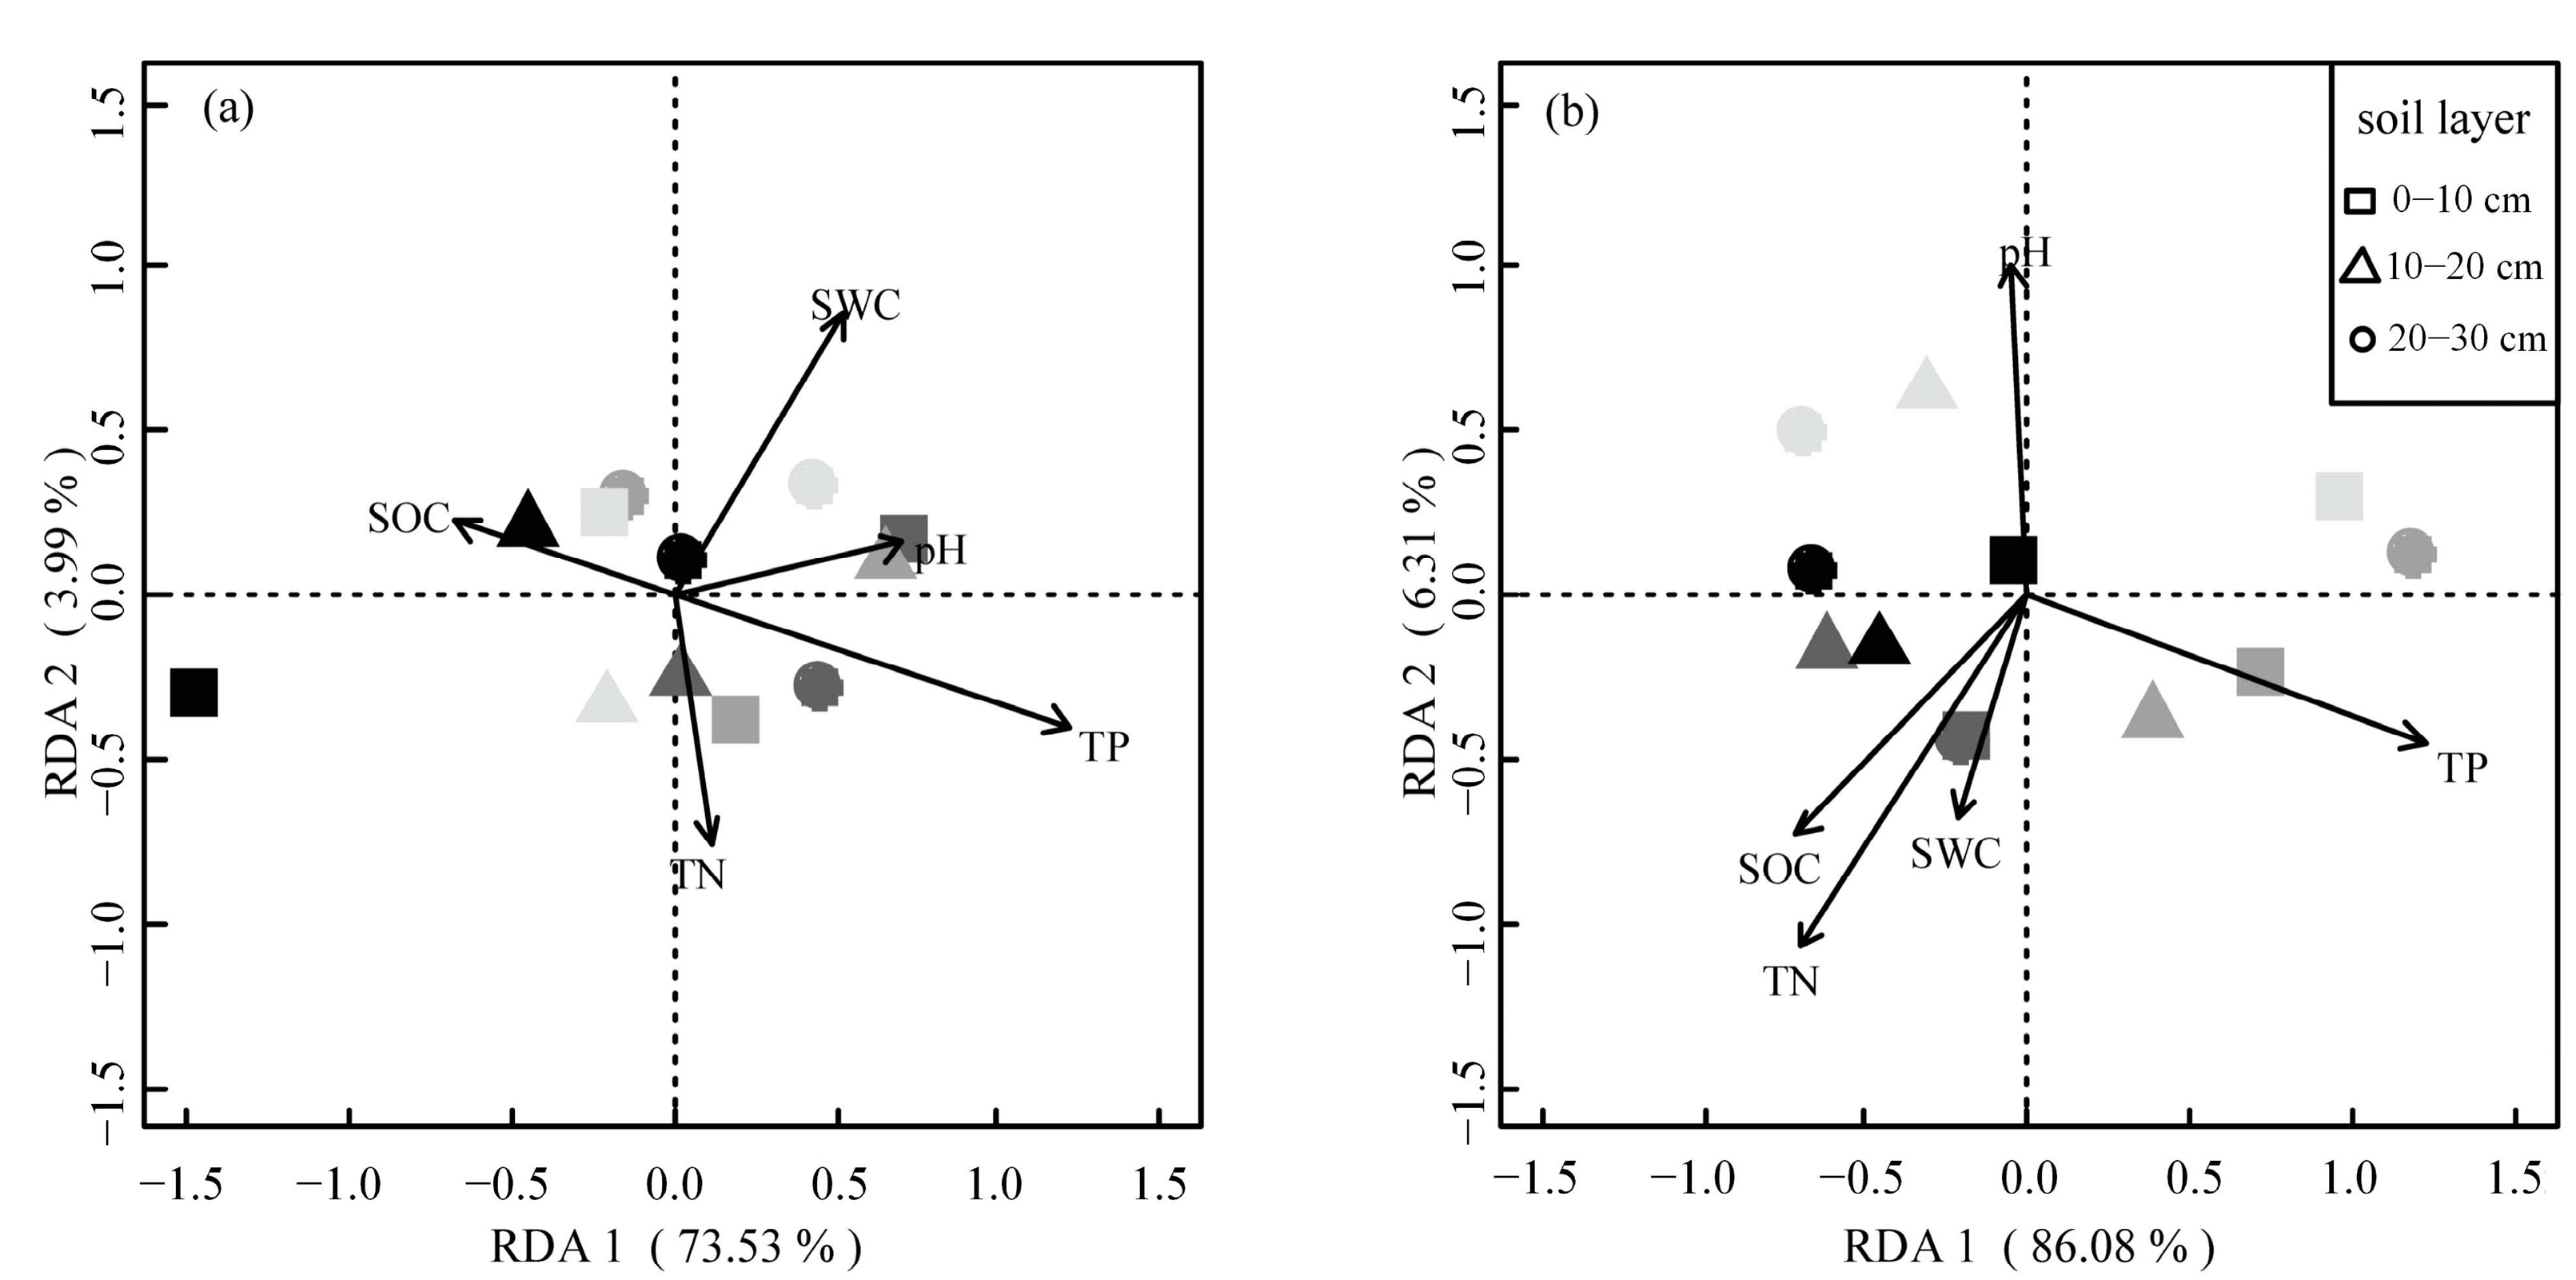
3.4. Relationships between Soil Physicochemical Properties and Microbial Biomass

Our results showed that there were significant positive correlations between MBC and pH, EC, TP, SOC, and TN in PM plantations. However, the correlation between MBC and SWC was not significant. Furthermore, we found that the strength of the correlations between MBC and these soil properties varied with different sampling seasons. For instance, the correlation between MBC and pH was relatively weak in the growing season but became much stronger in the growing season. In contrast, the correlation between MBC and TP was strongest in the growing season but weakened in the growing season (Figure 3). Our results showed that the correlations between MBN and pH, EC, TP, SOC, and TN were all significant in PM plantations (p < 0.05 or p < 0.01) except for SWC (p > 0.05). Specifically, MBN was positively correlated with EC, TP, SOC, and TN, while MBN was weakly positively correlated with pH. These findings suggest that soil EC, TP, SOC, and TN may be important factors influencing MBN in the studied area, while soil pH and SWC may have a relatively weaker effect on soil MBN (Figure 4). We found that soil pH was positively correlated with MBC, with a correlation coefficient of 0.48 in the QA plantation (p < 0.01). In contrast, EC was negatively correlated with MBC, with a correlation coefficient of −0.43 (p = 0.02). SWC was positively correlated with MBC, with a correlation coefficient of 0.42 (p = 0.02). However, TP, SOC, and TN showed weak or no correlation with MBC. Our results suggested that soil pH and EC are important factors affecting MBC in the QA plantation. High soil pH may promote microbial activity, while high EC may inhibit it. Additionally, soil moisture content appears to be a key factor influencing MBC in the QA plantation ecosystem (Figure S1). Soil pH was positively correlated with MBN, while EC was negatively correlated with MBN in the QA plantation. SWC was also positively correlated with MBN. However, TP, SOC, and TN showed weak or no correlation with MBN. The positive correlation between soil pH and MBN suggests that a higher soil pH may promote microbial activity and nutrient cycling in the forest ecosystem. In contrast, the negative correlation between soil EC and MBN suggests that high levels of soil salinity may have a negative impact on microbial communities and their functions. The positive correlation between SWC and MBN suggests that water availability plays an important role in regulating microbial activity and nutrient cycling in Quercus acutissima forest soils (Figure S2).
We observed that pH had a weak positive correlation with MBC, while EC had a weak negative correlation with MBC in the LF planation (Figure S3). SWC exhibited a strong positive correlation with MBC. TP, SOC, and TN did not show significant correlations with MBC. We found that the correlation between MBC and SWC was significant in all seasons, while the correlations between MBC and pH, EC, TP, SOC, and TN varied across seasons. Our results showed that MBN was negatively correlated with EC (r = −0.52, p < 0.01), while no significant correlation was found between MBN and pH, TP, SOC, or TN. Additionally, the correlation analyses were conducted separately for two different seasons, but no significant differences were observed. These findings suggest that soil EC may play a crucial role in regulating MBN in the LF plantation, while other soil properties showed no significant effects (Figure S4). Our results showed that MBC was positively correlated with soil pH, SWC, SOC, and TN in secondary deciduous broad-leaved forests. However, no significant correlation was found between MBC and EC, TP, or other soil cation elements. The strongest correlation was observed between MBC and pH, with correlation coefficients ranging from 0.32 to 0.57, depending on the season and soil layer. These findings suggest that soil pH and water availability are important factors influencing the microbial community in secondary deciduous broad-leaved forest ecosystems (Figure S5). Our results showed that MBN was negatively correlated with EC (r = −0.52, p < 0.01), while no significant correlation was found between MBN and pH, TP, SOC, or TN in the secondary deciduous broad-leaved forest. These findings suggest that soil EC may play a crucial role in regulating MBN in the DB forest, while other soil properties showed no significant effects. Additionally, the correlation analyses were conducted separately for two different seasons, but no significant differences were observed (Figure S6).
We used the decorana function to determine whether a linear or unimodal model was more appropriate and then standardized the data for each season. We generated RDA plots for each season and calculated the contribution of the explanatory variables. The RDA analysis for the growing season revealed that SWC, pH, TN, TP, and SOC were important environmental factors that influenced the distribution of MBC and MBN. The RDA 1 and RDA 2 axes explained 73.53% and 3.99% of the variation, respectively. The envfit function performed a significant test on these explanatory variables, which showed that they had a significant effect on MBC and MBN. The RDA analysis for the dormant season showed that SWC, pH, TP, TN, and SOC were key environmental factors that influenced the distribution of microbial biomass carbon and nitrogen. The RDA 1 and RDA 2 axes explained 86.08% and 6.31% of the variation, respectively. Similarly, the envfit function’s significant test results showed that these explanatory variables had a significant effect on MBC and MBN (Figure 5).

4. Discussion

4.1. Effects of Different Forest Types on Soil Physicochemical Characteristics

Our results indicated that all forest stands had acidic soils, with plantation forests exhibiting higher levels of acidity compared to the natural forest. This finding was consistent with previous studies that have reported a decline in soil pH due to human activities such as afforestation [43,44]. In terms of soil pH, the DB stand had the highest values across all three soil layers during the growing season, while the QA stand exhibited the lowest values. The significant difference in soil pH between the QA stand and the other three stands suggested that the soil in the QA stand may have been affected by certain plant species, such as conifers, which have been reported to produce organic acids that can lower soil pH [45]. Furthermore, the high EC values observed in the QA stand during the growing season may indicate high levels of soluble salts, which can also contribute to soil acidity, similar to the observations by Liu et al. [46]. This study also found significant differences in soil SWC between the natural forest DB stand and the plantation forests, particularly in the 0–10 cm and 10–20 cm soil layers. This finding was consistent with previous research showing that Ding et al. [47] reported lower SWC in plantation forests due to lower canopy interception and higher evapotranspiration rates compared to natural forests. The higher SWC in the DB stand may be attributed to the presence of a diverse range of plant species, which can increase soil water-holding capacity, as reported by Liu et al. [48]. The results also indicated that the SOC content gradually decreased with increasing soil depth across all forest stands. During the growing season, the QA stand showed the highest SOC content among the four forest stands, while the LF stand had the lowest. This finding was consistent with previous studies that reported higher SOC content in coniferous forests compared to broadleaf forests due to differences in litter quality and decomposition rates [49,50]. The significant differences in SOC content between the QA stand and the other three stands suggest that the choice of plant species in plantation forests can have a significant impact on soil organic matter accumulation.
Furthermore, this study found significant differences in TN and TP content between the natural and plantation forests. During the growing season, the TN content of the DB stand was significantly higher than that of plantation LF and PM stands across all three soil layers. This finding suggested that the natural forest may have a higher capacity to retain and cycle nitrogen compared to plantation forests, which can be attributed to the presence of a diverse range of plant species and associated microbes that can facilitate nutrient cycling [51]. The TP content also showed significant differences between forest types, with the DB stand having the highest values among all four forest stands. This finding suggested that natural forests may have a greater capacity to accumulate phosphorus due to the presence of a complex and diverse soil microbial community that can facilitate nutrient cycling, which was consistent with a previous study by Liu et al. [51]. This study found that the physicochemical characteristics of soil in natural and plantation forests differ significantly. Plantation forests generally exhibit lower soil pH, lower SWC, and lower SOC and nutrient content than natural forests. The results suggested that the choice of plant species in plantation forests can have a significant impact on soil properties, highlighting the importance of considering the ecological implications of afforestation and reforestation efforts. The findings of this study provide important insights for forest management and conservation practices aimed at maintaining and enhancing soil fertility and ecosystem health.

4.2. Effects of Soil Physicochemical Factors on Soil Microbial Biomass

Our results showed that plantation PM had the highest MBC and MBN values in the 0–10 cm soil layer during the growing season, while plantation LF had the highest values during the dormant season in all three soil layers. The decreasing trend in MBC content from PM to DB to LF to QA in all three soil layers during the growing season may be attributed to differences in plant species composition and litter quality [49,51]. In addition, our statistical analysis showed significant differences in MBC and MBN content between natural and plantation forests, with natural forests exhibiting higher levels of microbial biomass and nutrient cycling capacity, which was consistent with the findings of Li et al. and Wang et al. [43,44]. Specifically, our results showed that MBC and MBN content were significantly influenced by soil depth and forest type, with the highest values observed at shallower soil depths in plantation PM during the growing season and in plantation LF during the dormant season. These findings suggest that soil depth and forest type should be considered in forest management practices to promote sustainable and resilient forest ecosystems.
Our findings suggested that natural forests may have a higher capacity for soil nutrient cycling and microbial growth, which may contribute to greater ecosystem sustainability and resilience. Forest management practices should consider the effects of forest type on soil microbial biomass and physicochemical characteristics to promote ecosystem health and function. Future research should continue to investigate the underlying mechanisms that drive these differences and develop effective forest management strategies that promote sustainable and resilient forest ecosystems. Overall, our findings suggested that natural forests may have a greater capacity for soil nutrient cycling and microbial growth compared to plantation forests. These findings have important implications for forest management practices and highlight the need for further research to understand the underlying mechanisms that drive these differences.

4.3. Forest Type and Soil Layer Interactions Influence Soil Properties and Microbial Biomass

Our findings indicate that Depth and Forest type play important roles in shaping soil properties and nutrient cycling in this ecosystem. The effects of these factors may vary between the growing and dormant seasons, which has implications for forest management and soil conservation practices in similar ecosystems. Managers should consider the interaction between Depth and Forest type when developing their management strategies. For example, our finding that the interaction between Depth and Forest type was significant for MBN during both seasons suggests that maintaining an appropriate soil depth and utilizing mixed forests may be effective in maintaining soil fertility and ecosystem health.
These findings are consistent with previous studies that have reported the impact of forest types and soil layers on soil properties and nutrient cycling [52,53]. Our study adds to this body of knowledge by highlighting the importance of considering Depth and Forest type interactions in forest management and soil conservation practices in similar ecosystems. It is important to note that our study was conducted in a specific geographic area and under certain environmental conditions. The generalizability of our findings to other ecosystems may be limited. Future research should be conducted in other regions and under different environmental conditions to further validate and expand upon our findings.

4.4. Implications of Soil Physicochemical Properties on Soil MBC and MBN

We found that the correlations between MBC and soil pH, EC, TP, SOC, and TN were significant in the PM plantation, while the correlation between MBC and SWC was not significant. In contrast, the correlation between MBC and SWC was significant in the QA plantation, while TP, SOC, and TN showed weak or no correlation with MBC [54,55]. Our results suggested that soil pH and EC are important factors affecting MBC in the QA plantation, while soil moisture content appears to be a key factor influencing MBC in this ecosystem. In the LF plantation, SWC exhibited a strong positive correlation with MBC, while TP, SOC, and TN did not show significant correlations with MBC. Soil EC may play a crucial role in regulating MBN in the LF plantation, while other soil properties showed no significant effects. In the DB forest, MBC and MBN were positively correlated with soil pH, SWC, SOC, and TN, while no significant correlation was found between MBC and EC, TP, or other soil cation elements [56].
Importantly, our study highlighted the differences between artificial and natural forest ecosystems in terms of soil microbial biomass. For instance, we found that MBC and MBN were positively correlated with pH, EC, TP, SOC, and TN in the PM plantation, but not in the natural forests (QA, LF, and DB). This suggested that human intervention through plantation forestry may have altered the relationships between soil properties and microbial biomass in these ecosystems. Our findings also provided insights into the seasonality of MBC and MBN in different forest types. We observed that the correlation between MBC and soil properties varied with different sampling seasons. For instance, the correlation between MBC and pH was relatively weak in the growing season but became much stronger in the dormant season in the PM plantation. Similarly, the correlation between MBC and TP was strongest in the growing season but weakened in the dormant season. These findings suggest that seasonality should be considered when investigating the relationships between soil properties and microbial biomass in forest ecosystems [56]. Overall, our results suggest that soil physicochemical properties play important roles in regulating soil microbial biomass in forest ecosystems. The specific relationships between soil properties and microbial biomass vary with forest type and sampling season. Our findings have important implications for forest ecosystem management and conservation, particularly in the context of human intervention through plantation forestry. Future research should investigate the underlying mechanisms driving these relationships and their potential impacts on ecosystem functioning and services.

5. Conclusions

This study aimed to investigate the effects of different forest types on soil physicochemical properties and their impacts on soil microbial biomass in China. Our results demonstrated that plantation forests generally exhibited lower soil pH, lower soil water content, and lower soil organic carbon and nutrient content than natural forests. The choice of plant species in plantation forests had a significant impact on soil properties, highlighting the importance of considering the ecological implications of afforestation and reforestation efforts. Furthermore, our findings indicated that natural forests had a higher capacity for soil nutrient cycling and microbial growth, which may contribute to greater ecosystem sustainability and resilience. Our study also emphasized the importance of considering the seasonality of soil microbial biomass and its relationships with soil properties. We found that the correlations between soil properties and microbial biomass varied with different sampling seasons, suggesting that seasonality should be considered when investigating the relationships between soil properties and microbial biomass in forest ecosystems. Our study provides new insights into the impact of Depth and Forest type interactions on soil properties and microbial biomass in this ecosystem. The findings have practical implications for forest management and soil conservation practices in similar ecosystems and highlight the importance of considering these factors when developing forest management strategies. Future research should continue to investigate the underlying mechanisms that drive these differences and develop effective forest management strategies that promote sustainable and resilient forest ecosystems.

Supplementary Materials

The following supporting information can be downloaded at: https://www.mdpi.com/article/10.3390/f14071498/s1, Figure S1: Linear relationships between soil physicochemical properties and soil MBC in Quercus acutissima planation; Figure S2: Linear relationships between soil physicochemical properties and soil MBN in Quercus acutissima planation; Figure S3: Linear relationships between soil physicochemical properties and soil MBC in Liquidambar formosana planation; Figure S4: Linear relationships between soil physicochemical properties and soil MBN in Liquidambar formosana planation; Figure S5: Linear relationships between soil physicochemical properties and soil MBC in secondary deciduous broadleaved forest; Figure S6: Linear relationships between soil physicochemical properties and soil MBN in secondary deciduous broadleaved forest; Table S1: Soil physicochemical properties in four urban forest types in the dormant season; Table S2: Soil microbial biomass C, N in growing season and dormant season.

Author Contributions

X.X. conceptualized this study, designed the methodology, reviewed, edited, visualized, supervised, administered the project, and acquired funding. M.W., J.C. and H.L. developed the software, validated the data, conducted formal analysis, and performed the investigation. M.W. wrote the original draft of the manuscript. All authors have read and agreed to the published version of the manuscript.

Funding

This research was funded by the National Natural Science Foundation of China under grant number 31070588 and 31370626, the Natural Science Research Project of the Anhui Educational Committee under grant number KJ2021A0614, and the Science and Technology Program for Housing and Urban-Rural Development in Anhui Province under grant number 2022-YF081.

Data Availability Statement

Data are available upon request to the corresponding author.

Conflicts of Interest

The authors declare no conflict of interest.

References

  1. Ordóñez, C.; Duinker, P.N. An analysis of urban forest management plans in Canada: Implications for urban forest management. Landsc. Urban Plan. 2013, 116, 36–47. [Google Scholar] [CrossRef] [Green Version]
  2. Steenberg, J.W.N.; Millward, A.A.; Nowakd, D.J.; Robinson, P.J.; Ellis, A. Forecasting urban forest ecosystem structure, function, and vulnerability. Environ. Manag. 2016, 59, 373–392. [Google Scholar] [CrossRef]
  3. Duinker, P.N.; Greig, L.A.; Kenney, W.A.; Yawney, J.K. Forecasting urban forest ecosystem structure, function, and vulnerability. Urban For. Urban Green. 2015, 14, 890–901. [Google Scholar]
  4. Han, Q.; Keeffe, G. Promoting climate-driven forest migration through large-scale urban afforestation. Landsc. Urban Plan. 2021, 212, 104059. [Google Scholar] [CrossRef]
  5. Zhang, S.; Wang, Y.; Cheng, J.; Xue, L.; Yan, J. Effects of afforestation on carbon sequestration and global climate change: A review. For. Ecol. Manag. 2021, 482, 118802. [Google Scholar]
  6. Li, Z.; Tian, D.; Wang, B.; Wang, J.; Wang, S.; Chen, H.Y.H.; Xu, X.; Wang, C.; He, N.; Niu, S. Microbes drive global soil nitrogen mineralization and availability. Glob. Change Biol. 2019, 25, 1078–1088. [Google Scholar] [CrossRef]
  7. Yan, M.Y. Research on the Microbial Decomposition and Nutrient Release Feature of the Pinus Massoniana Forest Litters in Jinyun Mountain. Master's Thesis, South West University, Chongqing, China, 2011. [Google Scholar]
  8. Fan, X.G.; Jin, K.; Li, Z.J.; Rong, X.N. Soil microbial diversity under different fertilization and tillage practices: A review. J. Plant Nutr. Fertil. Sci. 2010, 16, 744–751. [Google Scholar]
  9. Qiu, T.T.; Liu, G.B.; Wang, G.L.; Sun, L.P.; Yao, X. Changes of soil microbial biomass carbon and their impact factors for Pinus tabuliformis plantations at different development stages on the Loess Plateau, China. Chin. J. Appl. Ecol. 2016, 27, 681–687. [Google Scholar]
  10. Zak, D.R.; Holmes, W.E.; White, D.C.; Peacock, A.D.; Tilman, D. Plant diversity, soil microbial communities, and ecosystem function: Are there any links? Ecology 2003, 84, 2042–2050. [Google Scholar] [CrossRef] [Green Version]
  11. Li, F.S.; Fang, X.; Xiang, W.H.; Sun, W.J.; Zhang, S.J. Soil Microbial Biomass Carbon and Nitrogen Concentrations in Four Subtropical Forests in Hilly Region of Central Hunan Province, China. Sci. Silvae Sin. 2014, 50, 8–16. [Google Scholar]
  12. Zhao, T.; Yan, H.; Jang, Y.L.; Huang, Y.M.; An, S.S. Effects of vegetation types on soil microbial biomass C,N,P on the Loess Hilly Area. Acta Ecol. Sin. 2013, 33, 5615–5622. [Google Scholar] [CrossRef]
  13. Liang, C.; Amelung, W.; Lehmann, J.; Kästner, M. Quantitative assessment of microbial necromass contribution to soil organic matter. Global Change Biology. 2019, 25, 3578–3590. [Google Scholar] [CrossRef] [PubMed]
  14. Wardle, D.A. A comparative assessment of factors which influence microbial biomass carbon and nitrogen levels in soil. Biol. Rev. 1992, 67, 321–358. [Google Scholar] [CrossRef]
  15. Groffman, P.M.; McDowell, W.H.; Myers, J.C.; Pastor, J.; Carpenter, S.R.; Nadelhoffer, K.J. Soil microbial biomass and activity in tropical riparian forests. Soil Biol. Biochem. 2001, 33, 339–348. [Google Scholar] [CrossRef]
  16. Zeng, D.H.; Hu, Y.L.; Chang, S.X.; Fan, Z.P.; Li, Y.L. Land cover change effects on soil chemical and biological properties after planting Mongolian pine (Pinus sylvestris var. mongolica) in sandy lands in Keerqin, northeastern China. Plant Soil 2009, 317, 121–133. [Google Scholar] [CrossRef]
  17. Burton, J.; Chen, C.R.; Xu, Z.H.; Mathers, N.J.; Xu, D.Z. Gross nitrogen transformations in adjacent native and plantation forests of subtropical Australia. Soil Biol. Biochem. 2007, 39, 426–433. [Google Scholar] [CrossRef]
  18. Liu, S.R.; Li, X.M.; Niu, L.M. The degradation of soil fertility in pure larch plantations in the northeastern of China. Ecol. Eng. 1998, 10, 75–86. [Google Scholar] [CrossRef]
  19. Behera, N.; Sahani, U. Soil microbial biomass and activity in response to Eucalyptus plantation and natural regeneration on tropical soil. For. Ecol. Manag. 2003, 174, 1–11. [Google Scholar] [CrossRef]
  20. Singh, M.K.; Ghoshal, N. Variation in soil microbial biomass in the dry tropics: Impact of land-use change. Soil Res. 2014, 52, 299–306. [Google Scholar] [CrossRef]
  21. Hua, F.; Bruijnzeel, L.A.; Meli, P.; Martin, P.A.; Zhang, J.; Nakagawa, S.; Miao, X.; Wang, W.; McEvoy, C.; Peña-Arancibia, J.L.; et al. The biodiversity and ecosystem service contributions and trade-offs of forest restoration approaches. Science 2022, 376, 839–844. [Google Scholar] [CrossRef]
  22. Rousk, J.; Baath, E.; Brookes, P.C. Soil bacterial and fungal communities across a pH gradient in an arable soil. ISME J. 2010, 4, 1340–1351. [Google Scholar] [CrossRef] [PubMed]
  23. Fierer, N.; Jackson, R. The diversity and biogeography of soil bacterial communities. Proc. Natl. Acad. Sci. USA 2006, 103, 626–631. [Google Scholar] [CrossRef] [PubMed]
  24. Liang, G.H.; Wu, P.; Xiong, X.; Wu, X.Y.; Chu, G.W. Responses of Soil pH Value and Soil Microbial Biomass Carbon and Nitrogen to Simulated Acid Rain in Three Successional Subtropical Forests at Dinghushan Nature Reserve. Ecol. Environ. Sci. 2015, 24, 911–918. [Google Scholar]
  25. Griffiths, R.I.; Thomson, B.C.; James, P.; Bell, T.; Bailey, M.J. The bacterial biogeography of British soils. Environ. Microbiol. 2011, 13, 1642–1654. [Google Scholar] [CrossRef]
  26. Xiao, R.H.; Man, X.L.; Ding, L.Z. Effects of slope position on soil microbial biomass carbon and nitrogen in natural Pinus sylvestris var. mongolia forest in the cold temperature zone. J. Beijing For. Univ. 2020, 42, 31–39. [Google Scholar]
  27. Day, M.Y.; Chuang, W.C. The contribution of soil organic matter fractions to carbon and nitrogen mineralization and microbial community size and structure. Soil Biol. Biochem. 2016, 37, 1726–1737. [Google Scholar]
  28. Li, H.; Liu, J.; Yang, L.; Zheng, H.; Zhang, J. Effects of simulated climate warming on soil microbial biomass carbon, nitrogen and phosphorus of alpine forest. Chin. J. Appl. Environ. Biol. 2016, 22, 426–432. [Google Scholar]
  29. Pan, F.J.; Zhang, W.; Liang, Y.M.; Liu, S.J.; Wang, K.L. Increased associated effects of topography and litter and soil nutrients on soil enzyme activities and microbial biomass along vegetation successions in karst ecosystem, southwestern China. Environ. Sci. Pollut. Res. 2018, 25, 16979–16990. [Google Scholar] [CrossRef] [PubMed]
  30. Daniel, C.S.; Matthew, G.B.; James, M.B.; Linda, L.K. Plant community richness and microbial interactions structure bacterial communities in soil. Ecol. A Publ. Ecol. Soc. Am. 2015, 96, 134–142. [Google Scholar]
  31. Sugihara, S.; Funakawa, S.; Kilasara, M.; Kosaki, T. Effect of land management and soil texture on seasonal variations in soil microbial biomass in dry tropical agroecosystems in Tanzania. Appl. Soil Ecol. 2010, 44, 80–88. [Google Scholar] [CrossRef]
  32. Endreny, T.A. Strategically growing the urban forest will improve our world. Nat. Commun. 2018, 9, 1160. [Google Scholar] [CrossRef] [PubMed] [Green Version]
  33. Cheng, H.M.; Tang, G.G. Characteristics of the deciduous broad-leaf forest of Tilia breviradiata in the hill terrain of Dashushan Mountain. J. Nanjing For. Univ. (Nat. Sci. Ed.) 2009, 033, 35–40. [Google Scholar]
  34. Cheng, H.M. Geographical composition of vascular plants in Dashu mountain in Hefei, Anhui province. Plant Sci. J. 2011, 29, 288–295. [Google Scholar]
  35. Cheng, H.M.; Tian, K.; Tian, X.J. Species diversity in successional communities of vegetation in isolated island-liked hilly fragment of Dashu Mountain in Hefei, Anhui. Chin. J. Ecol. 2015, 34, 1830–1837. [Google Scholar]
  36. Zhang, Y.Q.; Hou, L.Y.; Li, Z.C.; Zhao, D.X.; Song, L.G.; Shao, G.D.; Ai, J.J.; Sun, Q.W. Leguminous supplementation increases the resilience of soil microbial community and nutrients in Chinese fir plantations. Sci. Total Environ. 2020, 703, 134917.1–134917.11. [Google Scholar] [CrossRef]
  37. Su, D.H.; Zhou, J.W.; Yin, Z.C.; Feng, H.B.; Zheng, X.M.; Han, X.; Hou, Q.Q. A calculation method of unsaturated soil water content based on thermodynamic equilibrium. Hydrol. Earth Syst. Sci. 2023, 44, 1–12. [Google Scholar]
  38. Wu, J.; Joergensen, R.G.; Pommerening, B. Measurement of soil microbial biomass C by fumigation-extraction—An automated procedure. Soil Biol. Biochem. 1990, 22, 1167–1169. [Google Scholar] [CrossRef]
  39. Vance, E.D.; Brooks, P.C.; Jenkinson, D.S. An Extraction Method for Measuring Soil Microbial Biomass. Soil Biol. Biochem. 1987, 19, 703–707. [Google Scholar] [CrossRef]
  40. Brookes, P.C.; Landman, A.; Pruden, G.; Jenkonson, D.S. Chloroform fumigation and release of soil N: A rapid direct extraction method to measure microbial biomass N in soil. Soil Biol. Biochem. 1985, 17, 837–842. [Google Scholar] [CrossRef]
  41. Snow, G.L. ggplot2: Elegant Graphics for Data Analysis. Am. Stat. 2011, 65, 204. [Google Scholar]
  42. Oksanen, J.; Blanchet, F.G.; Kindt, R.; Legendre, P.; Minchin, P.R.; O'Hara, B.; Simpson, G.L.; Solymos, P.; Stevens, H.; Wagner, H.H. Vegan: Community Ecology Package. R Package Version 2.2-1 2015. [Google Scholar]
  43. Li, Y.; Zhao, Y.; Li, Y.; Wang, X.; Li, C. Effects of afforestation on soil properties in China: A meta-analysis. Land Use Policy 2018, 76, 52–61. [Google Scholar]
  44. Wang, H.; Wang, W.; Zhang, B.; Yang, G.; Wang, X. Effects of long-term reforestation on soil properties in the Loess Plateau, China. Forests 2019, 10, 28. [Google Scholar]
  45. Zhang, Y.; Zhao, Y.; Liu, J.; Wang, Y.; Li, S. Coniferous plants affect soil acidification and nutrient cycling in a subtropical forest ecosystem. For. Ecol. Manag. 2021, 491, 119179. [Google Scholar]
  46. Liu, Z.; Li, Y.; Li, X.; Zhang, X. Effects of vegetation type on soil acidification in the mid-subtropical region of China. Catena 2019, 177, 252–259. [Google Scholar]
  47. Ding, L.; Wang, X.; Wang, L.; Wang, H.; Guan, D. Effects of vegetation type and forest age on soil water-holding capacity in the Loess Plateau of China. Forests 2018, 9, 537. [Google Scholar]
  48. Liu, J.; Zhang, Y.; Wang, Y.; Li, S.; Zhao, Y. Effects of vegetation type on soil water content and water use efficiency in a subtropical forest ecosystem. J. For. Res. 2020, 31, 2283–2294. [Google Scholar]
  49. Jia, M.; Liu, J.; Zhang, Y.; Wang, Y.; Li, S. Comparison of soil carbon and nitrogen characteristics in different forest types in a subtropical region of China. For. Ecol. Manag. 2019, 451, 117530. [Google Scholar]
  50. Zhang, Y.; Zhao, Y.; Wang, Y.; Li, S.; Liu, J. Effect of vegetation type on soil organic carbon and total nitrogen stocks in a subtropical f49orest ecosystem. Catena 2019, 173, 445–453. [Google Scholar]
  51. Liu, J.; Zhang, Y.; Wang, Y.; Li, S.; Zhao, Y. Effects of vegetation type on soil nutrient content and stoichiometry in a subtropical forest ecosystem. For. Ecol. Manag. 2017, 391, 9–17. [Google Scholar]
  52. Wang, Y.; Liu, X.S.; Chen, F.F.; Huang, R.L.; Deng, X.J.; Jiang, Y. Seasonal dynamics of soil microbial biomass C and N of Keteleeria fortune var. cyclolepis forests with different ages. J. For. Res. 2020, 31, 2377–2384. [Google Scholar] [CrossRef] [Green Version]
  53. Farooq, T.H.; Chen, X.; Shakoor, A.; Rashid, M.H.U.; Kumar, U.; Alhomrani, M.; Alamri, A.S.; Ravindran, B.; Yan, W. Unraveling the Importance of Forest Structure and Composition Driving Soil Microbial and Enzymatic Responses in the Subtropical Forest Soils. Forests 2022, 13, 1535. [Google Scholar] [CrossRef]
  54. Yang, K.; Zhang, Y.; Liu, J.; Zhang, Q. Relationships between soil microbial biomass and soil properties in different forest types in the Qinling Mountains. Ecol. Indic. 2018, 85, 1050–1057. [Google Scholar]
  55. Zhang, H.; Liu, J.; Guo, D.; Chen, H.; Wang, F.; Li, X. Soil microbial biomass and community structure vary across different forest types in Northeast China. For. Ecol. Manag. 2019, 432, 651–661. [Google Scholar]
  56. Zhang, Y.; Li, X.; Liu, J.; Yang, K.; Wang, G. Soil microbial biomass and its relationship with soil properties in different forest types in the Loess Plateau, China. Ecol. Indic. 2021, 121, 107147. [Google Scholar]
Figure 1. A schematic representation of the study area in Shushan Urban Forest Park and the location of field sites. The sampling sites were Pinus massoniana (PM), Quercus acutissima (QA), Liquidambar formosana (LF), and secondary deciduous broadleaved forest (DB).
Forests 14 01498 g001
Figure 2. Soil microbial biomass carbon (MBC) and nitrogen (MBN) in four forest stands during the growing and dormant seasons. (a) MBC in the growing season; (b) MBN in the growing season; (c) MBC in the dormant season; (d) MBN in the dormant season. PM, Pinus massoniana, QA, Quercus acutissima, LF, Liquidambar formosana, DB, secondary deciduous broadleaved forest. The error bars in the figure represent standard deviations (SD) of the mean values. The letters a, b, and c above the bars indicate significant differences (p < 0.05) between groups, with different letters indicating significant differences between means.
Forests 14 01498 g002
Figure 3. Linear relationships between soil physicochemical properties and soil MBC in the Pinus massoniana planation. (a) pH; (b) EC; (c) SWC; (d) SOC; (e) TN; (f) TP. The solid line represents the regression line of all the data points from all seasons. The dashed line represents the regression line of the data points from the growing season. The gray dashed line represents the regression line of the data points from the dormant season. The open circles represent the data points from the growing season. The solid circles represent the data points from the dormant season. The correlation coefficient (r) and p-value for the first row represent all seasons’ data, while the second and third rows represent the growing and dormant seasons’ data, respectively. EC, Electrical conductivity; SWC, Soil water content; SOC, Soil organic carbon; TN, Total nitrogen; TP, Total phosphorus.
Forests 14 01498 g003
Figure 4. Linear relationships between soil physicochemical properties and soil MBN in Pinus massoniana planation. (a) pH, (b) EC, (c) SWC, (d) SOC, (e) TN, and (f) TP. The solid line represents the regression line of all the data points from all seasons. The dashed line represents the regression line of the data points from the growing season. The gray dashed line represents the regression line of the data points from the dormant season. The open circles represent the data points from the growing season. The solid circles represent the data points from the dormant season. The correlation coefficient (r) and p-value for the first row represent all seasons’ data, while the second and third rows represent the growing and dormant seasons’ data, respectively. EC, Electrical conductivity; SWC, Soil water content; SOC, Soil organic carbon; TN, Total nitrogen; TP, Total phosphorus.
Forests 14 01498 g004
Figure 5. Ordination plot of the results from the redundancy analysis (RDA). (a) The growing season; (b) The dormant season. The plot was used to explore the relationships between selected soil physicochemical properties and soil microbial biomass carbon (MBC) and nitrogen (MBN). The primary factors for the variables of the soil’s physicochemical properties are represented by arrows. Solid circles for Pinus massoniana (PM), darker gray fill for Quercus acutissima (QA), lighter gray fill for Liquidambar formosana (LF), and lightest gray fill for secondary deciduous broadleaved forest (DB). The triangles and squares also follow a similar pattern.
Forests 14 01498 g005
Table 1. Basic condition of plots of four vegetation types.
QuadratElevation (m)Longitude
(°)
Latitude
(°)
Slope
Aspect
Mean DBH 1
(cm)
Mean Tree
Height (m)
Dominant Species
P. massoniana (PM)258117.1882531.84305Southeast24.62 ± 4.3728.24 ± 3.67Pinus massoniana Lamb.
Broussonetia papyrifera (Linn.) L'Hér. ex Vent.
Cudrania tricuspidata (Carr.) Bur.
Q. acutissima
(QA)
194117.1888531.84830Northeast38.15 ± 5.9727.54 ± 3.23Quercus acutissima Carruth.
Broussonetia papyrifera (Linn.) L'Hér. ex Vent.
L. formosana (LF)217117.1887931.85080Northeast25.63 ± 10.5428.36 ± 8.16Liquidambar formosana Hance
Sapium sebiferum (L.) Roxb.
secondary decidu-ous broadleaved forest (DB)226117.1877031.85227Northeast14.44 ± 4.3510.29 ± 3.04Celtis sinensis Pers.
Cudrania tricuspidata (Carr.) Bur.
Broussonetia papyrifera (Linn.) L'Hér. ex Vent.
1 DBH is the diameter at breast height. Pinus massoniana (PM), Quercus acutissima (QA), Liquidambar formosana (LF), and secondary deciduous broadleaved forest (DB).
Table 2. Soil physicochemical properties in four urban forest types in the growing season.
Soil Layer (cm)Forest TypepHEC (µS/cm)SWC (%)SOC (g/kg)TN (g/kg)TP (mg/kg)
0–10PM5.07 ± 0.64 ab80.25 ± 42.51 ab23.08 ± 7.89 b26.61 ± 11.41 b1.68 ± 0.67 b0.22 ± 0.12 a
QA4.37 ± 0.34 c108.23 ± 82.88 a25.02 ± 3.66 b35.21 ± 11.31 a2.38 ± 0.62 a0.21 ± 0.04 a
LF5.03 ± 0.48 b76.67 ± 33.92 b28.68 ± 4.70 a20.38 ± 9.55 c1.36 ± 0.53 c0.15 ± 0.06 b
DB5.55 ± 0.55 a96.93 ± 49.00 ab30.28 ± 5.13 a23.39 ± 8.29 bc1.89 ± 0.49 b0.20 ± 0.05 a
10–20PM5.34 ± 0.53 a54.67 ± 29.08 b26.50 ± 7.85 bc17.31 ± 8.50 b1.26 ± 0.54 b0.21 ± 0.16 a
QA4.58 ± 0.49 b103.96 ± 96.34 a23.73 ± 3.61 c21.35 ± 7.68 a1.54 ± 0.39 a0.17 ± 0.04 ab
LF5.27 ± 0.56 a60.60 ± 17.72 b27.54 ± 4.76 ab14.20 ± 4.48 b1.07 ± 0.32 b0.15 ± 0.08 b
DB5.60 ± 0.54 a75.18 ± 26.46 b29.31 ± 4.60 a17.41 ± 4.33 b1.56 ± 0.26 a0.18 ± 0.05 ab
20–30PM5.57 ± 0.49 ab59.20 ± 20.93 b29.28 ± 7.77 a14.81 ± 6.58 b1.14 ± 0.41 b0.18 ± 0.12 a
QA4.88 ± 0.51 c81.31 ± 51.56 a25.08 ± 4.91 b19.36 ± 8.29 a1.42 ± 0.41 a0.18 ± 0.13 a
LF5.49 ± 0.51 b62.39 ± 15.84 b28.16 ± 4.98 a12.23 ± 4.10 b0.98 ± 0.30 b0.13 ± 0.06 b
DB5.83 ± 0.48 a72.56 ± 29.33 ab30.61 ± 5.63 a15.01 ± 4.46 b1.50 ± 0.53 a0.16 ± 0.04 ab
Note: The values are the mean values and standard deviations (SD) of the samples. The use of different letters to denote different groups indicates significant differences between their means at a significance level of p < 0.05. EC, Electrical conductivity; SWC, Soil water content; SOC, Soil organic carbon; TN, Total nitrogen; TP, Total phosphorus. PM, Pinus massoniana, QA, Quercus acutissima, LF, Liquidambar formosana, DB, secondary deciduous broadleaved forest.
Table 3. Impact of forest types and soil layers on soil properties and microbial biomass.
FactorGrowing SeasonDormant Season
DepthForest TypeDepth × Forest TypeDepthForest TypeDepth × Forest Type
FpFpFpFpFpFp
pH15.0830.000
***
51.2850.000
***
0.2730.94911.2870.000
***
37.1520.000
***
0.5110.799
Electrical
Conductivity (EC)
9.2780.000
***
21.4880.000
***
1.1570.3321.2090.3013.9740.009
**
0.7940.576
Soil water content (SWC)1.1690.31312.7430.000
***
0.6710.6731.10.3350.8640.4610.9750.444
Soil organic carbon (SOC)40.6390.000
***
7.7270.000
***
1.3630.2324.0280.02 *2.8090.041 *0.8230.554
Total nitrogen
(TN)
39.6680.000
***
17.10.000
***
1.4930.18315.2120.000
***
31.8070.000
***
0.1980.977
Total phosphorus (TP)2.8740.05942.4260.000
***
1.1170.3546.2060.003
**
28.5480.000
***
0.2860.943
Microbial biomass carbon (MBC)29.8130.000
***
31.0870.000
***
1.7660.1092.3720.0966.4540.000
***
1.6990.124
Microbial biomass nitrogen (MBN)33.9640.000
***
7.3590.000
***
5.3260.000
***
13.5950.000
***
22.7890.000
***
3.8120.001
***
Note: Signif. codes: ‘***’ 0.001 ‘**’ 0.01 ‘*’ 0.05.
Disclaimer/Publisher’s Note: The statements, opinions and data contained in all publications are solely those of the individual author(s) and contributor(s) and not of MDPI and/or the editor(s). MDPI and/or the editor(s) disclaim responsibility for any injury to people or property resulting from any ideas, methods, instructions or products referred to in the content.

