Article

Precipitation Variations in China’s Altay Mountains Detected from Tree Rings Dating Back to AD 1615

1
Institute of Global Environmental Change, Xi’an Jiaotong University, Xi’an 710049, China
2
State Key Laboratory of Loess and Quaternary Geology, Institute of Earth Environment, Chinese Academy of Sciences, Xi’an 710061, China
3
CAS Center for Excellence in Quaternary Science and Global Change, Xi’an 710061, China
4
School of Human Settlements and Civil Engineering, Xi’an Jiaotong University, Xi’an 710049, China
*
Author to whom correspondence should be addressed.
Forests 2023, 14(7), 1496; https://doi.org/10.3390/f14071496
Submission received: 26 June 2023 / Revised: 12 July 2023 / Accepted: 18 July 2023 / Published: 21 July 2023
(This article belongs to the Special Issue Forest Climate Change Revealed by Tree Rings and Remote Sensing)

Abstract

:
As the primary mountain range in Central Asia, the Altay Mountains receive water vapor carried by westerly circulation, resulting in relatively abundant local precipitation and lush pastures in all seasons. Consequently, it has become one of the important transportation routes between Asia and Europe. The exploration of long-term variations in precipitation is meaningful for understanding the ebb and flow of the Asia–Europe steppe trade routes. However, previous dendroclimatological studies of the Altay Mountains focused more on temperature changes than precipitations variations. We carried out a 404-year precipitation reconstruction based on the tree rings of Siberian larch growing on the south slopes of the Altay Mountains, which could explain 45.9% of the variance observed in the February–October precipitation. Our reconstruction demonstrated some severe drought events which could be found in the historical documents, such as the drought in the late Ming Dynasty (1640s) and the Ding-Wu Disaster (1870s). The spatial correlation analysis, cross-wavelet spectrum and wavelet coherency analysis indicated that the precipitation variations in the study area may be related to the ENSO and NAO. This study presents a robust precipitation reconstruction of the southern Altay Mountains, serving as a reference for future research on large-scale climatic forces acting on Altay precipitation.

1. Introduction

Paleoclimatology is an essential support for comprehending future climate change scenarios. In addition to limited instrumental climate data, it is the only way to evaluate the accuracy of climate model predictions. Climate reconstruction frequently relies upon natural proxies such as tree rings, stalagmites, ice cores, etc. As commonly utilized proxy records, tree rings allow for the collection of long-term climatic data. The use of long-standing data allows us to estimate interannual, decadal and multi-decadal historical climate variability. In addition, these data serve as a reference for better comprehending the characteristics of current climate patterns and predicting future regional climates and the dynamic reactions of Earth’s systems to climate change. Due to their high resolution, wide dispersion, vast number of copies, reliable dating and ability to provide unambiguous and measurable signals of environmental change, tree rings have become an essential proxy index for climate change research. Different studies have involved extensive research in numerous world locations over the past several decades [1,2,3]. In addition to the reconstruction of regional climates, new attempts and progress have been made in the fields studying climate as a driving force for forest regeneration [4], El Niño–Southern Oscillation (ENSO) [5], sunspot activity [6] and spatial climate patterns [7]. Multiple climates constitute bridging zones between the Asian monsoon region and Central Asia’s mid- and high-latitude climate systems [8]. Due to this unique characteristic, Central Asia’s influence on climatic conditions extends beyond its geographic boundaries. Numerous mountain ranges and plateaus in the interior of Asia are covered with coniferous forests, which have a crucial role in the climates and environments of the planet [9]. The Altay Mountains are the most extensive range in Central Asia and are situated in the geographical heart of the Eurasian continent. In addition to their complicated physical geography and climate interactions, the Altay Mountains preserve several coniferous species in natural ecosystems. Some forests in the Altay Mountains are dominated by Siberian larch and spruce, which have high potential for the establishment of century-long tree ring width chronologies. Recent dendroclimatic reconstructions of Altay have relied heavily on these tree rings [10,11,12,13].
We reconstructed the precipitation variations during the region’s long-term history using Siberian larch samples and examined whether large-scale climatic circulations drive this variation. In order to meet this objective, we initially generated the chronology using the standard dendrochronological procedure and then reconstructed the precipitation utilizing instrumental data and a linear regression model. Then, we utilized spatial analysis to demonstrate the geographical representativeness of the reconstruction sequence and utilized spectral analysis to evaluate the sequence and discover whether it was associated with large-scale climatic circulations. Our study extended the region’s limited precipitation reconstruction chronology and demonstrated the precipitation distribution in the Altay Mountains from 1615 to 2018. This study’s explanation of the influence mechanism of precipitation fluctuation is more comprehensive than the explanations provided in other research in the Altay region. This could assist us in better comprehending the patterns of precipitation and drought in Inner Asia and its surrounding regions.

2. Materials and Methods

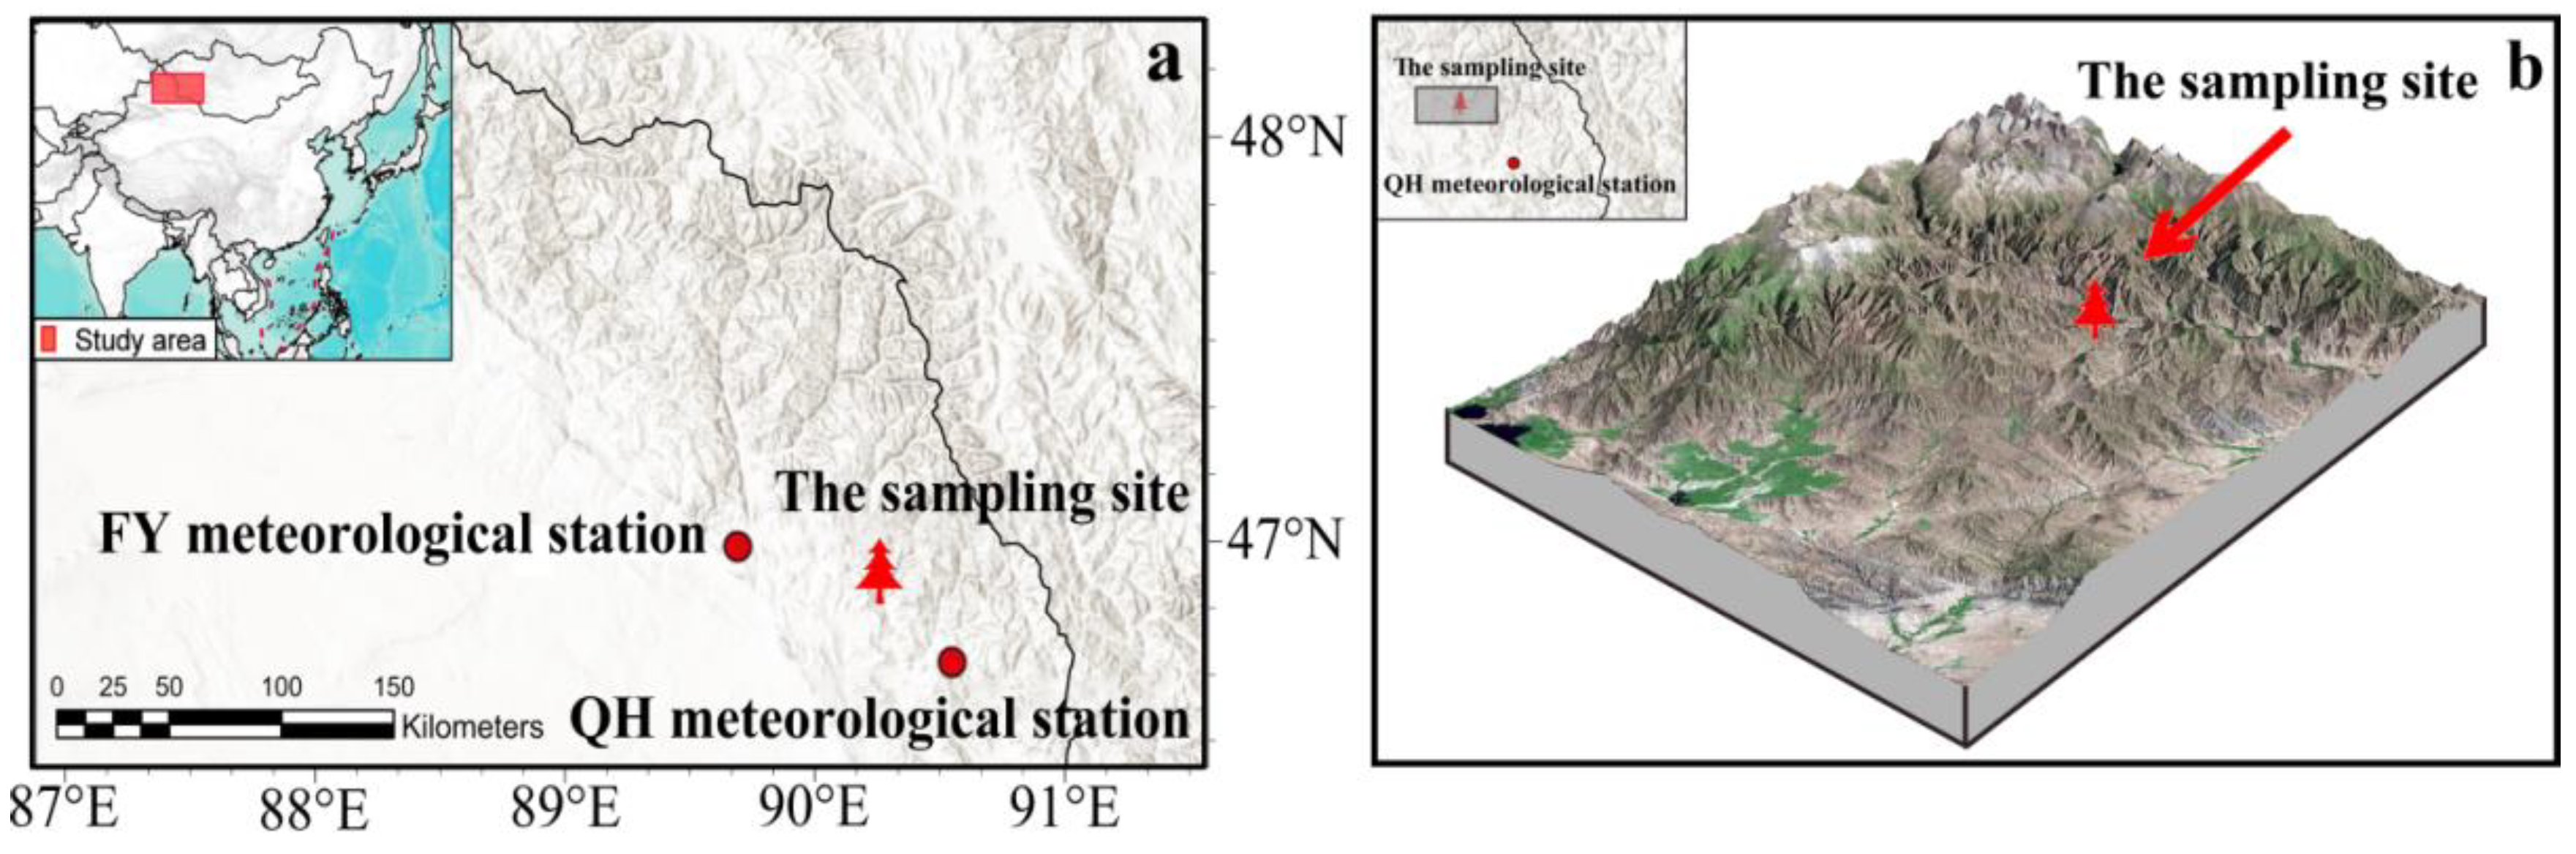
2.1. The Study Region and Sampling

This research was conducted in the Fuyun region of the southern Altay Mountains in northern Xinjiang, China (Figure 1a). The area has a typical continental, temperate, cold-zone climate. The westerly circulation carries moisture vapor from the Atlantic Ocean, which enters the mountains along the Irtysh River and Kazakhstan Zaisan Valley. The major climatic characteristics are windy springs and cool, dry summers. As the region is adjacent to the Siberian region of Mongolia and affected by the Asian High, the winter is cold and long. The annual average temperature in the Altay Mountains can drop below 4 °C, despite being above 4 °C in the plains and river valley. The sampling location is situated in a transition zone between the eastern mountains and western plains (Figure 1b). The annual average temperature is approximately 3 °C, July is the warmest month (mean temperature 21.9 °C). From November to March, it is winter, and January is the coldest month (mean temperature −21.1 °C). This region is obstructed by terrain and receives less precipitation, with an annual average of roughly 200 mm. Siberian larch is the dominant species in the forests of this region (46°57′ N, 90°09′ E, ~1752 m above sea level). At the termination of the 2018 growing period, twenty-five Siberian larch trees at the sampling site that were alive, dispersed, and showed old tree characteristics were selected for sampling. We extracted 50 cores using a 5 mm increment borer. The sampling site environment is not especially affected by humans and can reflect the natural climate conditions.

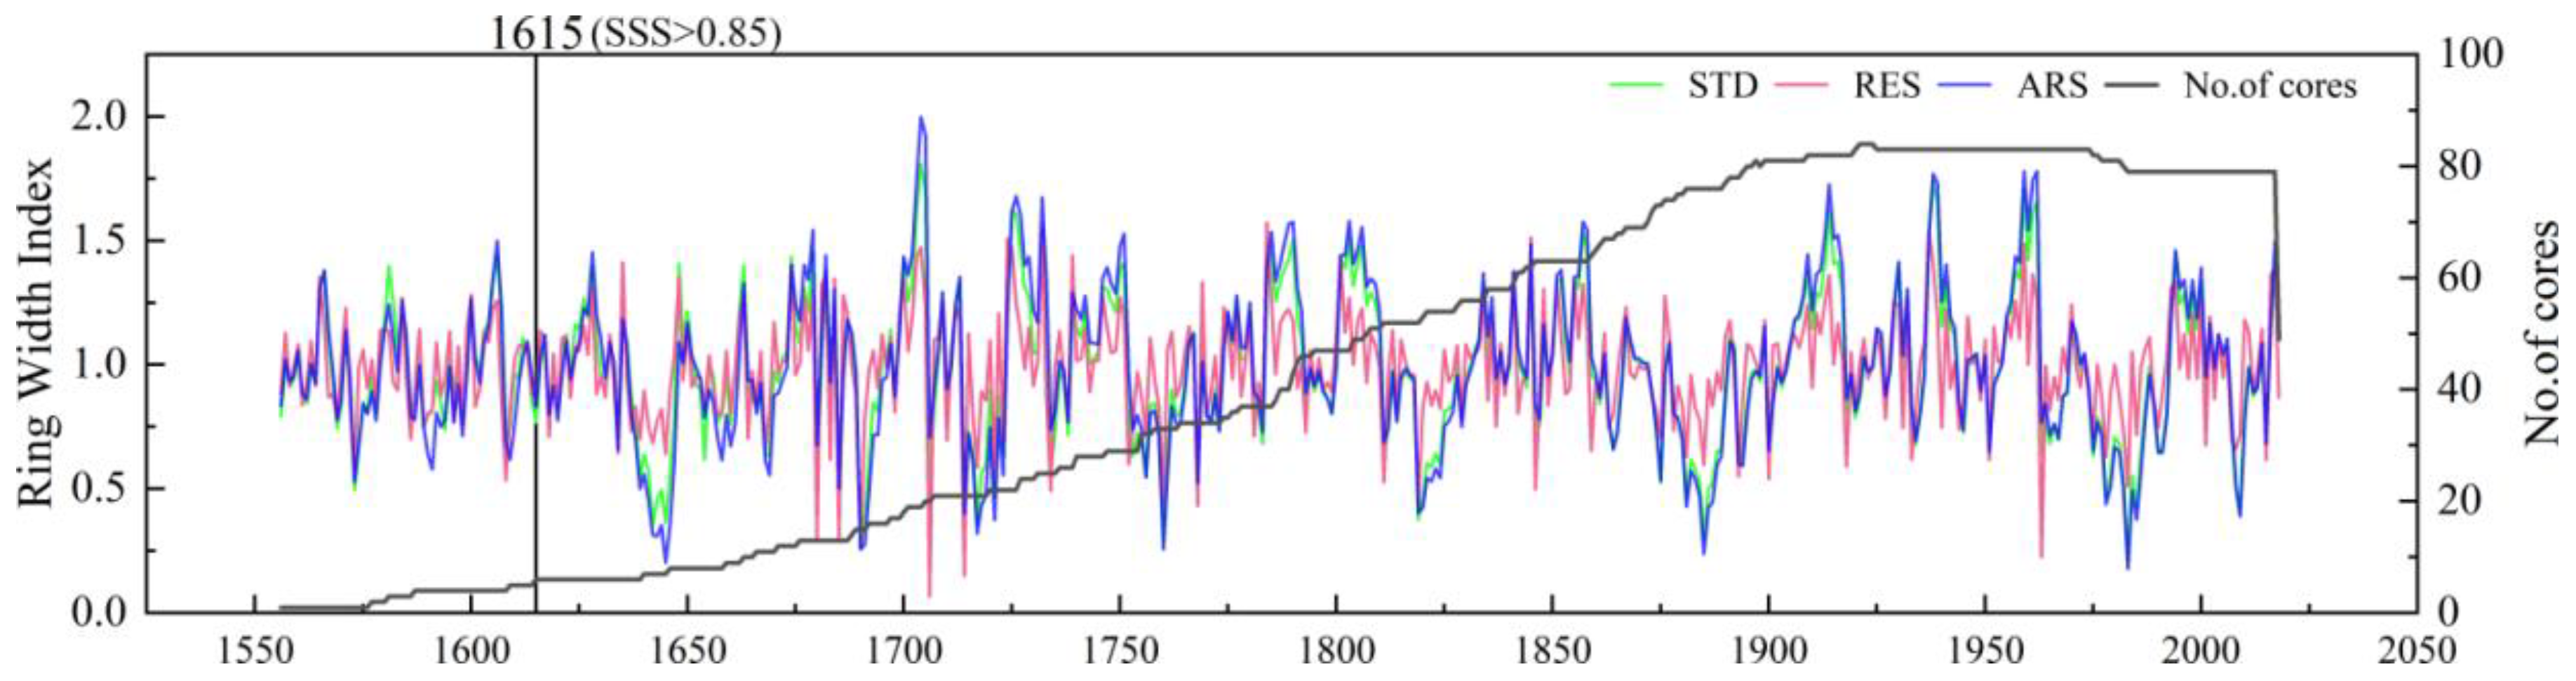
2.2. Tree Ring Width Chronology

Researchers took samples of tree rings back to the laboratory. During sample processing, we utilized a standard dendrochronological methodology [14,15]. The samples were initially affixed to wooden holders and left to air dry before being flattened with sandpaper to polish the tree rings. After being dried, mounted, and surfaced, the ring widths of the samples were analyzed, with an accuracy of 0.01 mm, using the LINTAB tree ring station. The COFECHA program was used to evaluate the cross-dating quality [16]. The data were then normalized using the ARSTAN program [17] based on the negative exponential function, used to eliminate age-related growth trends, while retaining the climate signal. In the fitting process, the sequence autocorrelation was removed, the influences of non-climate signals were eliminated, and the order of the autoregressive model was determined to build the optimal regression model.
The final chronology was produced by calculating the robust bi-weighted averages of yearly tree ring indices. According to the unstandardized tree ring width dataset, we extracted various dendrochronology-typical statistical features. The mean sensitivity (MS) is used to evaluate yearly change in tree ring width and is consequently employed to assess how effectively the chronology mirrors regional climatic variations [18]. The first-order autocorrelation coefficient (AC1) reveals the impact of growth from the previous year on current growth. The signal-to-noise ratio (SNR) is the ratio of climatic signals to other noises in the chronology, which reveals how much environmental information the sample expresses. The standard deviation (SD) reflects the amount of climate-related data contained in tree ring chronologies. The subsample signal strength (SSS) quantifies how closely the constructed chronology resembles the ideal one. The MS of the common period series for tree ring width is 0.306, showing that interannual fluctuation in tree ring width is relatively high and sensitive to climate change. The AC1 is 0.473, suggesting that the previous year’s climate delayed tree growth. Both the SD and SNR are relatively high. The above dendrochronology-typical statistical characteristics demonstrate that the chronology is reliable and provides a wealth of climate data. For reconstruction considerations, the cutoff for each record was the first year in which the subsample signal strength (SSS) was more than 0.85, a typical dendroclimatology threshold [19]. After 1615, the main chronology’s SSS is larger than 0.85. Thus, we constructed the standard (STD) chronology, residual (RES) chronology and Arstan (ARS) chronology, with a length of 404 (1615–2018) years (Figure 2).

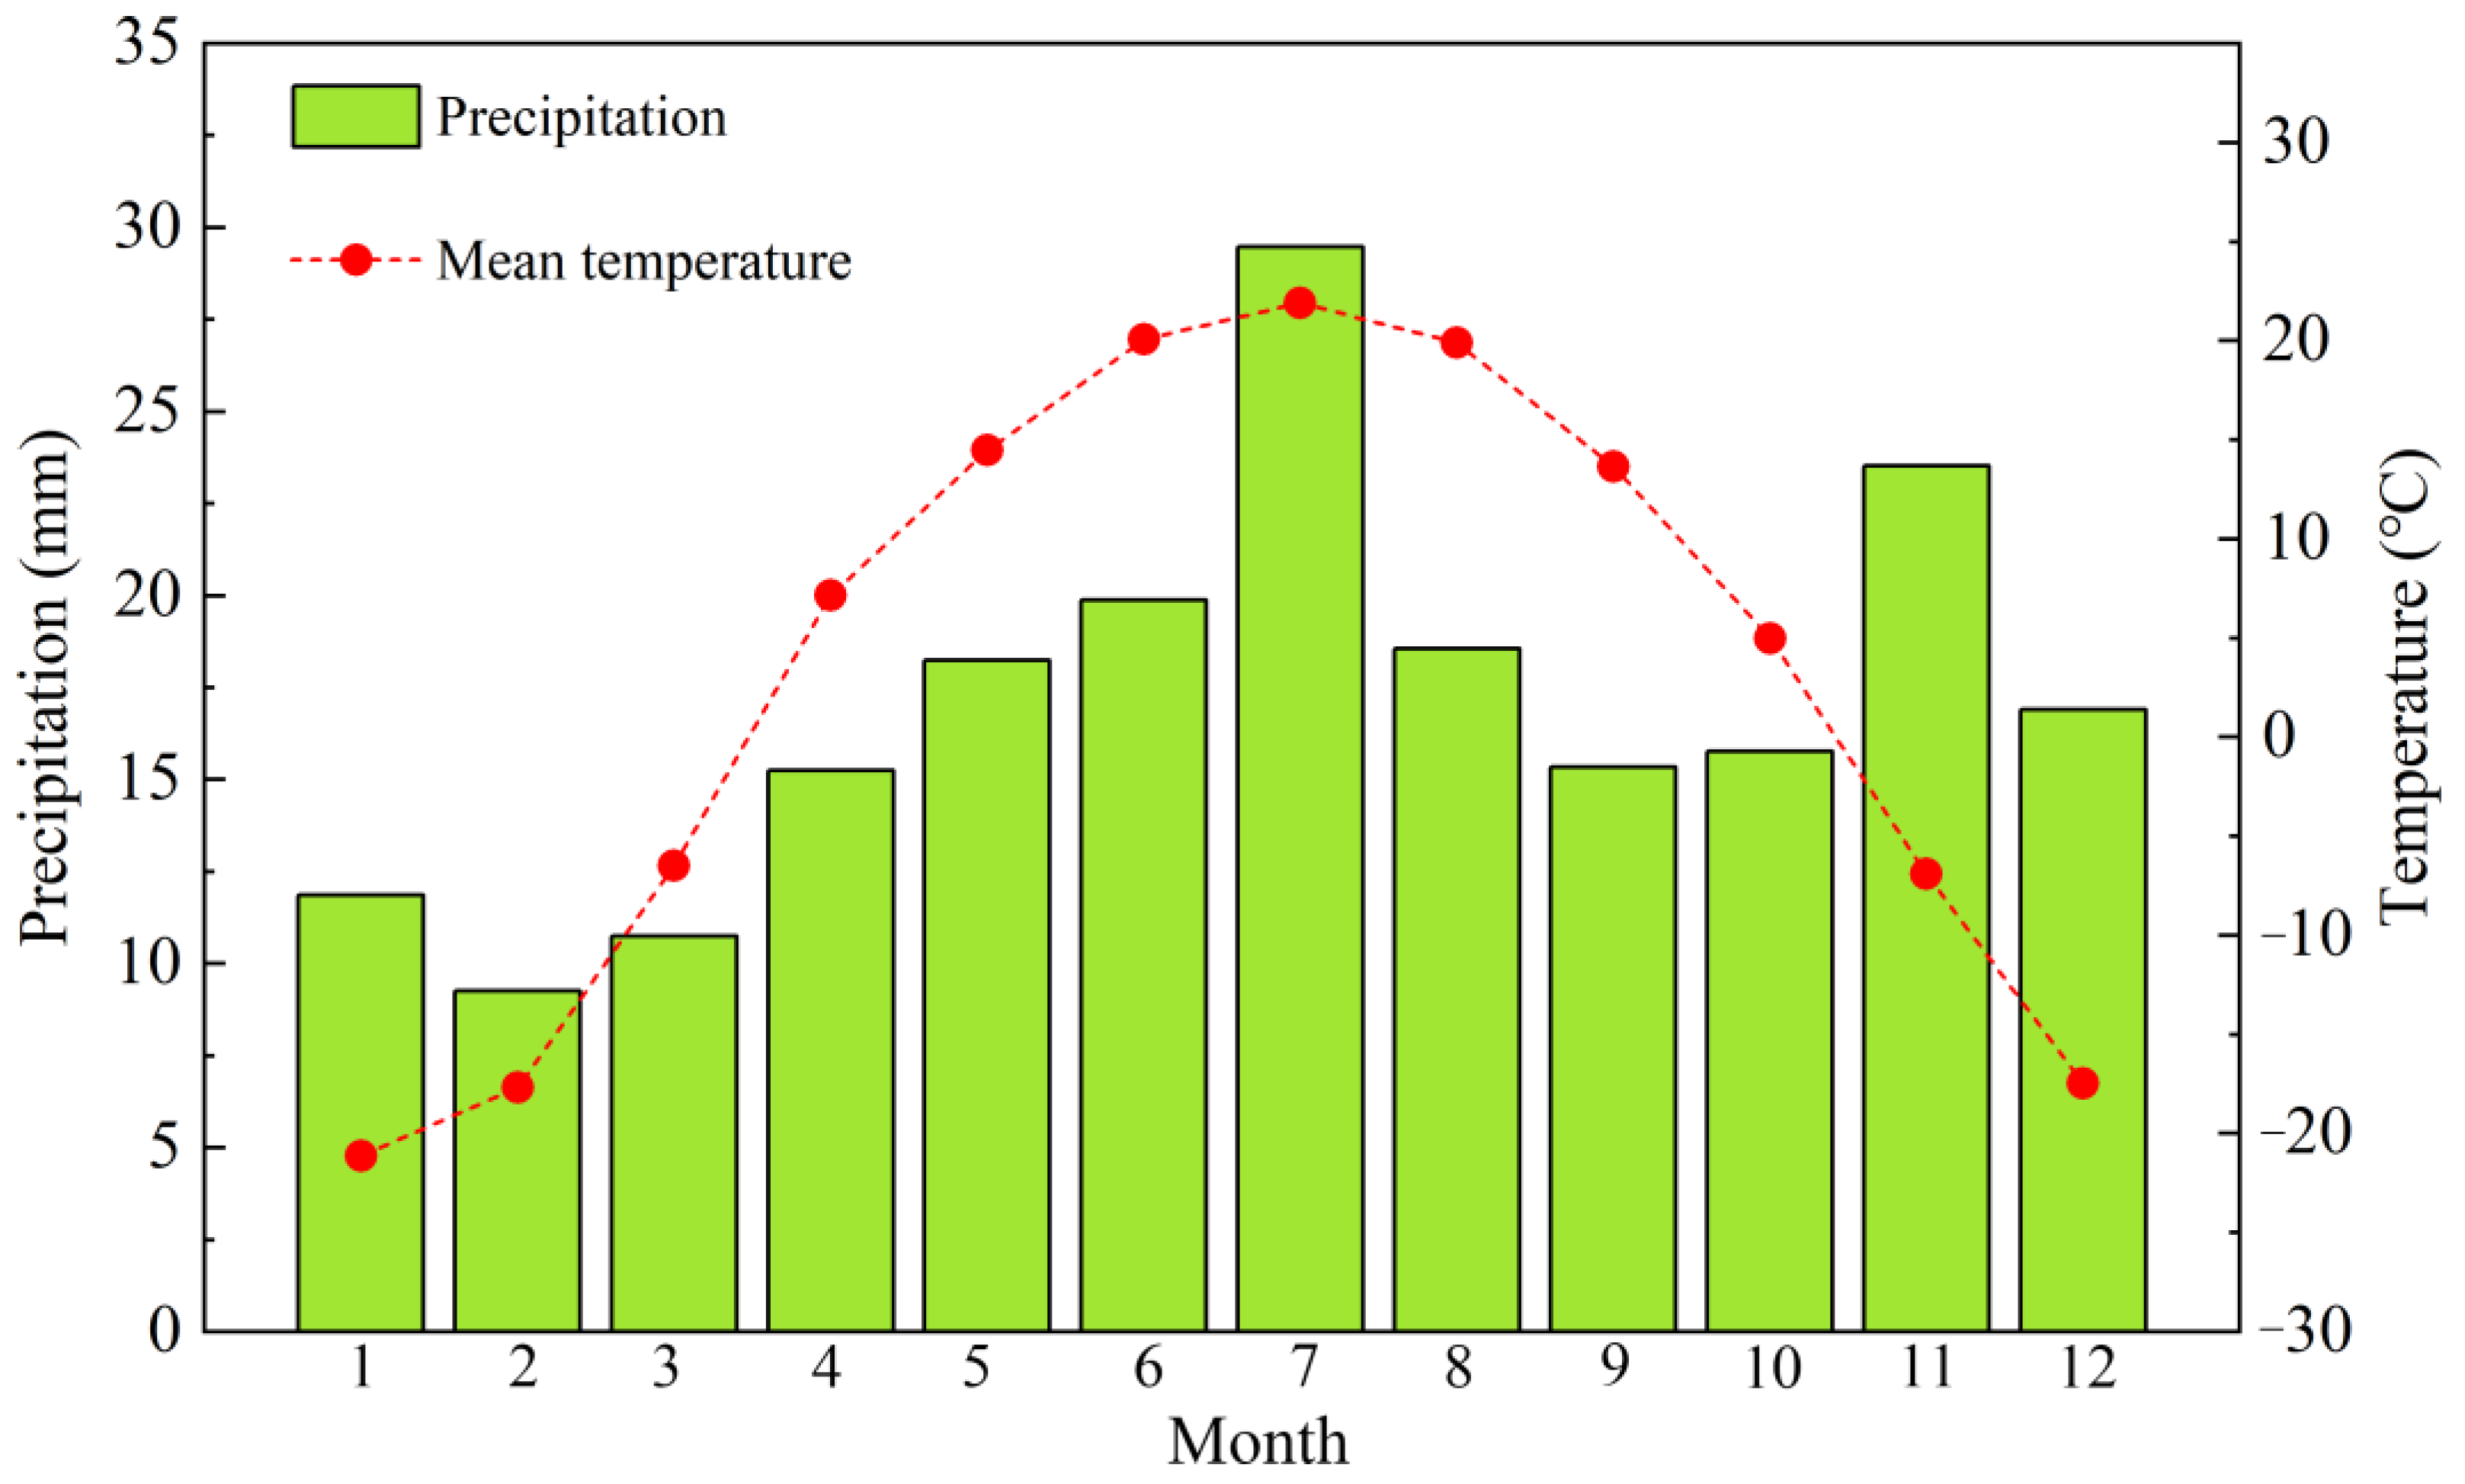
2.3. Meteorological Data and Statistical Analysis

The Fuyun climatological station is near the sampling site. The station’s instrumental climate records (1956–2016) were retrieved from the China National Climatic Data Center (http://data.cma.cn/ accessed on 15 March 2023). The climate records consist of monthly temperature and precipitation measurements (Figure 3). We conducted a correlation analysis between the tree ring width chronology and the instrumental data’s overlap period. The correlation analysis explored the response relationship between the meteorological data and tree ring width chronology from the January of the previous year to the October of the current growth year. Because the STD chronology had the strongest link with precipitation, as determined through our correlation analysis, it was chosen for further research. The rainfall of the southern Altay region was reconstructed using a single-variable linear regression model based on the STD chronology and meteorological data. Then, we verified the reconstruction model to ensure its dependability. Using the KNMI climate explorer (http://climexp.knmi.nl/ accessed on 17 March 2023), spatial correlations were performed between the reconstructed precipitation and the 0.5° resolution gridded February–October precipitation dataset from the Climate Research Unit (CRU TS4.01) for the period of 1901–2016 to illustrate that our reconstructed precipitation series reflects a wide range of precipitation variability. For the reconstruction sequence, we used the MultiTaper method (MTM) of spectral analysis [20] and Wavelet spectral analysis [21] to investigate whether large-scale climate forcings could have a potential influence on the reconstructed precipitation variations in the Altay region.

3. Results

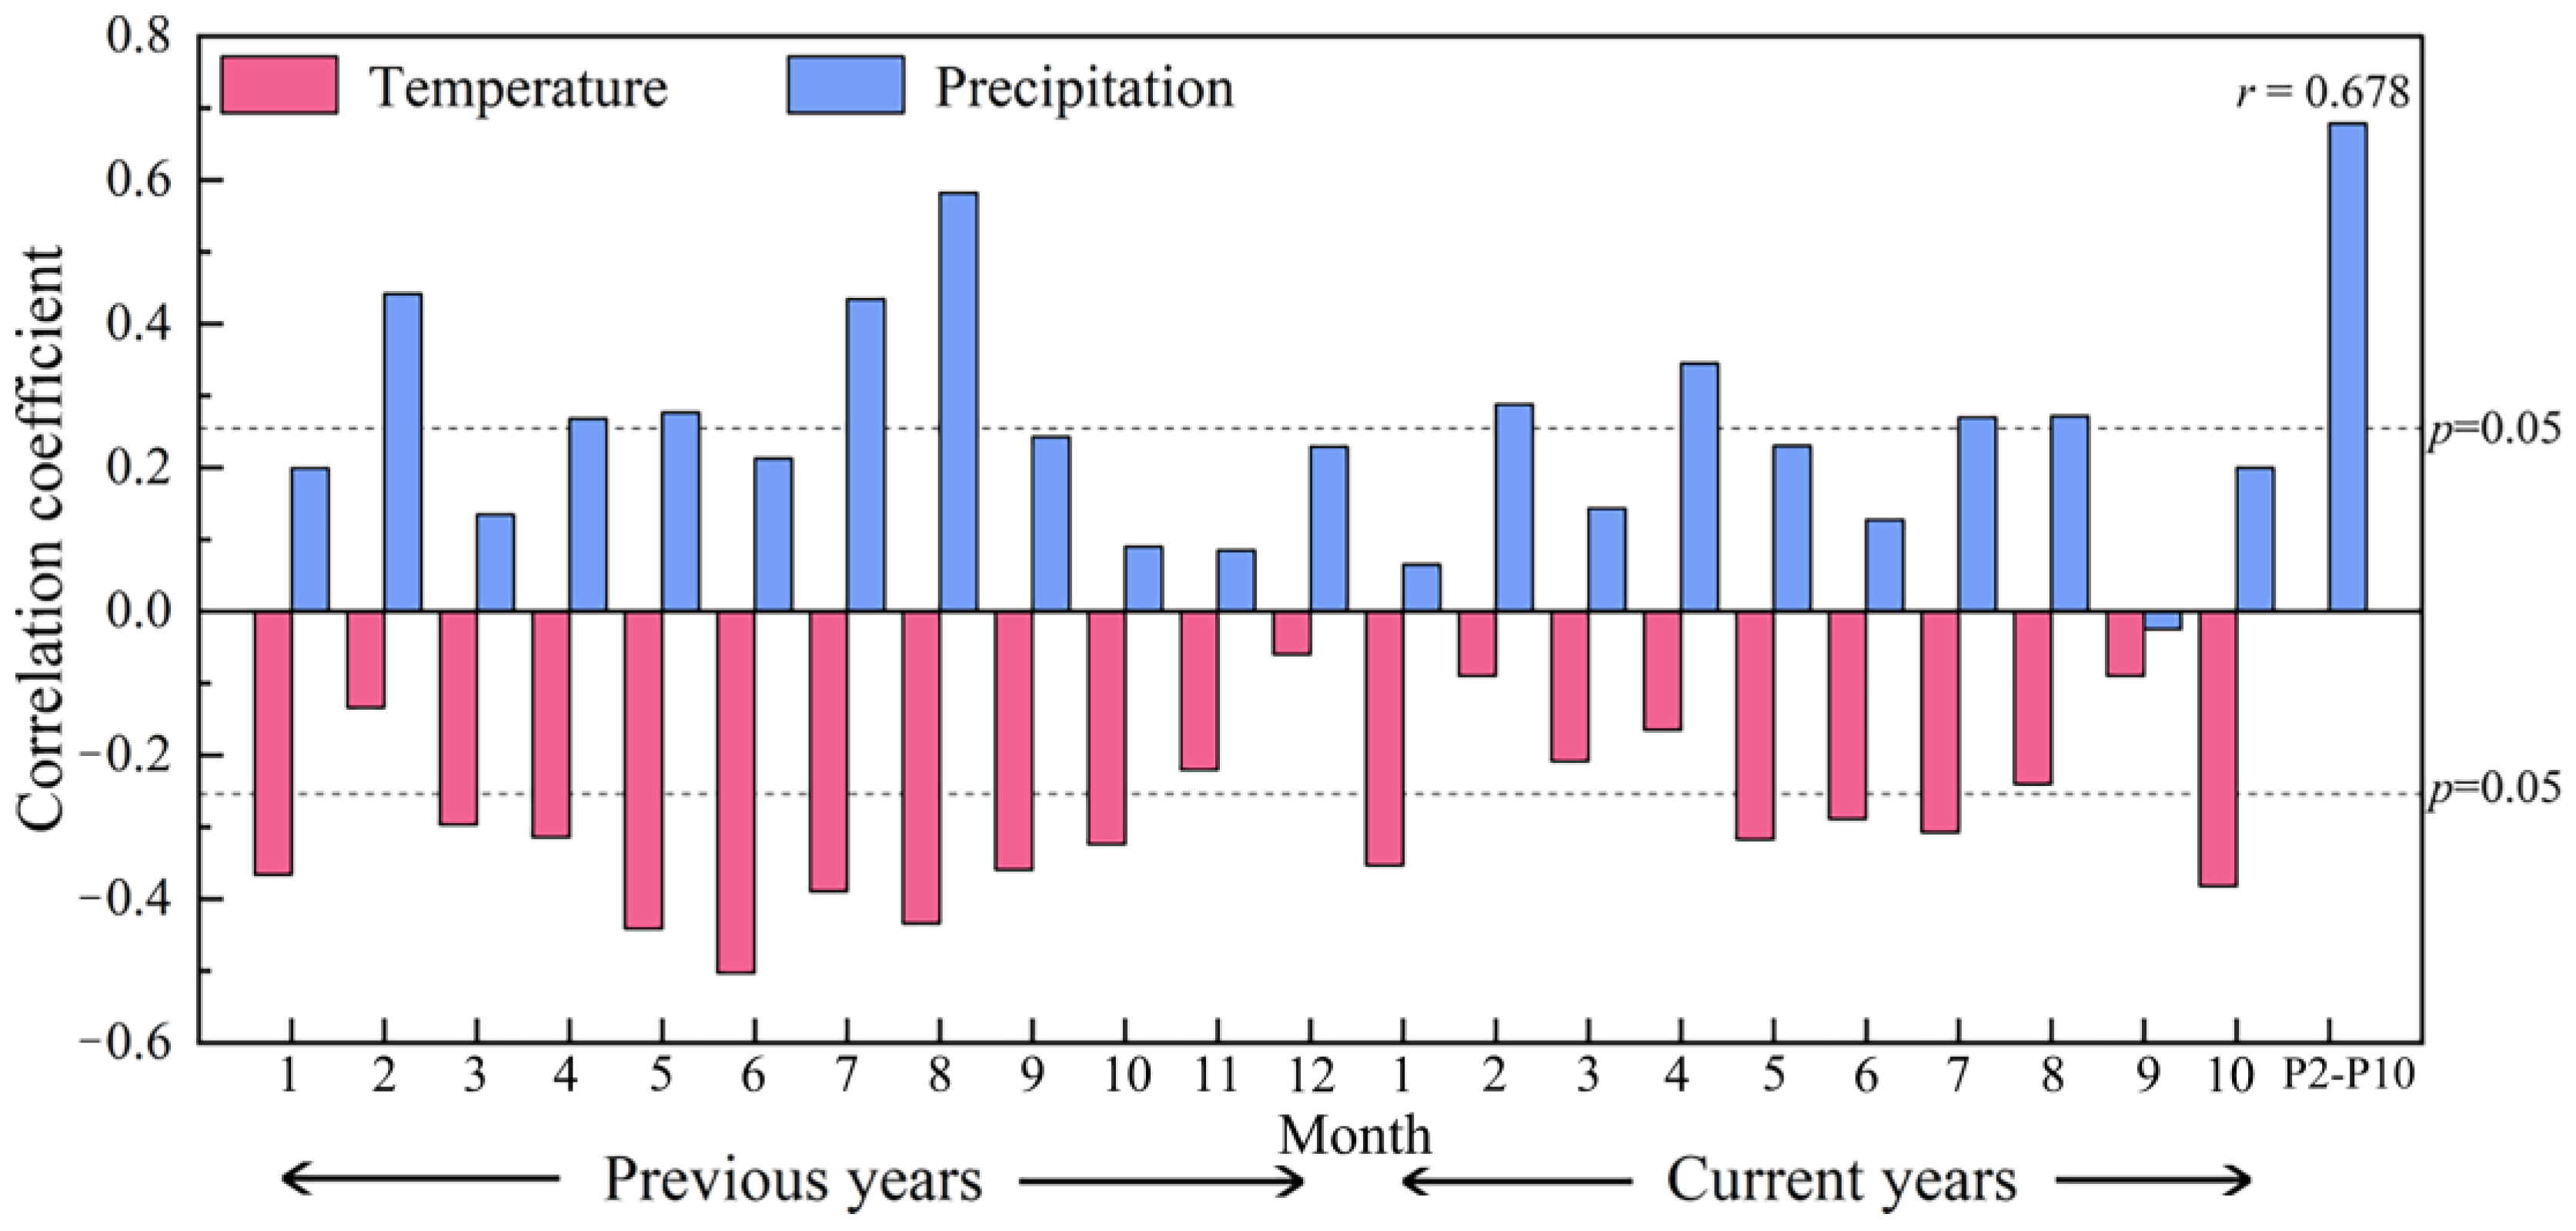
3.1. Climate Response Analysis

As demonstrated previously, the dependable chronology (SSS > 0.85) spans from 1615 to 2018 (Figure 2). On the basis of the instrumental data, the findings of climatic response studies revealed the correlation coefficients of monthly temperature and precipitation for tree ring STD chronology in the southern Altay Mountains (Figure 4). After a joint correlation analysis, the STD chronology was identified to have the highest correlation with the previous year of February–October precipitation (r = 0.678). The chronology has the highest correlation with the instrumental precipitation data, showing that precipitation is the most influential climatic control element for Siberian larch. The Siberian larch samples thrived on poor or rocky soils, leading to a limited capacity for water storage. This characteristic further explains the trees’ drought stress, causing heightened sensitivity to precipitation variations. In order to extend our reconstruction to a larger period, we finally chose the previous year of February–October precipitation as the appropriate object.

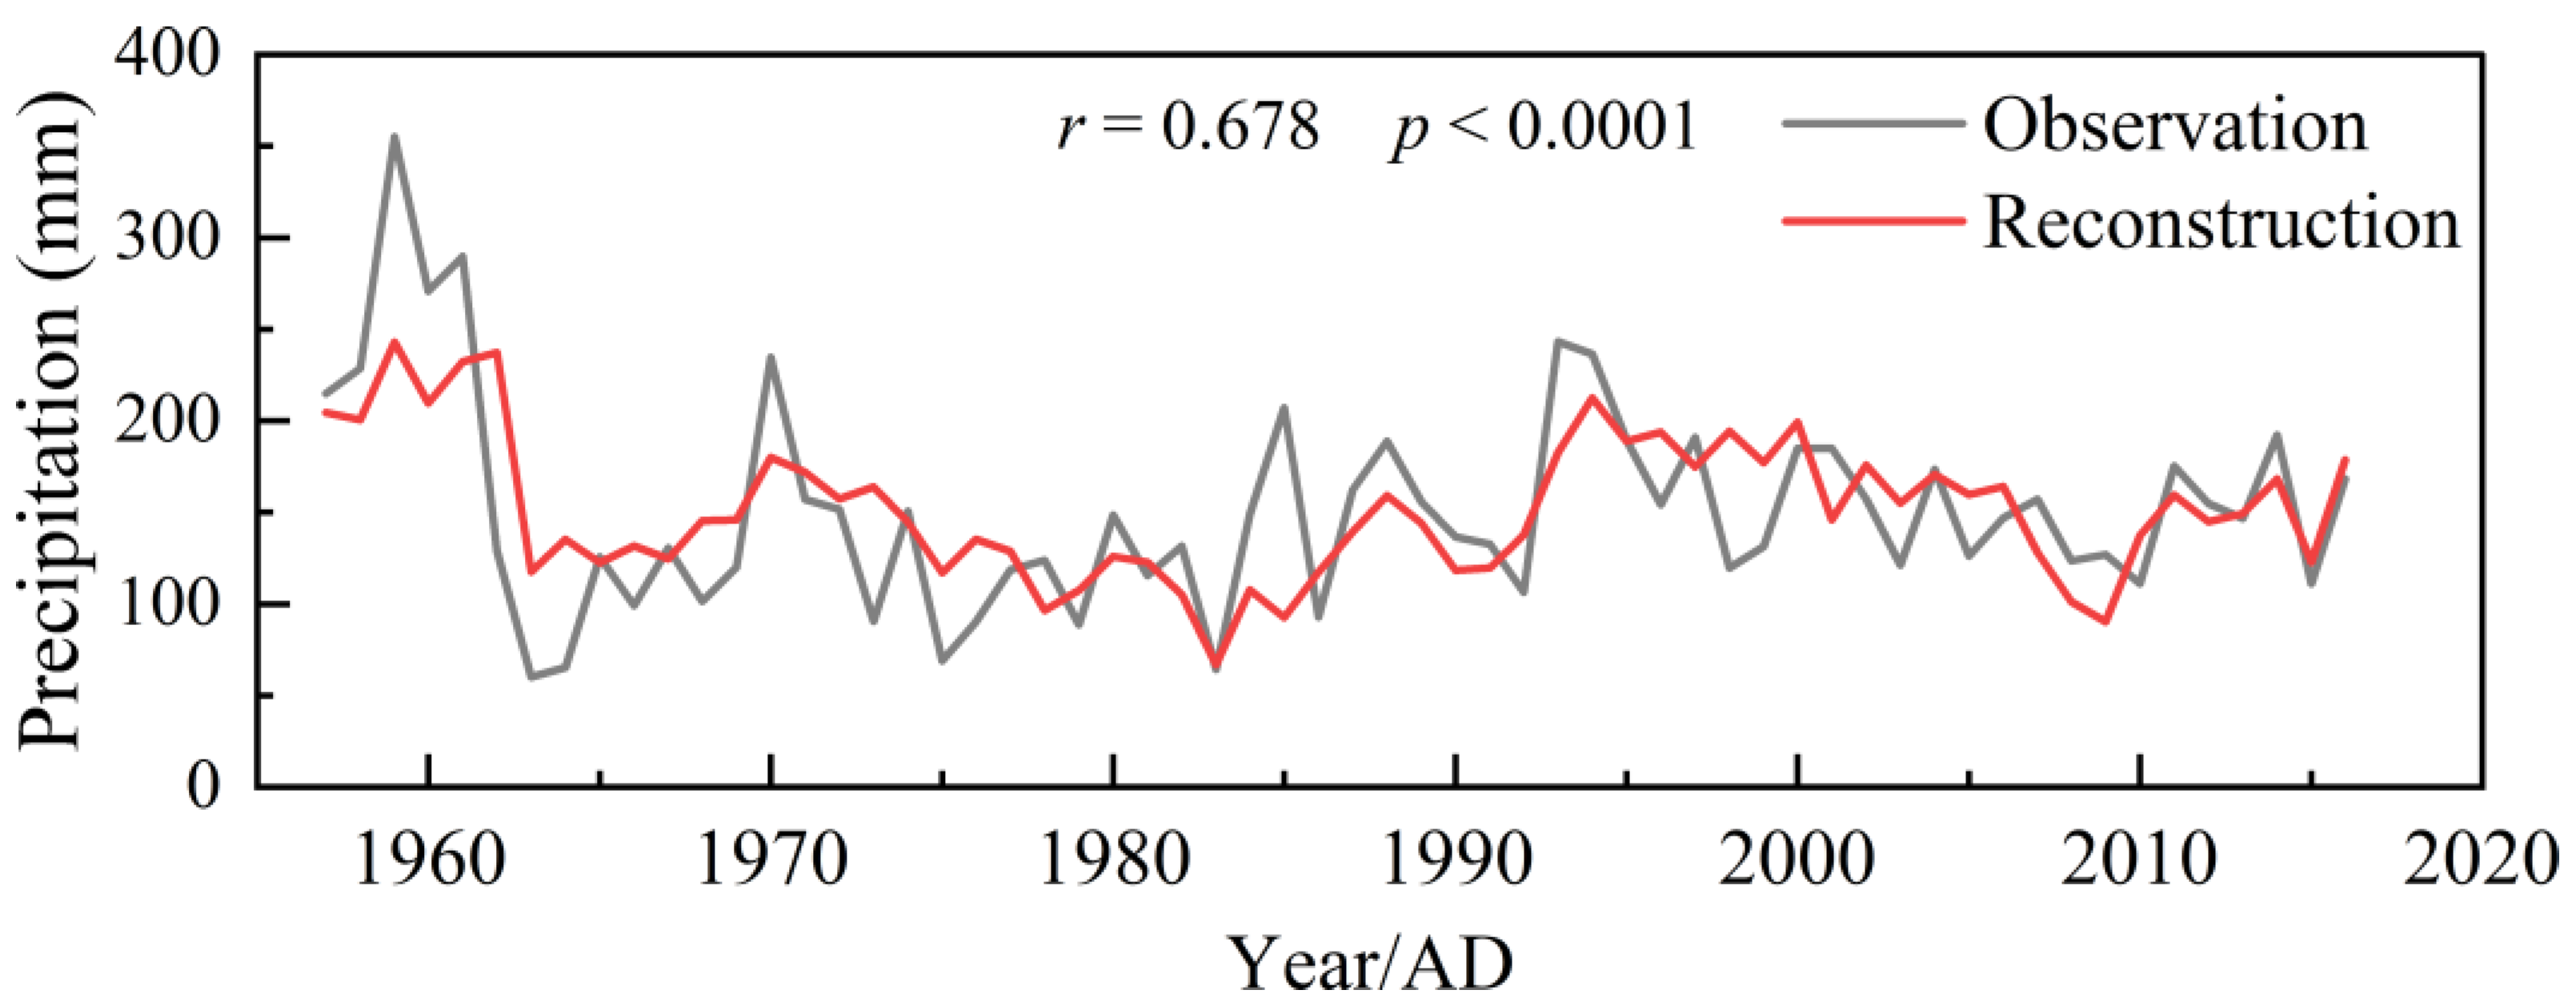
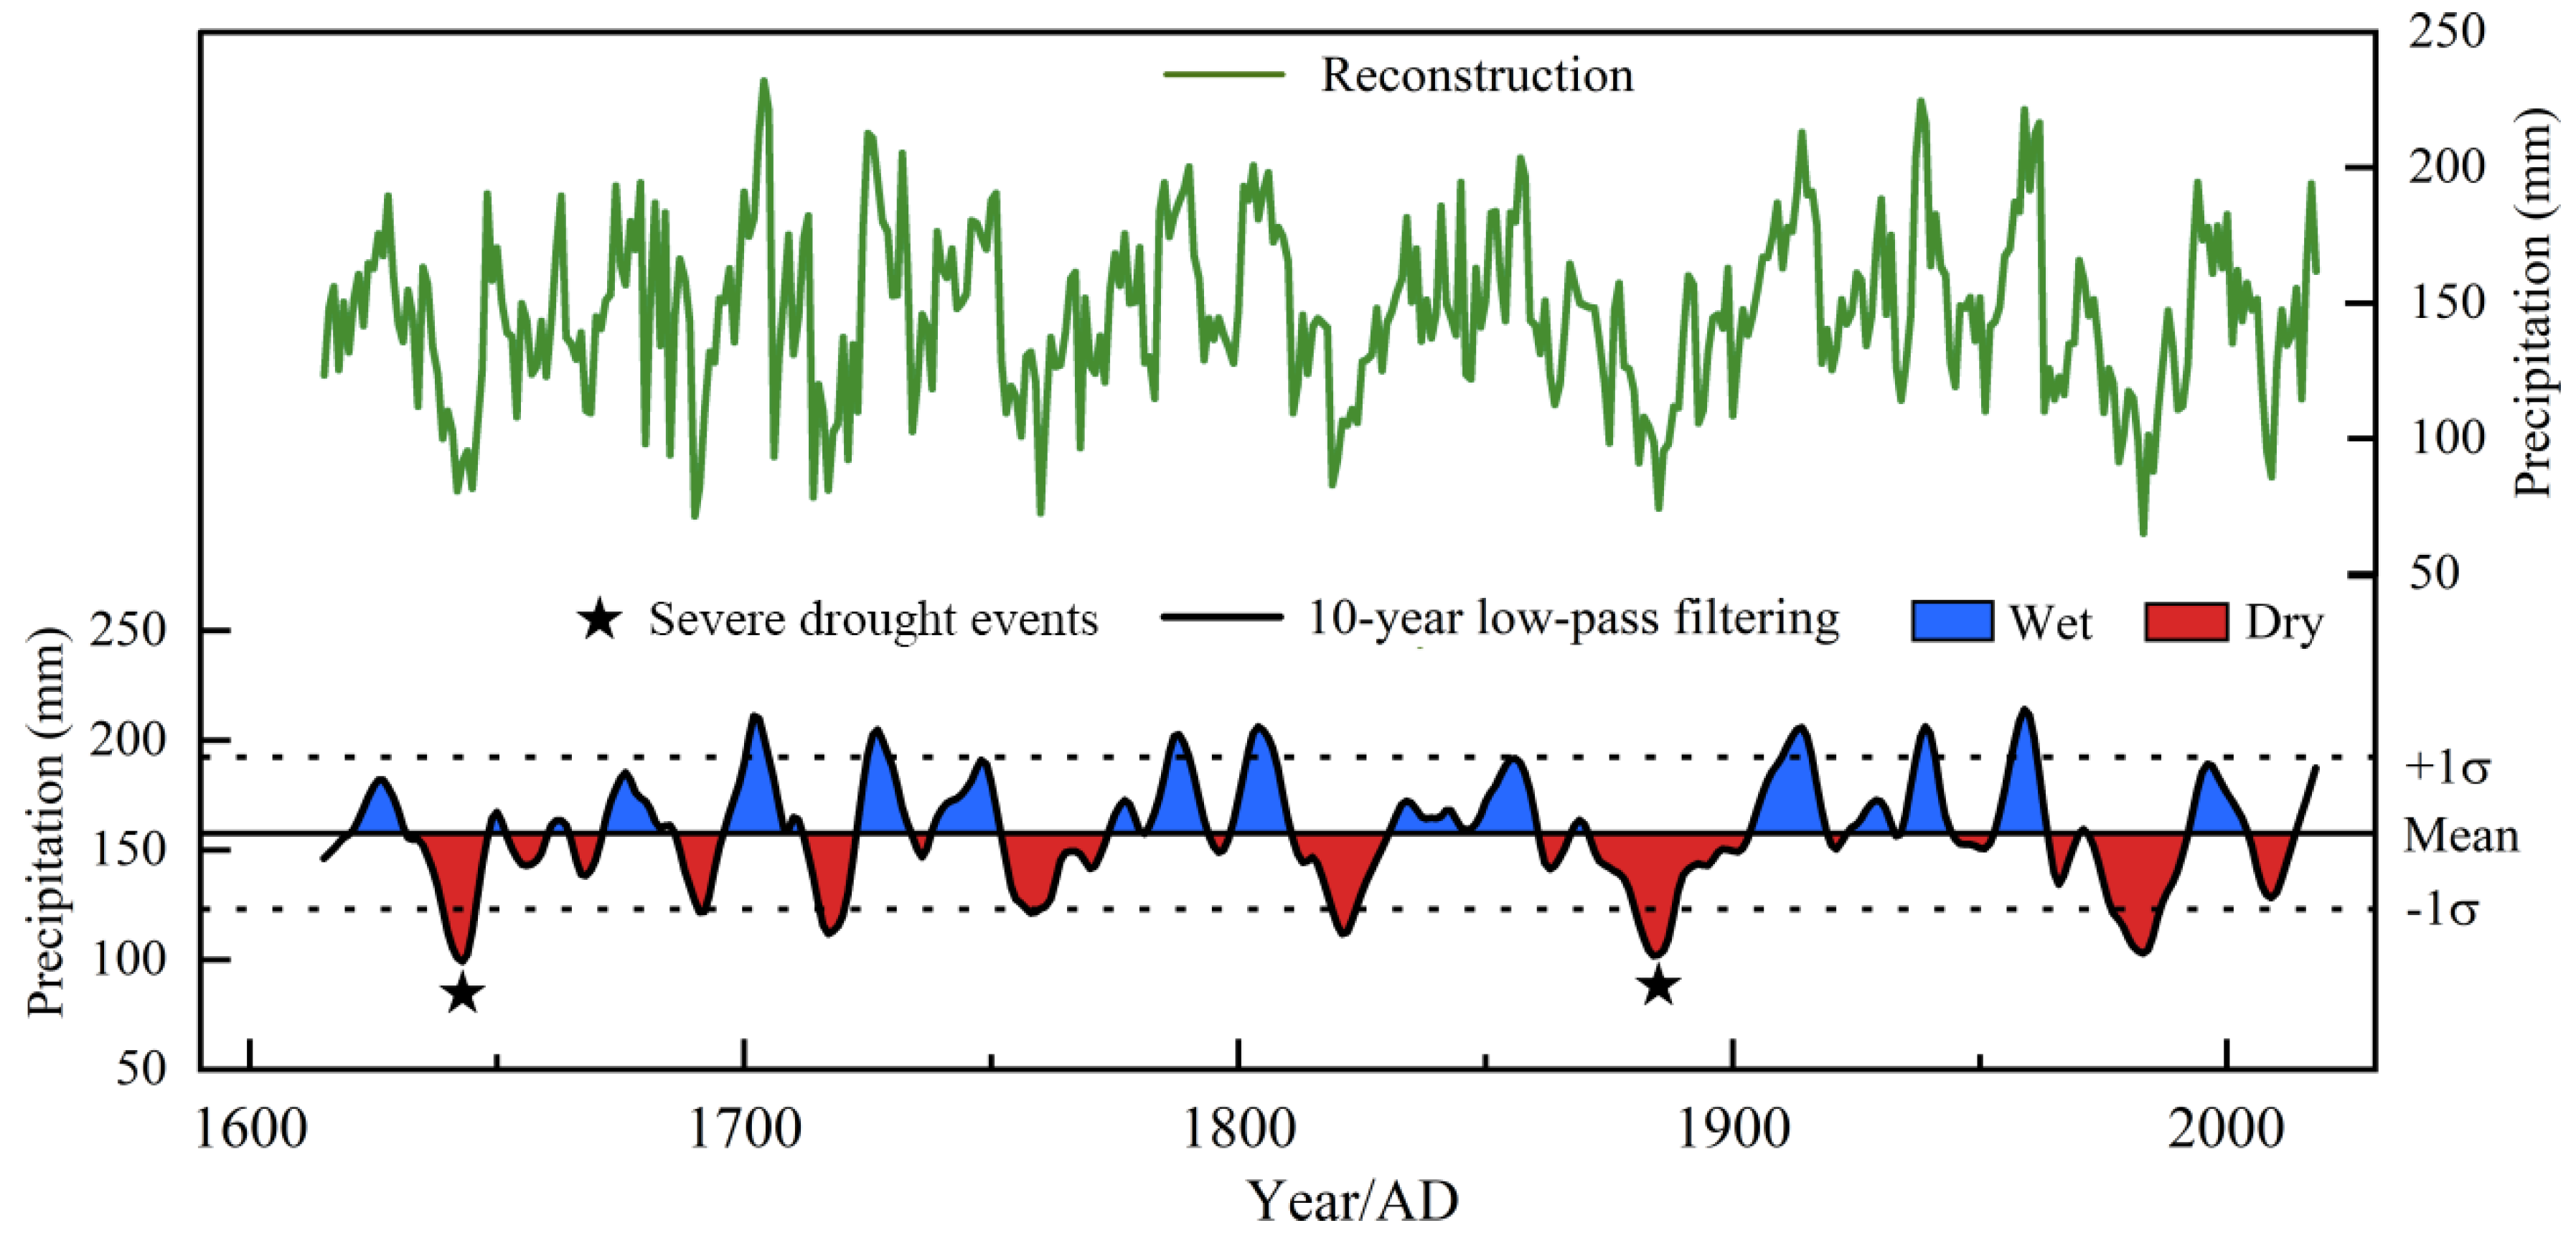
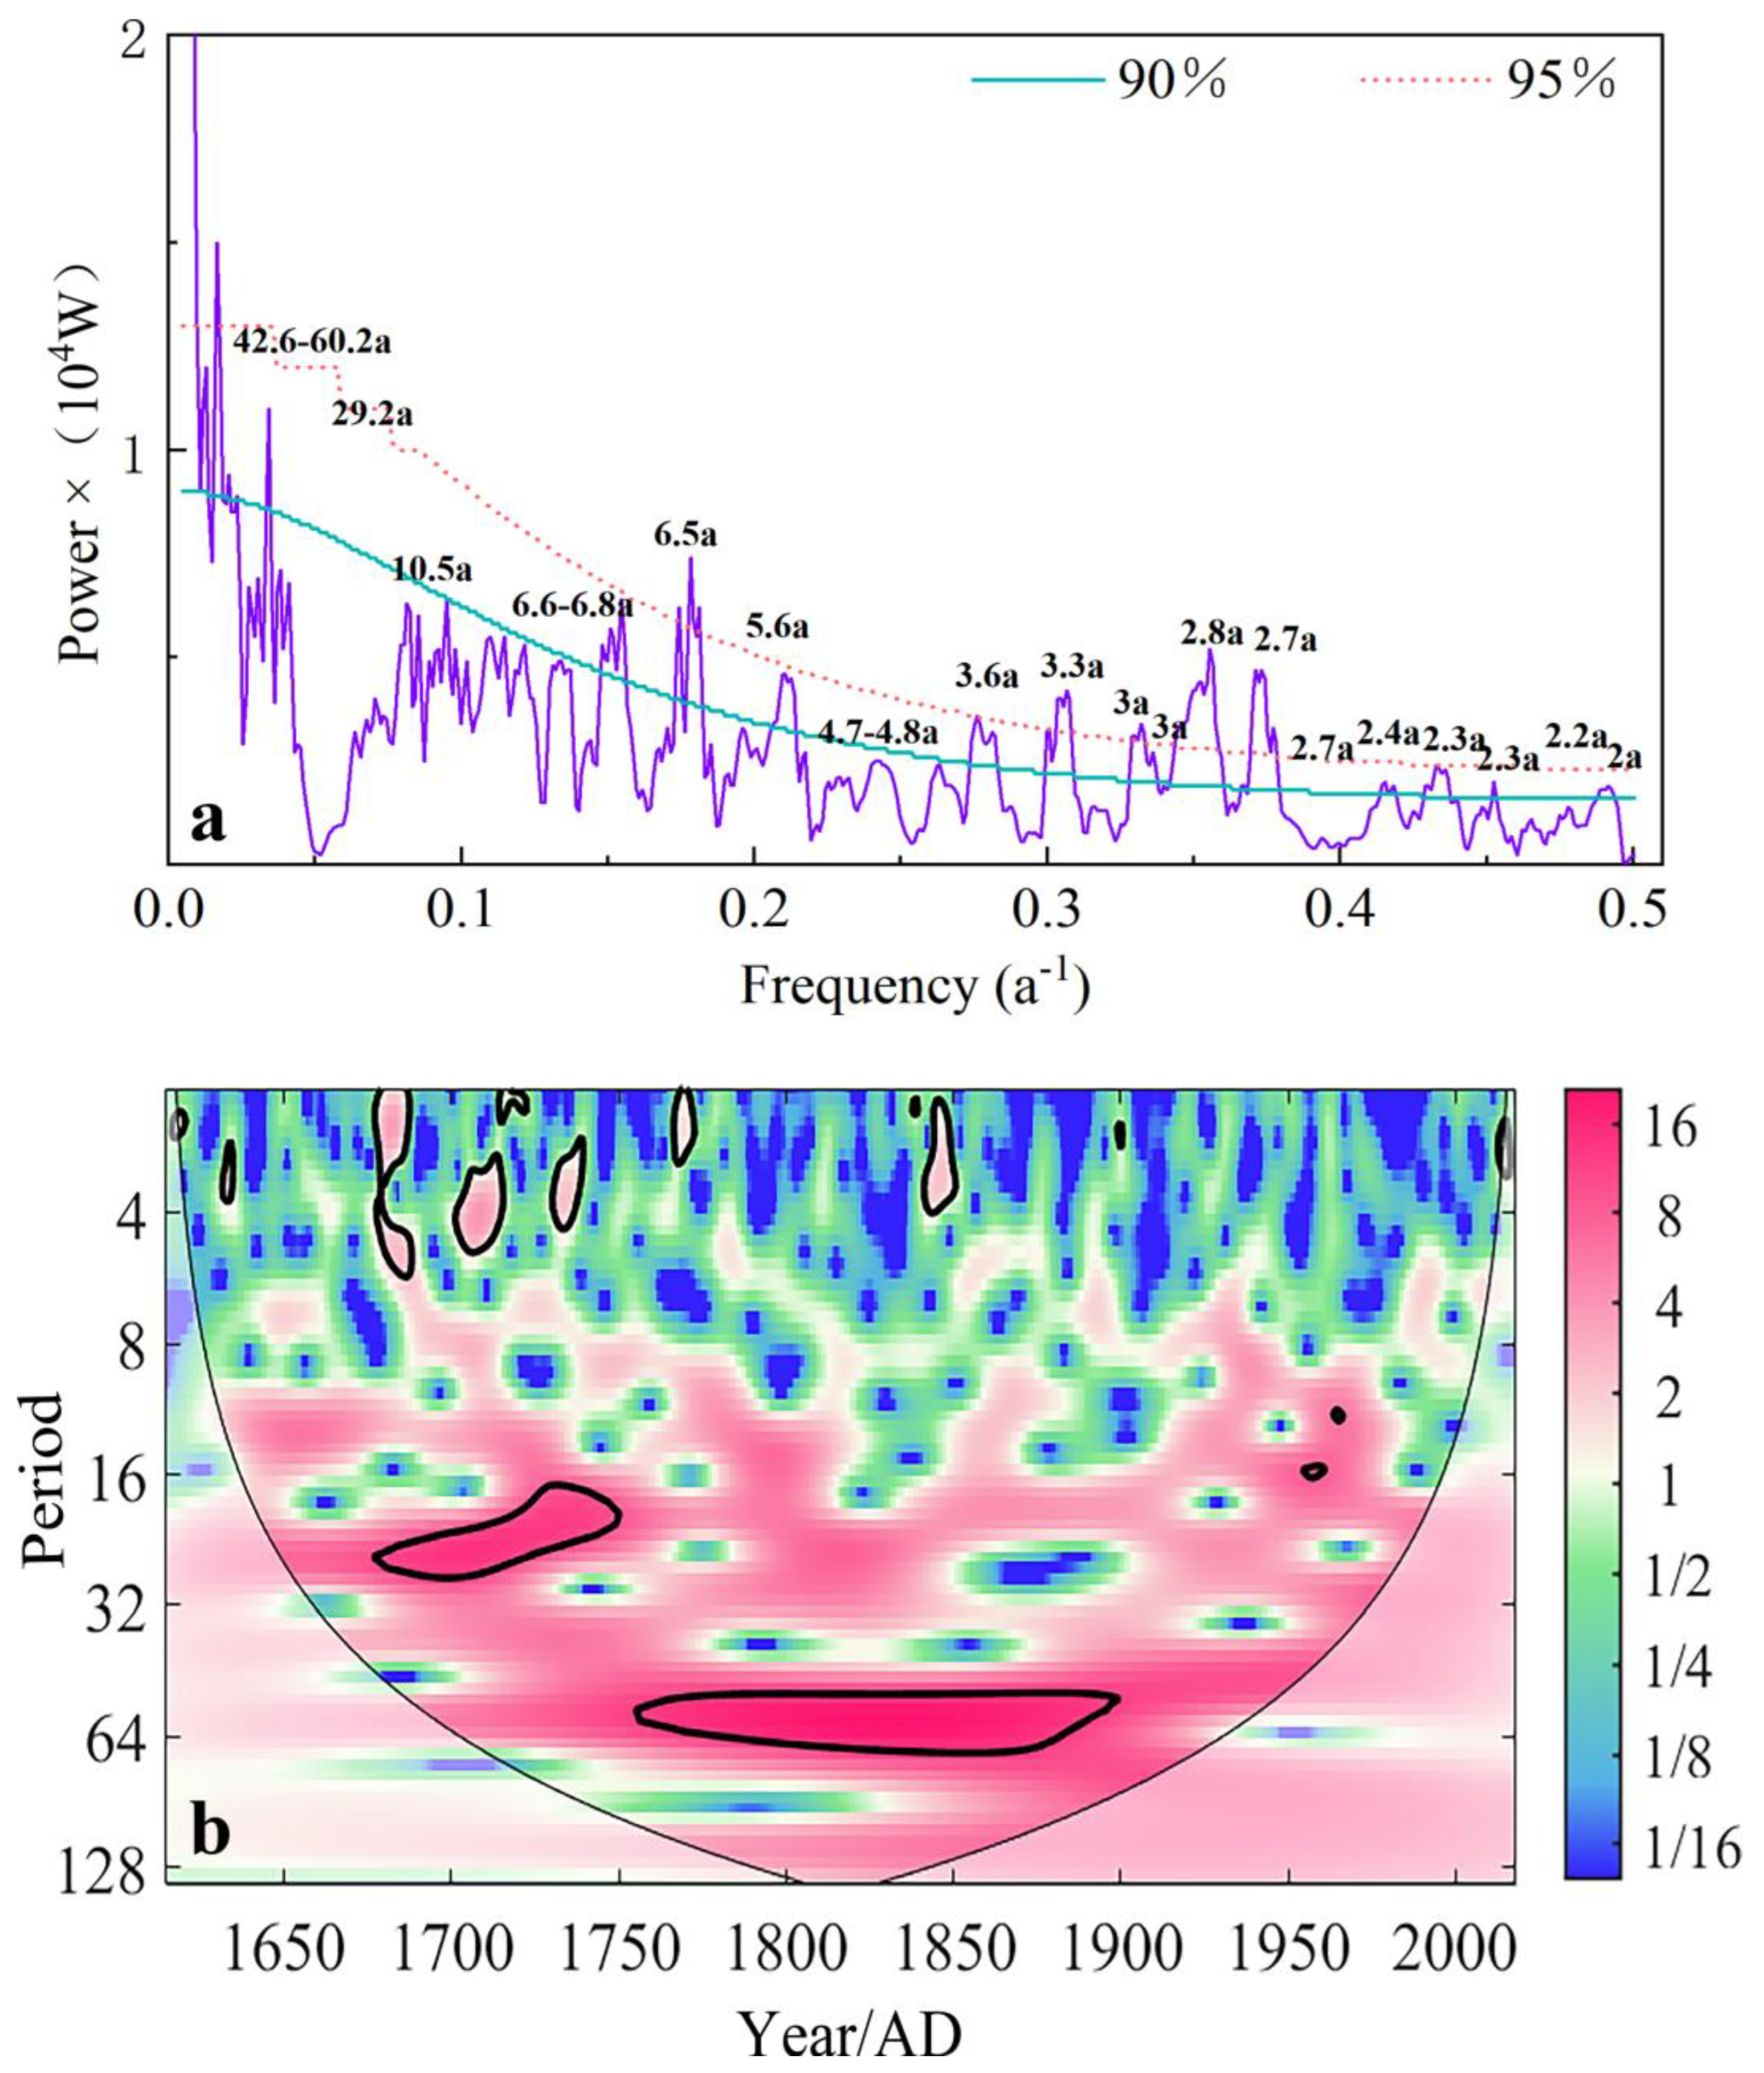
3.2. February–October Precipitation Reconstruction

Based on the high correlation of the STD chronology with the instrumental precipitation data from February to October in the previous year, we reconstructed the precipitation series of the southern Altay Mountains (Figure 5). The single-variable linear regression model between the STD chronology and February–October precipitation for the calibration period produced a significant result (F = 49.4, p < 0.001, adjusted r2 = 0.45). The model obtained was as follows:
Y(t) = 42.77045 + 117.1726 × X(t)
Y is precipitation and X is the tree ring width index.
As shown in Table 1, both the reduction error (RE) and the coefficient of efficiency (CE) based on the respective tests (p < 0.001) are significantly positive, showing that the model has considerable validity [14]. The outcomes of ST, which reflect how closely the projected value follows the actual data’s direction, surpass the 95% confidence threshold. These findings demonstrate that the model passed the essential checks in this instance. For the entire calibration period (1957–2016), the correlation between the tree ring width chronology and meteorological precipitation data is 0.678, which explains 45.9% of the previous February to October precipitation variation. The reconstructed precipitation has a high degree of concordance with the observed value, indicating that the reconstruction equation is reliable.
After applying the model of linear regression with a single variable, the annual precipitation (previous February–October) for AD 1615–2018 was reconstructed (Figure 6). The low-pass filtering could be used to investigate the stage characteristics of precipitation fluctuation in the southern Altay Mountains, allowing us to better comprehend and assess the overall precipitation trend. The 10-year, low-pass-filtered total precipitation is presented in Figure 6. The reconstructed precipitation varied from 66.9 mm to 254.7 mm, with 1983 being the driest year (66.9 mm) and 1704 being the wettest (254.7 mm). According to the calculation, the standard deviation (σ) and long-standing mean (mean) are 34.7 and 157.7 mm, respectively. The dry (wet) periods were characterized by a 10-year low-pass-filtered value that was always lower (higher) than the long-term mean from 1615 to 2018. According to this definition, dry periods with below-average precipitation occurred in AD 1631–1648, 1651–1660, 1686–1696, 1712–1722, 1752–1773, 1810–1830, 1870–1903, 1972–1992 and 2004–2013; wet periods were identified during AD 1620–1631, 1671–1686, 1695–1708, 1722–1733, 1737–1752, 1780–1793, 1798–1811, 1830–1860, 1903–1919, 1933–1944, 1953–1963 and 1992–2004. We defined an extremely dry year as <mean − 1σ (123 mm) and an extremely wet year as >mean + 1σ (192.4 mm). In the precipitation reconstruction from 1615 to 2018, 71 years were classified as exceptionally dry and 69 as extremely wet. Our reconstruction illustrates the distribution of wet and dry periods in the history of the southern Altay Mountains over 404 years. The reconstructed precipitation series captured some significant historical drought events, such as the severe drought in the late Ming Dynasty during the 1630s and early 1640s. This drought resulted in a total economic collapse, intensified social unrest, and hastened the demise of the Ming Dynasty [22]. Additionally, the Qing Dynasty experienced a severe drought following the most serious occurrence, the El Niño event in 1876, which affected a large portion of Asia, causing drought and famine for 160 to 200 million people [23]. Previous research has already established the impacts of these two droughts on northern China, and our study further corroborates these findings [24].
After investigating the variations in the reconstructed precipitation on various time scales and the likely explanation for its periodic alterations, the MultiTaper spectral analysis results revealed that the precipitation in this area showed 2–7-year, 10.5-year, 29.2-year, 42.6–60.2-year and 1000-year quasi-periodic variations (Figure 7). However, considering its boundary effect, the 1000-year cycle is less reliable. As a supplement, Wavelet analysis was also utilized to examine the temporal characteristics of the various cycles. Wavelet analysis is the simultaneous time and frequency domain decomposition of a time series. It can identify the main period series and its changes over time. The wavelet transform of a discrete time sequence is defined as the conjugate of the sequence and the scale and transform function of the selected wavelet function. The changes in amplitude and frequency with time can be obtained by transforming the wavelet’s time scale and the wavelet’s scaling function. The wavelet analysis shows approximately 60-year quasi-periodic variations from 1765 to 1890 and an approximately 24-year cycle from 1670 to 1750. In previous dendroclimatic research, the abovementioned cycles were frequently reported to be observed in reconstructions of the Altay region. The frequency of the 2.7-year and 11-year cycles was detected in the reconstructed precipitation of the southern slopes of the Altay Mountains using tree ring δ13C [25]. The reconstructed precipitation series for the upper Irtysh River Basin indicated cycles of 24.3 years, 3.2 years and 2.1 years [26]. The 2.2-year cycle, 12-year cycle and 24-year cycle were discovered in a study of the reconstructed streamflow series of the Haba River [12]. A reconstructed 310-year early summer temperature series for northern Kazakhstan also contained 11-year and 2-year cycles [27].

4. Discussion

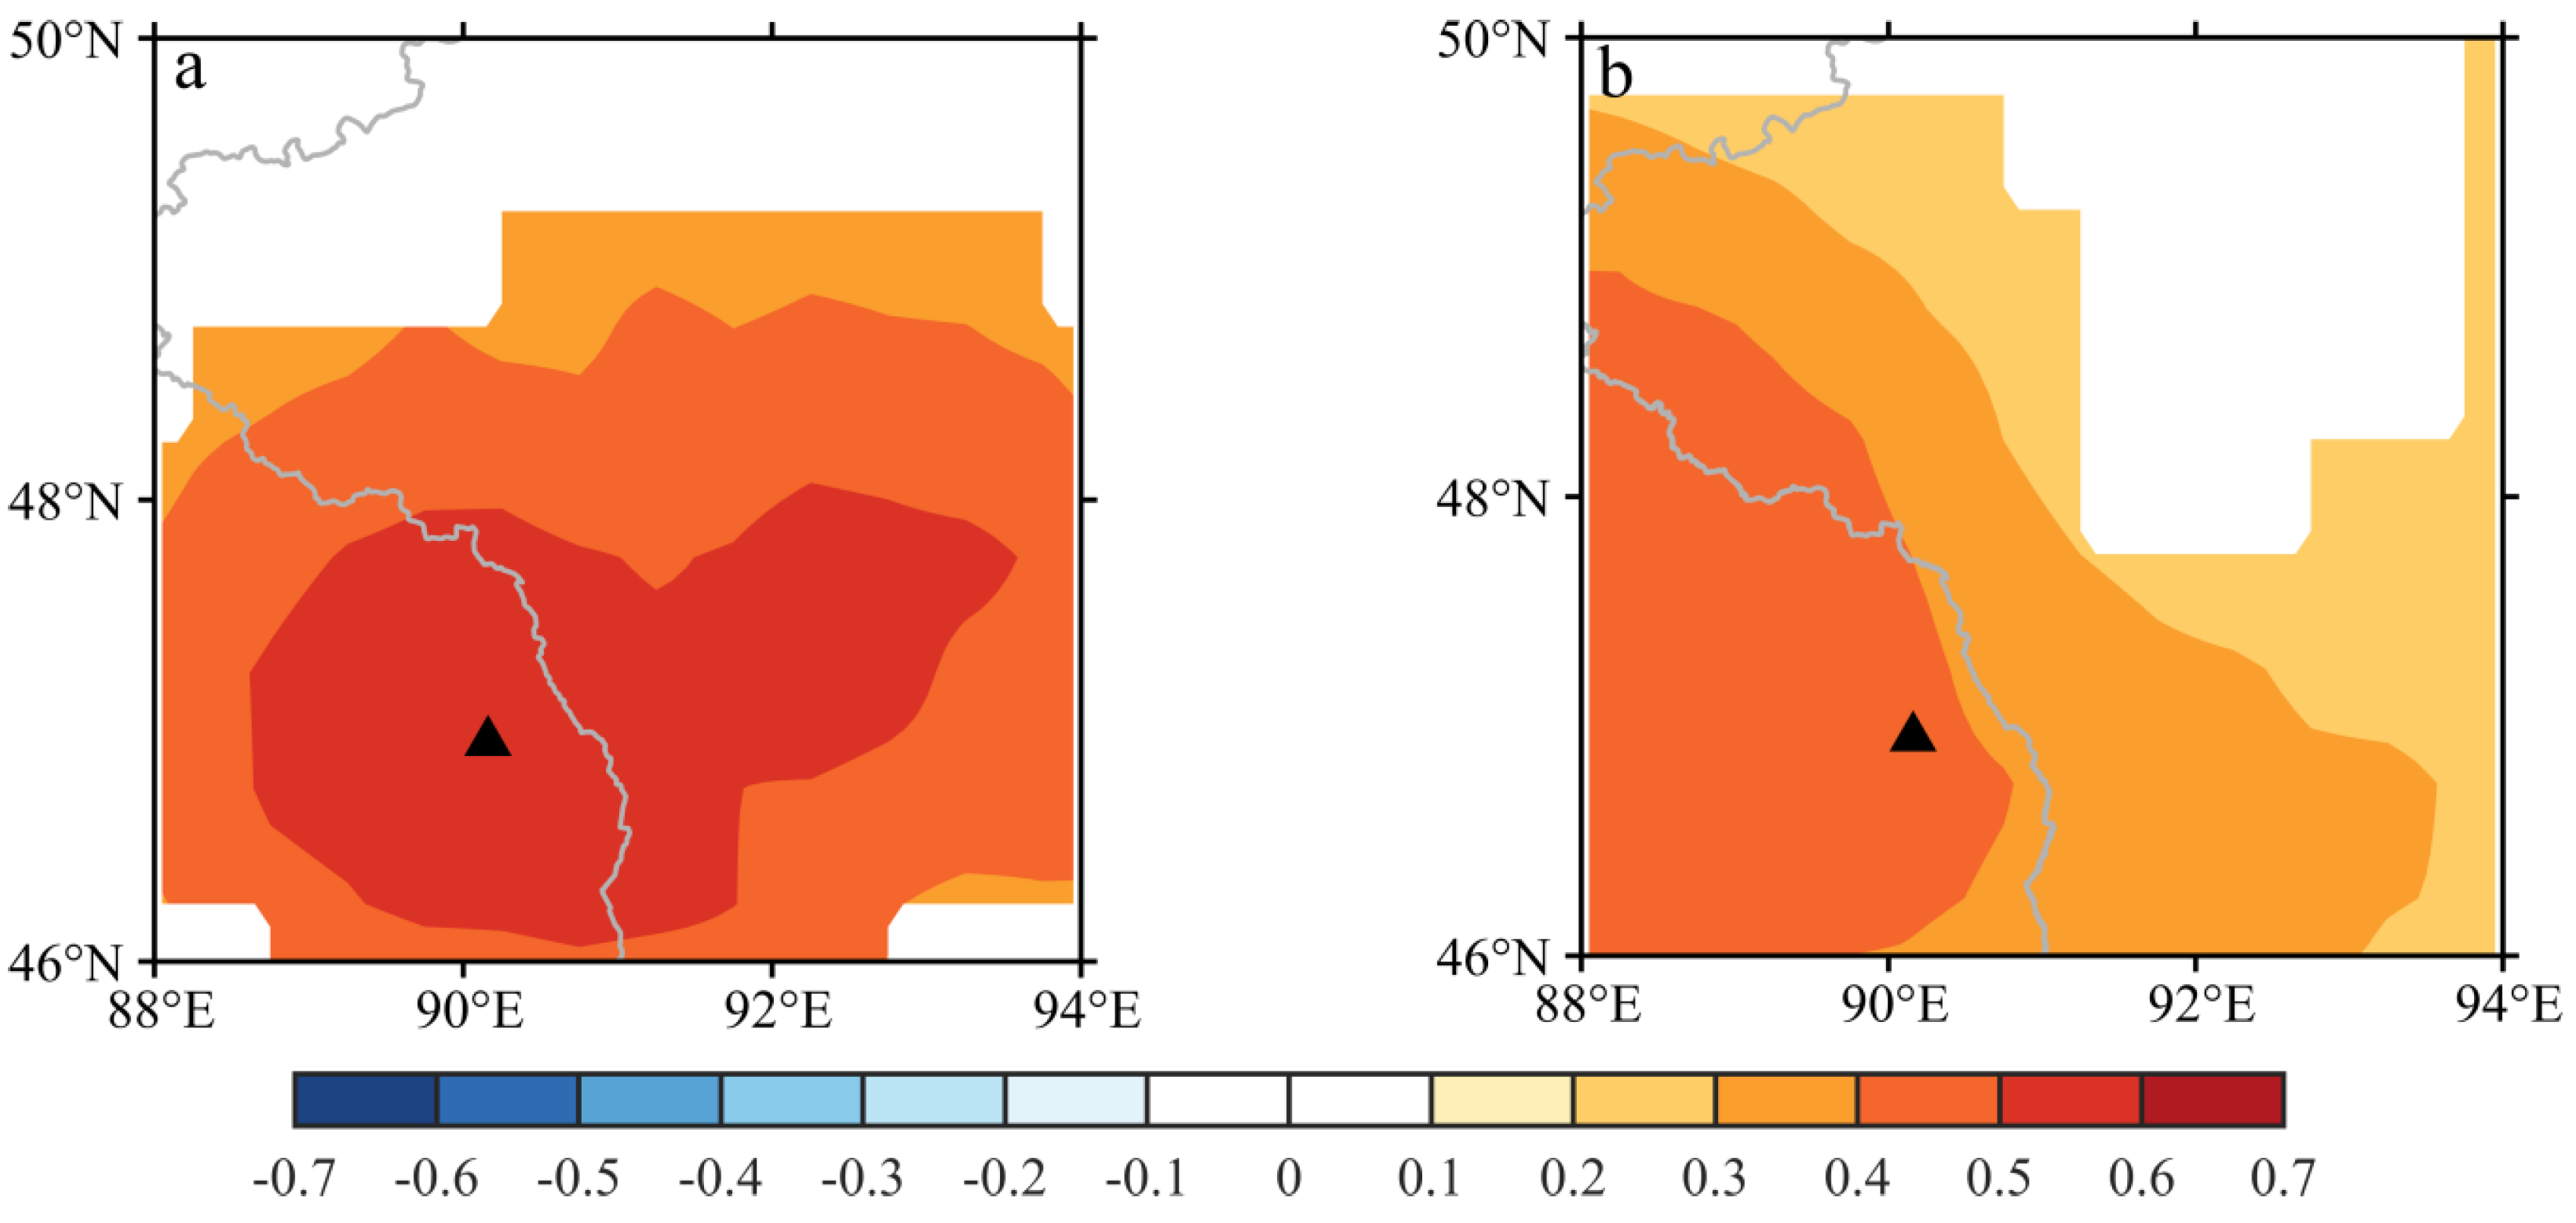
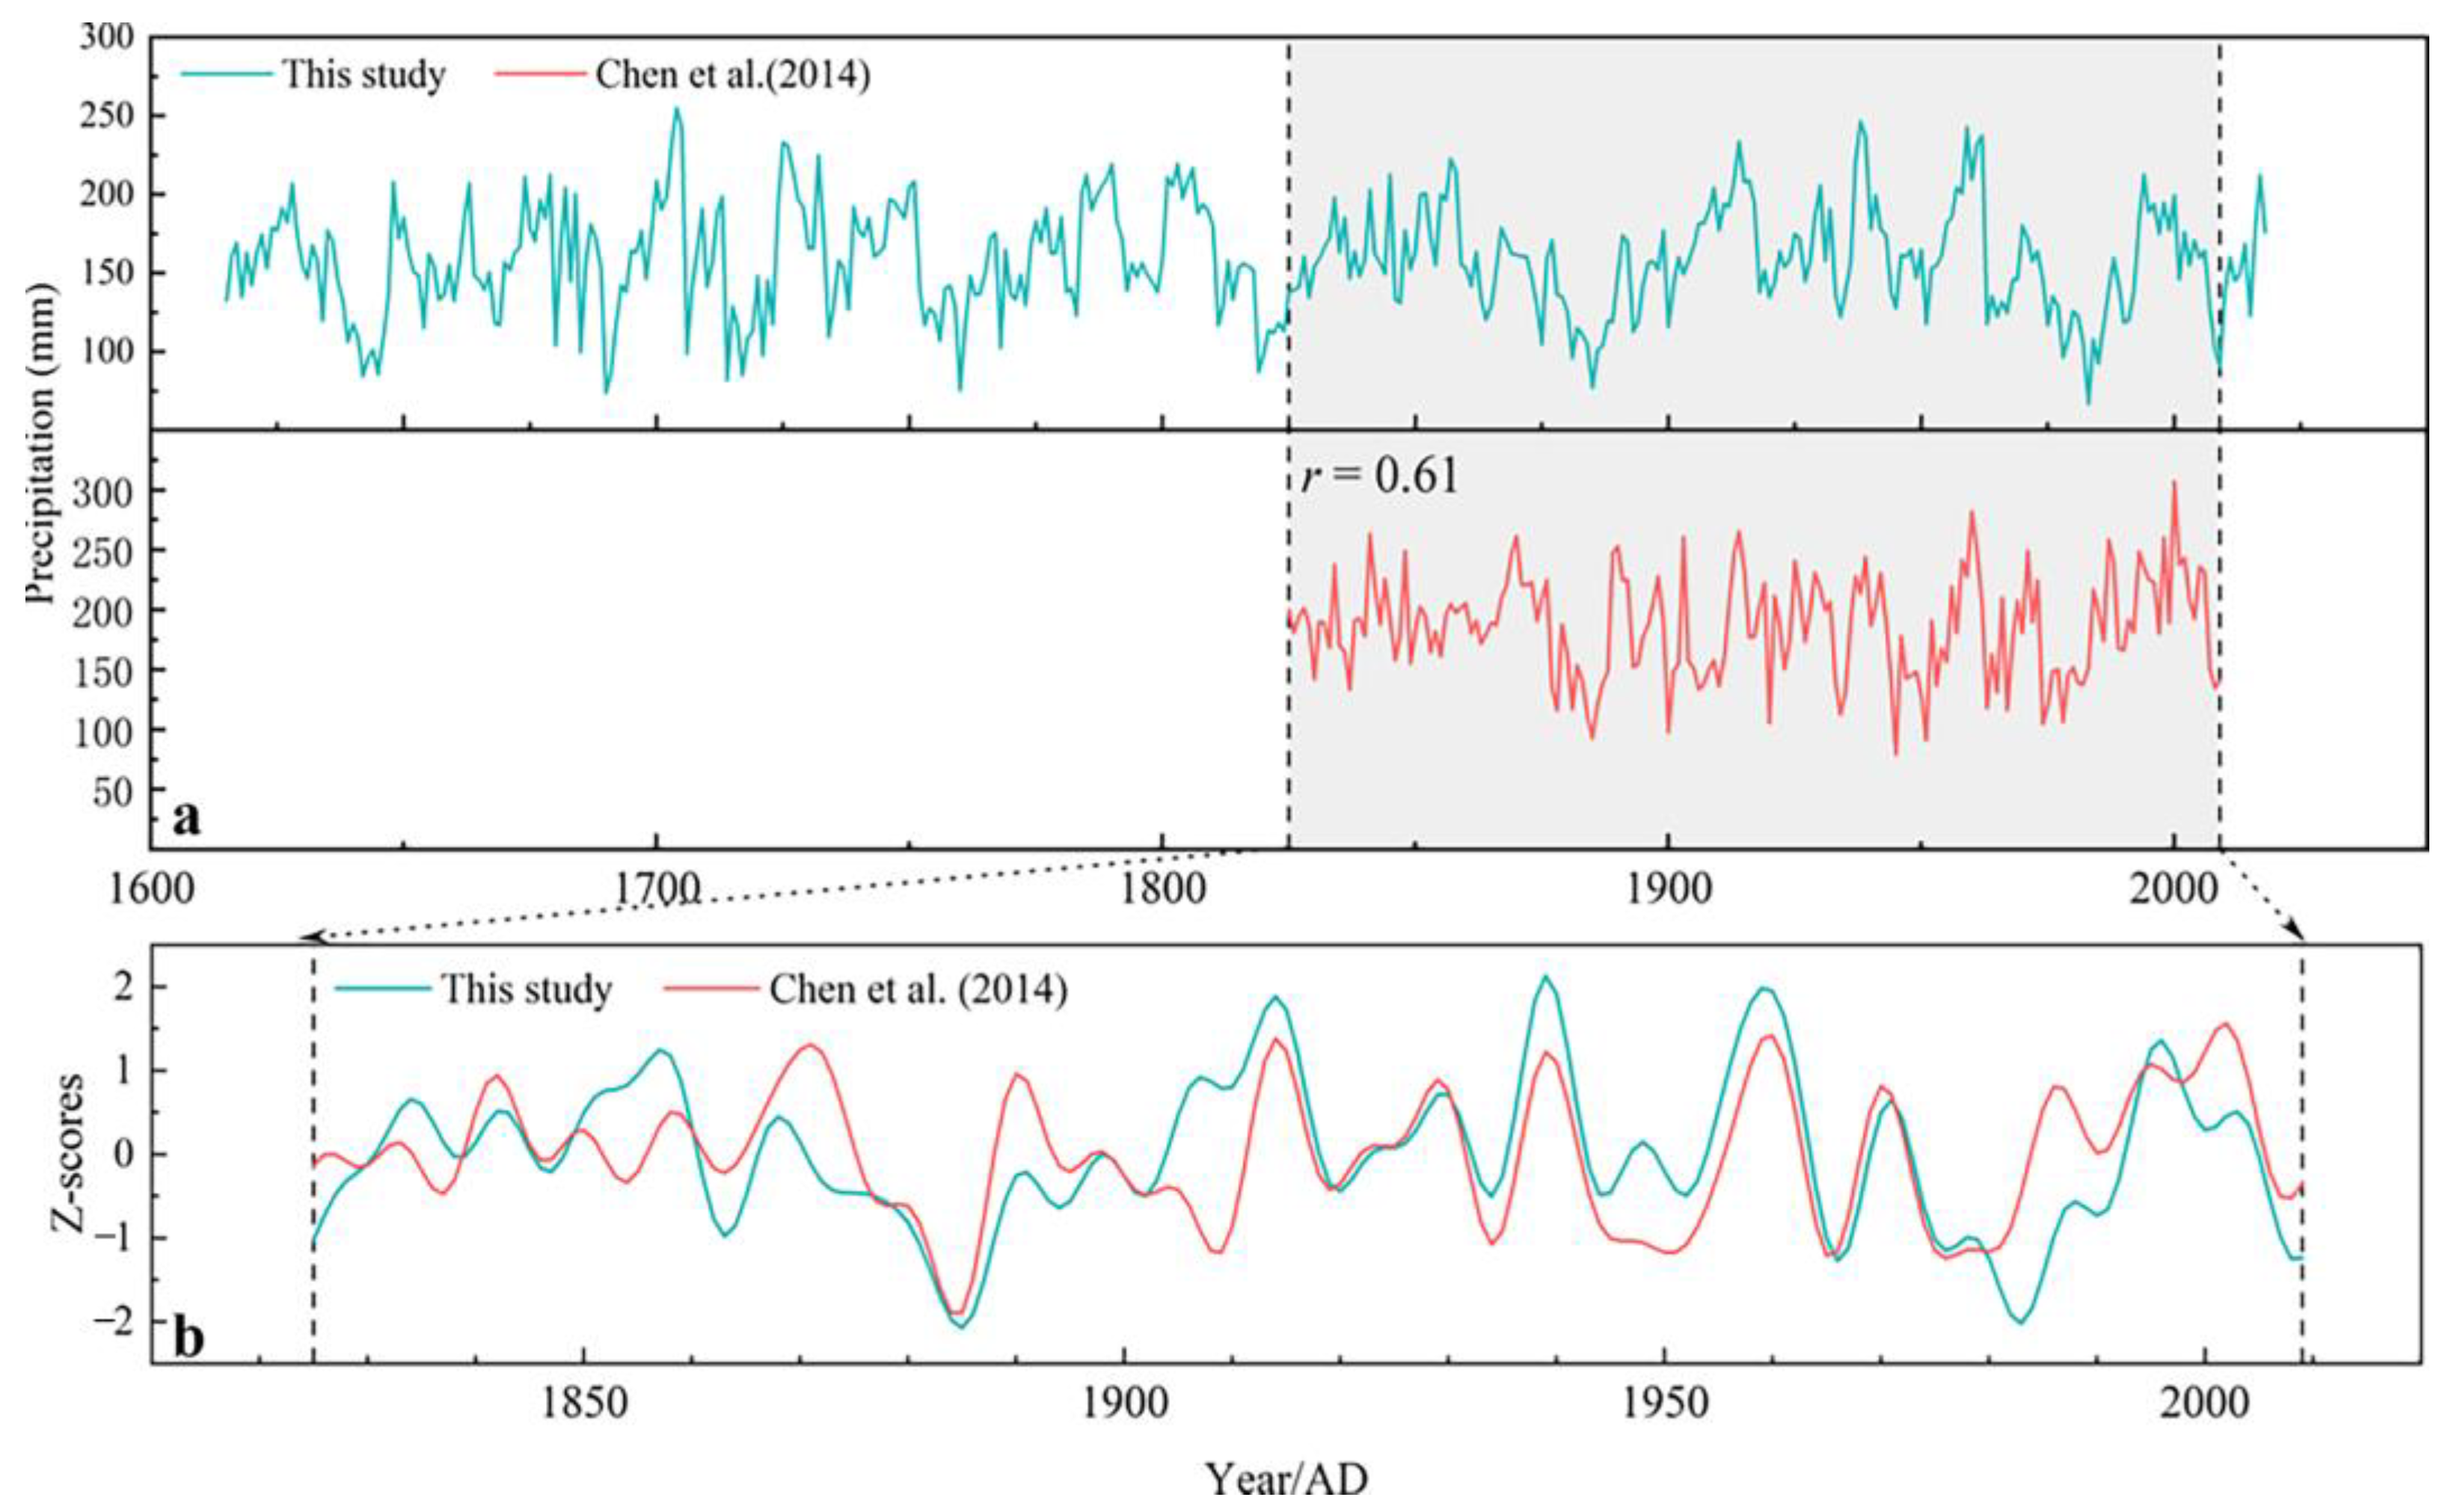
4.1. Regional-Scale Precipitation Signals

Despite this area’s complicated landscape and geographical variances in precipitation fluctuation and radial tree growth, the spatial correlation analysis reveals that our reconstruction has a significant connection with the CRUTS 4.01 precipitation grid-box data for the vast Altay Mountain region (r > 0.4, p < 0.01) (Figure 8). Comparatively, the spatial correlation patterns between the reconstruction and grid-box data are similar to those of the instrumental precipitation data and grid-box data. On the basis of this information, we concluded that February–October precipitation is the most significant climatic factor restricting the growth of Siberian larch in southern Altay, and our reconstruction is an excellent geographical representation of this region.
As with previous proxy-based climatological reconstruction research, we verified our reconstruction’s reliability by comparing our precipitation series to those of other reconstruction studies from neighboring regions (Figure 9a). Based on the tree rings of Siberian spruce, a valid precipitation sequence for the southern Altay Mountains was previously reconstructed [11]. Despite the use of different tree species in the reconstruction work in the two studies, our precipitation reconstruction exhibits a significant correlation (r > 0.6, p < 0.01) with the previous precipitation reconstruction during the overlapping periods (AD 1825–2009), which further validates the reliability of our precipitation reconstruction. Even though both reconstructions demonstrated that the major dry and wet periods were comparable (Figure 9b), there were differences in the length and intensity of climate conditions. Discrepancies in tree species, calibration period scope, sample site topography, or other factors might have caused this. The commonalities in the patterns of the two series indicate that the southern Altay Mountains are subject to comparable forcings. Numerous trees in this region thrive on poor or rocky soils, resulting in a limited capacity for water storage, and precipitation is the dominant factor limiting tree radial growth.

4.2. Climate–Growth Response

Since around the middle of the 20th century, tree growth index and climate sensitivity decline has been identified in tree ring width and density records from several circumpolar northern latitude locations. This occurrence is frequently referred to as the “divergence issue” [28]. As shown by the relationship (r > 0.6) between radial tree growth and climatic conditions, the climate sensitivity of Siberian larch in the Altay Mountains has not diminished. Consequently, the tree ring width chronology of Siberian larch from the Altay Mountains enables us to analyze the recent climatic changes from a long-term perspective. Previous research has revealed that owing to their geographic position, trees in Northwest China have a limited capacity for water storage. Hence, drought often threatens their growth [12,29]. In this research, the association between the tree ring width chronology and meteorological data revealed that precipitation from February to October in the preceding year was the main factor constraining Siberian larch growth. When plants begin their active growth period in the spring, moisture deficiency is vital [30]. Trees’ radial expansion is constrained by the climatic circumstances of the growing season and the weather conditions before the growing season [14]. The study area’s average temperature in September and October is approximately 10 °C. Siberian larch can also carry out photosynthesis. Precipitation can strengthen photosynthesis and encourage trees to accumulate more nutrients, aiding tree regrowth in the following year. Beginning in the October of the previous year and continuing to March in the current year, the area was dominated by snowfall that accumulated on the surface. Studies have shown that melting snow can meet the need for water during the early and middle growth of trees [31]. In the initial stages of the growing period, considerable moisture is needed for the division and expansion of tree cells [14]. In this stage, the rainfall in the study region was still insufficient, but the previous winter’s snowmelt provided enough water for tree growth [32]. According to the correlation analysis between tree growth and weather patterns, the chronology was positively associated with precipitation and negatively related to mean temperature from May to September in the previous year. The correlation coefficient implies that drought was the primary factor limiting tree growth within the southern Altay region during this period. Similar findings were observed in China’s arid and semiarid areas [33,34].

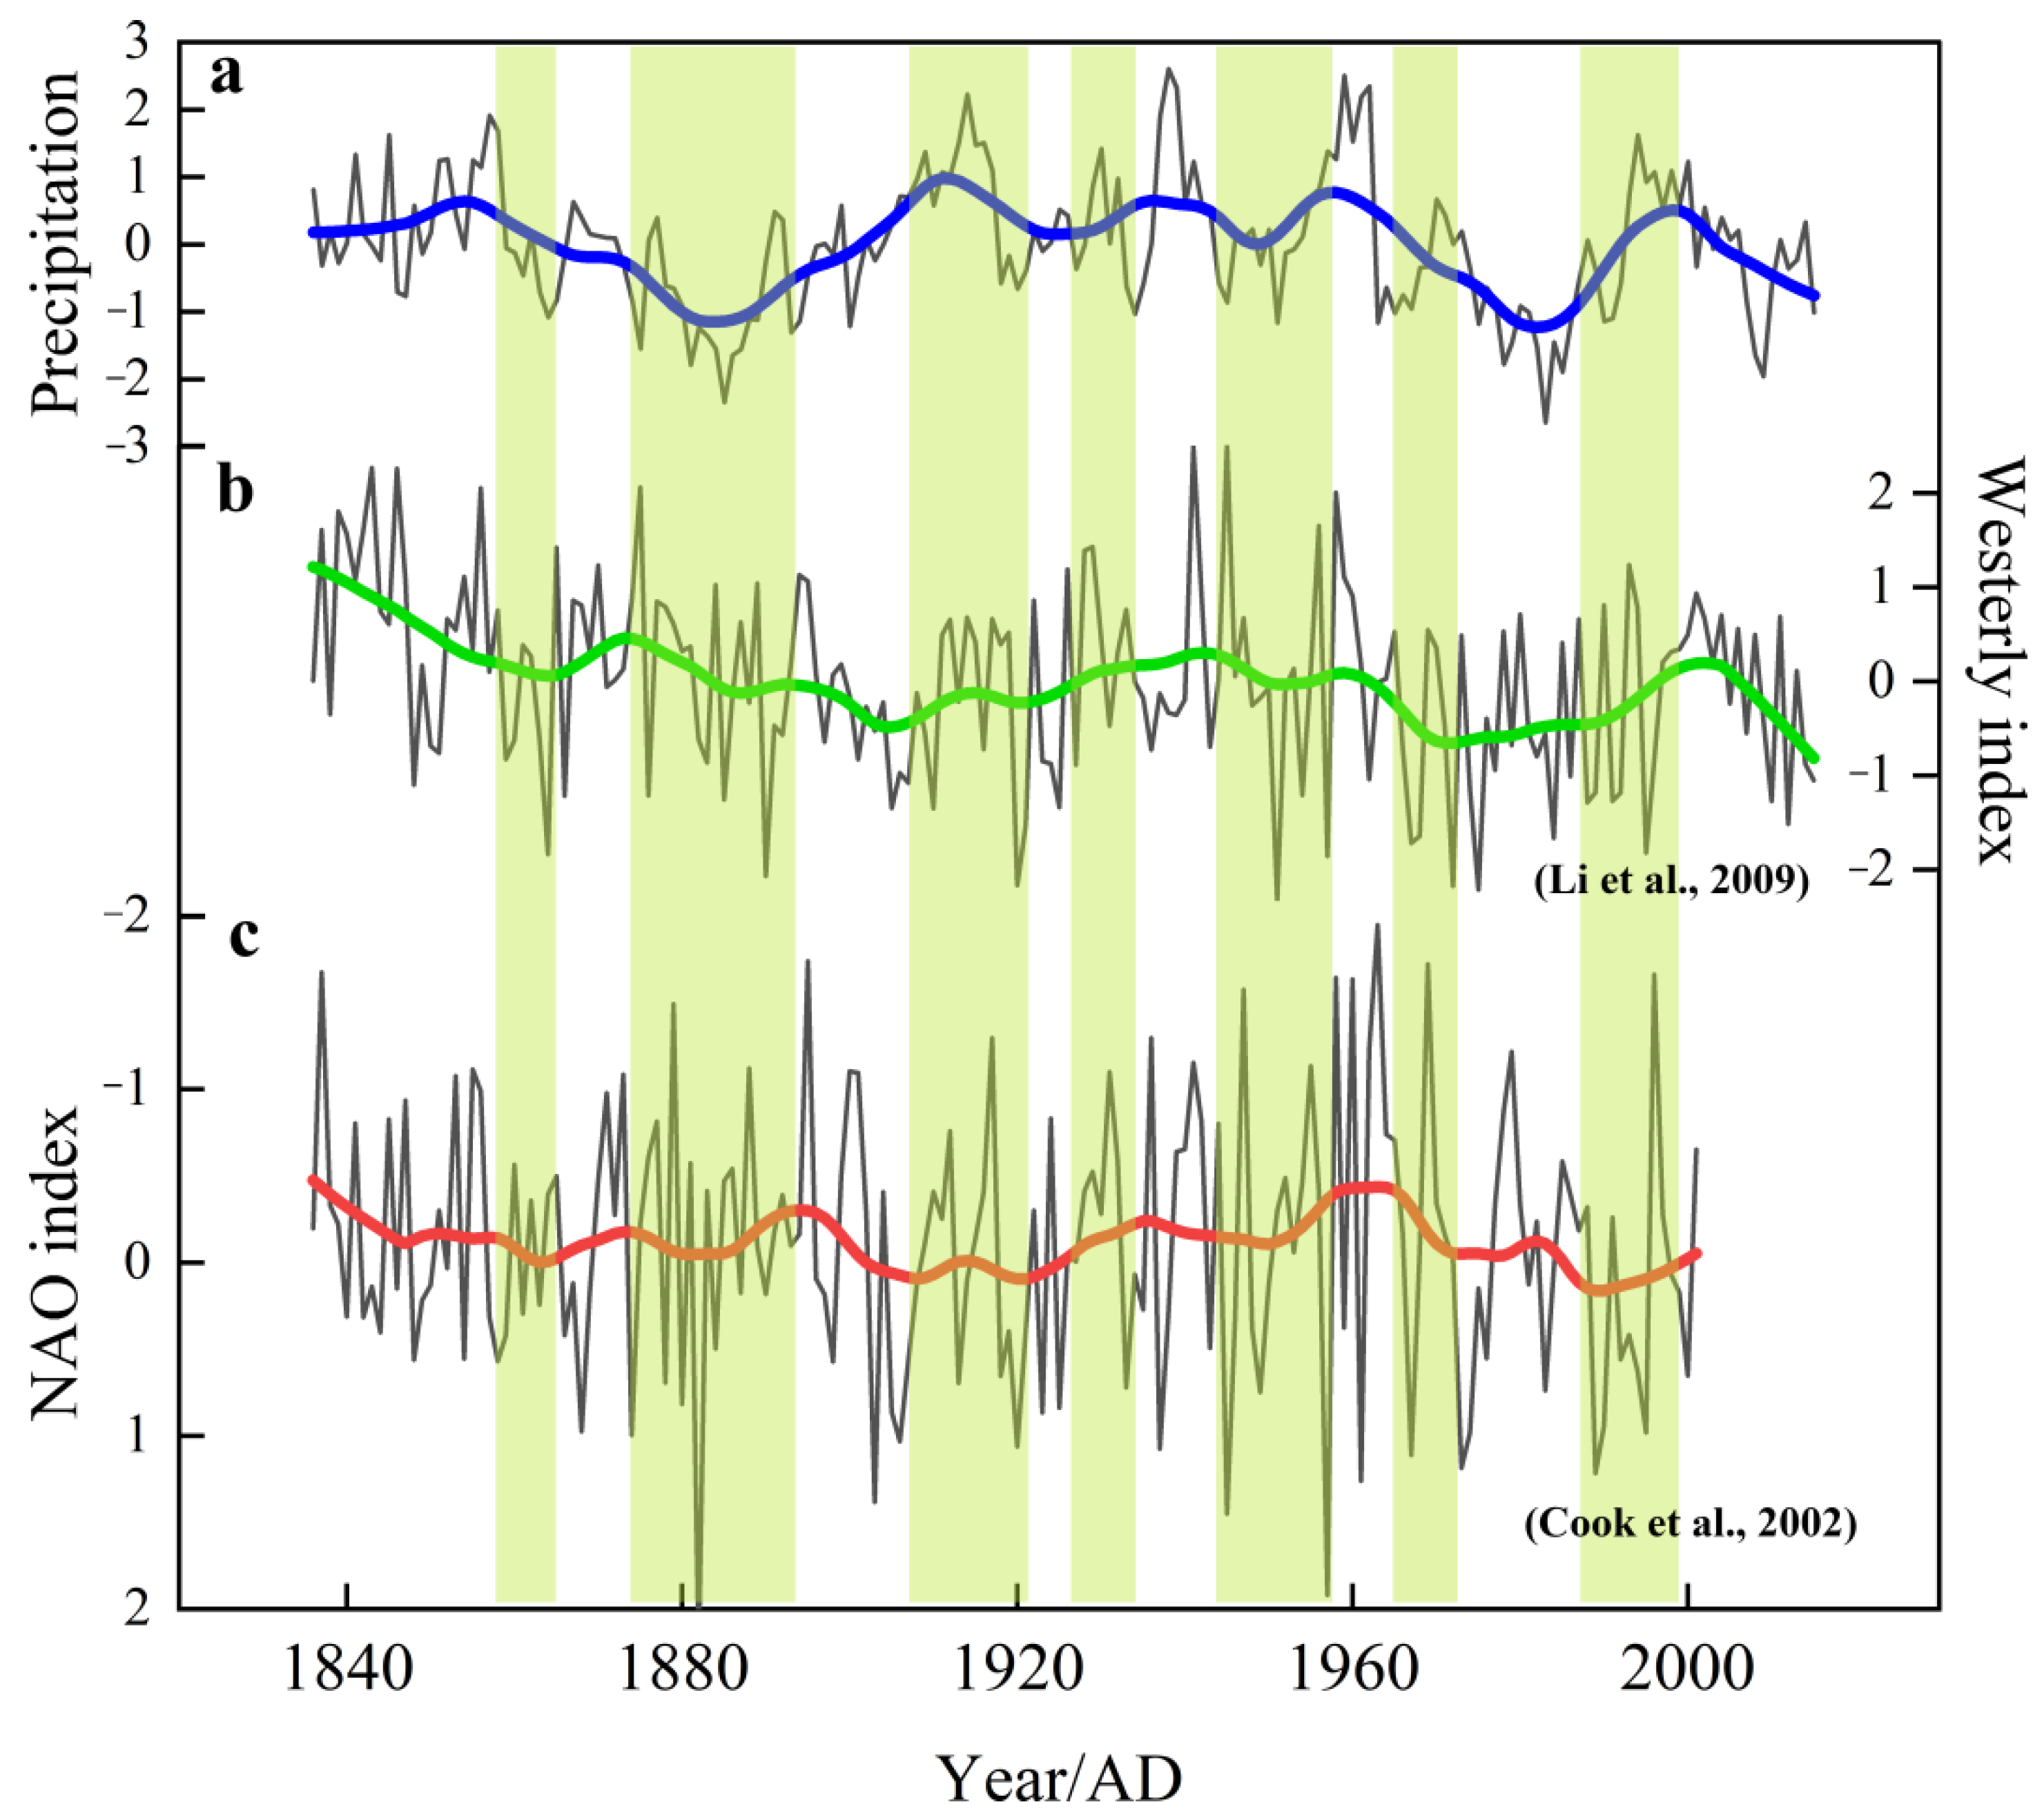
4.3. The Influence of North Arctic Oscillation Westerlies

The westerly circulation is situated in the middle latitudes, and the primary control range extends from 40° N to 60° N. In the Northern Hemisphere, the prevailing westerlies produce southwesterly winds. Westerly winds from the ocean can deliver copious precipitation [35]. The Tibetan Plateau divides the westerlies into the north and south branches of westerly airflow, which expands the influence of the westerly winds on China. The north-westerly airflow forms a southwest airflow in the northwest of the plateau, which carries certain types of precipitation to the north of the plateau. [36].
When this warm and humid airflow from the Atlantic bypasses northern Xinjiang, it merges with the cold and dry polar continental air mass from Siberia to the south due to the thermal difference between the land and sea. It turns into a strong northwest airflow, which makes the winter monsoon in China more powerful, and it extends far south. The North Atlantic climate zone, controlled by the cold, high pressure of the Northern Hemisphere, influences climate change in Central Asia and even East Asia through the action of the westerly winds. The Altay Mountains are located in the Central Asian region, where the upper westerly jets play an important role in this critical geological location. Considering that our sampling site is located on the southern Altay Mountains’ windward slopes, we reasonably suspected that the influence of the westerlies is one of the factors driving precipitation change in the study area.
The North Atlantic Oscillation (NAO) is the pressure gradient between the Icelandic Low and the Azores High. It is a north–south “see-saw” and significant oscillation phenomenon in the atmosphere of the Northern Hemisphere, as well as an essential climate variable affecting the Northern Hemisphere’s climate. The NAO index can accurately reflect variations in the upper reaches of the westerlies, and its low and high values correspond to the strengthening and waning of the mid-latitude westerlies [37]. Combined with our periodic analysis, our precipitation reconstruction’s approximately 30-year periodicities are consistent with the NAO activity cycle [38] or Bruckner cycle [39,40]. Thus, we suspected that NAO or solar activity may significantly influence precipitation variation in the study region.
To further investigate the precipitation variability of the Altay Mountains, which the atmosphere–ocean system may influence, we compared our reconstructions with the westerly index [41] and the NAO index [42]. As we expected, the decrease (increase) in the NAO index corresponds to the increase (decrease) in the westerly index, and the strengthening (weakening) of the westerlies leads to increases (decreases) in precipitation. Based on 22 years of low-pass filtering to illustrate the multi-year intergenerational alterations in the sequence, the westerly wind index sequence is positively correlated with precipitation (r = 0.41, p < 0.1), while it is negatively correlated with the NAO index (r = −0.45, p < 0.1). At multiple time intervals, the three sequences exhibit congruent trends (Figure 10). Numerous previous studies have mentioned this NAO and westerly climate model [43,44,45]. As indicated previously, the fluctuations in average rainfall in the southern Chinese Altay region are affected by westerlies and the NAO.

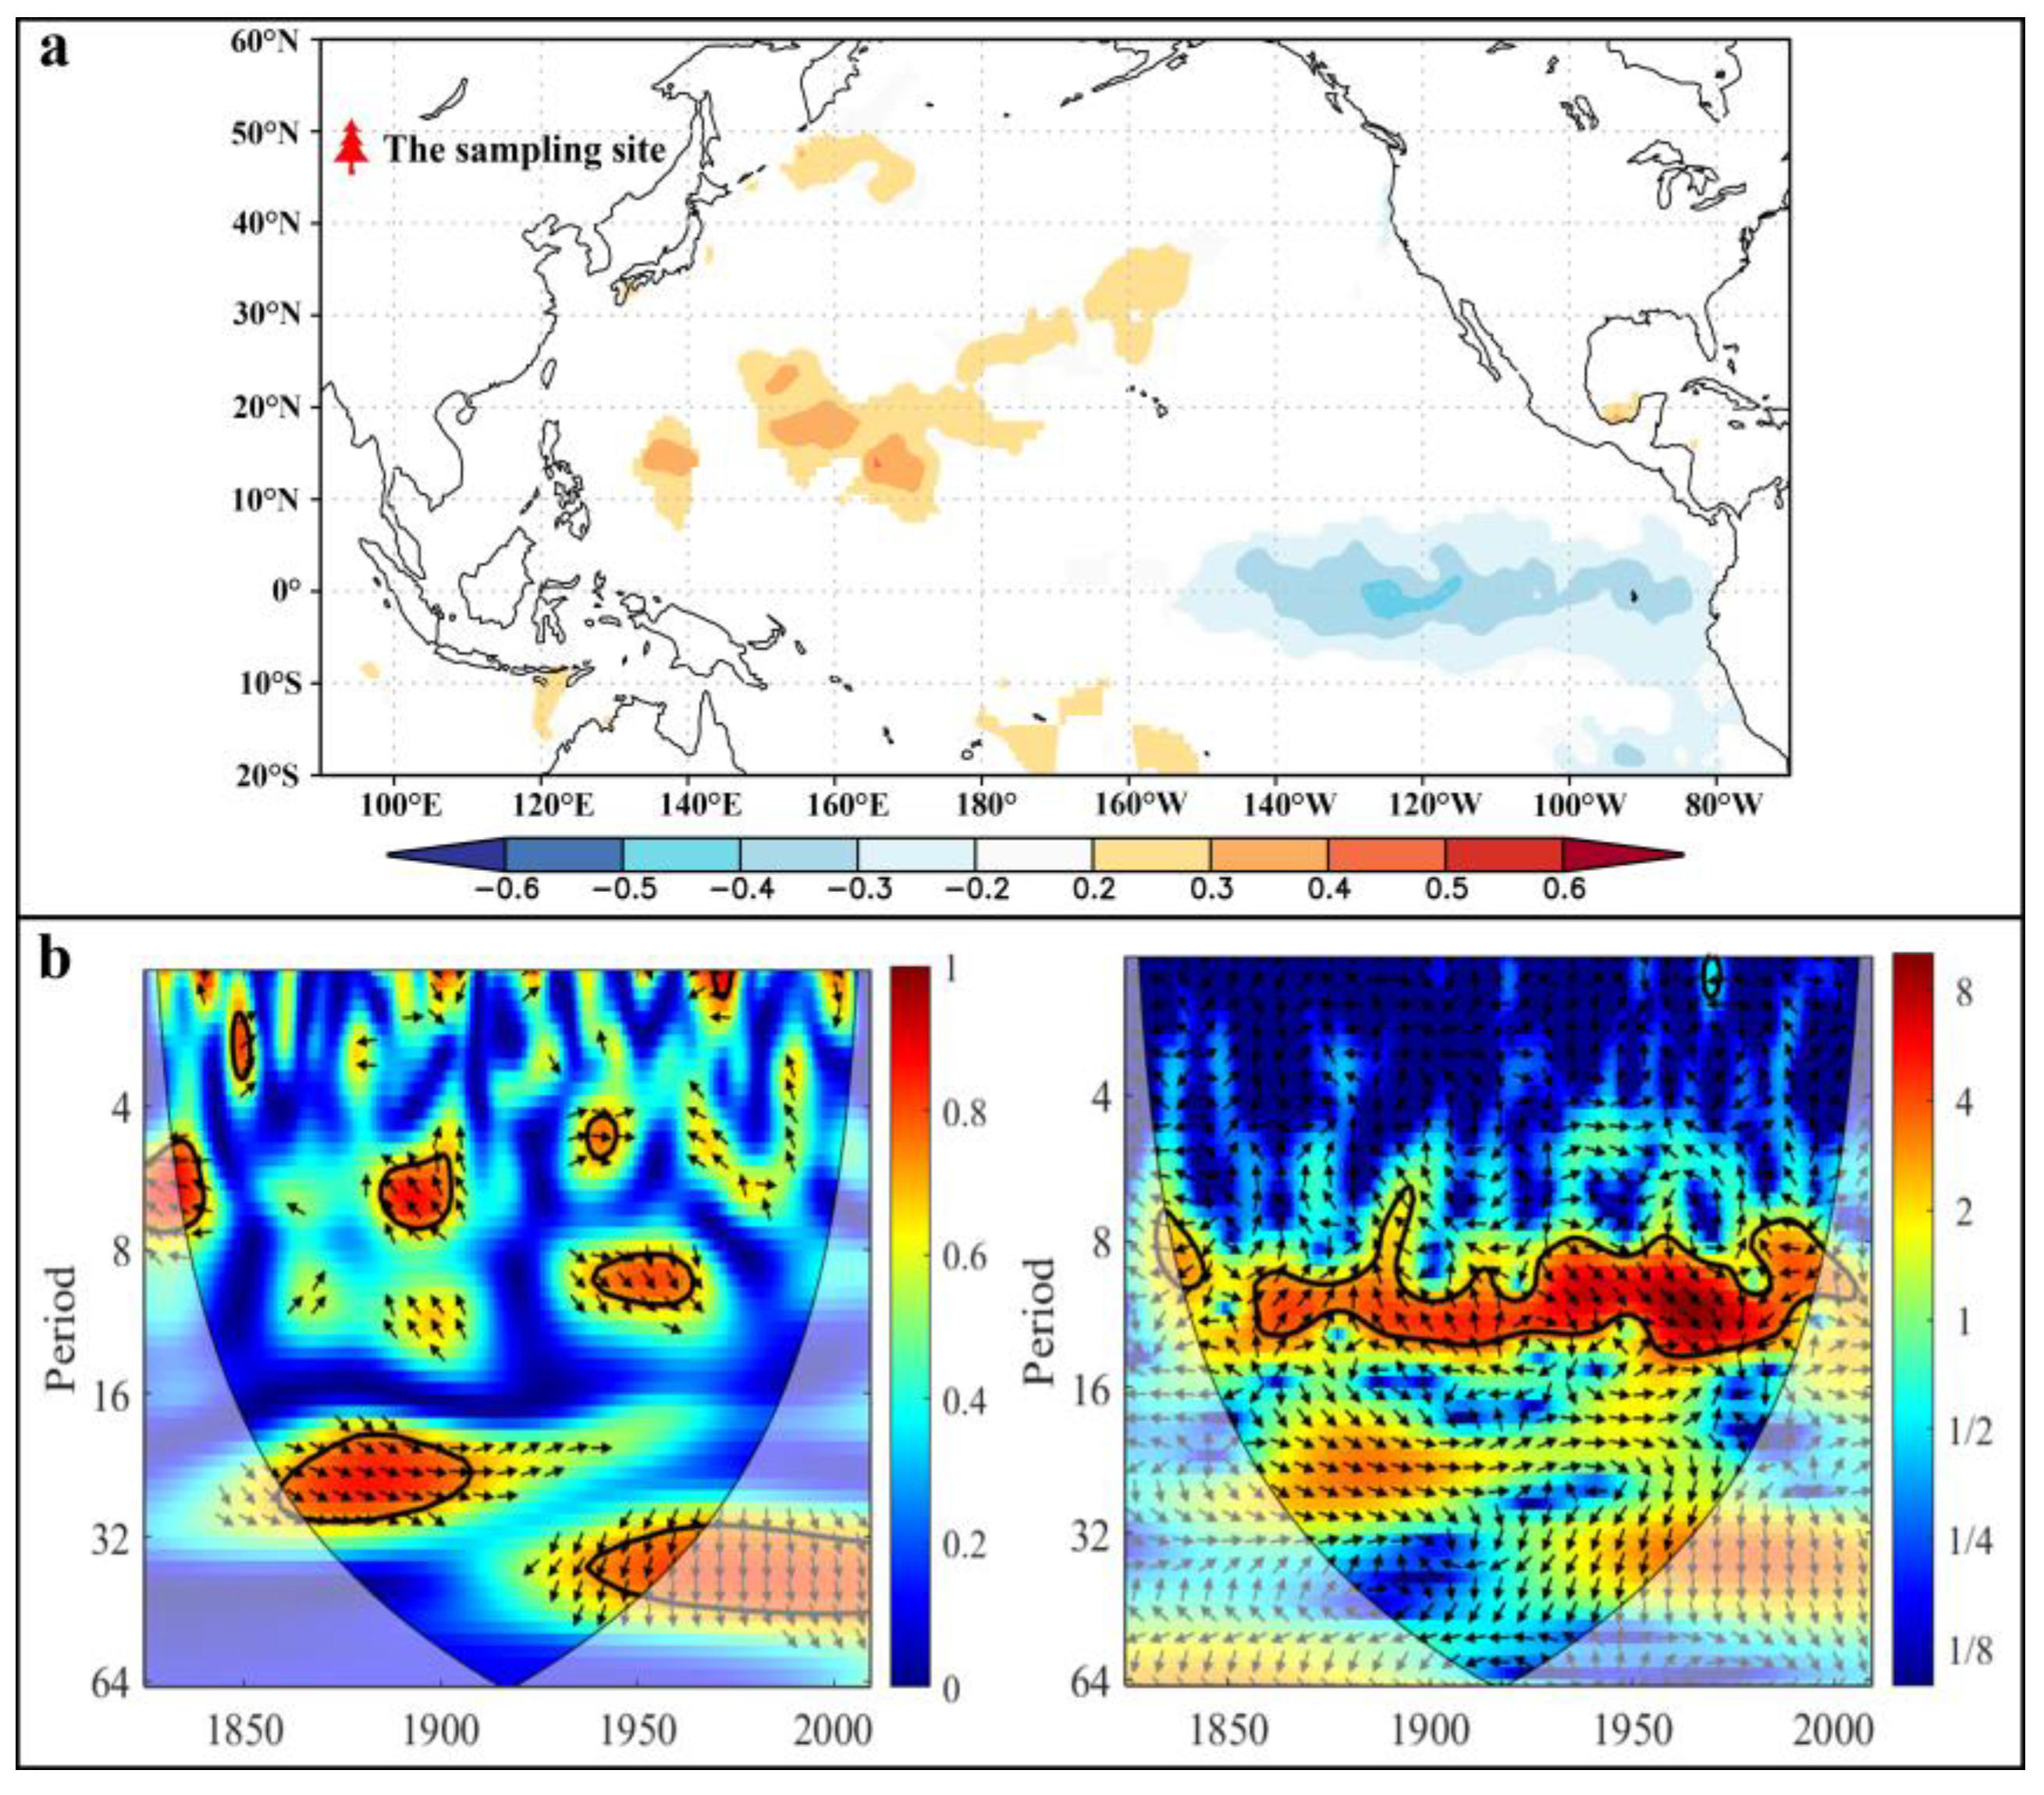
4.4. Other Synoptic Influence Mechanisms of Precipitation Variation

The MultiTaper method (MTM) spectral and Wavelet spectral analysis results of the reconstructed precipitation show that the precipitation sequence in the southern Altay Mountains has a quasi-periodic variation pattern of 2–7 years. Our reconstructed precipitation’s 2–7-year quasi-periodic variation lies within the fluctuation range of ENSO [46]. This periodic change suggests teleconnections between ENSO and the precipitation fluctuations in the southern Chinese Altay region. Furthermore, the above cycles are consistent with earlier dendroclimatic research that demonstrates ENSO’s effect on interior Asia’s interannual precipitation fluctuations [47,48,49]. The negative correlations of the precipitation series with the gridded HadlSST1 SST in the tropical Pacific support such an association (Figure 11a). According to the history of the ENSO event sequence [50], 20 of the 69 extreme wet years (precipitation > mean + 1σ) occurred in ENSO years. To further validate the connections between the reconstructed precipitation and large-scale climatic circulation, we computed the correlation coefficient between the precipitation from July to September in our precipitation series and the NINO 3.4 index. A comparison between the two records showed a certain correlation (r > 0.3, p < 0.1). The above shows that ENSO is correlated with precipitation changes south of the Altay Mountains.
In order to explore whether solar activity is the factor influencing the precipitation changes in the study area, cross wavelet (XWT) and wavelet coherency (WTC) analyses between the sunspot number (http://sidc.oma.be/silso/datafiles/ accessed on 16 April 2023) and the reconstructed precipitation in the southern Altay Mountains were carried out (Figure 11b). In the temporal frequency space, the XWT is used to locate areas where the time series exhibit a high common power, while the WTC is used to identify areas where the two time series co-vary. The U-shaped line in the figure represents the cone of influence. The effective value is within the range of this line. The thick, black line, indicating the 95% confidence level, and the arrows (vectors) designate the phase displacement between the reconstructed precipitation and sunspots. According to the analysis results, solar activity impacted our reconstructed precipitation sequence with different periodic changes. It is worth noting that the solar activity has a common, high-intensity, 11-year cycle with our precipitation sequence. The MultiTaper method spectral analysis results showed that the precipitation in this area has quasi-periodic variations every 10.5 years (Figure 7). Our rebuilt precipitation series’ 10.5-year cycle hinted at a potentially significant relationship with the 11-year Schwabe quasi-periodic pattern of sunspot activity [51]. This shows that solar activity has been the factor influencing precipitation in the study area after 1860 AD.

5. Conclusions

The total precipitation of the previous February–October was reconstructed using a 404-year regional tree ring width chronology of the southern mountains of the Altay region. The reconstruction is based on a significant correlation between instrumental data and the radial expansion of Siberian larch (r = 0.678, p < 0.01). The reconstruction results showed regional precipitation variations from 1615 to 2018. This reconstruction represents 45.9% of the variation in the instrumental precipitation records from 1957 to 2016. Based on the Pearson correlation analysis results, the precipitation in the southern Altay Mountains is the most influential hydrological factor in the growth of Siberian larch. Our spatial correlation analysis implied that the reconstructed precipitation provides a specific spatial representation of the Altay Mountains. Therefore, the tree ring width chronology of the Siberian larch in the southern Altay Mountains provides valuable information with which to investigate climate change in a long-term context. As with many other historical climate reconstruction studies based on proxies, we inspected the reconstructed model and compared our reconstructed precipitation series with other precipitation reconstructions from the regions nearby to verify the validity of our study. As implied in the case of our reconstruction, the rainfall variation series of the southern Altay Mountains reflects the distribution of dry and wet periods. Our spectral analysis results indicate that multiple large-scale climate forcings may influence regional moisture variability over the Chinese Altay region.
Further spatial correlation analysis, cross-wavelet spectrum analysis and a comparison with the westerly circulation and winter NAO index demonstrated a potential association of the rainfall fluctuations in the southern Altay Mountains with solar activity and the atmosphere–ocean system. Our preliminary findings need to be confirmed through ongoing dendroclimatological research. Continued research in this area could assist us in better comprehending the characteristics of precipitation and drought in Inner Asia and its surrounding areas.

Author Contributions

Conceptualization, Q.L. and W.P.; methodology, W.P., Q.L. and Y.Y.; formal analysis, J.W., Q.L., Q.C. and M.R.; investigation, C.S. and Y.L.; data curation, W.P., Q.C. and M.R.; writing—original draft preparation, W.P.; writing—review and editing, W.P.; visualization, Y.L. and H.S. All authors have read and agreed to the published version of the manuscript.

Funding

This research was funded by the National Natural Science Foundation of China, grant number 41991251, 42173080 and 32061123008; the STEP program, grant number 2019QZKK0101; and the Chinese Academy of Sciences, grant number XDA 23070202 and XDB40010300.

Data Availability Statement

The data presented in this study are available on request from the corresponding author.

Acknowledgments

The authors gratefully appreciate Chen Feng from Yunnan University for generously sharing the data with us. The authors would like to acknowledge the invaluable assistance of the Fu Yun Forest farm staff during the field investigation and sample processing.

Conflicts of Interest

The authors declare no conflict of interest.

References

  1. Popa, I.; Kern, Z. Long-term summer temperature reconstruction inferred from tree-ring records from the Eastern Carpathians. Clim. Dyn. 2009, 32, 1107–1117. [Google Scholar] [CrossRef]
  2. Díaz, S.C.; Touchan, R.; Swetnam, T.W. A tree-ring reconstruction of past precipitation for Baja California Sur, Mexico. Int. J. Climatol. J. R. Meteorol. Soc. 2001, 21, 1007–1019. [Google Scholar] [CrossRef]
  3. Liang, E.; Liu, X.; Yuan, Y.; Qin, N.; Fang, X.; Huang, L.; Huang, L.; Zhu, H.; Wang, L.; Shao, X. The 1920s drought recorded by tree rings and historical documents in the semi-arid and arid areas of northern China. Clim. Change 2006, 79, 403–432. [Google Scholar] [CrossRef]
  4. Wunder, J.; Fowler, A.M.; Cook, E.R.; Pirie, M.; McCloskey, S.P. On the influence of tree size on the climate–growth relationship of New Zealand kauri (Agathis australis): Insights from annual, monthly and daily growth patterns. Trees 2013, 27, 937–948. [Google Scholar] [CrossRef] [Green Version]
  5. Sangüesa-Barreda, G.; Camarero, J.J.; Esper, J.; Galván, J.D.; Büntgen, U. A millennium-long perspective on high-elevation pine recruitment in the Spanish central Pyrenees. Can. J. For. Res. 2018, 48, 1108–1113. [Google Scholar] [CrossRef]
  6. Uusitalo, J.; Arppe, L.; Hackman, T.; Helama, S.; Kovaltsov, G.; Mielikäinen, K.; Oinonen, M. Solar superstorm of AD 774 recorded subannually by Arctic tree rings. Nat. Commun. 2018, 9, 3495. [Google Scholar] [CrossRef] [Green Version]
  7. Shi, C.; Daux, V.; Li, Z.; Wu, X.; Fan, T.; Ma, Q.; Wu, X.; Tian, H.; Carre, M.; Ji, D.; et al. The response of relative humidity to centennial-scale warming over the southeastern Tibetan Plateau inferred from tree-ring width chronologies. Clim. Dyn. 2018, 51, 3735–3746. [Google Scholar] [CrossRef]
  8. Peng, D.; Zhou, T.; Zhang, L. Moisture sources associated with precipitation during dry and wet seasons over Central Asia. J. Clim. 2020, 33, 10755–10771. [Google Scholar] [CrossRef]
  9. Knorre, A.A.; Kirdyanov, A.V.; Vaganov, E.A. Climatically induced interannual variability in aboveground production in forest-tundra and northern taiga of central Siberia. Oecologia 2006, 147, 86–95. [Google Scholar] [CrossRef]
  10. Xu, G.; Liu, X.; Qin, D.; Chen, T.; Wang, W.; Wu, G.; Sun, W.; An, W.; Zeng, X. Relative humidity reconstruction for northwestern China’s Altay Mountains using tree-ring δ 18 O. Chin. Sci. Bull. 2014, 59, 190–200. [Google Scholar] [CrossRef]
  11. Chen, F.; Yuan, Y.J.; Wei, W.S.; Zhang, T.W.; Shang, H.M.; Zhang, R. Precipitation reconstruction for the southern Altay Mountains (China) from tree rings of Siberian spruce, reveals recent wetting trend. Dendrochronologia 2014, 32, 266–272. [Google Scholar] [CrossRef]
  12. Zhang, T.; Yuan, Y.; Chen, F.; Yu, S.; Zhang, R.; Qin, L.; Jiang, S. Reconstruction of hydrological changes based on tree-ring data of the Haba River, northwestern China. J. Arid Land 2018, 10, 53–67. [Google Scholar] [CrossRef] [Green Version]
  13. Jiang, S.; Zhang, T.; Yuan, Y.; Yu, S.; Shang, H.; Zhang, R. Drought reconstruction based on tree-ring earlywood of Picea obovata Ledeb. for the southern Altay Mountains. Geogr. Ann. Ser. A Phys. Geogr. 2020, 102, 267–286. [Google Scholar] [CrossRef]
  14. Fritts, H.C. Tree Rings and Climate; Academic Press: London, UK, 1976; p. 567. [Google Scholar]
  15. Cook, E.R. Bootstrap confidence intervals for red spruce ring-width chronologies and an assessment of age-related bias in recent growth trends. Can. J. For. Res. 1990, 20, 1326–1331. [Google Scholar] [CrossRef]
  16. Holmes, R.L. Computer-assisted quality control in tree-ring dating and measurement. Tree-Ring Bull. 1983, 43, 69–78. [Google Scholar]
  17. Cook, E.R. A Time Series Analysis Approach to Tree Ring Standardization (Dendrochronology, Forestry, Dendroclimatology, Autoregressive Process). Ph.D. Thesis, The University of Arizona, Tucson, AZ, USA, 1985. [Google Scholar]
  18. Cook, E.R.; Kairiukstis, L.A. (Eds.) Methods of Dendrochronology: Applications in the Environmental Sciences; Springer Science Business Media: Berlin/Heidelberg, Germany, 2013. [Google Scholar]
  19. Wigley, T.M.; Briffa, K.R.; Jones, P.D. On the average value of correlated time series, with applications in dendroclimatology and hydrometeorology. J. Appl. Meteorol. Clim. 1984, 23, 201–213. [Google Scholar] [CrossRef]
  20. Mann, M.E.; Lees, J.M. Robust estimation of background noise and signal detection in climatic time series. Clim. Change 1996, 33, 409–445. [Google Scholar] [CrossRef]
  21. Torrence, C.; Compo, G.P. A practical guide to wavelet analysis. Bull. Am. Meteorol. Soc. 1998, 79, 61–78. [Google Scholar] [CrossRef]
  22. Shen, C.; Wang, W.C.; Hao, Z.; Gong, W. Exceptional drought events over eastern China during the last five centuries. Clim. Change 2007, 85, 453–471. [Google Scholar] [CrossRef]
  23. Davis, M. Late Victorian Holocausts: El Niño Famines and the Making of the Third World; Verso Books: Brooklyn, NY, USA, 2002. [Google Scholar]
  24. Cook, E.R.; Anchukaitis, K.J.; Buckley, B.M.; D’Arrigo, R.D.; Jacoby, G.C.; Wright, W.E. Asian monsoon failure and megadrought during the last millennium. Science 2010, 328, 486–489. [Google Scholar] [CrossRef] [Green Version]
  25. Zhang, R.B.; Song, H.M.; Yuan, Y.J.; Wei, W.S.; Zhang, T.W.; Chen, F.; Yu, S.; Fan, Z.; Qin, L. Summer precipitation variation in the southern slope of the Altay Mountains recorded by tree-ring δ13C. J. Desert Res. 2015, 35, 106–112. [Google Scholar]
  26. Jiang, S.X.; Yuan, Y.J.; Chen, F.; Shang, H.; Zhang, T.; Yu, S.; Qin, L.; Zhang, R. A 291 year precipitation reconstruction in the upper Irtysh River basin based on tree-ring width. Acta Ecol. Sin. 2016, 36, 2866–2875. [Google Scholar]
  27. Shang, H.M.; Wei, W.S.; Yuan, Y.J.; Yu, S.L.; Zhang, T.W.; Zhang, R.B. Early summer temperature history in northeastern Kazakhstan during the last 310 years recorded by tree rings. J. Mt. Sci. 2011, 29, 402–408. [Google Scholar]
  28. D’Arrigo, R.; Wilson, R.; Liepert, B.; Cherubini, P. On the ‘divergence problem’ in northern forests: A review of the tree-ring evidence and possible causes. Glob. Planet Change 2008, 60, 289–305. [Google Scholar] [CrossRef]
  29. Opała-Owczarek, M.; Niedźwiedź, T. Last 1100 yr of precipitation variability in western central Asia as revealed by tree-ring data from the Pamir-Alay. Quat. Res. 2019, 91, 81–95. [Google Scholar] [CrossRef] [Green Version]
  30. Kozhevnikova, N.K. Dynamics of weather and climatic characteristics and ecological functions of a small forest basin. Contemp. Probl. Ecol. 2009, 2, 436–443. [Google Scholar] [CrossRef]
  31. Zhang, X.; Manzanedo, R.D.; D’Orangeville, L.; Rademacher, T.T.; Pederson, N. Snowmelt and early to mid-growing season water availability augment tree growth during rapid warming in southern Asian boreal forests. Glob. Change Biol. 2019, 25, 3462–3471. [Google Scholar] [CrossRef]
  32. Fang, K.; Frank, D.; Zhao, Y.; Zhou, F.; Seppä, H. Moisture stress of a hydrological year on tree growth in the Tibetan Plateau and surroundings. Environ. Res. Lett. 2015, 10, 034010. [Google Scholar] [CrossRef]
  33. Li, M.; Deng, G.; Shao, X.; Yin, Z.Y. Precipitation variation since 1748 CE in the central Lesser Khingan Mountains, Northeast China. Ecol. Indic. 2021, 129, 107969. [Google Scholar] [CrossRef]
  34. Cai, L.; Li, J.; Bai, X.; Jin, Y.; Chen, Z. Variations in the growth response of Pinus tabulaeformis to a warming climate at the northern limits of its natural range. Trees 2020, 34, 707–719. [Google Scholar] [CrossRef]
  35. Chen, F.; Yu, Z.; Yang, M.; Ito, E.; Wang, S.; Madsen, D.B.; Huang, X.; Zhao, Y.; Sato, T.; John, B.; et al. Holocene moisture evolution in arid central Asia and its outof-phase relationship with Asian monsoon history. Quat. Sci. Rev. 2008, 27, 351–364. [Google Scholar] [CrossRef]
  36. Yao, T.; Masson-Delmotte, V.; Gao, J.; Yu, W.; Yang, X.; Risi, C.; Sturm, C.; Werner, M.; Zhao, H.B.; He, Y. A review of climatic controls on δ18O in precipitation over the Tibetan Plateau: Observations and simulations. Rev. Geophys. 2013, 51, 525–548. [Google Scholar] [CrossRef]
  37. Wirth, S.B.; Glur, L.; Gilli, A.; Anselmetti, F.S. Holocene flood frequency across the Central Alps–solar forcing and evidence for variations in North Atlantic atmospheric circulation. Quat. Sci. Rev. 2013, 80, 112–128. [Google Scholar] [CrossRef]
  38. Seip, K.L.; Grøn, Ø.; Wang, H. The North Atlantic Oscillations: Cycle times for the NAO, the AMO and the AMOC. Climate 2019, 7, 43. [Google Scholar] [CrossRef] [Green Version]
  39. Halberg, F.; Cornelissen, G.; Sothern, R.B.; Czaplicki, J.; Schwartzkopff, O. Thirty-five-year climatic cycle in heliogeophysics, psychophysiology, military politics, and economics. Izv. Atmos. Ocean. Phys. 2010, 46, 844–864. [Google Scholar] [CrossRef]
  40. Raspopov, O.M.; Shumilov, O.I.; Kasatkina, E.A.; Turunen, E.; Lindholm, M. 35-year climatic bruckner cycle-solar control of climate variability? In The Solar Cycle and Terrestrial Climate, Solar and Space Weather; ESA Publications: Noordwijk, The Netherlands, 2000; Volume 463, p. 517. [Google Scholar]
  41. Li, W.L.; Wang, K.L.; Fu, S.M.; Jiang, H. The Interrelationship between Regional Westerly Index and the Water Vapor Budget in Northwest China. J. Glaciol. Geocryol. 2009, 30, 28–34. [Google Scholar]
  42. Cook, E.R.; D’Arrigo, R.D.; Mann, M.E. A well-verified, multiproxy reconstruction of the winter North Atlantic Oscillation index since AD 1400. J. Clim. 2002, 15, 1754–1764. [Google Scholar] [CrossRef]
  43. Wallace, J.M.; Hsu, H.H. Another look at the index cycle. Tellus A Dyn. Meteorol. Oceanogr. 1985, 37, 478–486. [Google Scholar] [CrossRef] [Green Version]
  44. Lorenz, E.N. Seasonal and irregular variations of the Northern Hemisphere sea-level pressure profile. J. Atmos. Sci. 1951, 8, 52–59. [Google Scholar] [CrossRef]
  45. Casas-Gómez, P.; Sánchez-Salguero, R.; Ribera, P.; Linares, J.C. Contrasting signals of the westerly index and north atlantic oscillation over the drought sensitivity of tree-ring chronologies from the mediterranean basin. Atmosphere 2020, 11, 644. [Google Scholar] [CrossRef]
  46. Allan, R.; Lindesay, J.; Parker, D. El Niño Southern Oscillation Climatic Variability; CSIRO Publishing: Clayton, Australia, 1996. [Google Scholar]
  47. Li, J.; Gou, X.; Cook, E.R.; Chen, F. Tree-ring based drought reconstruction for the central Tien Shan area in northwest China. Geophys. Res. Lett. 2006, 33, L07715. [Google Scholar] [CrossRef] [Green Version]
  48. Chen, F.; Yuan, Y.J.; Chen, F.H.; Wei, W.S.; Yu, S.L.; Chen, X.J.; Fan, Z.; Zhang, R.; Zhang, T.; Shang, H.; et al. A 426-year drought history for Western Tian Shan, Central Asia, inferred from tree rings and linkages to the North Atlantic and Indo–West Pacific Oceans. Holocene 2013, 23, 1095–1104. [Google Scholar] [CrossRef]
  49. Chen, F.; Yuan, Y.; Zhang, T.; Shang, H. Precipitation reconstruction for the northwestern Chinese Altay since 1760 indicates the drought signals of the northern part of inner Asia. Int. J. Biometeorol. 2016, 60, 455–463. [Google Scholar] [CrossRef] [PubMed]
  50. Gergis, J.L.; Fowler, A.M. A history of ENSO events since AD 1525: Implications for future climate change. Clim. Change 2009, 92, 343–387. [Google Scholar] [CrossRef]
  51. Nagovitsyn, Y.A. A nonlinear mathematical model for the solar cyclicity and prospects for reconstructing the solar activity in the past. Astron. Lett. 1997, 23, 742–748. [Google Scholar]
Figure 1. (a) Positioning map of the sampling site and meteorological stations. (b) Dimensional topographic map of sampling site.
Forests 14 01496 g001
Figure 2. Number of cores, together with the tree ring standard (STD), residual (RES) and Arstan (ARS) chronologies of Siberian larch.
Forests 14 01496 g002
Figure 3. Monthly distributions of mean temperature and precipitation at Fuyun meteorological stations from 1956 to 2016 AD.
Forests 14 01496 g003
Figure 4. Correlation coefficients between the STD chronology and the instrumental precipitation/temperature of the Fuyun climatological station (1956 to 2016). The dotted lines indicate significant variables (p < 0.05).
Forests 14 01496 g004
Figure 5. Observation and reconstruction of February–October precipitation during the calibration period of 1957–2016.
Forests 14 01496 g005
Figure 6. Reconstructed and 10-year, low-pass-filtered (black line) values of February–October precipitation, where horizontal dotted lines represent the limit of one standard deviation.
Forests 14 01496 g006
Figure 7. The results of the MultiTaper method (MTM) of spectral analysis (a) and Wavelet spectral analysis (b) of the reconstructed precipitation.
Forests 14 01496 g007
Figure 8. Correlation characteristics of the reconstructed precipitation with the grid-box data (CRUTS 4.01) from 1951 to 2016 (a) and from 1901 to 2016 (b), where the black triangle is the sampling site.
Forests 14 01496 g008
Figure 9. (a) Comparison between our reconstructed precipitation series and the other precipitation reconstructions [11] from the surrounding areas. (b) For a convenient comparison, both series were normalized and smoothed using SPSS to emphasize long-term variations.
Forests 14 01496 g009
Figure 10. To conveniently compare the reconstructed precipitation (a), we normalized the westerly index [41] (b) and NAO index [42] (c) using SPSS. The thick colored lines were processed with a 22-year low-pass filter to emphasize long-standing variations.
Forests 14 01496 g010
Figure 11. (a) Spatial correlation plots for the reconstructed precipitation with averaged HadlSST1 sea surface temperatures (SST) from July to September during the period of 1950–2018. (b) Wavelet coherency (WTC) and cross-wavelet spectrum (XWT) analysis revealing the relationship between the reconstructed precipitation and sunspot series.
Forests 14 01496 g011
Table 1. Calibration and verification statistics for the reconstruction.
CalibrationVerificationCalibrationVerificationFull Calibration
(1957–1986)(1957–1986)(1987–2016)(1987–2016)(1957–2016)
r0.7130.7130.5760.5760.678
r20.5080.5080.3310.3310.459
RE 0.435 0.258
CE 0.421 0.179
ST 23+/7 22+/847+/13
Disclaimer/Publisher’s Note: The statements, opinions and data contained in all publications are solely those of the individual author(s) and contributor(s) and not of MDPI and/or the editor(s). MDPI and/or the editor(s) disclaim responsibility for any injury to people or property resulting from any ideas, methods, instructions or products referred to in the content.

