Abstract
Permanent urban forest reserves are aesthetic assets within cities. Consequently, their aesthetic quality must be continuously preserved and visually assessed. Even though numerous studies have utilized multiple variables to characterize visual aesthetics, they have lacked information on the importance and weightage of each variable, making it very challenging to assess this. Therefore, this study aimed to determine the relative weightage of the visual aesthetic variables for permanent urban forest reserves in Malaysia. We used a converging approach assessment method to determine the ranked preferences for the visual aesthetic variables of permanent urban forest reserves by selecting multiple variables based on public preferences and expert survey assessments of these. In addition, we utilized the converging approach results as a guide for the analytic hierarchy process in order to determine the weights of the visual aesthetic variables. We identified 14 variables, derived from six main variables, as multiple visual aesthetic variables for permanent urban forest reserves based on the content of photos taken by 12 public participants. The expert survey confirmed the validity of the classification of the variables and the importance of their linear sequencing. It was revealed that the greatest weight normalization (W = 10) was achieved from the variables “openness with city view”, “uniqueness of water with natural elements”, and “openness with water view”, while the least weight normalization (W = 1) was obtained from the variables “legibility with natural path”, “uniqueness with man-made elements”, and “uniqueness with natural elements”. Our findings provide a foundation for assessing the visual aesthetic quality of permanent urban forest reserves.
1. Introduction
Following the increasing urbanization of cities, the conversion of green spaces into gray areas, and the loss of cities’ natural aesthetics, urban forests in or near cities have become recognized as increasingly important for the well-being of city residents and the enjoyment of the aesthetics and sustainability of urban areas. In addition, modern lifestyles in concrete-filled cities have increased residents’ psychological and physiological challenges. In turn, the visual aesthetics of urban forests can assist in reducing stress, boosting mental and physical wellness, positively influencing people’s moods, and promoting quality of life, as demonstrated by studies from around the world [1,2,3]. Visual aesthetics significantly affect the public appreciation of the urban environment; aesthetics can influence psychology and human behavior by influencing a person’s emotions [4,5]. Increasingly, the visual aesthetics of urban forests have played a crucial role in the tourist dimension [6]. Aesthetics are critical for evoking associations, perceptions, and emotions, all of which are integral components of the tourist experience [7]. Aesthetic perceptions and emotions enhance travelers’ experiences and happiness, increasing their loyalty and desire to return to a place [6]. In the majority of studies on tourist management [8,9,10], the aesthetics of urban forests have been identified as a significant factor in visitor enjoyment that would maximize their pleasure. Therefore, increasing the aesthetic value of urban forests to visitors benefits the economy of the country as a whole, and their enhancement promotes local economies in particular. Consequently, the demands of urban communities have increased the interest in preserving the visual aesthetic values of urban green areas, such as permanent urban forest reserves [4,11].
Aesthetics refers to the perception and enjoyment of beauty [12], with vision having the most significant influence on assessing perception and aesthetic satisfaction. Therefore, the term “visual aesthetics” relates to the description of aesthetics [13]. With the quality of the visual aesthetics of landscapes having received increasing attention, research on their visual evaluation has gradually matured, with the visual aesthetic assessment of landscapes having served as a model for the visual aesthetic assessment of urban forests [14]. Given the importance placed on visual aesthetics by local communities and their impact on the importance of urban forests, the quality of the visual aesthetics has been incorporated into urban forest research and their planning and management as a guide for decision-makers [4,15]. Research on the assessment of urban forest aesthetics through visual preferences has relied primarily on photography and questionnaire-based public or expert surveys. This suggests that the experiences and opinions of the public and experts on urban forests can be used to guide management practices and argue for or against them [16]. According to Daniel [17], the most common evaluation methods divide aesthetic visual assessment into expert, public-perception, and converging approaches, with the converging approach being expressed as a mixture of public perception and expert analysis. In addition, some studies have used the analytic hierarchy process (AHP) to determine the relative importance of the assessment criteria in visual aesthetic assessment [18,19]. Consequently, visual aesthetic assessment is regarded as a credible method for enhancing the quality of urban forests through planning and management [20].
In recent years, researchers from a variety of disciplines have sought to determine how to construct and identify the variables that would be helpful in assessing the visual aesthetics of urban forests. Kaplan and Kaplan [21] presented the theory of information processing, which explains the basis of the human desire for information and the capacity to process it for survival. In this concept, humans developed mental and perceptual capacities for processing visual information for survival. According to the theory of information processing, humans prefer scenery due to their need for information and their ability to process it, and this involves four distinct variables—coherence, complexity, legibility, and mystery. These four characteristics relate to our species’ need to rapidly access, comprehend, and make sense of our environment in order to meet our fundamental needs and the capacity to process it for survival. Therefore, people prefer urban forest scenes with features that aid in making sense of information or exploring it. In addition, these information needs are time-bound, addressing either the present-immediate or future-promised. Within the Kaplan framework, coherence is the crucial variable that aids this understanding in the moment. By contrast, when the viewer is engaged in exploration, the environment’s complexity captures the individual aesthetically. Also, when the observer is immersed in the environment, the experience is one of aesthetic gratification associated with legibility and, in the case of exploration, it generates mystery [16,22,23,24]. According to the prospect–refuge theory by Appleton [25], humans have, through evolution, adapted to environments that provide both prospect (the ability to acquire a perspective seen) and refuge (the ability to hide). Under these conditions, the prospect is defined as a place with an unobstructed view, and refuge is where something can hide. The prospect–refuge theory attempts to explain why certain surroundings seem secure and thus meet basic human psychological needs. Environments that suit basic human psychological needs will allow people to observe (prospect) without being seen (refuge). Thus, the prospect–refuge theory explains the preference for being able to “see without being seen”. According to the theory, the more open an environment, the more prospects it provides, and the less refuge it offers, and vice versa. From this logic, humans tend to choose environments based on the visual scale that defines the variable “openness”. Openness is defined in terms of the ease with which an observer in the landscape can obtain an extensive perspective of the surrounding area [22,26,27,28]. According to the push–pull theory [29], humans prefer scenery with unique features that have a pull motivating the push. This theory examines whether a destination has distinguishing features that remain in the viewer’s imagination. The push–pull theory, therefore, supports the uniqueness variable. Uniqueness refers to a destination’s distinguishing characteristic, one that creates a memorable impression in the viewer’s mind [6,22,30]. As a result, these variables influence our perceptions and preferences for the visual aesthetic of urban forests. These variables from the literature were used as a foundation for variables linked with the aesthetic visual qualities of urban forests (Table 1) [22].

Table 1.
Definition and value of the variables used in this research. Source: Mundher [22].
Experts and the public both agree that the visual aesthetics of urban forests are important in terms of health, tourism, and the economy. In addition, public demands have included incorporating visual aesthetics in urban forest protection programs, especially permanent urban forest reserves [4]. To achieve these requirements, it is vital to have knowledge of the multiple variables pertaining to local permanent urban forest reserves. Also, the assessment methodologies that link public desire with expert knowledge should be used to determine the importance and validity of variables influencing visual aesthetic qualities. However, conducting these assessment processes and making decisions remains problematic due to the lack of knowledge regarding the weight of each variable. Therefore, in this study, we aimed to determine the relative weightage of the visual aesthetic variables for permanent urban forest reserves in Malaysia.
2. Materials and Methods
The method used to assess the visual aesthetic qualities of permanent urban forest reserves in Malaysia consisted of two parts—the selection of multiple variables based on public preferences and decision-making based on expert survey assessment. This means we used a converging approach—a strategy for assessing the visual aesthetic qualities that combine perception and expert-based assessment approaches (Figure 1).
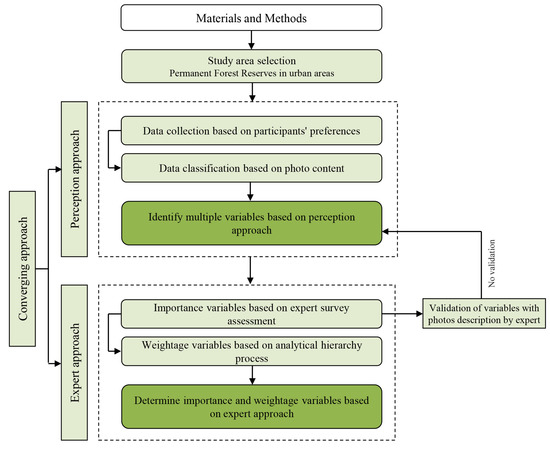
Figure 1.
Methodological framework for the study.
2.1. Study Area Selection
In the first step, suitable sites were selected. These were permanent urban forest reserves in Klang Valley, Malaysia. The Klang Valley region is known as a highly urbanized area—the beating economic heart of Malaysia. As a result of this urbanization and development, there are only a few regional forests left, with a further few small, scattered forests that have been protected as permanent forest reserves (PFR). These PFRs are more in contact with the urban population and are considered to be the city’s green lungs, in addition to the several other functions they perform that demand their preservation and aesthetic management. In this study, we selected the Bukit Gasing Forest Reserve and the Bukit Cerakah Forest Reserve as the study areas (Figure 2). These are classed as permanent urban forest reserves, containing man-made elements and requiring ongoing upkeep, and they are usually accessible to the public.
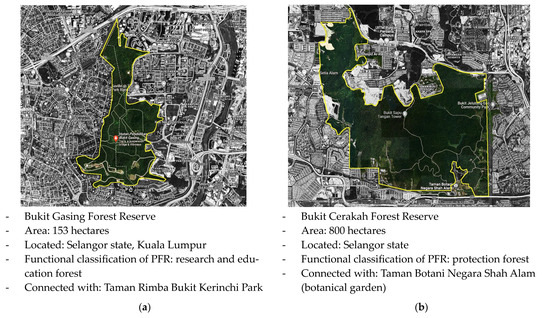
Figure 2.
Shows the location of the study area selection and the information for each site, and the yellow line indicates the boundary of permanent forest reserves; location (a) represents the Bukit Gasing Forest Reserve, and location (b) represents the Bukit Cerakah Forest Reserve.
2.2. Identifying Multiple Variables Based on Perception Approach
Two primary steps were involved in selecting the multiple variables—data collection based on participant preferences and data classification based on content.
Firstly, the data collection was based on participant preferences. Twelve Malaysian volunteers, who had previously visited the urban forest and expressed a willingness to assist, were selected as the sample for the study. All of these were Malaysians of various ethnicities, their ages ranging from 29 to 33 years, and their educational backgrounds being diverse (design, environmental, technical, and social). The researchers purposely picked equal background groups in order to compare the results more accurately. The participants were tasked with capturing sights they deemed aesthetically pleasing. No specific number of photos was given—this decision was left to them. This method of collecting data is known as the participant-generated image (PGI) method—an efficient technique for studying visual interest and aesthetic preferences [31,32]. The PGI method has a history of application in the social sciences dating back to the 1970s, despite popular belief to the contrary [31]. The technique entails only providing cameras to willing participants who are requested to capture photos of a specific theme or issue, such as determining aesthetic preferences in permanent urban forest reserves, and the subjects become “participants” in the research. PGI is a powerful tool for social scientific research, including psychology, sociology, landscape planning, leisure and tourism, and urban studies. It is widely believed that the autonomy it grants participants enables them to determine the research’s scope and exert greater control over what they contribute. Proponents of PGI research also emphasize its focus on the visual rather than the textual, as well as the benefits it can provide not only in terms of advancing academic knowledge but also for experts, managers, and policymakers.
Secondly, the data classification was based on the content of the photos taken by the participants and involved multiple variables taken from earlier studies, including six main (primary visual aesthetics) variables—coherence, complexity, legibility, mystery, openness, and uniqueness.
2.3. Importance Multiple Variables Based on Expert Survey Assessment
There were two primary steps involved in the decision-making based on an expert assessment—validation of the data classification and the visual aesthetic assessment, both based on the photo survey. The expert survey was organized using Google Forms and a variety of determinants. Each variable was represented by a photo for description, along with three photos for assessment. The sequential placement of photos representing the same variable was avoided in order to achieve better responses from the survey respondents. Also, additional photos were placed at the beginning and end of the survey to familiarize the participants with the survey’s procedures and prevent their anticipation of completing the survey rapidly; the results from these extra photos were not included in the analysis.
The expert survey consisted of three parts: (A) the expert demographics; (B) the description of the photos in order to validate the data classification; and (C) the photo survey in order to assess the visual aesthetics. Part (A) consisted of six questions relevant to the expert’s demographic information, such as gender, years of work experience, and expertise, as well as additional questions relevant to the expert’s understanding of their experience. Part (B) had a request to describe the photos in terms of visual aesthetics in order to validate the classification of the variables. This request stated, “Write two or three words that best describe the visual aesthetics of the scene”. Part (C) had a request involving assigning each photo a level of preference for the scene’s visual aesthetics in order to assess the visual aesthetics. This request stated, “Rate your level of preference of the visual aesthetics in this scene”. The experts were asked to assess the photo based on a Likert scale from 1 (very low preference) to 5 (very high preference).
2.4. Weightage Multiple Variables Based on an Analytical Hierarchy Process
The AHP was developed by Saaty in 1980, and it has been a useful technique for organizing and modeling multiple variables [33]. Using a series of pairwise comparisons of the variables, AHP can assist decision-makers in assessing the weights of the variables in the form of a hierarchy based on each variable’s importance [34]. Three steps were required to determine the weights: pairwise comparisons of the multiple variables, consistency ratio (CR) and raw weights of the multiple variables, and weight normalization of the multiple variables.
2.4.1. Pairwise Comparisons of the Multiple Variables
Pairwise comparisons relied on the expert assessment by Likert scale to obtain the linear importance mean value of each visual aesthetic variable. To convert the Likert scale values to determine the importance scale of the pairwise comparisons, firstly, the difference value between the highest and lowest mean values must be determined (Equation (1)). Then the output must be divided by the number of scales for pairwise comparison to determine the values that indicate the level of importance amongst the variables (Equation (2)) [34]. To perform a set of pairwise comparisons in this study, a 1 to 9 Saaty’s scale was incorporated to ensure the required consistency of judgments, which can be easily determined by calculating the CR [35]. Table 2 displays the scales used to obtain ratings from the traditional Saaty scale. Furthermore, to accurately conduct this pairwise comparison, the AHP online system tool AHP-OS, Last update: Feb 26, 2022, Rev: 172 (https://bpmsg.com/ahp/) accessed on 27 September 2022 [36] was used, which extracted the matrix and the principal eigenvalue.
where Dmv = Difference mean value, Hmv = Highest mean value, Lmv = Lowest mean value, Lv = Level of important value, and n = number of scales for pairwise comparison; in Saaty’s scale, n = 9.
Table 2.
Scale for pairwise comparison of the variables.
2.4.2. Consistency Ratio and Raw Weights of the Multiple Variables
The CR had to be determined in order to assess the consistency of the judgment entries. In addition, to obtain the final variable weights, the GNU Octave tool, Version 7.2.0 (https://octave.org/) accessed on 29 September 2022 was used to insert a random consistency index (RI) (Table 3) with mathematical equations for the consistency index (CI) (Equation (3)) and CR (Equation (4)) in the form of a code within the tool (Appendix A), and with the introduction of the importance matrix for the variables extracted from the AHP online system tool. To validate a result, the consistency ratio (CR) had to be less than 0.1, otherwise the result would have to be revisited and re-examined until a dependable (consistent) value was reached [37].
where λ max = principal eigenvalue, n = number of items being compared in the matrix, RI = random consistency index, CI = consistency index, and CR = consistency ratio.
Table 3.
Random consistency index (RI) [38].
2.4.3. Weightage Normalization of the Multiple Variables
Weightage normalization is the process of altering the values of a variable or set of variables such that they share a common scale or range. It is frequently used to compare or combine numbers with multiple units of measurement or scales or to weigh the relative relevance of various decision-making criteria [39]. In this study, the weight normalization is recalculated by dividing the extracted raw weight of each variable by its maximum extracted raw weight value since a higher raw weight value is indicative of superior performance. The results will be between 0 and 1, and the best-raw weight value is always 1. In addition, for the technique to be valuable and easy to use in the assessment, the result is multiplied by an integer number to provide normalized integer values that can be used to assess the visual aesthetic variables for permanent urban forest reserves (Equation (5)) [33].
where W = Weightage normalization, RW = Raw Weight, MaxRW = Maximum Raw Weight, and n = normalized integer values.
3. Results
3.1. Data Collection and Classification as Multiple Variables
The 12 participants took a total of 750 photos, an average of 62 photos per participant for both study areas (Table 4). These photos expressed their preferences for and admiration of the captured scenery. The photos were classified based on their contents and 14 variables were identified, derived from the six major variables for permanent urban forest reserves (coherence, complexity, legibility, mystery, openness, and uniqueness) (Table 5).
Table 4.
Demographic information for twelve participants.
Table 5.
Identification of multiple visual aesthetic variables for permanent urban forest reserves.
To initiate the decision-making, four photos were picked to represent each of the 14 variables, one for validating the classification and three for assessing the visual aesthetic qualities of the permanent urban forest reserve (Appendix B).
3.2. Expert Sample Size and Demographic
Forty experts participated in the study. This number was calculated relative to the decision-makers in the Malaysian forests in the Klang Valley (the study area), where the state of Selangor and Kuala Lumpur contains 15 decision-makers. However, there was a study [40] that stated that the minimum number of respondents for the survey should be 30, and so the number was increased to 40. The target sample sizes were sufficient for assessing the visual aesthetics of the permanent urban forest reserves and for making decisions, based on the opinion that “the strength of samples derives from their accurate selection, rather than their sizes” [41].
Of the 40 experts who completed the survey, 77.5% were male, and 50.0% had more than 10 years of experience. In addition, 87.5% of them had a background in forestry. It was discovered that 85.0% of them had a Master’s degree and/or a PhD. Notably, 37.5% worked in the forestry department and 37.5% in forestry-related higher education institutions. Forest recreation accounted for 32.5% of the total spectrum of work/research interests (Table 6). These findings indicate that the sample selection was appropriate and that the experts were highly knowledgeable in the fields of forestry and decision-making.
Table 6.
Expert demographics.
3.3. Validation of Variable Based on Expert Survey Description
At the beginning of the decision-making process, the multiple variable classification was validated by having the experts describe each scene. The results showed the classification’s accuracy through the variable’s keyword expressions (Table 7). The experts expressed the coherence variable using the terms “density and unity” and the complexity variable using the terms “complexity”, “diversity”, and “variety”. In addition, they used the terms “view of end trail/start point”, “natural urban forest trail”, and “visual direction and accessibility” to characterize the legibility with the natural path variable. Similarly, to describe the legibility with a man-made path variable, they used the terms “visual direction” and “accessibility”, “welcoming forest trail”, and “urban forest road corridor”, where legibility was the variable referring to the clarity of information, as well as the ease of access and ability to return to the starting point in a three-dimensional area–namely, it contained a trail in an urban forest. Also, they described a mystery with a natural path variable using the terms “mystery” and “discovered road”, “forest nature trail”, and “scary path”. Similarly, they described the mystery with a man-made path variable using the terms “diversity” and “man-made access”, “urban forest” and “vehicle road”, and “adventure and yearning”, where mystery was the variable that expressed the complexity and exploration of information in three-dimensional areas–that is, it contained a trail in an urban area.
Table 7.
Expert descriptions of the photos for validation of the data classifications.
The experts validated the openness with a tree view variable as “opening to tree scenery” and “viewpoint with trees”. The openness with a framing view variable was described as “opening overlooking greenery”, “opening on a forest void/gap”, “lookout point”, “peeping view”, “forest window”, and “vista”, indicating a view of forest slopes through a forest void/gap. For the openness with a city view variable, the experts described the scene in terms of “open city view”, “nature and urbanization”, and “panorama of the city view”. They used the terms “scenic forest water view”, “openness”, and “uniqueness” to characterize the variable openness with a water view.
To demonstrate the validity of the uniqueness variables, the experts described the uniqueness with natural elements variable using the terms “natural and unique arch”, and “natural trellis with trail”. In addition, they described the uniqueness with man-made elements variable via the terms “forest resting point”, “man-made with natural feel”, “harmony with nature”, and “unique view”, all of which showed uniqueness with a man-made feature. The experts defined the uniqueness of water with natural elements variable as “water stream in the forest” and “unique water view”. Similarly, they characterized the variable uniqueness of water with man-made elements with the terms “unique but man-made”, “water with man-made structure”, and “wonderful natural lake view”, which all refer to the uniqueness of the water element with the presence of man-made components.
Mentioning that some experts used adjectives that described the aesthetic emotion rather than the aesthetic scene, such as “calm”, “serene”, “peaceful”, “tranquil”, “relaxed”, and “aesthetically pleasing view”, underscores the idea that these selected scenes were aesthetically pleasing in the eyes of both the experts and the general public.
3.4. Determining Importance Variables Based on Expert Survey Assessment
A visual aesthetic assessment was conducted based on the expert survey in order to assess the importance of each variable and the ability to conduct pairwise comparisons of the variables to determine their weights. Using the Likert scale to determine the level of preference for each photo among the 40 experts, we were able to calculate the individual mean scores for each (Table 8).
Table 8.
Individual mean scores for each photo for assessing the visual aesthetics based on the expert survey.
The results revealed that the four highest visual aesthetic preference scores for the photos were I01 = 4.55 (openness with city view), M03 = 4.60 (uniqueness of water with natural elements), J01 = 4.63 (openness with a water view), and N02 = 4.63 (uniqueness of water with man-made elements). The results indicate that the presence of water contributed to an increase in the value of the visual aesthetics of the permanent urban forest reserves. In addition, the openness of the city from the peak of the urban forest had a high visual aesthetic value. Conversely, the four lowest scores were K01 = 2.80 (uniqueness with natural elements), C02 = 3.23 (legibility with natural path), K03 = 3.28 (uniqueness with natural elements), and L03 = 3.43 (uniqueness with man-made elements). These results reveal that the uniqueness of natural or man-made elements reduced the visual aesthetic value of the permanent urban forest reserves. The results also show that legibility with a natural path had a low visual aesthetic value. The experts’ visual aesthetic preferences are depicted in (Figure 3), which illustrates both the high- and low-preference photos.
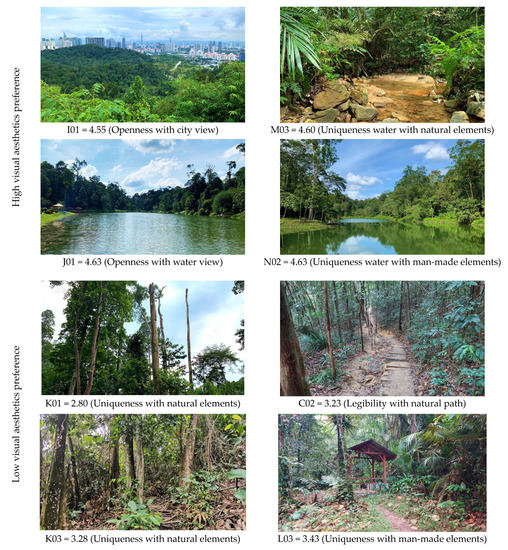
Figure 3.
High- and low-preference photos of visual aesthetics based on the expert survey.
To identify a linear sequence of the importance of the variables, the mean values for each variable were calculated. It was found that the four highest mean scores for the visual aesthetic variables based on the expert survey were I = 4.49 (openness with city view), M = 4.46 (uniqueness of water with natural elements), J = 4.36 (openness with a water view), and N = 4.34 (uniqueness of water with man-made elements). These findings are consistent with the results from the preferred individual photos. These results indicate that openness of the city viewed from the peak of the urban forest was preferred over all other variables. The remainder of the variables revealed that the water element was the most common among those with the highest visual aesthetic preferences.
By contrast, it was found that the four lowest mean scores based on the expert survey were F = 3.75 (mystery with man-made path), C = 3.65 (legibility with natural path), L = 3.54 (uniqueness with man-made elements), and K = 3.23 (uniqueness with natural elements). Again, these results were consistent with the previous results from the preferred individual photos. The results also indicated that mystery with a man-made path detracted from the visual aesthetics of a scene, and legibility with a natural path did the same. Mystery with a natural path and legibility with a man-made path were the most preferred variables in terms of the visual aesthetics. The least preferred variables were uniqueness with man-made or natural elements.
The expert decisions for all the visual aesthetic variables had mean scores higher than 3, proving that, in general, all the visual aesthetic variables for the permanent urban forest reserves were aesthetic scenes, albeit to varying degrees.
3.5. Determining Weightage Variables Based on an Analytical Hierarchy Process
Utilizing the expert preference decisions and the average mean scores for the visual aesthetic variables, the variable “Openness with city view” has the highest mean value Hmv = 4.49, while the variable “Uniqueness with natural elements” has the lowest mean value Lmv = 3.23; therefore, according to the equation (Dmv = Hmv − Lmv), the difference mean value Dmv is 1.26. Then, we determined the level of importance value Lv between the variables using the equation (Lv = Dmv/n), where n = 9 according to Saaty’s scale for pairwise comparison of variables. Lv = 0.14 was determined to be the level of importance value, representing the difference between each level of Saaty’s scale (Figure 4).
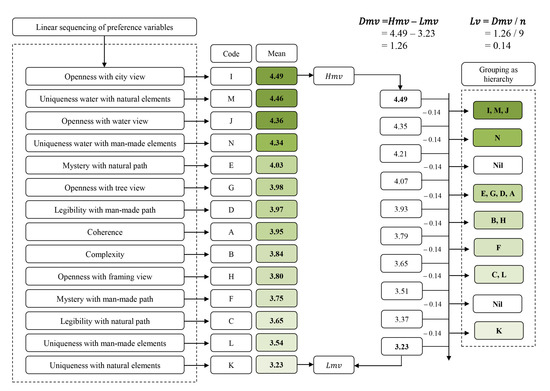
Figure 4.
Linear sequencing of the importance and level of important variables. The colors represent the gradients of variables, from high to low.
Utilizing the results of the level of importance value (Lv), the AHP online system tool allowed the pairwise comparison of the 14 variables. The result of the level of importance value is used for grouping variables in an AHP pairwise comparison matrix to indicate the hierarchy of the variables. The resulting numbers of the comparison indicate the variables’ comparative significance by the corresponding number (see Table 9); for instance, comparing variable I with variable M or J, the result was a value of 1.00. This means that I as a variable is equally important. Also, when comparing variable I with variable A, the result was a value of 4.00. This means that I as a variable is more important than A, and its placed four steps higher in the hierarchy than A. Similarly, comparing variable I against variable C resulted in a value of 7.00, which indicates that variable I has situated seven hierarchal steps above variable C. The AHP used 91 pairwise comparisons to obtain a pairwise comparison matrix. Additionally, the AHP online system tool produced a principal eigenvalue of 14.524, a value (λ max) used to extract the CI.
Table 9.
Pairwise comparison matrix generated by the analytic hierarchy process (AHP).
- -
- Number of pairwise comparisons = 91
- -
- Principal eigenvalue λ max = 14.524
Using the GNU Octave tool, the final multiple-variable consistency check was determined by calculating the CR. The tool permitted the addition of mathematical equations in the form of code and the pairwise comparisons matrix mode extracted by the AHP online system tool, and then calculated the weights, the CI, and the CR values. The results indicated that the CI = 0.040 and the CR = 0.025. With the CR being less than 0.1, the results were deemed valid and consistent. The output of the GNU Octave tool also identified multiple-variable raw weights with total values of 1.
- -
- Consistency Index CI = 0.040
- -
- Random consistency index RI = 1.57
- -
- Consistency Ratio CR = 0.025 < 0.1 (valid and consistent)
After acquiring the raw weight (RW) using the GNU Octave tool, the weight normalization by the equation (RW/MaxRW × n), n = 10 is an integer assumed number to provide normalized integer values that are used to assess the visual aesthetic variables for permanent urban forest reserves. The final results revealed that the highest weight (W = 10) was achieved for three variables, namely, “openness with city view”, “uniqueness of water with natural elements”, and “openness with water view”. Conversely, the lowest weight (W = 1) was obtained for three variables, namely, “legibility with natural path”, “uniqueness with man-made elements”, and “uniqueness with natural elements” (Table 10).
Table 10.
Determination of the weightage of the multiple variables.
4. Discussion
In this work, 14 variables were obtained from the six primary variables revealed by previous studies. The multiple variables were discovered by classifying permanent urban forest reserve photos taken by the public. The process of gathering the photos was purposeful, since the participants were asked to take photos that they considered to have visual aesthetic qualities. Consequently, the multiple variables were collected based on public preferences, representing a perception-based approach [17]. It has been shown that the appraisal of visual aesthetics is easier and more reliable when the public’s preferences are included prior to expert assessment; these results are consistent with [42]. Also, we adopted an expert-based assessment because these are based on specific rules, which mean that the visual aesthetic assessment is not directly related to the expert’s background. Where an expert’s background slightly influences such an assessment, this is consistent with [6]. Our study converged the perceptual approach based on public preference with the expert approach based on assessment of the visual aesthetics. This converging approach or hybrid approach is a comprehensive management system that aims to achieve a parallel perception-based evaluation of visual aesthetic quality based on the opinions of experts and the public [4,17,43].
According to the experts, the variable openness with city view received the highest rating. The presence of openness at the peak of the permanent urban forest reserves provided a wide panoramic view, which appealed to the aesthetics of the viewer, and has been generally linked to human preferences in urban forest areas. People enjoy open spaces and unimpeded horizons, and the wider the range of view, the higher ranking their aesthetic preference; these results are consistent with [26,44]. In this context, the concept of spatial openness is linked to evolutionary theories and aesthetics through the concept of the prospect, in which an increase in the prospect of seeing results in a higher aesthetic preference [25].
Our results also indicate three highly preferred variables–uniqueness of water with natural elements, openness with a water view, and uniqueness of water with man-made elements. Despite the different components of the variables, they all share the presence of water as the primary element influencing the aesthetic preference of the scenery. This is not surprising: natural resource specialists and decision-makers have long recognized the link between water and human preference, as this aspect contributes to the creation and enhancement of the uniqueness of urban forests and, consequently, the unique wonder they inspire in the observer [45]. Water is an essential element of a scene because it provides aesthetic appeal, cultural ties, and added value [46]. In addition, it is well known that the presence of water in forests can drastically alter the sense of aesthetic and environmental qualities, particularly in open urban forest environments [47]. Additionally, the sense of place in waterscapes is associated with an emotional response [48], with some researchers believing that the reason for such a feeling is that human beings long for their prenatal origins [49].
By contrast, the variables mystery with a man-made path and legibility with a natural path were the least preferred, with the width and type of path appearing to affect the aesthetic preferences of the experts. In other words, they did not like discovery and mystery in man-made ways, which may be attributed to the fact that man-made methods are more structured and provide more clear information. Nor did they choose legibility in urban forests with a natural path. Natural paths with restricted lanes encourage more exploration and mystery than aesthetic legibility. This is due to the absence of interference in the design of the paths. The aesthetic preferences of urban forest paths are contingent upon the realization and comprehension of the user’s needs to have aesthetic experiences [50]. Therefore, it is clear that the experts based their preferences on the experience of the user, preferring ambiguity in natural environments because it gave the user an experience of discovery and sports adventure, while preferring clarity in man-made paths for users needing paths with clear and simple information and used for transportation or pneumatic cycling.
Also, uniqueness with man-made elements and uniqueness with natural elements were the two least preferred visual aesthetic variables. Familiarity of local forest visitors with these variables is the primary reason why they were not recommended by the experts. However, due to their unfamiliarity with the elements, the influence of these variables may be stronger for international visitors, whilst remaining low for domestic visitors. Knowing the user’s level of knowledge with an area is beneficial to the aesthetic experience [51], allowing it to produce a draw factor for visitors, for example, to Malaysia’s permanent urban forest reserves.
5. Limitations and Future Study
This study’s results contribute to the development of evaluation methods for measuring the visual aesthetics quality of permanent urban forest reserves. However, the findings of this study are not without limitations. Firstly, while there was a total of 750 photos taken, the findings are limited by the sample size of the study’s participants; a larger sample size could produce a more generalizable set of findings. Secondly, the findings of this study are limited to measuring the quality of visual aesthetic variables that are identified and justified through the study of literature; the consideration of other possible influencing variables that have not been considered in this study, such as the influence of biodiversity on perceived visual aesthetics, might provide a broader view of the subject. Thirdly, this study has utilized only two permanent urban forest reserves as case studies; the employment of rural forest areas or other sites that vary to a higher degree in their visual characteristics could be useful to further generalize the study’s findings to other settings and geographies.
6. Conclusions
In this study, the results reveal the relative weights of the visual aesthetic variables of permanent urban forest reserves in Malaysia through the use of the converging approach and the AHP. The converging approach relied on the preferences and approaches of both experts and the public to develop a complete system for aesthetically evaluating the urban permanent forest reserves. The public preferences constituted visual aesthetic variables derived from the experience of capturing photos that they believed to have a visual aesthetic (perception approach), whereas the experts’ preferences were adopted to assess the visual aesthetic variables via a survey (expert approach). This approach, relying on the participation of both the public and experts in the aesthetic evaluation, is extremely useful in achieving trustworthy and integrated results. However, we urge that future research compare the discrepancies between the assessments of the experts and the public. In addition, by comparing the preferences of the local and international public, it would be possible to enhance the visual aesthetics in the permanent urban forest reserves, making them a key tourist destination in Malaysia. Policy- and decision-makers will be able to use the weights of the extracted variables to enhance and manage the visual aesthetics in these urban forest reserves. Ultimately, by combining the results from the converging approach and the AHP, richer information was provided that could increase the confidence of forest managers and other stakeholders in making management decisions concerning the visual aesthetics in permanent urban forest reserves in Malaysia.
Author Contributions
Conceptualization, R.M. and S.A.B.; methodology, R.M. and S.A.B.; software, R.M.; validation, S.M. and M.J.M.Y.; investigation, R.M., A.A.-S. and H.G.; data collection, R.M. and A.A.; writing—original draft preparation, R.M.; writing—review and editing, S.A.B.; visualization, R.M.; supervision, S.M. and M.J.M.Y.; project administration, R.M. and S.A.B. All authors have read and agreed to the published version of the manuscript.
Funding
This research received no external funding.
Data Availability Statement
Not applicable.
Conflicts of Interest
The authors declare no conflict of interest.
Appendix A

Figure A1.
The code of the GNU Octave tool.
Appendix B
Table A1.
The unique code of each of photo.
Table A1.
The unique code of each of photo.
| No. | Variable | ||
|---|---|---|---|
| 1 | Coherence | ||
| Photo |  |  |  |
| A01 | A02 | A03 | |
| 2 | Complexity | ||
| Photo |  |  |  |
| B01 | B02 | B03 | |
| 3 | Legibility with natural path | ||
| Photo |  |  |  |
| C01 | C02 | C03 | |
| 4 | Legibility with man-made path | ||
| Photo |  |  |  |
| D01 | D02 | D03 | |
| 5 | Mystery with natural path | ||
| Photo |  |  |  |
| E01 | E02 | E03 | |
| 6 | Mystery with man-made path | ||
| Photo |  |  |  |
| F01 | F02 | F03 | |
| 7 | Openness with tree view | ||
| Photo |  |  |  |
| G01 | G02 | G03 | |
| 8 | Openness with framing view | ||
| Photo |  |  |  |
| H01 | H02 | H03 | |
| 9 | Openness with city view | ||
| Photo |  |  |  |
| I01 | I02 | I03 | |
| 10 | Openness with water view | ||
| Photo |  |  |  |
| J01 | J02 | J03 | |
| 11 | Uniqueness with natural elements | ||
| Photo |  |  |  |
| K01 | K02 | K03 | |
| 12 | Uniqueness with man-made elements | ||
| Photo |  |  |  |
| L01 | L02 | L03 | |
| 13 | Uniqueness water with natural elements | ||
| Photo |  |  |  |
| M01 | M02 | M03 | |
| 14 | Uniqueness water with man-made elements | ||
| Photo |  |  |  |
| N01 | N02 | N03 | |
References
- Rathmann, J.; Beck, C.; Flutura, S.; Seiderer, A.; Aslan, I.; André, E. Towards quantifying forest recreation: Exploring outdoor thermal physiology and human well-being along exemplary pathways in a central European urban forest (Augsburg, SE-Germany). Urban For. Urban Green. 2020, 49, 126622. [Google Scholar] [CrossRef]
- Velarde, M.D.; Fry, G.; Tveit, M. Health effects of viewing landscapes—Landscape types in environmental psychology. Urban For. Urban Green. 2007, 6, 199–212. [Google Scholar] [CrossRef]
- Wang, R.; Zhao, J.; Meitner, M.J.; Hu, Y.; Xu, X. Characteristics of urban green spaces in relation to aesthetic preference and stress recovery. Urban For. Urban Green. 2019, 41, 6–13. [Google Scholar] [CrossRef]
- Mundher, R.; Abu Bakar, S.; Maulan, S.; Mohd Yusof, M.J.; Al-Sharaa, A.; Aziz, A.; Gao, H. Aesthetic Quality Assessment of Landscapes as a Model for Urban Forest Areas: A Systematic Literature Review. Forests 2022, 13, 991. [Google Scholar] [CrossRef]
- Mundher, R.; Al-Sharaa, A.; Al-Helli, M.; Gao, H.; Abu Bakar, S. Visual Quality Assessment of Historical Street Scenes: A Case Study of the First “Real” Street Established in Baghdad. Heritage 2022, 5, 3680–3704. [Google Scholar] [CrossRef]
- Kirillova, K.; Fu, X.; Lehto, X.; Cai, L. What makes a destination beautiful? Dimensions of tourist aesthetic judgment. Tour. Manag. 2014, 42, 282–293. [Google Scholar] [CrossRef]
- Hauser, D.; Leopold, A.; Egger, R.; Ganewita, H.; Herrgessell, L. Aesthetic perception analysis of destination pictures using #beautifuldestinations on Instagram. J. Destin. Mark. Manag. 2022, 24, 100702. [Google Scholar] [CrossRef]
- Jean-Christophe, F.; Jens, I.; Nicolas, B. Coupling crowd-sourced imagery and visibility modelling to identify landscape preferences at the panorama level. Landsc. Urban Plan. 2020, 197, 103756. [Google Scholar] [CrossRef]
- Othman, N.; Mohamed, N.; Ariffin, M.H. Landscape Aesthetic Values and Visiting Performance in Natural Outdoor Environment. Procedia Soc. Behav. Sci. 2015, 202, 330–339. [Google Scholar] [CrossRef]
- Ruban, D.A.; Sallam, E.S.; Ermolaev, V.A.; Yashalova, N.N. Aesthetic Value of Colluvial Blocks in Geosite-Based Tourist Destinations: Evidence from SW Russia. Geosciences 2020, 10, 51. [Google Scholar] [CrossRef]
- Paletto, A.; Becagli, C.; De Meo, I. Aesthetic preferences for deadwood in forest landscape: A case study in Italy. J. Environ. Manag. 2022, 311, 114829. [Google Scholar] [CrossRef]
- Lies, J. Aesthetics Rising from Beauty to Reputation Management. Corp. Reput. Rev. 2021, 24, 105–115. [Google Scholar] [CrossRef]
- Jeon, J.Y.; Jo, H.I. Effects of audio-visual interactions on soundscape and landscape perception and their influence on satisfaction with the urban environment. Build. Environ. 2020, 169, 106544. [Google Scholar] [CrossRef]
- Mundher, R.; Abu Bakar, S.; Maulan, S.; Mohd Yusof, M.J.; Osman, S.; Al-Sharaa, A.; Gao, H. Exploring Awareness and Public Perception towards the Importance of Visual Aesthetics for Preservation of Permanent Forest Reserve (PFR) in Malaysia. Land 2022, 11, 1280. [Google Scholar] [CrossRef]
- Jovanovska, D.; Swetnam, R.D.; Tweed, F.S.; Melovski, L. Assessing the landscape visual quality of Shar Planina, North Macedonia. Landsc. Ecol. 2020, 35, 2805–2823. [Google Scholar] [CrossRef]
- Hauru, K.; Koskinen, S.; Kotze, D.J.; Lehvävirta, S. The effects of decaying logs on the aesthetic experience and acceptability of urban forests—Implications for forest management. Landsc. Urban Plan. 2014, 123, 114–123. [Google Scholar] [CrossRef]
- Daniel, T.C. Whither scenic beauty? Visual landscape quality assessment in the 21st century. Landsc. Urban Plan. 2001, 54, 267–281. [Google Scholar] [CrossRef]
- Ghosh, A.; Maiti, R. Development of new Ecological Susceptibility Index (ESI) for monitoring ecological risk of river corridor using F-AHP and AHP and its application on the Mayurakshi river of Eastern India. Ecol. Inform. 2021, 63, 101318. [Google Scholar] [CrossRef]
- Lu, J.W.; Xie, Y.; Xu, B.; Huang, Y.; Hai, J.; Zhang, J. From NIMBY to BIMBY: An evaluation of aesthetic appearance and social sustainability of MSW incineration plants in China. Waste Manag. 2019, 95, 325–333. [Google Scholar] [CrossRef]
- Zhao, J.; Zhang, Z. On the stress-state dependent plasticity of brittle metallic glasses: Experiment, theory and simulation. Mater. Sci. Eng. A 2013, 586, 123–132. [Google Scholar] [CrossRef]
- Kaplan, S.; Kaplan, R. Cognition and Environment: Functioning in an Uncertain World; Praeger: New York, NY, USA, 1982. [Google Scholar]
- Mundher, R.; Abu Bakar, S.; Al-Helli, M.; Gao, H.; Al-Sharaa, A.; Mohd Yusof, M.J.; Maulan, S.; Aziz, A. Visual Aesthetic Quality Assessment of Urban Forests: A Conceptual Framework. Urban Sci. 2022, 6, 79. [Google Scholar] [CrossRef]
- De La Fuente De Val, G.; Mühlhauser, S.H. Visual quality: An examination of a south american mediterranean landscape, andean foothills east of santiago (chile). Urban For. Urban Green. 2014, 13, 261–271. [Google Scholar] [CrossRef]
- Stamps, A.E. Mystery, complexity, legibility and coherence: A meta-analysis. J. Environ. Psychol. 2004, 24, 1–16. [Google Scholar] [CrossRef]
- Appleton, J. The Experience of Landscape; Wiley: London, UK, 1975. [Google Scholar]
- De la Fuente de Val, G.; Atauri, J.A.; de Lucio, J.V. Relationship between landscape visual attributes and spatial pattern indices: A test study in Mediterranean-climate landscapes. Landsc. Urban Plan. 2006, 77, 393–407. [Google Scholar] [CrossRef]
- Ode, Å.; Tveit, M.; Fry, G. Capturing landscape visual character using indicators: Touching base with landscape aesthetic theory. Landsc. Res. 2008, 33, 89–117. [Google Scholar] [CrossRef]
- Rosley, M.S.F.; Rahman, S.R.A.; Lamit, H. Biophilia Theory Revisited: Experts and Non-experts Perception on Aesthetic Quality of Ecological Landscape. Procedia Soc. Behav. Sci. 2014, 153, 349–362. [Google Scholar] [CrossRef]
- Dann, G.M. Tourist Motivatio. An Ppraisal. Ann. Tour. Res. 1981, 8, 187–219. [Google Scholar] [CrossRef]
- Hermes, J.; Albert, C.; von Haaren, C. Assessing the aesthetic quality of landscapes in Germany. Ecosyst. Serv. 2018, 31, 296–307. [Google Scholar] [CrossRef]
- Balomenou, N.; Garrod, B. A Review of Participant-Generated Image Methods in the Social Sciences. J. Mix. Methods Res. 2015, 10, 335–351. [Google Scholar] [CrossRef]
- Sugimoto, K. Quantitative measurement of visitors’ reactions to the settings in urban parks: Spatial and temporal analysis of photographs. Landsc. Urban Plan. 2013, 110, 59–63. [Google Scholar] [CrossRef]
- Hussainzad, E.A.; Mohd Yusof, M.J.; Gao, H.; Yu Yang, K.K.; Kueng Ming, N.W.; Abdul Majid, M.S.B.; Xu, T. Assessing Hutan Simpan Ampang using GIS-based Potential Surface Analysis approach. IOP Conf. Ser. Earth Environ. Sci. 2020, 540, 012030. [Google Scholar] [CrossRef]
- Abu Bakar, S. Land Suitability for Rice Growing in the Klang Valley Using Geographical Information System and Analytical Hierarchy Process for Urban Food Security; Universiti Putra Malaysia: Serdang, Malaysia, 2007; Available online: https://www.researchgate.net/publication/265283982 (accessed on 11 September 2022).
- Saaty, T.L. Axiomatization of the Analytic Hierarchy Process. Manag. Sci. 1986, 32, 841–855. [Google Scholar] [CrossRef]
- Goepel, K. Implementation of an Online software tool for the Analytic Hierarchy Process (AHP-OS). Int. J. Anal. Hierarchy Process 2018, 10, 469–487. [Google Scholar] [CrossRef]
- Hafizan, C.; Noor, Z.Z.; Abba, A.H.; Hussein, N. An alternative aggregation method for a life cycle impact assessment using an analytical hierarchy process. J. Clean. Prod. 2016, 112, 3244–3255. [Google Scholar] [CrossRef]
- Zarkesh, M.M.K.; Ghoddusi, J.; Zaredar, N.; Soltani, M.J.; Jafari, S.; Ghadirpour, A. Application of spatial analytical hierarchy process model in land use planning. J. Food Agric. Environ. 2010, 8, 970–975. [Google Scholar]
- Vafaei, N.; Ribeiro, R.A.; Camarinha-Matos, L.M. Data normalisation techniques in decision making: Case study with TOPSIS method. Int. J. Inf. Decis. Sci. 2018, 10, 27–29. Available online: http://www.ca3-uninova.org (accessed on 25 September 2022). [CrossRef]
- Roscoe, J.T. Fundamental Research Statistics for the Behavioral Sciences, 2nd ed.; Holt Rinehart and Winston: New York, NY, USA, 1975. [Google Scholar]
- Memon, M.A.; Ting, H.; Cheah, J.-H.; Thurasamy, R.; Chuah, F.; Cham, T.H. Sample Size for Survey Research: Review and Recommendations. J. Appl. Struct. Equ. Model. 2020, 4, i–xx. [Google Scholar] [CrossRef]
- Ma, B.; Hauer, R.J.; Xu, C. Effects of design proportion and distribution of color in urban and suburban green space planning to visual aesthetics quality. Forests 2020, 11, 278. [Google Scholar] [CrossRef]
- Al-Sharaa, A.; Adam, M.; Amer Nordin, A.S.; Mundher, R.; Alhasan, A. Assessment of Wayfinding Performance in Complex Healthcare Facilities: A Conceptual Framework. Sustainability 2022, 14, 16581. [Google Scholar] [CrossRef]
- Wartmann, F.M.; Frick, J.; Kienast, F.; Hunziker, M. Factors influencing visual landscape quality perceived by the public. Results from a national survey. Landsc. Urban Plan. 2021, 208, 104024. [Google Scholar] [CrossRef]
- Tveit, M.; Ode, Å.; Fry, G. Key concepts in a framework for analysing visual landscape character. Landsc. Res. 2006, 31, 229–255. [Google Scholar] [CrossRef]
- Martín, R.; Yepes, V. The concept of landscape within marinas: Basis for consideration in the management. Ocean. Coast. Manag. 2019, 179, 104815. [Google Scholar] [CrossRef]
- Axelsson, Ö.; Nilsson, M.E.; Hellström, B.; Lundén, P. A field experiment on the impact of sounds from a jet-and-basin fountain on soundscape quality in an urban park. Landsc. Urban Plan. 2014, 123, 49–60. [Google Scholar] [CrossRef]
- Coleman, T.; Kearns, R. The role of bluespaces in experiencing place, aging and wellbeing: Insights from Waiheke Island, New Zealand. Health Place 2015, 35, 206–217. [Google Scholar] [CrossRef]
- Valdés-tejera, E. The aesthetics of water in current landscape architecture projects. In Proceedings of the 22nd Council of Europe Meeting of the Workshops for the implementation of the European Landscape Convention and International Congress Water, Landscape and Citizenship in the Face of Global Change, Seville, Spain, 14–15 March 2019; Available online: https://www.researchgate.net/publication/348448145 (accessed on 30 October 2022).
- Dorwart, C.E.; Moore, R.L.; Leung, Y.-F. Visitors’ Perceptions of a Trail Environment and Effects on Experiences: A Model for Nature-Based Recreation Experiences. Leis. Sci. 2009, 32, 33–54. [Google Scholar] [CrossRef]
- Liao, H.; Zhao, W.; Zhang, C.; Dong, W.; Huang, H. Detecting individuals’ spatial familiarity with urban environments using eye movement data. Comput. Environ. Urban Syst. 2022, 93, 101758. [Google Scholar] [CrossRef]


Disclaimer/Publisher’s Note: The statements, opinions and data contained in all publications are solely those of the individual author(s) and contributor(s) and not of MDPI and/or the editor(s). MDPI and/or the editor(s) disclaim responsibility for any injury to people or property resulting from any ideas, methods, instructions or products referred to in the content. |
© 2023 by the authors. Licensee MDPI, Basel, Switzerland. This article is an open access article distributed under the terms and conditions of the Creative Commons Attribution (CC BY) license (https://creativecommons.org/licenses/by/4.0/).