Article

Quercus suber Bark as a Sustainable Source of Value-Added Compounds: Experimental Studies with Cork By-Products

1
UCIBIO—Applied Molecular Biosciences Unit, MedTech, Laboratory of Pharmaceutical Technology, Department of Drug Sciences, Faculty of Pharmacy, University of Porto, 4050-313 Porto, Portugal
2
Associate Laboratory i4HB—Institute for Health and Bioeconomy, Faculty of Pharmacy, University of Porto, 4050-313 Porto, Portugal
3
Laboratory of Organic and Pharmaceutical Chemistry, Department of Chemical Sciences, Faculty of Pharmacy, University of Porto, 4050-313 Porto, Portugal
4
Interdisciplinary Centre of Marine and Environmental Research (CIIMAR), University of Porto, 4050-313 Porto, Portugal
5
Dimas & Silva, Lda., 4535-224 Mozelos, Portugal
6
LAQV/REQUIMTE, Laboratory of Applied Chemistry, Department of Chemical Sciences, Faculty of Pharmacy, University of Porto, 4050-313 Porto, Portugal
7
Associate Laboratory i4HB, Department of Biological Sciences, Laboratory of Toxicology, Faculty of Pharmacy, University of Porto, 4050-313 Porto, Portugal
8
UCIBIO-REQUIMTE, Department of Biological Sciences, Laboratory of Toxicology, Faculty of Pharmacy, University of Porto, 4050-313 Porto, Portugal
*
Author to whom correspondence should be addressed.
These authors contributed equally to this work.
Forests 2023, 14(3), 543; https://doi.org/10.3390/f14030543
Submission received: 6 February 2023 / Revised: 6 March 2023 / Accepted: 7 March 2023 / Published: 9 March 2023

Abstract

:
Quercus suber L. bark (cork) is a sustainable material due to its ability to regenerate. The aim of this work was to explore cork powders, by-products of the cork industry, as sustainable sources of value-added compounds. Two types of cork powder were studied: coarse (P0) and fine (P1). A broad physicochemical characterization was carried out, regarding particle size, color, moisture content, hygroscopicity, pH, heavy metal content, NIR spectra, and volatile compounds. DPPH scavenging activity and total phenolic content were also evaluated for an ethanolic P1 extract. For both powders, Hg, As, Cd and Pb contents were below the acceptable limits and volatile compounds commonly used as fragrances were found in their composition. P1 had a smaller and more homogenous particle size, lighter brownish color, lower pH value, and lower moisture content than P0, and therefore appears to be more suitable for industrial application. P1 ethanolic extract also showed a high scavenging activity and a content of phenolic compounds of 50.46 ± 0.63 mg (as gallic acid equivalents) per g of extract. In conclusion, P1 cork powder seems to be a promising source of upcycled ingredients, such as fragrances and antioxidants, for the pharmaceutical, nutraceutical, and cosmetic industries.

1. Introduction

It is increasingly important to address sustainable development, imposing limits on the environmental, economic, and social impacts caused by human activities [1]. To ensure this, the United Nations created the 2030 Agenda for Sustainable Development and the 17 Sustainable Development Goals (SDGs) [2]. The circular economy is one of the ways to promote sustainable development. This production and consumption paradigm focuses on sharing, renting, reusing, repairing, and recycling existing products for as long as possible, extending their life cycle [3]. Upcycling agroindustry by-products is gaining popularity as it promotes the circular economy and the sustainable sourcing of new raw materials and bioactive compounds [4,5].
Quercus suber, also known as cork oak, is an evergreen tree belonging to the plant family Fagaceae that can live up to 200 years [6]. Cork oak is endemic to Mediterranean countries with silicate substrates such as Portugal, Spain, southern France, Italy, and north Morocco [6,7]. Cork oak woodlands, also called montados in Portugal and dehesas in Spain, are rich, human-managed ecosystems that offer several ecological advantages [6]. These stands play a crucial role in the conservation of biodiversity, being the habitat for animal species, even endangered ones [7]. The ecological importance of cork oak woodlands is also evidenced by its impact on the conservation of soil by preventing erosion and its high water retention capacity, allowing the regulation of the hydrological cycle, as well as its effect on the reduction of carbon emissions, being responsible for retaining about 14 million tons of CO2 per year [8,9]. Thus, cork oak forests might be seen as crucial for environmental sustainability [8]. Q. suber is a sturdy tree that adapts and survives in the most adverse conditions, such as lack of water, high temperatures, and even wildfires [9]. However, the optimum growth temperature is between 13 °C and 19 °C, with little tolerance to extreme cold [10]. Q. suber can also tolerate high levels of rainfall and periods of drought that can last up to 4 months [10].
A secondary meristem in Q. suber called phellogen produces cork by forming successive layers throughout the life of the tree [9]. Q. suber has the ability to regenerate its bark after each extraction, making this process sustainable [9]. However, cork harvesting can only be carried out during a short period of time, from June to July, when phellogen cells are fully functional and the newly formed cells still have thin cell walls [6]. The first layer of cork, called virgin cork, is extracted when the tree is 20 to 25 years old and is not used industrially due to its poor quality in terms of density and thickness [11]. The next layers of cork, known as reproduction cork, are extracted every 9 to 12 years [6]. This cork has an adequate thickness and is already used by the industry for the production of agglomerates, although only the second and later reproduction cork (amadia) is used to produce bottle stoppers [6]. Stripping is performed manually with a small axe, without endangering the tree, which regenerates over the years [12].
After harvesting, the cork is industrially processed. Portugal has the largest share of the cork industry—34% of the world’s cork oak woodlands are found in this country [13]. Around 200,000 tons of cork are produced worldwide, with Portugal leading with an annual average production of 85,000 tons [13]. The main use of cork is in the manufacture of bottle stoppers. Depending on the final product, cork goes through different stages of production, generating by-products [14]. “Cork powder”, consisting of particles of different sizes, is the most significant by-product [14]. Based on forest production, industrial yields, and quantities of different cork products, it is estimated that around 50,000 tons of cork powder are produced annually worldwide [14]. There are several types of cork powder, with different particle sizes and properties, derived from different industrial processes such as grinding and granulometric or densimetric separation [4,14,15].
In addition to its environmental sustainability, Q. suber has a high economic value due to the exploitation of its outer bark and wood [16], contributing to the economic and social development of the regions where cork oak woodlands are located: on the one hand, many industries, in particular the wine sector, depend on cork; and, on the other hand, many agricultural jobs are created.
Cork has a multitude of interesting properties such as low density and permeability to liquids and gases, as well as high insulation and damping features [7,13], and is widely used in the manufacture of insulation and construction products, bottle stoppers, decorative items, and clothing, among others [6,16]. Additionally, cork has been studied as a source of bioactive compounds [17,18,19,20].
Cork and its by-products have shown a chemical profile rich in aliphatic, phenolic, and triterpenic compounds, constituting a source of bioactive compounds of interest to the pharmaceutical and nutraceutical industries [21]. Additionally, Q. suber bark particles can act as emulsion stabilizers, proving that cork is a useful material for the technological development of formulations in the pharmaceutical and cosmetic industries [22].
As environmental challenges increase, consumers are increasingly concerned about sustainability, prompting industries to minimize their environmental footprint. This work aims to value cork powder, the main by-product of the cork industry, and explore its potential as a sustainable source of value-added compounds for the pharmaceutical, nutraceutical, and cosmetic industries.

2. Materials and Methods

2.1. Materials

Cork powders were obtained from Cork Industry Dimas & Silva, Lda, Mozelos, Portugal. The industrial treatment of cork involves different stages, in which by-products can be obtained. The Q. suber powder samples studied were collected by the industry after grinding processes at two different stages of the industrial cycle. After boiling the cork planks extracted from the tree, these are grinded, generating pieces between 3 and 30 mm [14,23]. The outer part is released as P0 powder (0–2 mm grain size). After this step, the 3–30 mm parts are dried with hot air and go through another and finer grinding step with the goal of obtaining 0.5–9 mm pieces [14]. At this point, P1 is extracted as a fine powder (Figure 1). No pre-treatment was performed.

2.2. Methods

2.2.1. Physicochemical Characterization
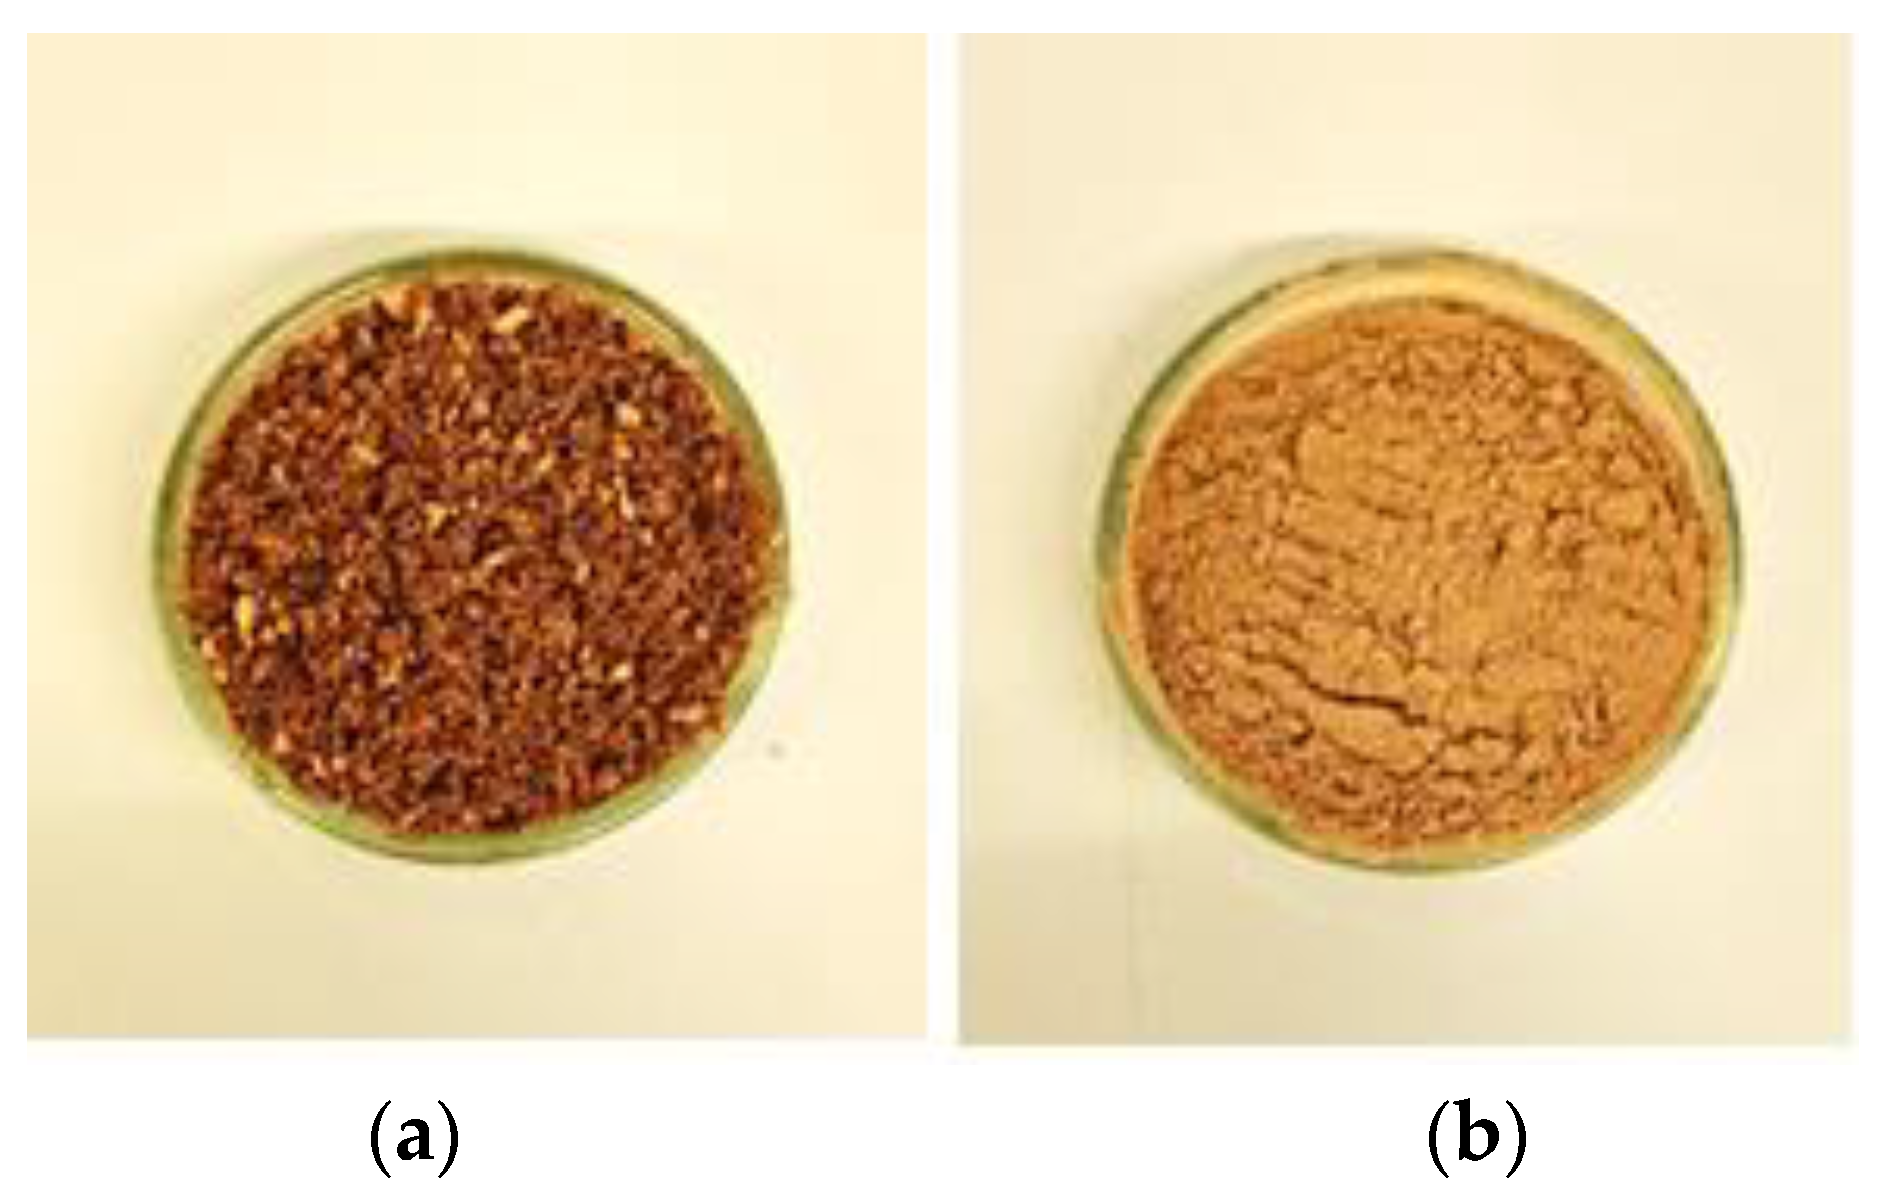
The following analysis was performed for both P0 and P1 cork samples:

Particle Size

Particle size and size distribution measurements were performed by laser diffraction with a Mastersizer 3000 (Malvern Instruments Inc., Malvern, UK) [24]. The powder was dispersed in 200 mL of water with Tween 80® (Acofarma, Madrid, Spain) under magnetic stirring for 15 min. Sample preparation required the addition of surfactant, as cork powder by itself does not disperse in water. The obtained dispersion was analyzed following the protocol of the equipment. Measurements were performed in quintuplicate.

Colour

Powder was evenly spread on a Petri dish, and measurements were performed in a black chamber with a ChromaMeter CR-400 (Konica Minolta Inc., Tokyo, Japan), in triplicate [25].

Moisture Content

One gram of cork powder was weighed directly on an AD-4713 infrared moisture balance (A&D Company, Tokyo, Japan) [26]. The test was performed for 10 min at 80 °C. Measurements were performed in triplicate.

Hygroscopicity

Hygroscopicity was evaluated according to the European Pharmacopoeia 10 [26]. The weighing vessel and stopper were weighted (m1). Briefly, 1.5 g of P1 powder was placed at the bottom of the weighing vessel, which was subsequently stopped and weighed (m2). The unstopped vessel was placed in a desiccator containing a saturated ammonium sulphate solution (relative humidity = 78.6%) at 25 °C for 24 h. The weighing vessel was stopped and weighted (m3). The percentage of weight gained by the P1 powder samples was determined using Equation (1):
m 3 m 2 m 2 m 1 × 100

pH

To determine the pH, a 10% aqueous dispersion was prepared by adding 10 g of cork powder to a 100 mL beaker, under magnetic stirring for 10 min. The obtained suspension was filtered with a paper filter, and the pH was measured in the filtrate with a HI 2211 pH/ORP/°C meter (Hanna Instruments, Woonsocket, RI, USA) [26]. Measurements were performed in triplicate.

Heavy Metals Content

Cork powder samples (P0 and P1) were solubilized by microwave-assisted closed-vessel acid digestion in an ETHOS EASY microwave oven (Milestone Srl, Milan, Italy) equipped with an SK-15 easyTEMP high-pressure rotor, following a procedure based on the U.S. Environmental Protection Agency (EPA) Method 3052 (microwave-assisted acid digestion of siliceous and organically based matrices) [27]. A sample mass of approximately 0.3 g was weighted directly into the microwave oven PTFE-TFM (modified polytetrafluorethylene) vessels and 9 mL of high purity nitric acid (HNO3 ≥ 69%, TraceSELECT™, Fluka, Buchs, Switzerland), 0.5 mL of high purity hydrochloric acid (HCl ≥ 30%, TraceSELECT™, Fluka, Buchs, Switzerland) and 1 mL of high purity hydrogen peroxide (H2O2) (30% v/v, Suprapur®, Supelco, Darmstadt, Germany) were added. Sample digestion was performed using the following microwave oven program: Gradual temperature increase for 20 min to 210 °C, followed by 15 min at 210 °C. After cooling to room temperature, the PTFE vessels were opened, the sample solutions were transferred to decontaminated 50 mL polypropylene tubes, and the volume was adjusted with ultrapure water (resistivity ≥ 18.2 MΩ.cm at 25 °C) obtained with an Arium® Pro Water Purification System (Sartorius, Göttingen, Germany) to obtain a final volume of 25 mL. Sample blanks were obtained using the same procedure. For analytical quality control purposes and considering the type of sample analyzed in this study, two certified reference materials (CRM) were used: Cabbage Powder (BCR-679) and Bladderwrack (Fucus vesiculosus L.) Powder (ERM-CD200), both from the European Commission Joint Research Centre, subjected to the same sample pre-treatment. The obtained solutions were stored at 4 °C until analysis. Samples were run in triplicate, and a digestion blank was run on each digestion batch. Trace element determination was performed by inductively coupled plasma spectrometry (ICP-MS). The instrument was an iCAP™ Q (Thermo Fisher Scientific, Dreieich, Germany), equipped with a Meinhard® (Golden, CO, USA) TQ+ concentric quartz nebulizer, a Peltier-cooled, high purity quartz, baffled cyclonic spray chamber, and a demountable quartz torch with a 2.5 mm i.d. quartz injector. The interface consisted of two (sampler and skimmer) Ni cones. High-purity argon (99.9997%) supplied by Gasin (Leça da Palmeira, Portugal) was used as both a nebulizer and plasma gas. Before each analytical run, the instrument was tuned for maximum sensitivity and signal stability and for minimal formation of oxides and double-charge ions. The main operating parameters of the ICP-MS instrument were as follows: nebulizer gas flow, 1.03 L/min; auxiliary gas flow, 0.79 L/min; plasma gas flow, 13.9 L/min; radio frequency generator power, 1550 W; dwell time, 10–50 ms. For As, Cd, and Pb determination, a 7-point calibration curve (1, 5, 10, 25, 50, 100, and 200 µg/L) was generated with standard solutions prepared by an appropriate dilution of a multi-element stock solution (ICP multi-element standard solution XVI, 100 mg/L (Certipur®, Merck, Darmstadt, Germany). For Hg determination, a 4-point calibration curve (1, 2, 5, and 10 µg/L) was generated with standard solutions prepared by an appropriate dilution of an Hg stock solution (Mercury standard for ICP, 1000 mg/L, TraceCERT®, Sigma-Aldrich®, Merck, Darmstadt, Germany) in 5% HNO3, in borosilicate glass volumetric flasks. For ICP-MS analysis, all solutions (including samples, CRM, sample blanks, and calibration standards) were diluted 1:20 with a diluent solution containing 2% v/v HNO3, 0.5% v/v HCl, 500 µg/L Au (Gold Standard for ICP, 1000 mg/L, Sigma-Aldrich, Buchs, Switzerland), 2% v/v ethanol (ethanol absolute anhydrous, Carlo Erba Reagents, Val-de-Reuil, France) and 10 µg/L Ga (Gallium standard for AAS, 1000 mg/L, Fluka, Buchs, Switzerland), Rh (Rhodium ICP standard solution, 1000 mg/L, Fluka, Buchs, Switzerland), Re (Rhenium standard for ICP, 1000 mg/L, PlasmaCAL, SCP Science, Baie-D’Urfe, QC, Canada) and Ir (Iridium standard for ICP, 1000 mg/L, PlasmaCAL, SCP Science, Baie-D’Urfe, QC, Canada) as internal standards (IS). After complete homogenization on a vortex mixer, the solutions were presented to the ICP-MS instrument using a CETAC ASX-520 auto sampler (Teledyne CETAC Technologies, Omaha, NE, USA). The elemental isotopes 75As, 111Cd, 202Hg, 206Pb, 207Pb, and 208Pb were measured for analytical determination of the elements’ concentration.

Volatile Compound Analysis

Volatile compound analysis was performed as previously described in [28]. Briefly, 0.50 ± 0.01 g of cork powder was dispersed in 2 mL of water in a 20 mL glass vial. Volatile compounds were extracted through headspace-solid phase microextraction (HS-SPME) using a divinylbenzene/carboxen/polydimethylsiloxane (DVB/CAR/PDMS) fiber with an incubation time of 5 min and extraction of 30 min at 45 °C under continuous stirring (250 rpm). Analysis was performed using a 436-GC system (Bruker Daltonics, Fremont, CA, USA) coupled to a SCION Single Quadrupole (SQ) mass detector and Bruker Daltonics MS workstation software (version 8.2). An Rxi-5Sil MS fused silica capillary column (30 m × 0.25 mm × 0.25 μm; RESTEK Corporation, Bellefonte, PA, USA) was used. Helium C-60 (Gasin, Leça da Palmeira, Portugal) was used as the carrier gas at a flow rate of 1 mL/min. The oven temperature was set at 40 °C for 1 min, followed by an increase to 250 °C (rate of 5 °C/min), held for 5 min, and then increased to 300 °C (rate of 5 °C/min) and held for 1 min. The MS detector was run in electron impact (EI) mode (70 eV). The EI, transfer line, and manifold temperatures were 250, 260, and 40 °C, respectively. Chromatographic acquisition was performed in full scan mode in the mass range between 40 and 250 m/z, at a scan rate of 6 scans/s. The identification of volatile compounds was obtained by comparing the MS fragmentation obtained with mass spectra from the National Institute of Standards and Technology (NIST 14) database. Comparison with the Kovats retention index was also performed. When possible, identification was confirmed with commercially available standard compounds.

Preparation of P1 Ethanolic Extracts

A suspension of 2.5 g P1 in 100 mL ethanol was stirred at 700 rotations per minute on a magnetic multi stirrer (Velp Scientifica, Italy) at room temperature or at 40 °C for one hour. After, the suspension was filtered with a Büchner funnel with a fiberglass filter membrane (47 mm diameter) by vacuum, and the filtrate was evaporated on a rotary evaporator R-210 (Büchi, Flawil, Switzerland), followed by lyophilization (Telstar, Terrassa, Spain).

DPPH Scavenging Activity

Scavenging activity for stable 1,1-diphenyl-2-picrylhydrazyl (DPPH) free radical was evaluated according to a method previously described [29,30] with some modifications. A solution of DPPH radical in ethanol 96° (0.06 mg/mL) was prepared daily and protected from light. Reaction mixtures containing 100 µL of ethanol 96° of tested extracts (0.78–50 µg/mL) and 100 µL of DPPH (0.03 mg/mL) hydroalcoholic solution were shaken in a 96-well microtiter plate and incubated for 30 min in darkness at room temperature (until stable absorbance values were obtained). Controls containing 100 µL of ethanol 96° instead of extracts, blanks containing 200 µL of ethanol 96°, and sample blanks containing 100 µL of ethanol 96° instead of DPPH ethanolic solution were also made. The absorbances were measured at 517 nm in a microplate reader (BioTek Synergy HT Instruments, Winooski, GU, USA). The percentage of inhibition activity was calculated according to the following formula: DPPH radical scavenging effect (%) = [1 − (Abssample − Abssample’s blank/Abscontrol − Absblank)] × 100. Ascorbic acid was used as a positive control. All the tests were performed in triplicate. The scavenging activities of the extracts towards DPPH radical were expressed as the effective concentration at which DPPH radical was scavenged by 50% (IC50). The IC50 value was obtained by interpolation from linear regression analysis.

Folin-Ciocalteu Assay

The total phenolic content (TPC) was determined according to the Folin–Ciocalteu method [31], with some modifications [32]. The extracts were dissolved in ethanol: water (50:50, v/v) (100 µg/mL) and 30 µL aliquots or deionized water (control) were mixed with 150 µL of Folin–Ciocalteu reagent (1:10 mL of water) in a 96-well microtiter plate. After adding 120 µL of Na2CO3 (7.5%, w/v) the plate was incubated at 45 °C for 15 min in the BIOTEK Synergy HT microplate reader, and then cooled for 30 min outside the reader, protected from light. The absorbance was read at 765 nm. The TPC was calculated using a calibration curve traced with gallic acid (GA, n = 3) and expressed as mg of gallic acid equivalent per g of dried extract (mg GAE/g of extract). All the tests were performed in triplicate.

NIR Spectral Acquisition

Near-infrared (NIR) spectra of cork extract samples were obtained using a Fourier-transform near-infrared spectrometer FTLA 2000 (ABB, Iberville, QC, Canada), equipped with an indium-gallium-arsenide (InGaAs) detector. Spectra were acquired in reflectance mode, using a resolution of 8 cm−1, in the wavenumber range of 14,000 to 4000 cm−1, and resulted from an average of 64 scans. Cork extract samples were transferred to borosilicate flasks before spectral acquisition and were analyzed in triplicate. The average of the triplicate spectra was considered for further analysis. The background was previously evaluated using a Teflon reference material.

Chemometric Analysis

The acquired NIR spectra were analyzed using principal component analysis (PCA) to verify the presence of outliers and visualize the existence of clusters [23]. No outliers were detected through the analysis of squared residual statistics and Hotelling’s T2. The applied pre-processing technique—the Savitzky–Golay filter (15 points filter width, second-degree polynomial, first derivative) followed by standard normal variate (SNV) and mean center—was used to eliminate the presence of artifacts in the NIR spectra.

3. Results and Discussion

3.1. General Physicochemical Characterization

The cork powder samples studied were characterized regarding their physicochemical properties (Table 1).
Particle size, moisture content, and hygroscopicity are parameters that can significantly affect the performance of a powder [33]. As cork powders can add color to products, their application as natural pigments can be explored. Color is a crucial parameter in the characterization of decorative cosmetic formulations to improve physical appearance and match skin color. Objective color determination using CIE-L*a*b* is essential to identify suitable applications and detect color differences between batches, ensuring consistent quality of raw materials and final products [34,35]. The CIE-L*a*b* values confirmed that P1 has a lighter and more yellowish color than P0.
The P0 powder had a high initial water content, making it difficult to determine how much water this sample can still retain. As a result, hygroscopicity was only performed for P1 powder. This powder can be classified as “slightly hygroscopic” according to the European Pharmacopeia 10.0, as the result obtained was between 0.2 and 2% [26].
Determining the pH of aqueous dispersions is of utmost importance when considering incorporating cork powders into pharmaceutical or cosmetic formulations, as pH has a direct impact on the stability of both the incorporated ingredients and the final formulation. Considering topical application, maintaining an acidic pH (4.1–5.8) is essential for stratum corneum homeostasis and barrier permeability [36]. The powder sample P1 showed a pH value more compatible with the skin, while P0 had a less acidic pH.
The determination of the heavy metal content is essential to guaranteeing the industrial application of powders, as their presence in pharmaceutical, food, food supplements, and cosmetic products is only allowed in trace amounts and if naturally occurring. For both powders, the Hg content was below the detection limit of the analytical procedure used (0.007 µg/g). The As, Cd, and Pb levels were below the permissible limits set by several regulatory agencies, depending on the scope of application: European Pharmacopoeia and ICH guideline (As < 3 µg/g; Cd < 2 µg/g; Pb < 5 µg/g) [26,37]; Regulation (EC) 1223/2009 on Cosmetics Products (only traces unavoidable, such as As < 5 µg/g; Cd < 3 µg/g; Pb < 10 µg/g) [38]; Regulation 315/93/EEC and Commission Regulation (EC) 1881/2006, Regulation (EU) 2021/1323 and Regulation (EU) 2021/1317 on food contaminants (As < 0.5 µg/g; Cd < 1 µg/g) [39,40,41].

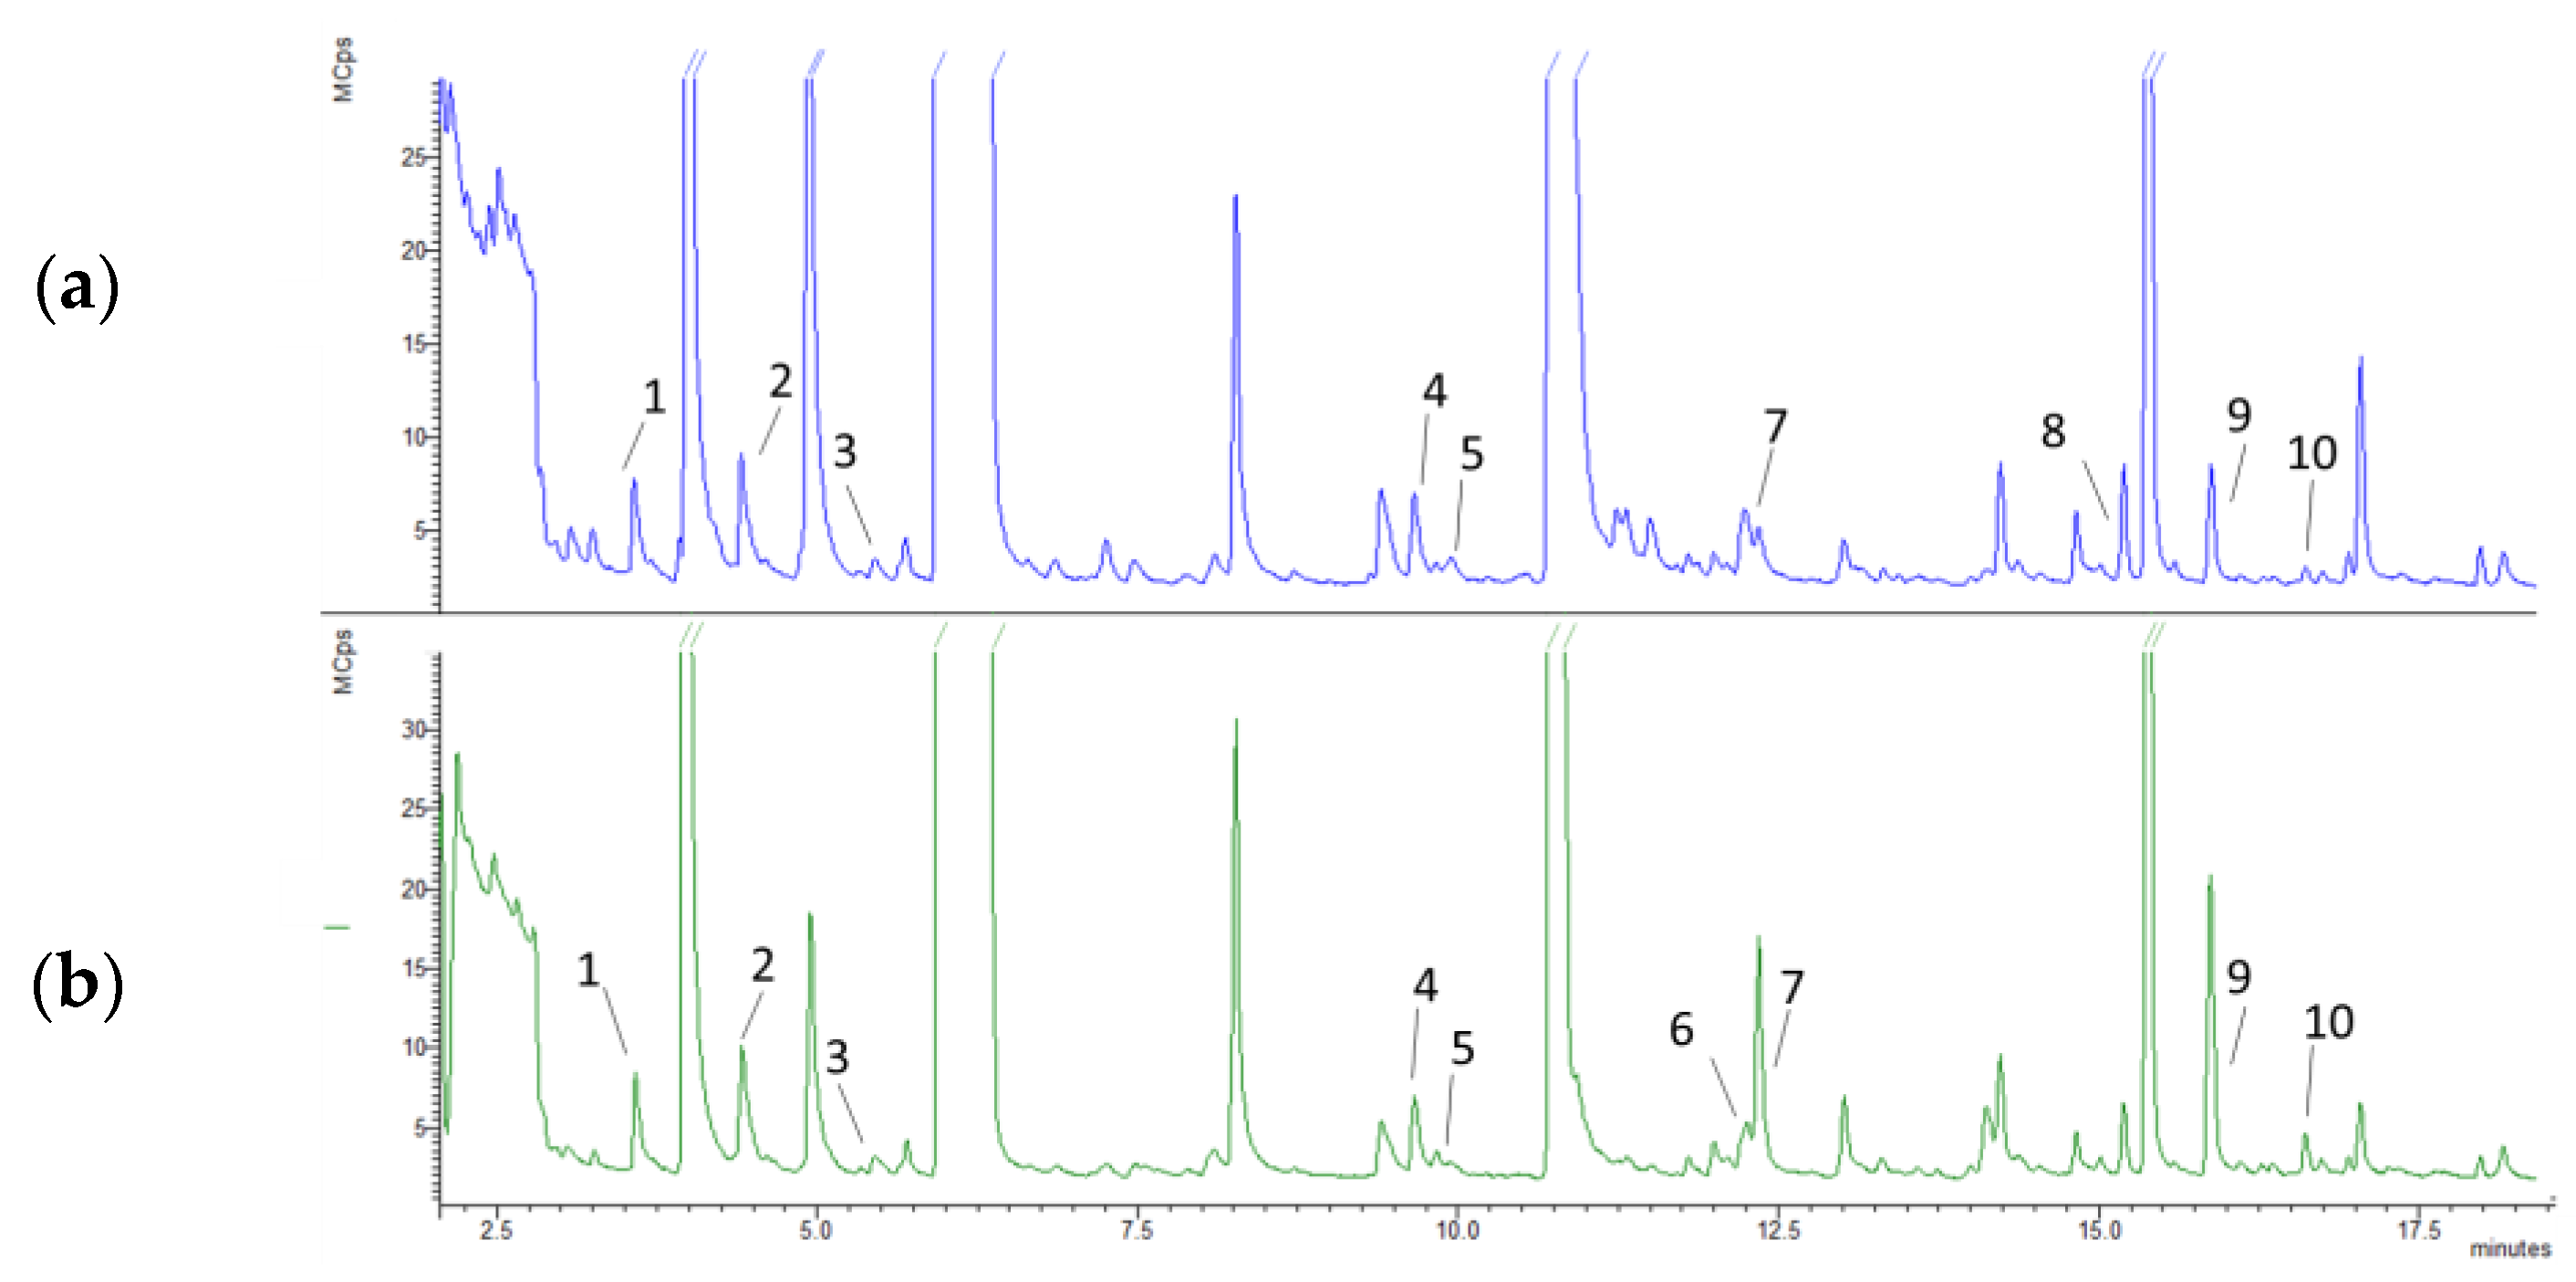
3.2. Volatile Compound Analysis

The volatile’s profile obtained by HS-SPME (Figure 2, Table 2) enabled the detection and identification of 10 compounds within the classes of ketones, aromatic aldehydes, monoterpenes, and alcohols [42,43]. Semi-quantitative analysis showed a similar profile of volatile compounds in P0 and P1 powders. P0 powder contained phenylethyl alcohol, which was not present in P1 powder, as well as a slightly high concentration of pent-2-one, 4-methylpent-2-one, hex-2-one, and vanillin. Limonene was detected only in powder P1. Camphene and borneol were present in P1 in slightly higher concentrations, and eucalyptol and camphor in much higher concentrations than in P0.
Volatile compounds, such as vanillin and monoterpenes, namely limonene, eucalyptol, and camphor, are widely used in the perfumery, cosmetic, food, nutraceutical, and pharmaceutical industries, not only because these substances can improve the organoleptic properties of products, but also because of their biological activity [46]. These monoterpenes are commonly used as fragrances by the cosmetic industry and as flavoring agents by the food industry. Furthermore, limonene has broad-spectrum antibacterial activity [47] and is therefore commonly used as a food preservative, while eucalyptol has been used in the pharmaceutical industry due to its anti-inflammatory, analgesic, and anxiolytic effects [48]. Camphor is also used for its antibacterial and antiviral potential, antitussive effects, and ability to promote skin penetration when incorporated into topical formulations [49].
Cork powders can represent a sustainable source of these compounds by upcycling a by-product obtained in the production of cork stoppers. The P1 powder proved to be a preferable source of volatile compounds, presenting a higher content of monoterpenes than the P0 powder. Through the HS-SPME analysis, it was possible to determine the volatile compounds that contribute to the organoleptic properties of the powders. While the P0 powder showed slightly higher levels of vanillin, the P1 powder presented much higher amounts of monoterpenes in the HS-SPME analysis. Further studies are needed to evaluate the best extraction procedures, aiming to increase the number of volatile and semi-volatile compounds in the extract and the extraction yield in industrial applications.

3.3. DPPH Scavenging Activity and Folin Ciocalteau Assay

Compounds with antioxidant activity are widely used by the pharmaceutical, nutraceutical, food, and cosmetic industries [50]. Formulations are highly impacted by lipid oxidation; therefore, the use of antioxidants allows preserving their functions, textures, colors, and fragrances, while also preserving nutrients. By preventing the oxidative degradation of susceptible products, such as plant extracts and essential oils, ingredients widely used by the aforementioned industries, antioxidants also contribute to extending the shelf life of formulations. Their bioactivity is also widely exploited in the pharmaceutical, cosmetic, and nutraceutical industries, as their potential for free radical scavenging confers a protective potential on the human body against cellular oxidative stress [50,51,52].
Among antioxidants, phenolic compounds are ubiquitous phytochemicals in plants, and several reports have shown the presence of polyphenols in cork by-products [15]. Taking this into account and aiming to screen the potential antioxidant activity of the cork powder extracts, the DPPH scavenging effect and the total phenolic compounds (TPC) were evaluated. As P1 powder revealed more adequate physicochemical characteristics than P0 and showed to be a preferable source of volatile compounds with high interest in the cosmetic industry, P1 ethanolic extracts were prepared and evaluated for their antioxidant activity and TPC (Table 3). As ascorbic acid is an antioxidant widely used in foods and cosmetics, this compound was selected as the positive control for the DPPH assay. Both P1 ethanolic extracts presented higher scavenging activity than ascorbic acid (IC50 value of 9.3 ± 0.3 μg/mL). Ascorbic acid is a reference antioxidant, but the ethanolic extracts are rich in phenolic compounds, which are also known for their high antioxidant activity, resulting in a high DPPH scavenging activity [53]. Interestingly, the P1 ethanolic extract obtained at 40 °C revealed a higher content of TPC and higher DPPH scavenging activity than the one obtained at room temperature (RT), suggesting that the extraction with heating is associated with a higher yield concerning the extraction of phenolic compounds than the extraction at room temperature. The extracted phenolic compounds are significantly influenced by the extraction temperature [54]. Cork powder may contain a larger amount of less polar phenolic compounds since these are extracted at higher temperatures than more polar phenolics [54]. Previous studies have reported the extraction of bioactive compounds from cork, but mainly from cork granulates [17,53,55,56,57,58,59,60,61,62,63]. The extraction of cork by-products, such as cork powder, was only performed with methanol [63]. In previous studies, the DPPH scavenging activity was analyzed, but not the total phenolic compounds. The P1 ethanolic extract at 40 °C showed a DPPH scavenging activity (IC50 = 3.67 ± 0.02 µg/mL) similar to the methanolic extract of cork powder already described in the literature (IC50 = 3.33 ± 0.02 µg/mL) [63]. Thus, the extraction method used in this work allowed to obtain a potent antioxidant extract with a less toxic solvent. The preparation of P1 powder extracts with high phenolic content and antioxidant activity opens possibilities for their application in the pharmaceutical, nutraceutical, food, and cosmetic industries.

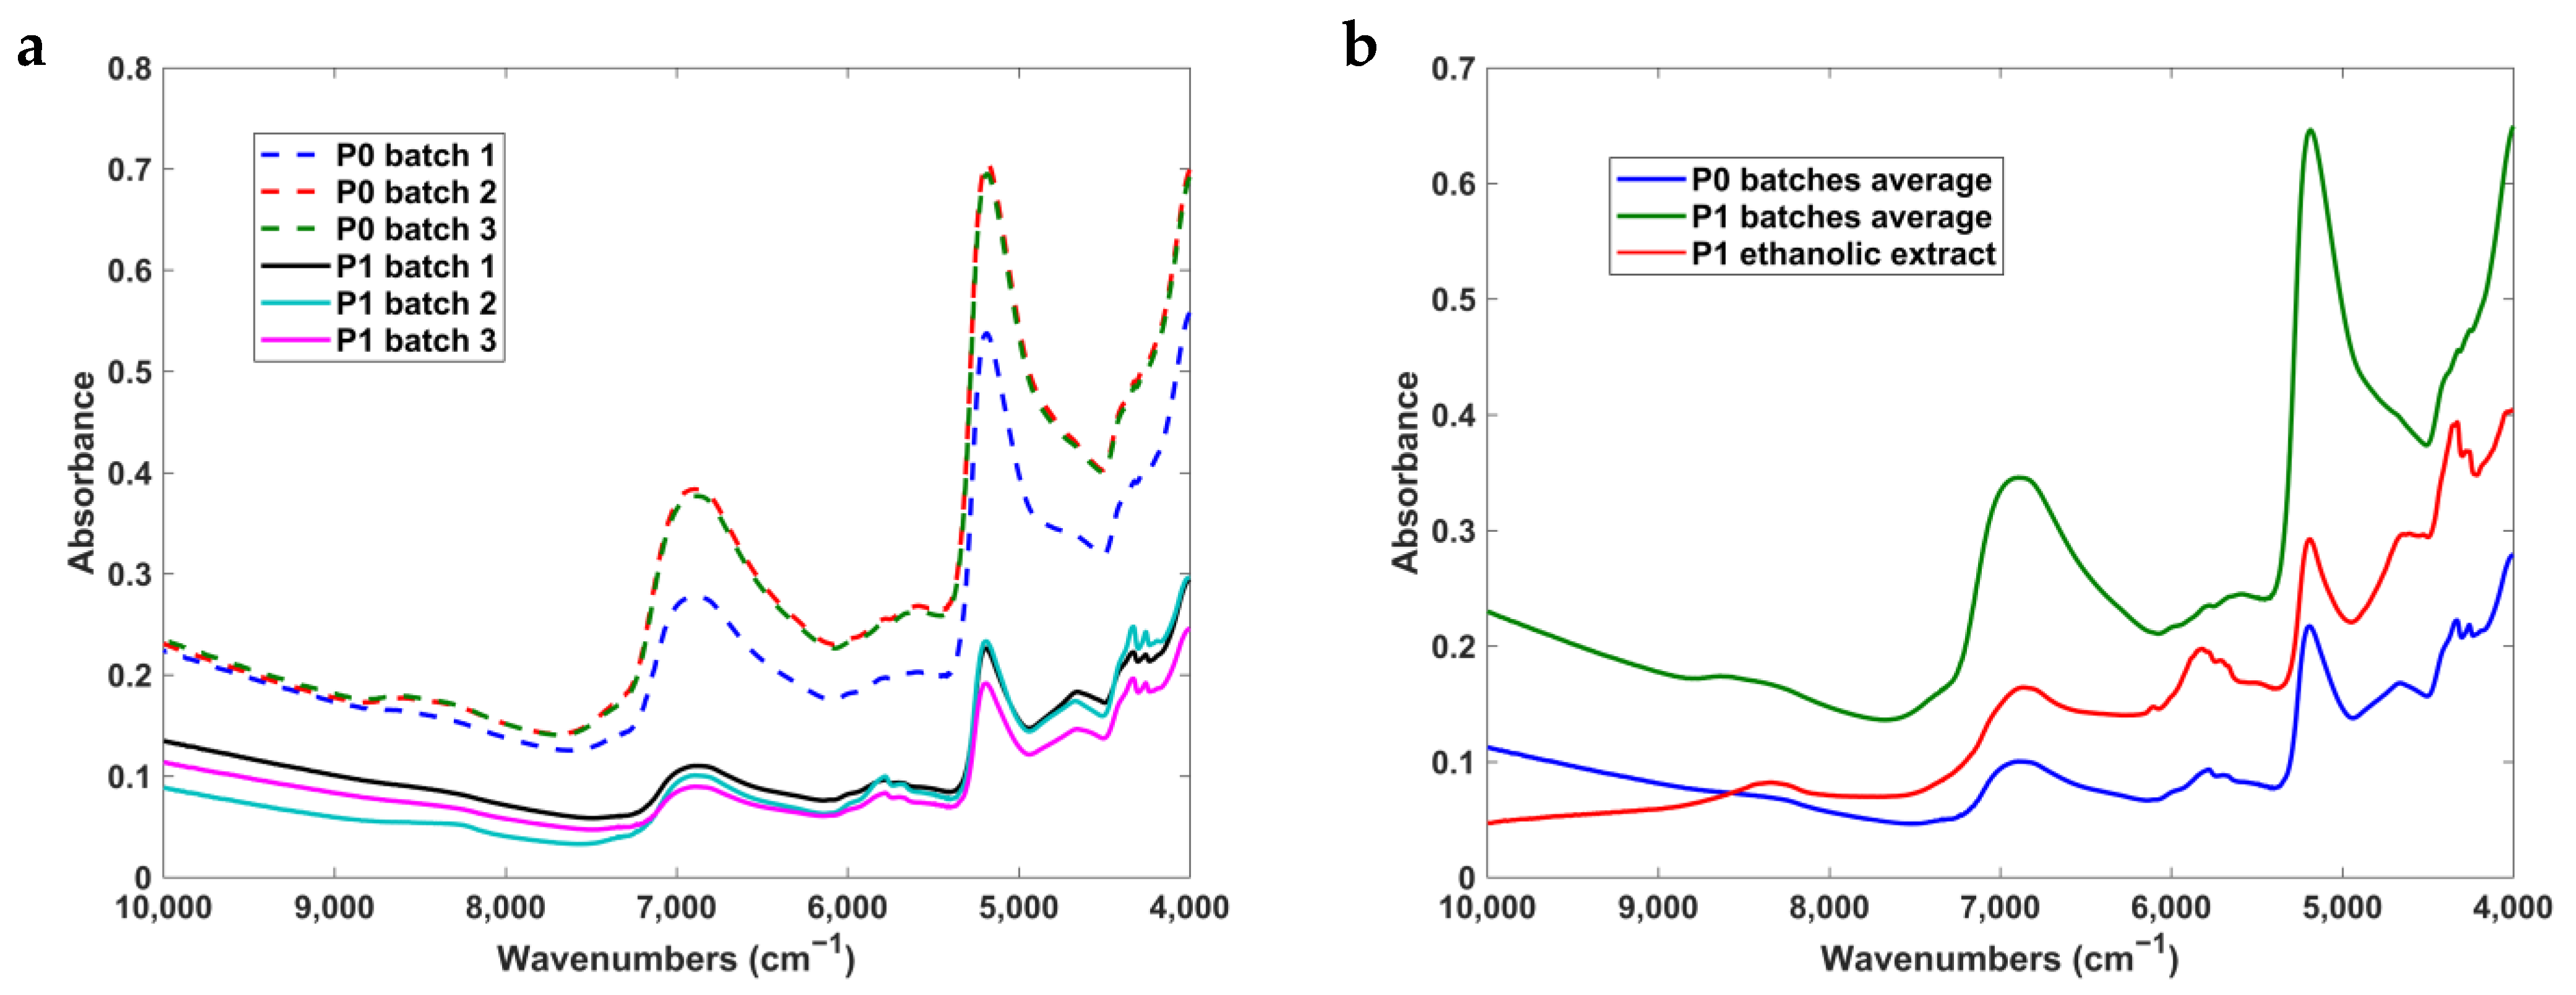
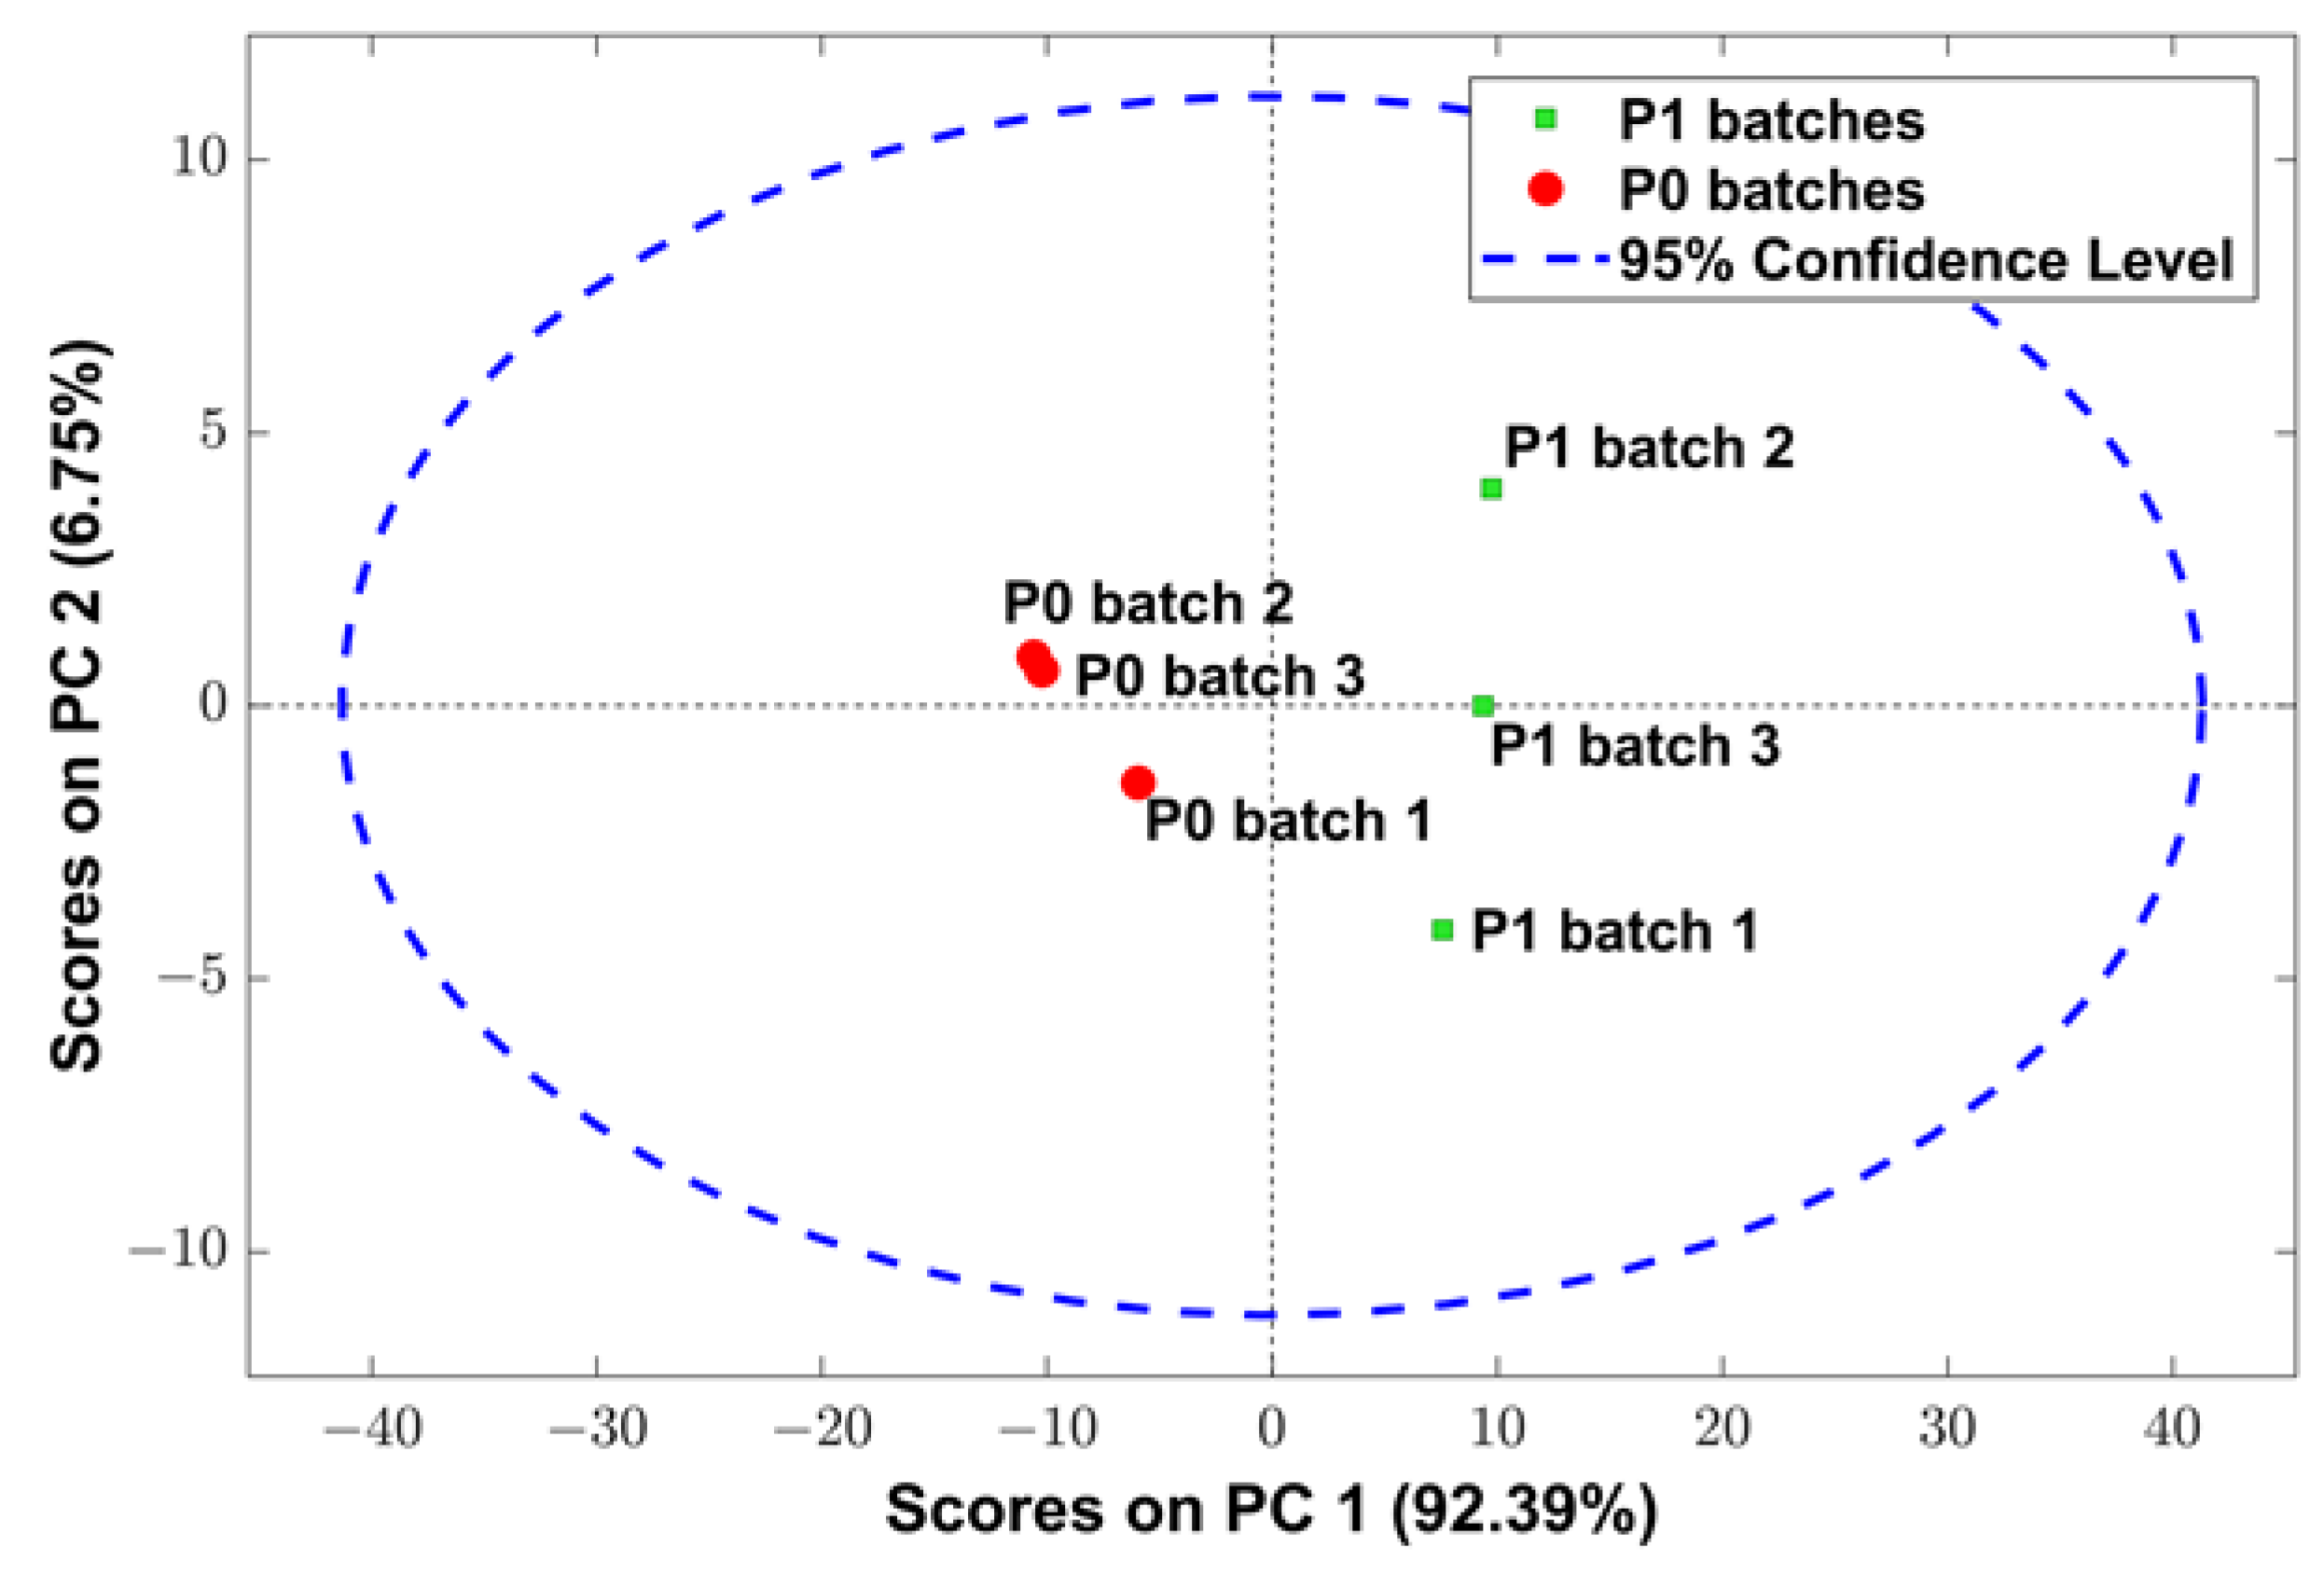
3.4. NIR Spectra Analysis

The raw NIR spectra of P0 and P1 powder samples, as well as the average of P0 and P1 batches and P1 ethanolic extract, are shown in Figure 3. The obtained NIR spectra of the samples are very similar to typical NIR spectra of cork samples [64,65,66,67], but this was the first work exploring cork by-products instead of cork. Previous works focused on the quality parameters of cork plank [64]; and cork stoppers [65] as well as cork anomalies [66,67]. In this work, we pursued the characterization of the batch reproducibility of the cork powders and the comparison of their NIR spectra with that of an ethanolic extract.
The NIR spectra were obtained from 3 different batches of both powders—P0 and P1. Results revealed that P0 batches are quite similar to each other, as was also verified within P1 batches. On the other hand, there are some spectral differences when comparing the P1 ethanolic extract. The spectra of the P0 powder batches showed more intense bands in the range from 7000 to 5200 cm−1 (region of the water bands), which allowed concluding that the P0 powder has a greater amount of water than the P1 powder and the P1 ethanolic extract. Moreover, the bands between 4450 and 4200 cm−1 and between 6000 and 5650 cm−1 were more intense in the P1 ethanolic extract, suggesting that the extract has a higher concentration of chemical compounds containing C-H bonds than the P1 and P0 powder batches.
However, the analysis of the raw NIR spectra of the samples is not enough to guarantee the chemical similarity between samples, since many different chemical bonds can absorb in the same wavenumber region. Thus, a PCA was performed to verify the difference between P0 and P1 powders. Analysis of PCA scores (Figure 4) using NIR spectra data revealed that cork powder samples tend to form clusters according to sample type. Samples from P0 batches yielded negative scores on principal component 1 (PC 1), while samples from P1 batches yielded positive scores. This reinforces that the NIR spectra of P0 and P1 powders are different, while the samples within each batch are similar.
Through loading analysis of P0 and P1 powders (data not shown), the most important wavenumbers regarding PCA scores were located between 5350 and 5250 cm−1 and between 4345 and 4265 cm−1. Wavenumbers between 5350 and 5250 cm−1 can be associated with O–H bonds of water molecules, while wavenumbers within the range of 4345 to 4265 cm−1 can be related to C–H bonds of different compounds, such as proteins, starch, cellulose, and oils [68].
Exploring the interactions between matter and light, NIR can assist in the evaluation of both physical and chemical features of solid samples [69] in a non-destructive way and requiring only a small amount of sample [70]. The results of the NIR spectroscopic analysis revealed that P0 and P1 powder present different profiles, confirming that they differ from each other, which can be explained by the different processes for obtaining these powders. The similarity of the spectra of the different batches of P0 and P1 is a good indicator of batch-to-batch reproducibility.

4. Conclusions

The growing interest in sustainable, natural, and upcycled ingredients has fostered research into the use of agro-industrial by-products and the study of new and high-value applications for these products. In this work, two different cork powders—coarse (P0) and fine (P1)—cork industry by-products, were analyzed. The study carried out aimed at the physicochemical characterization of the powders along with the determination of compounds with biological activity, anticipating their potential industrial application in different fields, namely the pharmaceutical, nutraceutical, food, and cosmetic industries.
The results showed that P1 powder has a more interesting physicochemical profile than P0, mainly due to its more homogeneous particle size distribution. It also had a lower moisture content, as confirmed by the NIR spectra, a parameter that can compromise the stability of powders during storage, altering their physicochemical characteristics as well as their microbiological quality. Regarding the volatile content, powder P1 showed significantly higher contents of monoterpenes than P0. These compounds are used as fragrances in the cosmetics industry, as flavoring agents in the food industry, and as active substances in the pharmaceutical industry. The characteristics of powder P1 revealed a promising potential for its use as a raw material, which motivated the study of the bioactivity of its extracts. For this purpose, P1 ethanolic extracts were prepared and analyzed, which revealed a high content of total phenolic compounds and a marked DPPH scavenging activity. These results confirm that P1 powder can represent a valuable and sustainable natural source of antioxidants, providing an eco-friendly alternative to chemical synthesis and the exploration of other natural sources. Further studies need to be conducted to determine the optimal extraction conditions and evaluate the stability of P1 powder, as well as its safety and effectiveness in cosmetic, pharmaceutical, food, and nutraceutical formulations. Cork by-products have revealed a wide spectrum of potential applications, adding value to the cork sector, which could stimulate interest in the upcycling of these by-products and a decrease in the current burning of cork powder for industrial energy production. Q. suber’s lifecycle sustainability has a positive environmental and economic impact, making it an ideal candidate for the exploitation of upcycled materials that can contribute to the circular economy and environmentally friendly products.

Author Contributions

Conceptualization, I.F.A., J.P.S. and J.M.S.L.; methodology, L.R., S.M., A.T., S.C., H.C. and I.F.A.; formal analysis, H.C., I.F.A., P.G.P., F.A. and R.N.M.J.P.; investigation, L.R., S.M., A.T., C.P., S.C., R.N.M.J.P. and A.A.; writing—original draft preparation, L.R., S.M. and A.T.; writing—review and editing, A.A., P.G.P., H.C., I.F.A., J.P.S. and J.M.S.L.; supervision, H.C. and I.F.A.; project administration, I.F.A. and J.R.e.S.; funding acquisition, I.F.A. All authors have read and agreed to the published version of the manuscript.

Funding

This work was financed by national funds from the European Regional Development Fund (ERDF) through the Northern Regional Operational Programme (NORTE2020) under the project 47239—Cork2Cosmetic (NORTE-01-0247-FEDER-047239). This work was also supported by national funds from FCT—Fundação para a Ciência e a Tecnologia, I.P. in the scope of the projects, UIDP/04378/2020 and UIDB/04378/2020 of the Research Unit on Applied Molecular Biosciences—UCIBIO, UIDB/04423/2020 and UIDP/04423/2020 of CIIMAR (Natural Products and Medicinal Chemistry Research Group), and the project LA/P/0140/2020 of the Associate Laboratory Institute for Health and Bioeconomy—i4HB. S. Mota, A. Torres, L. Rego and C. Pinto acknowledge their research fellowship (NORTE-01-0247-FEDER-047239), fully supported by national funding from project 47239-Cork2Cosmetic (NORTE-01-0247-FEDER-047239). S Mota acknowledges her Ph.D. grant (BD/12487/2022).

Data Availability Statement

The data presented in this study is unavailable due to privacy or ethical restrictions.

Conflicts of Interest

The authors declare no conflict of interest.

References

  1. Ruggerio, C.A. Sustainability and sustainable development: A review of principles and definitions. Sci. Total Environ. 2021, 786, 147481. [Google Scholar] [CrossRef] [PubMed]
  2. United Nations. The 17 Goals—History. Available online: https://sdgs.un.org/goals (accessed on 25 November 2022).
  3. Economy, E.P. Circular Economy: Definition, Importance and Benefits. Available online: https://www.europarl.europa.eu/news/en/headlines/economy/20151201STO05603/circular-economy-definition-importance-and-benefits (accessed on 28 November 2022).
  4. Mota, S.; Pinto, C.; Cravo, S.; Rocha e Silva, J.; Afonso, C.; Sousa Lobo, J.M.; Tiritan, M.E.; Cidade, H.; Almeida, I.F. Quercus suber: A Promising Sustainable Raw Material for Cosmetic Application. Appl. Sci. 2022, 12, 4604. [Google Scholar] [CrossRef]
  5. Morganti, P.; Gao, X.; Vukovic, N.; Gagliardini, A.; Lohani, A.; Morganti, G. Food Loss and Food Waste for Green Cosmetics and Medical Devices for a Cleaner Planet. Cosmetics 2022, 9, 19. [Google Scholar] [CrossRef]
  6. Teixeira, R.T. Cork Development: What Lies Within. Plants 2022, 11, 2671. [Google Scholar] [CrossRef]
  7. Quinto-Canas, R.; Cano-Ortiz, A.; Raposo, M.; Piñar Fuentes, J.C.; Cano, E.; Barbosa, N.; Pinto Gomes, C.J. Cork oak vegetation series of southwestern iberian peninsula: Diversity and ecosystem services. In New Metropolitan Perspectives. NMP 2020. Smart Innovation, Systems and Technologies; Bevilacqua, C., Calabrò, F., Della Spina, L., Eds.; Springer International Publishing: Cham, Switzerland, 2021; Volume 178, pp. 1279–1290. [Google Scholar] [CrossRef]
  8. Cortiça, A.-A.P.D. Montado—Environmental Sustainability. Available online: https://www.apcor.pt/en/montado/sustainability/environmental-sustainability/ (accessed on 28 November 2022).
  9. Oliveira, G.; Costa, A. How resilient is Quercus suber L. to cork harvesting? A review and identification of knowledge gaps. For. Ecol. Manag. 2012, 270, 257–272. [Google Scholar] [CrossRef]
  10. Pérez-Girón, J.C.; Díaz-Varela, E.R.; Álvarez-Álvarez, P. Climate-driven variations in productivity reveal adaptive strategies in Iberian cork oak agroforestry systems. For. Ecosyst. 2022, 9, 100008. [Google Scholar] [CrossRef]
  11. Pereira, H. Cork: Biology, Production and Uses; Elsevier: Amsterdam, The Netherlands, 2007. [Google Scholar]
  12. Gil, L. Cork: Sustainability and New Applications. Front. Mater. 2015, 1, 38. [Google Scholar] [CrossRef] [Green Version]
  13. Associação Portuguesa da Cortiça. CORK_2020. Boletim Estatístico. Available online: https://www.apcor.pt/portfolio-posts/boletim-estatistico-2020/ (accessed on 13 December 2022).
  14. Gil, L. Cork powder waste: An overview. Biomass Bioenergy 1997, 13, 59–61. [Google Scholar] [CrossRef]
  15. Carriço, C.; Ribeiro, H.M.; Marto, J. Converting cork by-products to ecofriendly cork bioactive ingredients: Novel pharmaceutical and cosmetics applications. Ind. Crops Prod. 2018, 125, 72–84. [Google Scholar] [CrossRef]
  16. Sousa, V.B.; Leal, S.; Quilho, T.; Pereira, H. Characterization of Cork Oak (Quercus suber) Wood Anatomy. Iawa J. 2009, 30, 149–161. [Google Scholar] [CrossRef]
  17. Fernandes, A.; Sousa, A.; Mateus, N.; Cabral, M.; de Freitas, V. Analysis of phenolic compounds in cork from Quercus suber L. by HPLC-DAD/ESI-MS. Food Chem. 2011, 125, 1398–1405. [Google Scholar] [CrossRef]
  18. Mislata, A.M.; Puxeu, M.; Ferrer-Gallego, R. Aromatic potential and bioactivity of cork stoppers and cork by-products. Foods 2020, 9, 133. [Google Scholar] [CrossRef] [PubMed] [Green Version]
  19. Conde, E.; Cadahía, E.; García-Vallejo, M.C.; González-Adrados, J.R. Chemical characterization of reproduction cork from spanish Quercus suber. J. Wood Chem. Technol. 1998, 18, 447–469. [Google Scholar] [CrossRef]
  20. Reis, S.F.; Lopes, P.; Roseira, I.; Cabral, M.; Mateus, N.; Freitas, V. Recovery of added value compounds from cork industry by-products. Ind. Crops Prod. 2019, 140, 111599. [Google Scholar] [CrossRef]
  21. Sousa, A.F.; Pinto, P.C.; Silvestre, A.J.; Pascoal Neto, C. Triterpenic and other lipophilic components from industrial cork byproducts. J. Agric. Food Chem. 2006, 54, 6888–6893. [Google Scholar] [CrossRef]
  22. Carriço, C.; Pinto, P.; Graça, A.; Gonçalves, L.M.; Ribeiro, H.M.; Marto, J. Design and characterization of a new Quercus suber-based pickering emulsion for topical application. Pharmaceutics 2019, 11, 131. [Google Scholar] [CrossRef] [Green Version]
  23. Associação Portuguesa da Cortiça. Cork Processing—Industrial Path—Natural Cork Stoppers. Available online: https://www.apcor.pt/en/cork/processing/industrial-path/natural-cork-stoppers/ (accessed on 15 December 2022).
  24. Faé, G.S.; Montes, F.; Bazilevskaya, E.; Añó, R.M.; Kemanian, A.R. Making Soil Particle Size Analysis by Laser Diffraction Compatible with Standard Soil Texture Determination Methods. Soil Sci. Soc. Am. J. 2019, 83, 1244–1252. [Google Scholar] [CrossRef] [Green Version]
  25. Konen, M.E.; Burras, C.L.; Sandor, J.A. Organic Carbon, Texture, and Quantitative Color Measurement Relationships for Cultivated Soils in North Central Iowa. Soil Sci. Soc. Am. J. 2003, 67, 1823–1830. [Google Scholar] [CrossRef]
  26. European Directorate for the Quality of Medicines & HealthCare. European Pharmacopoeia, 10th ed.; Council of Europe: Strasbourg, France, 2021. [Google Scholar]
  27. United States Environmental Protection Agency (EPA). Test Method 3052: Microwave Assisted Acid Digestion of Siliceous and Organically Based Matrices; EPA SW-846, Revision 3; EPA: Washington, DC, USA, 1996. [Google Scholar]
  28. Pinto, J.; Oliveira, A.S.; Lopes, P.; Roseira, I.; Cabral, M.; de Lourdes Bastos, M.; Guedes de Pinho, P. Characterization of chemical compounds susceptible to be extracted from cork by the wine using GC-MS and 1H NMR metabolomic approaches. Food Chem. 2019, 271, 639–649. [Google Scholar] [CrossRef]
  29. Cruz, I.; Puthongking, P.; Cravo, S.; Palmeira, A.; Cidade, H.; Pinto, M.; Sousa, E. Xanthone and Flavone Derivatives as Dual Agents with Acetylcholinesterase Inhibition and Antioxidant Activity as Potential Anti-Alzheimer Agents. J. Chem. 2017, 2017, 8587260. [Google Scholar] [CrossRef] [Green Version]
  30. Vale, A.P.; Cidade, H.; Pinto, M.; Oliveira, M.B. Effect of sprouting and light cycle on antioxidant activity of Brassica oleracea varieties. Food Chem. 2014, 165, 379–387. [Google Scholar] [CrossRef] [PubMed]
  31. Singleton, V.L.; Rossi, J.A. Colorimetry of Total Phenolics with Phosphomolybdic-Phosphotungstic Acid Reagents. Am. J. Enol. Vitic. 1965, 16, 144. [Google Scholar]
  32. Alves, R.C.; Costa, A.S.G.; Jerez, M.; Casal, S.; Sineiro, J.; Núñez, M.J.; Oliveira, B. Antiradical Activity, Phenolics Profile, and Hydroxymethylfurfural in Espresso Coffee: Influence of Technological Factors. J. Agric. Food Chem. 2010, 58, 12221–12229. [Google Scholar] [CrossRef] [PubMed]
  33. Ireneusz, O.; Marcin, C.; Mateusz, S.; Karolina, L.; Marcin, O.; Mateusz, P. Studies on Moisture Effects on Powder Flow and Mechanochemical Improvement of Powder Flowability. Adv. Sci. Technol. Res. J. 2021, 15, 228–246. [Google Scholar] [CrossRef]
  34. Hunt, R.W.G.; Pointer, M.R. Measuring Color; John Wiley & Sons Inc.: New York, NY, USA, 2011. [Google Scholar]
  35. MacDougall, D. Colour in Food: Improving Quality; Elsevier Science: Amsterdam, The Netherlands, 2002. [Google Scholar]
  36. Lukić, M.; Pantelić, I.; Savić, S.D. Towards Optimal pH of the Skin and Topical Formulations: From the Current State of the Art to Tailored Products. Cosmetics 2021, 8, 69. [Google Scholar] [CrossRef]
  37. International Conference on Harmonisation of Technical Requirements for Registration of Pharmaceuticals for Human Use (ICH). Guideline Q3D (R2) on Elemental Impurities; European Medicines Agency: Amsterdam, The Netherlands, 2022. [Google Scholar]
  38. European Commission. Regulation (EC) No 1223/2009 of the European Parliament and of the Council on cosmetic products. Off. J. Eur. Union 2009, L 342, 59–209. [Google Scholar]
  39. European Commission. Commission Regulation (EC) No 1881/2006 setting maximum levels for certain contaminants in foodstuffs. Off. J. Eur. Union 2006, L 364, 5–24. [Google Scholar]
  40. European Commission. Commission Regulation (EU) No. 488/2014 amending Regulation (EC) No. 1881/2006 as regards maximum levels of cadmium in foodstuffs. Off. J. Eur. Union 2021, L 138, 75–79. [Google Scholar]
  41. European Commission. Commission Regulation (EC) No. 1881/2006 setting maximum levels for certain contaminants in foodstuffs. Off. J. Eur. Union 2021, L 314M, 558–577. [Google Scholar]
  42. Moreira, N.; Lopes, P.; Cabral, M.; Guedes de Pinho, P. HS-SPME/GC-MS methodologies for the analysis of volatile compounds in cork material. Eur. Food Res. Technol. 2016, 242, 457–466. [Google Scholar] [CrossRef]
  43. Furtado, I.; Oliveira, A.S.; Amaro, F.; Lopes, P.; Cabral, M.; de Lourdes Bastos, M.; Guedes de Pinho, P.; Pinto, J. Volatile profile of cork as a tool for classification of natural cork stoppers. Talanta 2021, 223, 121698. [Google Scholar] [CrossRef] [PubMed]
  44. Furtado, I.; Lopes, P.; Oliveira, A.S.; Amaro, F.; de Lourdes Bastos, M.; Cabral, M.; Guedes de Pinho, P.; Pinto, J. The Impact of Different Closures on the Flavor Composition of Wines during Bottle Aging. Foods 2021, 10, 2070. [Google Scholar] [CrossRef] [PubMed]
  45. Viant, M.R.; Kurland, I.J.; Jones, M.R.; Dunn, W.B. How close are we to complete annotation of metabolomes? Curr. Opin. Chem. Biol. 2017, 36, 64–69. [Google Scholar] [CrossRef] [PubMed]
  46. Soares-Castro, P.; Soares, F.; Santos, P.M. Current Advances in the Bacterial Toolbox for the Biotechnological Production of Monoterpene-Based Aroma Compounds. Molecules 2021, 26, 91. [Google Scholar] [CrossRef] [PubMed]
  47. Han, Y.; Sun, Z.; Chen, W. Antimicrobial Susceptibility and Antibacterial Mechanism of Limonene against Listeria monocytogenes. Molecules 2019, 25, 33. [Google Scholar] [CrossRef] [PubMed] [Green Version]
  48. Seol, G.H.; Kim, K.Y. Eucalyptol and Its Role in Chronic Diseases. Adv. Exp. Med. Biol. 2016, 929, 389–398. [Google Scholar] [CrossRef] [PubMed]
  49. Chen, W.; Vermaak, I.; Viljoen, A. Camphor--a fumigant during the Black Death and a coveted fragrant wood in ancient Egypt and Babylon—A review. Molecules 2013, 18, 5434–5454. [Google Scholar] [CrossRef] [Green Version]
  50. Song, R.; Wu, Q.; Zhao, L.; Yun, Z. Advances on antioxidants in research and applications. E3S Web Conf. 2019, 131, 01009. [Google Scholar] [CrossRef]
  51. Griffiths, K.; Aggarwal, B.B.; Singh, R.B.; Buttar, H.S.; Wilson, D.; De Meester, F. Food Antioxidants and Their Anti-Inflammatory Properties: A Potential Role in Cardiovascular Diseases and Cancer Prevention. Diseases 2016, 4, 28. [Google Scholar] [CrossRef]
  52. Brudzyńska, P.; Kurzawa, M.; Sionkowska, A.; Grisel, M. Antioxidant Activity of Plant-Derived Colorants for Potential Cosmetic Application. Cosmetics 2022, 9, 81. [Google Scholar] [CrossRef]
  53. Santos, S.A.O.; Pinto, P.C.R.O.; Silvestre, A.J.D.; Neto, C.P. Chemical composition and antioxidant activity of phenolic extracts of cork from Quercus suber L. Ind. Crops Prod. 2010, 31, 521–526. [Google Scholar] [CrossRef]
  54. Antony, A.; Farid, M. Effect of Temperatures on Polyphenols during Extraction. Appl. Sci. 2022, 12, 2107. [Google Scholar] [CrossRef]
  55. Conde, E.; Cadahia, E.; GarciaVallejo, M.C.; de Simon, B.F.; Adrados, J.R.G. Low molecular weight polyphenols in cork of Quercus suber. J. Agric. Food Chem. 1997, 45, 2695–2700. [Google Scholar] [CrossRef]
  56. Castola, V.; Marongiu, B.; Bighelli, A.; Floris, C.; Laï, A.; Casanova, J. Extractives of cork (Quercus suber L.): Chemical composition of dichloromethane and supercritical CO2 extracts. Ind. Crops Prod. 2005, 21, 65–69. [Google Scholar] [CrossRef]
  57. Fernandes, A.; Fernandes, I.; Cruz, L.s.; Mateus, N.; Cabral, M.; de Freitas, V. Antioxidant and Biological Properties of Bioactive Phenolic Compounds from Quercus suber L. J. Agric. Food Chem. 2009, 57, 11154–11160. [Google Scholar] [CrossRef] [PubMed]
  58. Azevedo, J.; Fernandes, A.; Oliveira, J.; Brás, N.F.; Reis, S.; Lopes, P.; Roseira, I.; Cabral, M.; Mateus, N.; de Freitas, V. Reactivity of Cork Extracts with (+)-Catechin and Malvidin-3-O-glucoside in Wine Model Solutions: Identification of a New Family of Ellagitannin-Derived Compounds (Corklins). J. Agric. Food Chem. 2017, 65, 8714–8726. [Google Scholar] [CrossRef]
  59. Araújo, A.R.; Pereira, D.M.; Aroso, I.M.; Santos, T.; Batista, M.T.; Cerqueira, M.T.; Marques, A.P.; Reis, R.L.; Pires, R.A. Cork extracts reduce UV-mediated DNA fragmentation and cell death. RSC Adv. 2015, 5, 96151–96157. [Google Scholar] [CrossRef] [Green Version]
  60. Cunha, M.; Lourenço, A.; Barreiros, S.; Paiva, A.; Simões, P. Valorization of Cork Using Subcritical Water. Molecules 2020, 25, 4695. [Google Scholar] [CrossRef]
  61. Batista, M.; Rosete, M.; Ferreira, I.; Ferreira, J.; Duarte, C.; Matias, A.; Poejo, J.; Crespo, J.; Valério, R.; Fraga, M.; et al. Extracto Hidro-Glicólico de Cortiça, Processo para a sua Preparação, Formulações Compreendendo o Referido Extracto e sua Utilização. International Patent WO2015152746A1; filed 1 April 2015, issued 8 October, 2015. [Google Scholar]
  62. Aroso, I.M.; Araújo, A.R.; Fernandes, J.P.; Santos, T.; Batista, M.T.; Pires, R.A.; Mano, J.F.; Reis, R.L. Hydroalcoholic extracts from the bark of Quercus suber L. (Cork): Optimization of extraction conditions, chemical composition and antioxidant potential. Wood Sci. Technol. 2017, 51, 855–872. [Google Scholar] [CrossRef]
  63. Santos, S.A.O.; Villaverde, J.J.; Sousa, A.F.; Coelho, J.F.J.; Neto, C.P.; Silvestre, A.J.D. Phenolic composition and antioxidant activity of industrial cork by-products. Ind. Crops Prod. 2013, 47, 262–269. [Google Scholar] [CrossRef]
  64. Prades, C.; García-Olmo, J.; Romero-Prieto, T.; García de Ceca, J.L.; López-Luque, R. Methodology for cork plank characterization (Quercus suber L.) by near-infrared spectroscopy and image analysis. Meas. Sci. Technol. 2010, 21, 065602. [Google Scholar] [CrossRef]
  65. Prades, C.; Gómez-Sánchez, I.; Garcia-Olmo, J.; González-Hernández, F.; Gonzalez-Adrados, J.R. Application of VIS/NIR spectroscopy for estimating chemical, physical and mechanical properties of cork stoppers. Wood Sci. Technol. 2014, 48, 811–830. [Google Scholar] [CrossRef]
  66. Prades, C.; Cardillo-Amo, E.; Beira-Dávila, J.; Serrano-Crespín, A.; Nuñez-Sánchez, N. Evaluation of Parameters that Determine Cork Plank Quality (Quercus suber L.) by Near Infrared Spectroscopy. J. Wood Chem. Technol. 2017, 37, 369–382. [Google Scholar] [CrossRef]
  67. Pérez-Terrazas, D.; González-Adrados, J.R.; Sánchez-González, M. Qualitative and quantitative assessment of cork anomalies using near infrared spectroscopy (NIRS). Food Packag. Shelf Life 2020, 24, 100490. [Google Scholar] [CrossRef]
  68. Burns, D.A.; Ciurczak, E.W. Chapter 17—Calibration Transfer. In Handbook of Near-Infrared Analysis; CRC Press: Boca Raton, FL, USA, 2007; pp. 347–386. [Google Scholar]
  69. Joshi, R.; Sathasivam, R.; Jayapal, P.K.; Patel, A.K.; Nguyen, B.V.; Faqeerzada, M.A.; Park, S.U.; Lee, S.H.; Kim, M.S.; Baek, I.; et al. Comparative Determination of Phenolic Compounds in Arabidopsis thaliana Leaf Powder under Distinct Stress Conditions Using Fourier-Transform Infrared (FT-IR) and Near-Infrared (FT-NIR) Spectroscopy. Plants 2022, 11, 836. [Google Scholar] [CrossRef]
  70. Muthudoss, P.; Tewari, I.; Chi, R.L.R.; Young, K.J.; Ann, E.Y.C.; Hui, D.N.S.; Khai, O.Y.; Allada, R.; Rao, M.; Shahane, S.; et al. Machine Learning-Enabled NIR Spectroscopy in Assessing Powder Blend Uniformity: Clear-Up Disparities and Biases Induced by Physical Artefacts. AAPS PharmSciTech 2022, 23, 277. [Google Scholar] [CrossRef]
Figure 1. P0 (a) and P1 (b) sample powders.
Forests 14 00543 g001
Figure 2. Representative full scan chromatograms obtained through HS-SPME-GC-MS analysis of P0 (a) and P1 (b) powders. 1: pent-2-one; 2: 4-methylpent-2-one; 3: hex-2-one; 4: vanillin; 5: camphene; 6: limonene; 7: eucalyptol; 8: phenylethyl alcohol; 9: camphor; 10: borneol.
Forests 14 00543 g002
Figure 3. Raw NIR spectra of cork powder P0 and P1 batches (a) and their respective average with P1 ethanolic extract (b).
Forests 14 00543 g003
Figure 4. Score plots obtained from PCA using NIR spectra of different batches of P0 and P1 powders pre-processed with Savitzky–Golay filter (15-point filter width, second-degree polynomial, first derivative) followed by standard normal variate (SNV) and mean center.
Forests 14 00543 g004
Table 1. Physicochemical characterization of powder samples P0 and P1.
ParameterP0P1
Particle size (µm)
Dx10463 ± 2866.7 ± 0.0
Dx501200 ± 25724.6 ± 0.1
Dx902340 ± 19872.5 ± 1.2
ColorL* = 40.20 ± 0.40L* = 54.83 ± 0.16
a* = 6.97 ± 0.30a* = 7.67 ± 0.15
b* = 11.20 ± 0.27b* = 16.62 ± 0.17
Moisture content (%)19.3 ± 7.27.6 ± 1.0
Hygroscopicity (%)---0.88 ± 0.73
pH6.70 ± 0.055.51 ± 0.01
Heavy metals
(µg/g)
As = 0.21 ± 0.02As = 0.40 ± 0.02
Cd = 0.058 ± 0.003Cd = 0.106 ± 0.003
Hg = 0.008 ± 0.000Hg = 0.007 ± 0.000
Pb = 1.04 ± 0.14Pb = 2.40 ± 0.14
Note: Dx10 = 10% of the particles have a diameter smaller than this value. Dx50 = median particle size. Dx90 = 90% of the particles have a diameter smaller than this value.
Table 2. Analysis of volatile compound in P0 and P1 powders.
CompoundsRT (min)m/zR MatchArea (AU)Odor Descriptor
P0 ± SD (10⁶)P1 ± SD (10⁶)
Ketones
Pent-2-one L13.6058, 71, 8689521.60 ± 5.7219.00± 6.25Fruity [44]
4-methylpent-2-one L24.4358, 85, 10080533.60 ± 7.5123.90 ± 14.70
Hex-2-one L15.4458, 85, 1008696.07 ± 0.984.81 ± 1.19Ether [44]
Aromatic aldehydes
Vanillin L19.66193, 20968618.50 ± 1.4815.40 ± 2.22 Vanilla like [28]
Monoterpenes
Camphene L29.8393, 1219251.19 ± 0.042.74 ± 0.71Camphor, herbal, woody [28]
Limonene L112.2567, 68, 93871---2.32 ± 0.68 Lemon, orange [28]
Eucalyptol L112.3581, 93, 1088002.37 ± 1.4546.40 ± 8.59Mint, herbal [28]
Camphor L115.8795, 10990122.30 ± 0.8162.00 ± 1.50Camphor [28]
Borneol L216.6195, 1008092.02 ± 0.15 7.18 ± 0.60Camphor like [28]
Alcohols
Phenylethyl alcohol L11591, 928240.97 ± 0.09---Rose, honey, talc [28]
RT: retention time; SD: standard deviation; AU: arbitrary units. L1 Identified metabolites (analysis of the metabolite of interest and a chemical reference standard under identical analytical conditions within the same laboratory). L2 Putatively annotated compounds (MS spectral similarity to NIST database) [45].
Table 3. TPC and DPPH scavenging activity of P1 ethanolic extract.
40 °CRT
Total Phenolic Compounds
(mg GAE/g of extract)
468.5 ± 0.57354.7 ± 0.21
DPPH
(IC50 = μg of extract/mL)
3.67 ± 0.027.33 ± 0.63
Note: Results are given as mean ± SEM of three independent experiments performed in triplicate. Ascorbic acid (positive control): IC50: 9.3 ± 0.3 µg/mL.
Disclaimer/Publisher’s Note: The statements, opinions and data contained in all publications are solely those of the individual author(s) and contributor(s) and not of MDPI and/or the editor(s). MDPI and/or the editor(s) disclaim responsibility for any injury to people or property resulting from any ideas, methods, instructions or products referred to in the content.

