Abstract
This study was conducted to quantify the carbon storage in each pool (including trees, forest floor, and soil) and to analyze the carbon cycle in a Chamaecyparis obtusa (Siebold and Zucc.) Endl. forest according to different thinning intensities. The study site was located in Gochang-gun, Jeollabuk-do, and the treatments consisted of a control (Con), a light thinning (LT), and a heavy thinning (HT), based on 3000 trees originally planted per hectare. As stand density decreased, total C storage decreased, and the annual C storage of trees and C released through soil respiration significantly increased. Net ecosystem production (NEP; Mg·C·ha−1·year−1), as the difference between net primary production and microbial respiration, was 1.95, 2.49, and 2.11 in the Con, LT, and HT treatments, respectively; i.e., the LT stimulated greater NEP than the Con and HT treatments. While these results show that thinning decreases total C storage of forests, proper thinning enhances carbon uptake capacity. In addition, this study can be a basic reference for the effects of thinning on forest carbon cycles. Repeated measurements of each C pool should be performed over multiple years to see the exact movement patterns of forest carbon in the future.
1. Introduction
Climate change and ecosystem destruction are occurring globally because of global warming, and increasing atmospheric carbon dioxide (CO2) concentrations are regarded as the main cause of this phenomenon [1]. In response to climate change, forests, as carbon dioxide sinks, can be used as a countermeasure [2,3]. Forests absorb and store a lot of carbon (C) in trees, the forest floor, and soil [4,5], and their ability to do so varies depending on various factors such as climate (and thus climate change), afforestation, and thinning [6,7]. Therefore, in terms of carbon neutrality, it is important to quantify the carbon cycle of forest vegetation and soils, and how the forestry management practices used for major plantation species affect them.
Thinning is a forest management practice that enhances trees’ C uptake in which some trees are removed to reduce competition for resources such as sunlight and nutrients within the stand [8,9]. Therefore, to establish appropriate forest management practices or build a forest C inventory, we must identify the changes to forests caused by thinning [10]. Thinning is known to increase diameter growth but decrease total aboveground carbon storage in trees [10,11]. It is also known that thinning can cause changes in the influx and decomposition of litterfall, affecting the accumulation of organic matter on the forest floor and in the soil [12,13,14]. A meta-analysis of the effects of thinning on soil C stocks and dynamics reported that thinning increased soil respiration [15]. However, it is difficult to draw consistent conclusions because the effects of thinning on the C cycle differ depending on species, climatic zone, soil, and operation method [2,16]. In addition, questions remain about how and for how long thinning affects net ecosystem production (NEP).
Cypress (Chamaecyparis obtusa (Siebold and Zucc.) Endl.) is a major afforestation species in Korea. After being introduced from Japan in 1904, its use in afforestation activities carried out in the southern part of Korea began in the 1960s. In 2020, cypress was planted with the largest area (5077 ha) among conifers [17]. Recently, cypress was selected as a species responding to climate change and a species recommended for future afforestation, and it is expected that research on expanding afforestation and responding to climate change will be conducted actively [18]. In addition, since cypress is a species with high medicinal and recreational value, it is expected that the value of using forest ecosystem services will increase [19,20].
Research on cypress forests has included studies characterizing the vegetation structure [21]; investigating the relationship between C stocks (trees, forest floor, and soil) and environmental factors in cedar (Cryptomeria japonica) and cypress forests and comparing C absorption capacity among tree species through the investigation of tree, forest floor, and soil C stocks [22]; analyzing the correlation between site environmental factors and tree ring growth [23]; and assessing the adequacy and growth effects of thinning methods [24]. However, most studies looking at thinning intensity and the resulting changes in carbon storage have been conducted on pine forests [25,26]. There is no such research on cypress forests.
Therefore, the purpose of this study was to analyze and compare the changes in C storage in trees, forest floor, and soil and the C shifts between them resulting from thinning methods of different intensities in a cypress forest.
2. Materials and Methods
2.1. Site Description
This study was conducted in a cypress plantation (35°24′17.64″ N, 126°43′15.03″ E) located on Mt. Munsu in Gochang-gun, Jeollabuk-do. The study site is more than 100 m away from the main forest road on the ridge of a northeast-facing slope with a steepness gradient of 20–25°. The dominant soil types are Inceptisols and Entisols [27]. The climate zone belongs to the temperate zone, and the parent rock is metamorphic. The 30-year average temperature of Gochang-gun is 13.2 °C with an annual average maximum temperature of 18.6 °C and an annual average minimum temperature of 8.6 °C. The annual precipitation is 1225.5 mm [28].
The study site is divided into three thinning treatment groups: control (Con), light thinning (LT), and heavy thinning (HT). In 1976, 3-year-old cypress seedlings were planted in each treatment at a density of 3000 trees per hectare. The first thinning was in 2000 (27-year-old trees), and the second thinning was in 2018 (45-year-old trees). In both cases, the thinning intensities were 30% and 50% in the LT and HT treatments, respectively, based on the number of trees in pre-thinned plots. The size of the study site was 2.5 ha, and each treatment group was divided into 0.5 ha. Three 20 × 20 m plots were established in each treatment group, and two 20 × 20 m plots were established in the unthinned treatments due to the small size of the study site (Table 1). The locations of individual plots were kept at least 10 m apart to prevent plots from being affected by adjacent treatment areas. In 2000, the diameter at breast height (DBH) and the number of trees by treatments were collected after the first thinning, and in 2018, DBH, number of trees, and the light intensity by treatments were collected before the second thinning (Table 1).

Table 1.
Characteristics of Con, light thinning (LT), and heavy thinning (HT) treatments in a Chamaecyparis obtusa (Siebold and Zucc.) Endl. forest in 2000 and 2018.
2.2. Study Methods
2.2.1. Light Intensity
The light intensity in each plot of each treatment was measured using a portable photosynthesis system (Type LCA4, ADC, Hoddesdon, UK). Light intensity was measured every 10 min from 8:00 a.m. to 6:00 p.m. at the beginning of each month on sunny days in 2018.
2.2.2. Aboveground Biomass of Understory Vegetation
The aboveground biomass of understory vegetation (UVB) existing in a 3 × 3 m plot was collected in August 2018. Three sampling points for UVB were located in each treatment plot. In total, 24 samples were weighed after drying.
2.2.3. Tree Carbon Storage and Annual Net Primary Production
In order to analyze growth before and after thinning, DBH was measured in 2000 and 2018. Based on the measured DBH, the amount of biomass per unit area was calculated using the biomass algometric equations of cypress (independent variable of DBH) presented by KFRI [29]. Stem, branch, leaf, and root biomasses were calculated using Equations (1)–(4). Then, after summing the biomasses of the four parts, the C storage of each tree was calculated by multiplying the sum by the carbon conversion factor (0.5). Afterward, the net increase in C, i.e., NPP, was calculated by subtracting the C storage in 2000 from 2018 and dividing it by the corresponding year to estimate the C absorption of trees in each plot.
Stem biomass (Mg·ha−1) = (0.165 × DBH2.157)/1000
Branch biomass (Mg·ha−1) = (0.022 × DBH 2.277)/1000
Leaf biomass (Mg·ha−1) = (0.136 × DBH 1.470)/1000
Root biomass (Mg·ha−1) = (0.464 × DBH 1.404)/1000
2.2.4. Litterfall
Three circular litter traps (0.25 m2 circular area and 1.2 m height) per plot were used for litterfall collection. These litter traps were installed randomly in each plot, and samples were collected a total of six times, at two-month intervals, from February 2019 to February 2020. Samples were dried at 65 °C until a constant weight was reached then divided into leaves, branches, and seeds, and each was weighed. Dried samples were pulverized with a grinder, and their C concentrations were analyzed using a Vario Macro Elemental Analyzer (Elementary Analysensysteme GmbH, Langenselbold, Germany). Based on this, the relative C concentrations were calculated as 57% of the dry weight of leaves and branches and 3.7% of the dry weight of seeds.
2.2.5. Forest Floor and Soil C Concentration and Storage
Forest floor (FF) and soil samples were collected in three repetitions by selecting three sampling points within each plot in 2018. The forest floor samples were collected using a frame covering 30 × 30 cm, and soil samples were separately sampled at 0–10 cm, 10–20 cm, and 20–30 cm depths using a 10 cm long cylindrical metal core (407 cm3). The soil samples were air-dried for two weeks. They were then separated into fine earth and gravel with a 2 mm mesh (US standard No. 10), and each was weighed to calculate coarse rock content and bulk density. The forest floor and soil C concentrations were measured using a CN elemental analyzer (Vario Macro, Elementary Analysensysteme GmbH, Langenselbold, Germany). Forest floor C storage (FFCS) was calculated by multiplying the forest floor C concentrations by the dry weight, and soil C storage (SCS) was calculated using the following equation [30] (Equation (5)):
where T is the depth of soil (cm), BD is the bulk density (g·cm−3), C is the C concentration (%), and CF is the coarse fraction (%).
SCS (Mg·C·ha−1) = T × BD × C × (100 − CF)/100
2.2.6. Litter Decomposition
From the logging residues, fresh leaf litter and one-year fresh branches originating from the thinned cypress trees were collected in December 2018. After air-drying for one month, 3 sets, each composed of 5 litter bags containing 5 g of litter per bag, were buried under the forest floor in February 2019 for each plot in the study site. Samples were retrieved in May and August 2019 and February and August 2020. They were then air-dried in a dryer at 65 °C for 72 h, and the remaining mass was measured. The remaining weight was expressed as a percentage (%) of the initial weight [31] (Equation (6)):
where R0 is the mass of the original collection, Rt is the mass remaining at time t, and t is decomposition time.
Remaining mass (%) = Rt/R0 × 100
2.2.7. Soil Respiration
Soil respiration was measured regularly every month from April 2019 to October 2020. The measurement was performed twice a day using a portable soil respiration analyzer (GMP343, Vaisala, Finland), Indicator MI-70 (Vaisala, Finland), and a cylindrical chamber (diameter 119 mm, height 155 mm) at three random points in each plot. The CO2 concentration was calculated using Equation (7) [32]. Annual soil respiration was calculated by converting it into CO2 concentration per hectare per year. Since root respiration for soil respiration varies from 10 to 90%, root respiration and microbial respiration were calculated by applying 46% and 54%, respectively, of the total soil respiration to each category [33,34].
where FCO2 is the CO2 concentration (μg·CO2·m−2·s−1), P is the atmospheric pressure (kPa), Vc is the chamber volume (cm3), A is the chamber basal area (cm2), T is the gas temperature (K), ΔCO2/Δt is the change rate of the CO2 molar fraction during measurement time (μmol·mol−1), and 44/22.41 is used as the molecular weight of CO2 in the volume of 1 mol of gas.
FCO2 = PVc/1000 × 273.15/A(T + 273.15) × 10,000 × ΔCO2/Δt × 44/22.41
2.2.8. Net Ecosystem Production
The net ecosystem production (NEP) of a forest ecosystem is determined by the difference between the net primary production (NPP) produced by trees through photosynthesis and C emissions by microbial respiration (Rh) [35] (Equation (8)):
NEP = NPP − Rh
2.2.9. Statistical Analysis
A one-way analysis of variance (ANOVA) was used to analyze the effects of the treatments on light intensity, mean annual increment, and each part of the C cycle, such as C storage and C shift, based on the stand density control of the cypress forests. Duncan’s multiple range tests were performed to determine the significant differences between the three groups at a significance level of α = 0.05. Prior to statistical analysis, all data were examined for homogeneity using Levene’s test (p-value > 0.05). The SAS 9.4 software package (SAS Institute Inc., Cary, NC, USA) was used for all statistical analyses.
3. Results and Discussion
3.1. Changes in C Storage by C Pool Resulting from Different Thinning Intensities in Cypress Forests
3.1.1. Aboveground C Storage in Trees
In 2018, C storage (Mg·C·ha−1) in trees decreased significantly in the HT (151.78) compared to the Con (179.43) treatment, but there was no significant difference between the LT (163.86) and Con (p < 0.05; Table 2). The LT decreased tree C storage by about 8.7% compared to the Con, and the HT decreased tree C storage by about 15.4% compared to the Con. It is believed that thinning reduced the number of trees, thus affecting the C storage of trees. Previous research corroborates this: in studies that analyzed the effects of varied thinning intensities on aboveground C storage of Q. acuta forests in the southern and P. koraiensis forests in the central regions of Korea, C storage in the thinned treatments was reduced compared to the unthinned plot [36,37]. Therefore, thinning reduces C storage of trees regardless of region and species.
Table 2.
Mean annual increment (MAI) (cm·year−1), carbon storage (Mg·C·ha−1), and net primary production (NPP) (Mg·C·ha−1·year−1) from 2000 to 2018 in a Chamaecyparis obtusa (Siebold and Zucc.) Endl. forest.
Mean annual increment (MAI; cm·year−1) from 2000 to 2018 increased significantly in the HT (0.42) compared to the Con treatment (0.27), but there was no significant difference between the LT (0.30) and Con (p < 0.01; Table 2). The HT increased MAI by about 53.4% compared to Con, and it is believed that this difference is due to increased light penetration through the thinned canopy and the mitigation of between-tree competition due to the decrease in stand density [38]. This has also been proven previously in various tree species, such as C. obtusa [24], P. koraiensis [39], and Q. glauca [40]. In a study that analyzed the growth effect of thinning in C. obtusa, which is the same species considered in this study, the DBH growth was similar between treatments in the early stages of thinning, but 18 years after thinning, mean DBH increased as the intensity of thinning increased. In the case of P. koraiensis, DBH growth of heavily thinned treatments (752 trees per hectare, 951 trees per hectare) increased by about 19% compared to the unthinned plot for the first 5 years after thinning. In the Q. glauca forests, the MAI of the unthinned plot (1213 trees per hectare) was 0.66, and the MAI of heavily thinned treatments (663 trees per hectare) was 1.09, which was increased compared to the unthinned plot.
Net increases in C, i.e., net primary production (NPP; Mg·C·ha−1·year−1), increased significantly in LT (4.09) and HT (4.15) compared to the Con (3.30; p < 0.05; Table 2). Following the LT, NPP increased by about 24.1% compared to the Con; following the HT, NPP increased by about 26% compared to the Con. This is judged to be due to the increases in the MAI of DBH in proportion to the thinning intensity. As NPP increased, in 2018, the difference in C storage between the Con and thinned plots decreased by about 46% compared to 2000. If this situation continues, it can be predicted that in 2023, five years after the second thinning, there will be no significant difference in aboveground C storage regardless of thinning intensity. In a previous study analyzing the tree growth characteristics in variably thinned Korean white pine plantations, it was reported that the higher the thinning intensity, the lower the total stand volume but the greater the individual timber volume growth [41]. In addition, in a meta-analysis on the effect of forest thinning on C stocks in Korea, C storage of trees showed a negative correlation with thinning intensity but a positive correlation with recovery time [10]. Therefore, thinning reduces the C storage of trees by reducing the number of trees in the short term but ultimately maintains the C absorption of trees by promoting diameter growth in the long term [42].
3.1.2. Forest Floor and Soil C Storage
The mean FFCS (Mg·C·ha−1) was 7.86 ± 0.66 in the Con, 6.26 ± 0.01 in the LT, and 3.83 ± 0.32 in the HT treatments (Table 3). The LT and HT treatments decreased FFCS significantly compared to the Con (p < 0.01): the LT by about 20.3% and the HT by about 51.3%. Decreases in the dry weight of the forest floor components resulting from the thinning appear to be the reason for this. In a study that analyzed the influence of thinning on carbon storage in a Japanese larch, it was reported that FFCS decreased by 15%~22% in thinned treatments compared to the unthinned plots [43]. The decrease in dry weight in the thinned plots is thought to be caused by reduced litterfall production from fewer trees [44] and the mixing of organic matter into the soil by logging machinery and soil animals [12]. In addition, it seems likely that the promotion of the decomposition of organic matter in the thinned plots caused a significant decrease in the FFCS [45,46,47].
Table 3.
Forest floor and soil C storage (Mg·C·ha−1) in Con, LT, and HT treatments in a Chamaecyparis obtusa (Siebold and Zucc.) Endl. forest.
The average SCS (Mg·C·ha−1) at the 0–30 cm depth for each plot was 93.9 in the Con, 90.3 in the LT, and 86.5 in the HT treatments (Table 3). There was no significant difference among treatments. In the LT plots, it was reduced by about 3.9% compared to Con, and in the HT, by about 8%. A meta-analysis of harvest effects on SCS in temperate forests reported that thinning reduced SCS in Inceptisols and Ultisols, but not Alfisols or Spodosols [48]. In addition, a study of thinning intensity’s effects on SCS in a Pinus densiflora forest reported higher values in the thinned plots than in the unthinned plots because of the differences in soil C concentrations [25]. Therefore, SCS may not show consistent, significant changes following thinning because of variations depending on the tree species, parent rock, and topographical conditions [10,49].
3.2. Changes in C Shift by C Pool Resulting from Different Thinning Intensities in Cypress Forests
3.2.1. Litterfall
The annual litterfall production (Mg·ha−1·year−1) of each plot was 8.49 ± 0.33 in the Con, 4.70 ± 0.36 in the LT, and 4.45 ± 0.35 in the HT treatments (Figure 1a). In the LT and HT treatments, it decreased significantly compared to the Con (p < 0.001): in the LT, by about 44.6%, and in the HT, by about 47.5%. This is consistent with the results of a study that analyzed the effect of thinning on C. obtusa forests in two different regions, finding that annual leaf-litter input was significantly lower in the thinned than in the unthinned plots [38]. In addition, a meta-analysis of the effects of thinning based on global research results found that litterfall production in thinned plots decreases significantly compared to that in the unthinned plots [15]. Litterfall production is known to be proportional to basal area [50,51]. Due to forest management practices such as thinning, the stand density decreases, and litterfall production appears to decrease as well. In addition, litterfall production decreased because the lifespan of leaves and branches increased due to the increased distance between trees following thinning. The annual amount of C (Mg·C·ha−1·year−1) entering the forest floor C pool through litterfall decreased significantly with thinning, to 4.06 in the Con, 2.17 in the LT, and 2.11 in the HT treatments (p < 0.001).
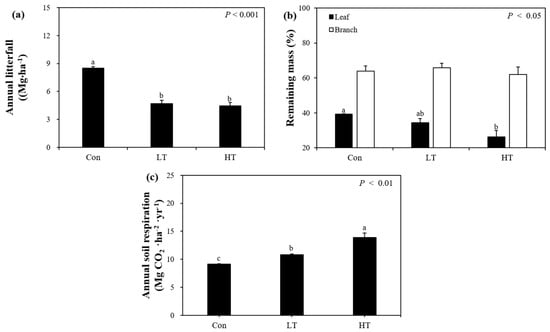
Figure 1.
The annual litterfall (Mg·ha−1) (a), the remaining mass of leaf and branch litter (%) following 648 days of decomposition (b), and the annual soil respiration (Mg CO2·ha−1·year−1) (c) of the Con, LT, and HT treatments in a Chamaecyparis obtusa (Siebold and Zucc.) Endl. forest. Vertical error bars indicate standard error, and different letters indicate significant differences among the three thinning intensities.
3.2.2. Litter Decomposition
As for the remaining mass of leaves, leaf mass in the HT (21%) treatments was significantly lower than that of the Con (33%) after burial for 548 days, but there was no significant difference between the LT (29%) and the Con (p < 0.05; Figure 1b). Thinning can promote soil microbial activity by disturbing the soil, increasing the amount of light in the forest, and raising the soil temperature [16,52,53]. With the significantly increased light in the thinned plots, the change in soil microbial activity led to the difference in the decomposition rate of leaves in each plot. In a study that analyzed the effect of thinning in P. densiflora forests, the decomposition rate increased in the thinned plots, and soil temperature was the main cause [54]. Increased organic matter decomposition will be a stepping stone to promote the growth of residual trees by improving soil fertility. The remaining mass of branches was 64% in the Con, 66% in the LT, and 62% in the HT after 548 days, showing no significant differences among treatments. Branches have a relatively long nutrient retention time due to a slower decomposition rate than leaves [55] because of their high lignin content [56]. In this study, the half-life of leaves was less than 1 year in all plots, whereas the half-life of branches was more than 2 years.
3.2.3. Soil Respiration
From February 2019 to December 2020, annual soil respiration (Mg CO2·ha−1·year−1) was 9.15 ± 0.10 in the Con, 10.86 ± 0.09 in the LT, and 13.88 ± 0.82 in the HT treatments, and as thinning intensity increased, the annual soil respiration also increased significantly (p < 0.01; Figure 1c). In the LT, it increased by about 18.7% compared to the Con, and in the HT, by about 51.8%. Changes in soil respiration are determined by various factors such as changes in soil temperature, climate variability, and changes in the decomposition rates of leaves, branches, and dead roots. Thinning can increase soil temperature variability because it reduces canopy densities and increases the area exposed to direct sunlight [57]. In addition, an increase in soil temperature and solar radiation promotes the growth of understory vegetation and promotes microbial enzyme activity to promote decomposition and soil microbial respiration [15,58]. In this study, soil disturbance by thinning, harvested residual materials returned to forests, and increased soil microbial activity due to increased availability of dead roots are considered to be the causes of the observed increased soil respiration [59]. In addition, understory vegetation can make substantial contributions to soil respiration [60]. In this study site, the UVB of HT (0.43 ± 0.02 Mg·ha−1) was significantly higher than those of Con (0.02 ± 0.002 Mg·ha−1) and LT (0.06 ± 0.01 Mg·ha−1) (Table 1). As a result of thinning effect on UVB, soil respiration increased by accelerating the decomposition of the forest floor. A meta-analysis of the effects of thinning intensity on soil C and C dynamics reported that thinning generally increased soil respiration, especially in the early stages after thinning [15]. The present study is consistent with the mentioned study’s finding because soil respiration was measured one to two years after the second thinning in 2018. Converting annual soil respiration to annual C emissions (Mg·C·ha−1·year−1) showed releases of 2.49 in the Con, 2.96 in the LT, and 3.79 in the HT treatments. Therefore, the amounts of organic C released through root respiration and microbial respiration (Mg·C·ha−1·year−1) were estimated to be 1.15 and 1.35 in the Con, 1.36 and 1.60 in the LT, and 1.74 and 2.04 in the HT treatments, respectively.
3.3. C cycle by Thinning Intensity of Cypress Forest
Total C storage (the sum of the C storage of trees, FF, and soil) decreased significantly as thinning intensity increased (p < 0.01; Figure 2). Total C storage of the LT treatments decreased by about 7.4% compared to the Con, and that of the HT treatments decreased by about 13.9% compared to the Con. Of the total C storage, C storage in trees accounted for about 63.1%, FFCS for about 2.3%, and SCS for about 34.6%. In all treatments, it was found that trees stored the most C. This is consistent with previous studies, which also found that total C storage in unthinned plots was higher than that in thinned plots (about 13%, a 19% decrease compared to unthinned plots) and that trees accounted for the highest proportion of C storage [61].
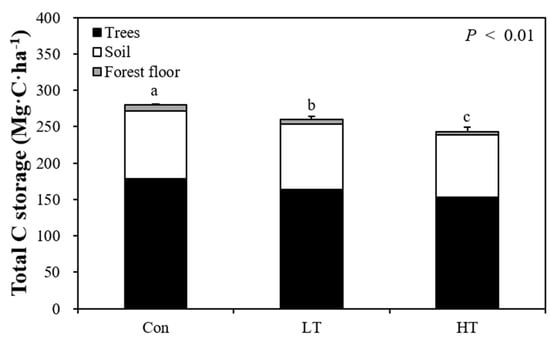
Figure 2.
Total carbon storage of trees, soil, and the forest floor of Con, LT, and HT treatments in a Chamaecyparis obtusa (Siebold and Zucc.) Endl. forest. Different letters indicate significant differences among the three thinning intensities (p < 0.01).
As the thinning intensity increased, the amount of light increased and the growth environment of trees was improved, promoting the DBH growth of trees. The NPP thus increased as the thinning intensity increased, as it was more affected by the promotion of DBH growth than the decrease in stand density. The increase in the amount of light and the increase in microbial activity caused by the increase in thinning intensity raised the soil respiration rate and the amount of CO2 released from the soil to the atmosphere. In this study, NEP (Mg·C·ha−1·year−1), estimated by the difference between annual C storage of trees and microbial respiration, increased in the thinned plots compared to the unthinned plots (1.95), but the HT (2.11) decreased C absorption compared to the LT (2.49; Figure 3). Therefore, appropriate thinning enhances the net C sequestration of the C. obtusa forest ecosystem, but excessive thinning of 50% or more impairs the C sequestration capacity. This suggests that a 30% thinning is an appropriate thinning intensity to minimize the decrease in C storage in C. obtusa forests and to improve the C absorption capacity. In addition, although the C storage of a forest decreases immediately after thinning, the net C absorption of thinned plots increases compared to that of unthinned plot, and it can be said that the C absorption capacity is maintained in the long term.
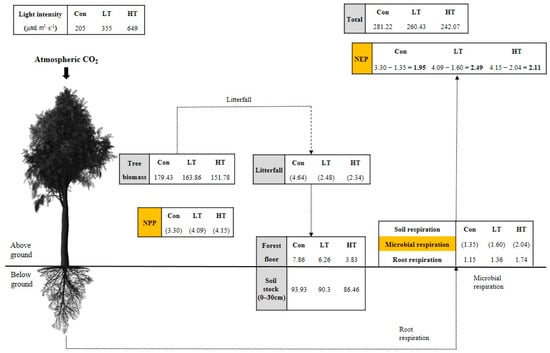
Figure 3.
Compartment model showing the distribution and flow of carbon of the Chamaecyparis obtusa (Siebold and Zucc.) Endl. forest in the study area. Boxes represent carbon stock (Mg·C·ha−1), arrows represent fluxes (Mg·C·ha−1·year−1), and parentheses indicate NPP (Mg·C·ha−1·year−1).
4. Conclusions
This study was conducted to investigate the effects of changes in stand density on the C cycle in C. obtusa forests. For this reason, we observed the changes in C storages and C cycle after thinning in a C. obtusa forest. As the thinning intensity increased, the stand density decreased, and as a result, the total C storage decreased. However, thinning alleviated between-tree competition, increasing the DBH growth and annual C storage of trees. On the other hand, the decrease in the number of trees decreased litterfall production. In addition, as the soil was disturbed by thinning and soil microbial activity increased, the rate of leaf decomposition and soil respiration increased. By estimating the difference between the annual C storage of trees and the annual C emissions through microbial respiration, this study showed that the net C uptake increased with the 30% thinning compared to the unthinned control and the 50% thinning. These results can be used as appropriate basic data for establishing the appropriate thinning intensity of C. obtusa forests and estimating changes in forest C storage in the future. Periodic observation is required because the factors affecting forest ecosystem changes are complex and diverse. To more accurately analyze the storage and movement of forest C, long-term, repetitive measurements of changes in soil as well as in trees should be performed.
Author Contributions
Conceptualization, H.-J.K.; methodology and investigation, H.-J.K., D.-H.L. and J.-G.L.; writing—original draft preparation, H.-J.K., S.-G.L., S.H.H., S.K., J.-Y.J., D.-H.L. and J.-G.L.; writing—review and editing, J.-G.L.; supervision, H.-J.K.; project administration, H.-J.K.; funding acquisition, H.-J.K. All authors have read and agreed to the published version of the manuscript.
Funding
This study was supported by the National Research Foundation of Korea (NRF-2018RIDIAIB07042483), the Korea Forest Service Research Project (2022464B10-2224-0201), and the National Institute of Forest Science (Grant No. SC0500-2020-01).
Institutional Review Board Statement
Not applicable.
Informed Consent Statement
Not applicable.
Data Availability Statement
Not applicable.
Conflicts of Interest
The authors declare no conflict of interest.
References
- Tans, P.P.; Fung, I.Y.; Takahashi, T. Observational contrains on the global atmospheric CO2 budget. Science 1990, 247, 1431–1438. [Google Scholar] [CrossRef] [PubMed]
- Pan, Y.; Birdsey, R.A.; Fang, J.; Houghton, R.; Kauppi, P.E.; Kurz, W.A.; Phillips, O.L.; Shvidenko, A.; Lewis, S.L.; Candell, J.G.; et al. A large and persistent carbon sink in the world’s forests. Science 2011, 333, 988–993. [Google Scholar] [CrossRef] [PubMed]
- Sullivan, B.W.; Kolb, T.E.; Hart, S.C.; Kaye, J.P.; Dore, S.; Montes-Helu, M. Thinning reduces soil carbon dioxide but not methane flux from southwestern USA ponderosa pine forests. For. Ecol. Manag. 2008, 255, 4047–4055. [Google Scholar] [CrossRef]
- Dixon, R.K.; Solomon, A.M.; Brown, S.; Houghton, R.A.; Trexier, M.C.; Wisniewski, J. Carbon pools and flux of global forest ecosystems. Science 1994, 263, 185–190. [Google Scholar] [CrossRef] [PubMed]
- Intergovernmental Panel on Climate Change (IPCC). Good Practice Guidance for Land Use, Land-Use Change and Forestry; IPCC: Hayama, Japan, 2003; ISBN 4887880030. [Google Scholar]
- Poeplau, C.; Don, A.; Vesterdal, L.; Leifeld, J.; Van Wesemael, B.A.S.; Schumacher, J.; Gensior, A. Temporal dynamics of soil organic carbon after land-use change in the temperate zone–carbon response functions as a model approach. Glob. Chang. Biol. 2011, 17, 2415–2427. [Google Scholar] [CrossRef]
- North, M.; Hurteau, M.; Innes, J. Fire suppression and fuels treatment effects on mixed-conifer carbon stocks and emissions. Ecol. Appl. 2009, 19, 1385–1396. [Google Scholar] [CrossRef] [PubMed]
- Burton, L.D. Introduction to Forestry Science; Cengage Learning: Boston, MA, USA, 2012; ISBN 9781133711629. [Google Scholar]
- Nishizono, T. Effects of thinning level and site productivity on age-related changes in stand volume growth can be explained by a single rescaled growth curve. For. Ecol. Manag. 2010, 259, 2276–2291. [Google Scholar] [CrossRef]
- Lee, J.; Han, S.H.; Kim, S.; Lee, S.; Son, Y.M.; Son, Y. A meta-analysis on the effect of forest thinning on diameter growth and carbon stocks in Korea. J. Korean Soc. For. Sci. 2015, 104, 527–535. [Google Scholar] [CrossRef]
- Nilsen, P.; Strand, L.T. Thinning intensity effects on carbon and nitrogen stores and fluxes in a Norway spruce (Picea abies (L.) Karst.) stand after 33 years. For. Ecol. Manag. 2008, 256, 201–208. [Google Scholar] [CrossRef]
- Jonard, M.; Misson, L.; Ponette, Q. Long-term thinning effects on the forest floor and the foliar nutrient status of Norway spruce stands in the Belgian Ardennes. Can. J. For. Res. 2006, 36, 2684–2695. [Google Scholar] [CrossRef]
- Prescott, C.E. Effects of clearcutting and alternative silvicultural systems on rates of decomposition and nitrogen mineralization in a coastal montane coniferous forest. For. Ecol. Manag. 1097, 95, 253–260. [Google Scholar] [CrossRef]
- Noormets, A.; Epron, D.; Domec, J.C.; McNulty, S.G.; Fox, T.; Sun, G.; King, J.S. Effects of forest management on productivity and carbon sequestration: A review and hypothesis. For. Ecol. Manag. 2015, 355, 124–140. [Google Scholar] [CrossRef]
- Zhang, X.; Guan, D.; Li, W.; Sun, D.; Jin, C.; Yuan, F.; Wang, A.; Wu, J. The effects of forest thinning on soil carbon stocks and dynamics: A meta-analysis. For. Ecol. Manag. 2018, 429, 36–43. [Google Scholar] [CrossRef]
- Kim, S.; Kim, C.; Han, S.H.; Lee, S.T.; Son, Y. A multi-site approach toward assessing the effect of thinning on soil carbon contents across temperate pine, oak, and larch forests. For. Ecol. Manag. 2018, 424, 62–70. [Google Scholar] [CrossRef]
- Korea Forest Service. Statistical Yearbook of Forestry; Korea Forest Service: Daejeon, Korean, 2020; pp. 236–237. (In Korean)
- Korea Forest Service. Detailed Implementation Plan for Major Tasks in 2022; Korea Forest Service: Daejeon, Korean, 2022; p. 177. (In Korean)
- Kim, C.; Son, Y.; Lee, W.K.; Jeong, J.; Noh, N.J. Influences of forest tending works on carbon distribution and cycling in a Pinus densiflora S. et Z. stand in Korea. For. Ecol. Manag. 2009, 257, 1420–1426. [Google Scholar] [CrossRef]
- Kim, J.H.; Lee, S.O.; Do, K.B.; Ji, W.D.; Kim, S.G.; Back, Y.D.; Kim, K.J. Analysis of the component and immunological efficacy of Chamaecyparis obtusa leaf extract. Korean J. Clin. Lab. Sci. 2018, 50, 37–43. [Google Scholar] [CrossRef]
- Park, S.G.; Kang, H.M. Characteristics of vegetation structure in Chamaecyparis obtusa stands. Korean J. Environ. Ecol. 2015, 29, 907–916. [Google Scholar] [CrossRef]
- Kim, C.; Baek, G.; Choi, B.; Ha, J.; Bae, E.J.; Lee, K.S.; Son, Y.M. Carbon stocks of tree, forest floor, and mineral soil in Cryptomeria japonica and Chamaecyparis obtusa stands. J. Korean Soc. For. Sci. 2020, 109, 169–178. [Google Scholar]
- Park, S.G.; You, H.C.; Oh, C.J.; Choi, W.K. Analysis of the correlation between site environmental factors and tree ring growth in Chamaecyparis obtusa stands in Jeonnam Province. Korean J. Environ. Ecol. 2015, 29, 777–784. [Google Scholar] [CrossRef]
- Park, J.H.; Son, Y.M.; Lee, K.S.; Park, E.J.; Jung, S.Y. The Adequacy Assessment and Growth Effects by Methods of 1st Thinning in Chamaecyparis obtusa Forest. J. Korean Soc. For. Sci. 2019, 108, 349–356. [Google Scholar]
- Ko, S.; Yoon, T.K.; Kim, S.; Kim, C.; Lee, S.T.; Seo, K.W.; Son, Y. Thinning intensity effects on carbon storage of soil, forest floor and coarse woody debris in Pinus densiflora stands. J. Korean Soc. For. Sci. 2014, 103, 30–36. [Google Scholar] [CrossRef]
- Song, S.-J.; Jang, K.-S.; Hwang, I.-C.; An, K.-W.; Lee, K.-H. Effects of Tree Density Control on Carbon Dynamics in Young Pinus densiflora stands. J. Korean For. Soc. 2016, 105, 275–283. [Google Scholar]
- Korea Soil Information System. Soil Classification Map. Available online: www.soil.rda.go.kr (accessed on 17 October 2022). (In Korean)
- Korea Meteorological Association (KMA). Climatological Normals of Korea. Available online: www.kma.go.kr (accessed on 29 September 2022). (In Korean)
- Korea Forest Research Institute (KFRI). Carbon Emission Factors and Biomass Allometric Equations by Species in Korea; KFRI: Seoul, Korea, 2014; pp. 58–59. (In Korean) [Google Scholar]
- Korea Forest Research Institute. Main Tree Species Carbon Emission Factors for Forest Greenhouse Inventory; KFRI: Seoul, Korea, 2010; p. 89. (In Korean) [Google Scholar]
- Wider, R.K.; Lang, G.E. A critique of the analytical methods used in examining decomposition data obtained from litter bags. Ecology 1982, 63, 1636–1642. [Google Scholar] [CrossRef]
- Kim, H.J.; Han, S.H.; Kim, S.; Chang, H.; Son, Y. Effects of Artificial CO2 Release in Soil on Chlorophyll Content and Growth of Pinus densiflora and Quercus variabilis Seedlings. J. Korean Soc. For. Sci. 2018, 107, 351–360. [Google Scholar]
- Hanson, P.J.; Edwards, N.T.; Garten, C.T.; Andrews, J.A. Separating root and soil microbial contributions to soil respiration: A review of methods and observations. Biogeochemistry 2000, 48, 115–146. [Google Scholar] [CrossRef]
- Koo, J.W.; Son, Y.; Kim, R.H.; Kim, J. A study on methods of separating soil respiration by source. Korean J. Agric. For. Meteorol. 2005, 7, 28–34. [Google Scholar]
- Lee, M.S.; Nakane, K.; Nakatsubo, T.; Koizumi, H. Seasonal Changes in the Contribution of Root Respiration to Total Soil Respiration in a Cool-Temperate Deciduous Forest. In Roots: The Dynamic Interface between Plants and the Earth; Abe, J., Ed.; Springer: Dordrecht, The Netherlands, 2003; pp. 311–318. ISBN 9789401729239. [Google Scholar]
- Lee, S.T.; Son, Y.M.; Lee, K.J.; Hwang, J.; Choi, J.C.; Shin, H.C.; Park, N.C. Aboveground Carbon Storage of Quercus acuta Stands by Thinning Intensity. Korean J. Agric. For. Meteorol. 2005, 7, 282–288. [Google Scholar]
- Hwang, J.H.; Bae, S.W.; Lee, K.J.; Lee, K.S.; Kim, H.S. Short-term Effect of Thinning on Aboveground Carbon Storage in Korean Pine (Pinus koraiensis) Plantation. J. Korean Soc. For. Sci. 2008, 97, 605–610. [Google Scholar]
- Hou, L.; Li, Z.; Luo, C.; Bai, L.; Dong, N. Optimization forest thinning measures for carbon budget in a mixed pine-oak stand of the Qingling Mountains, China: A Case study. Forests 2016, 7, 272. [Google Scholar] [CrossRef]
- Choi, J.K.; Lee, B.K.; Lee, D.S.; Choi, I.H. Growth Monitoring of Korean White Pine (Pinus koraiensis) Plantation by Thinning Intensity. J. Korean For. Soc. 2014, 103, 422–430. [Google Scholar] [CrossRef]
- Yoon, J.H.; Bae, E.J.; Son, Y.M.; Jeon, H.G.; Lee, K.S.; Jung, S.Y. Increment Change Monitoring of DBH and Stand Volume Based on Thinning Treatments in Quercus glauca Stands. J. Agric. Life Sci. 2021, 55, 71–75. [Google Scholar] [CrossRef]
- Lee, D.; Jung, S.; Choi, J. Analysis of Tree Growth Characteristics by First and Second Thinning in Korean White Pine Plantations. J. Korean Soc. For. Sci. 2022, 111, 150–164. [Google Scholar] [CrossRef]
- Zhou, D.; Zhao, S.Q.; Liu, S.; Oeding, J. A meta-analysis on the impacts of partial cutting on forest structure and carbon storage. Biogeosciences 2013, 10, 3691–3703. [Google Scholar] [CrossRef]
- Lee, S.K.; Son, Y.; Lee, W.K.; Yang, A.R.; Noh, N.J.; Byun, J.G. Influence of thinning on carbon storage in a Japanese larch (Larix kaempferi) plantation in Yangpyeong, central Korea. For. Sci. Technol. 2010, 6, 35–40. [Google Scholar] [CrossRef]
- Inagaki, Y.; Kuramoto, S.; Torii, A.; Shinomiya, Y.; Fukata, H. Effects of thinning on leaf-fall and leaf-litter nitrogen concentration in hinoki cypress (Chamaecyparis obtusa Endlicher) plantation stands in Japan. For. Ecol. Manag. 2008, 255, 1859–1867. [Google Scholar] [CrossRef]
- Achat, D.L.; Fortin, M.; Landmann, G.; Ringeval, B.; Augusto, L. Forest soil carbon is threatened by intensive biomass harvesting. Sci. Rep. 2015, 5, 15991. [Google Scholar] [CrossRef] [PubMed]
- Slodicak, M.; Novak, J.; Skovsgaard, J.P. Wood production, litter fall and humus accumulation in a Czech thinning experiment in Norway spruce (Picea abies (L.) Karst.). For. Ecol. Manag. 2005, 209, 157–166. [Google Scholar] [CrossRef]
- Novák, J.; Slodičák, M.; Dušek, D.; Kacálek, D. Norway spruce litterfall and forest floor in the IUFRO thinning experiment CZ 13-Vítkov. J. For. Sci. 2013, 59, 107–116. [Google Scholar] [CrossRef]
- Nave, L.E.; Vance, E.D.; Swanston, C.W.; Curtis, P.S. Harvest impacts on soil carbon storage in temperate forests. For. Ecol. Manag. 2010, 259, 857–866. [Google Scholar] [CrossRef]
- Korea Forest Research Institute. The 5th National Forest Inventory Report; Korea Forest Research Institute: Seoul, Korea, 2011; p. 87. (In Korean) [Google Scholar]
- Hennessey, T.C.; Dougherty, P.M.; Cregg, B.M.; Wittwer, R.F. Annual variation in needle fall of a loblolly pine stand in relation to climate and stand density. For. Ecol. Manag. 1992, 51, 329–338. [Google Scholar] [CrossRef]
- Berg, B.; Meentemeyer, V. Litter fall in some European coniferous forests as dependent on climate: A synthesis. Can. J. For. Res. 2001, 31, 292–301. [Google Scholar] [CrossRef]
- Trettin, C.C.; Jurgensen, M.F.; Gale, M.R.; McLaughlin, J.W. Soil Carbon in Northern Forested Wetlands: Impacts of Silvicultural Practices. In Carbon Forms and Functions in Forest Soils; McFee, W.W., Kelly, J.M., Eds.; 1995; pp. 437–461. ISBN 9780891188186. [Google Scholar]
- Kunhamu, T.K.; Kumar, B.M.; Viswanath, S. Does thinning affect litterfall, litter decomposition, and associated nutrient release in Acacia mangium stands of Kerala in peninsular India? Can. J. For. Res. 2009, 39, 792–801. [Google Scholar] [CrossRef]
- Lim, H.; Choi, W.J.; Ahn, K.; Lee, K.H. Ecosystem respiration and tree growth influenced by thinning in a red pine forest in southern Korea. For. Sci. Technol. 2012, 8, 192–204. [Google Scholar] [CrossRef]
- Bray, J.R.; Gorham, E. Litter production in forests of the world. In Advances in Ecological Research; Cragg, J.B., Ed.; Academic Press: Cambridge, MA, USA, 1964; Volume 2, pp. 101–157. ISBN 9780120139026. [Google Scholar]
- Melillo, J.M.; Aber, J.D.; Muratore, J.F. Nitrogen and lignin control of hardwood leaf litter decomposition dynamics. Ecology 1982, 63, 621–626. [Google Scholar] [CrossRef]
- Tang, J.; Qi, Y.; Xu, M.; Misson, L.; Goldstein, A.H. Forest thinning and soil respiration in a ponderosa pine plantation in the Sierra Nevada. Tree Physiol. 2005, 25, 57–66. [Google Scholar] [CrossRef]
- Steele, S.J.; Gower, S.T.; Vogel, J.G.; Norman, J.M. Root mass, net primary production and turnover in aspen, jack pine and black spruce forests in Saskatchewan and Manitoba, Canada. Tree Physiol. 1997, 17, 577–587. [Google Scholar] [CrossRef]
- Cheng, X.; Han, H.; Kang, F.; Liu, K.; Song, Y.; Zhou, B.; Li, Y. Short-term effects of thinning on soil respiration in a pine (Pinus tabulaeformis) plantation. Biol. Fertil. Soils 2014, 50, 357–367. [Google Scholar] [CrossRef]
- Wu, J.; Liu, Z.; Chen, D.; Huang, G.; Zhou, L.; Fu, S. Understory plants can make substantial contributions to soil respiration: Evidence from two subtropical plantations. Soil Biol. Biochem. 2011, 43, 2355–2357. [Google Scholar] [CrossRef]
- Ruiz-Peinado, R.; Bravo-Oviedo, A.; Montero, G.; Del Río, M. Carbon stocks in a Scots pine afforestation under different thinning intensities management. Mitig. Adapt. Strateg. Glob. Chang. 2016, 21, 1059–1072. [Google Scholar] [CrossRef]
Disclaimer/Publisher’s Note: The statements, opinions and data contained in all publications are solely those of the individual author(s) and contributor(s) and not of MDPI and/or the editor(s). MDPI and/or the editor(s) disclaim responsibility for any injury to people or property resulting from any ideas, methods, instructions or products referred to in the content. |
© 2023 by the authors. Licensee MDPI, Basel, Switzerland. This article is an open access article distributed under the terms and conditions of the Creative Commons Attribution (CC BY) license (https://creativecommons.org/licenses/by/4.0/).