Article

Predicting the Stand Growth and Yield of Mixed Chinese Fir Forests Based on Their Site Quality, Stand Density, and Species Composition

1
College of Forestry, Fujian Agriculture and Forestry University, Fuzhou 350002, China
2
Forest Seed and Seedling General Station of Fujian Province, Fuzhou 350003, China
3
College of Ecology and Resource Engineering, Wuyi University, Wuyishan 354300, China
4
Fujian Funong Agricultural Materials Group Co., Ltd., Fuzhou 350001, China
5
Fujian Funong Crop Sciences Co., Ltd., Fuzhou 350015, China
*
Author to whom correspondence should be addressed.
Forests 2023, 14(12), 2315; https://doi.org/10.3390/f14122315
Submission received: 21 October 2023 / Revised: 13 November 2023 / Accepted: 21 November 2023 / Published: 25 November 2023
(This article belongs to the Section Forest Inventory, Modeling and Remote Sensing)

Abstract

:
The Chinese fir (Cunninghamia lanceolata) is the largest tree species used for afforestation in China. The purpose of this study was to explore the effects of site quality, stand density, and tree species composition on the growth and yield of mixed Chinese fir forests and to build prediction models for their stand average DBH (diameter at breast height), average height, and volume. Using 430 plots of mixed Chinese fir forests in the Fujian Province of China, the optimal base models for predicting stand average DBH, average height, and volume were selected from the Schumacher, Korf, Logistic, Mitscherlich, and Richards equations. On this basis, the site class index (SCI), stand density index (SDI), and tree species composition coefficient (TSCC) were introduced to improve the model’s performance, and the applicability of the different models was evaluated. The optimal base models for the average DBH, average height, and stand volume of mixed Chinese fir forests all used the Richards equation. The best fitting effect was obtained when the SCI was introduced into parameter a in the average height model, while the inclusion of the TSCC did not improve the model significantly. The fitting effects of the average DBH and stand volume models were both best in the form of y = a 1 S C I a 2 [ 1 exp ( b 1 S D I b 2 ) t ] c when the SCI and SDI were introduced. When the TSCC was further included, the fitting effects of the stand average DBH and volume models were significantly improved, with their R2 increased by 47.47% and 58.45%, respectively, compared to the base models. The optimal models developed in this study showed good applicability; the residuals were small and distributed uniformly. We found that the SCI had an impact on the maximum values of the stand average DBH, average height, and volume; the SDI was closely related to the growth rate of the diameter and volume, while the TSCC influenced the maximum values of the stand average DBH and volume. The model system established in this study can provide a reference for the harvest prediction and mixing ratio optimization of mixed Chinese fir forests.

1. Introduction

Chinese fir (
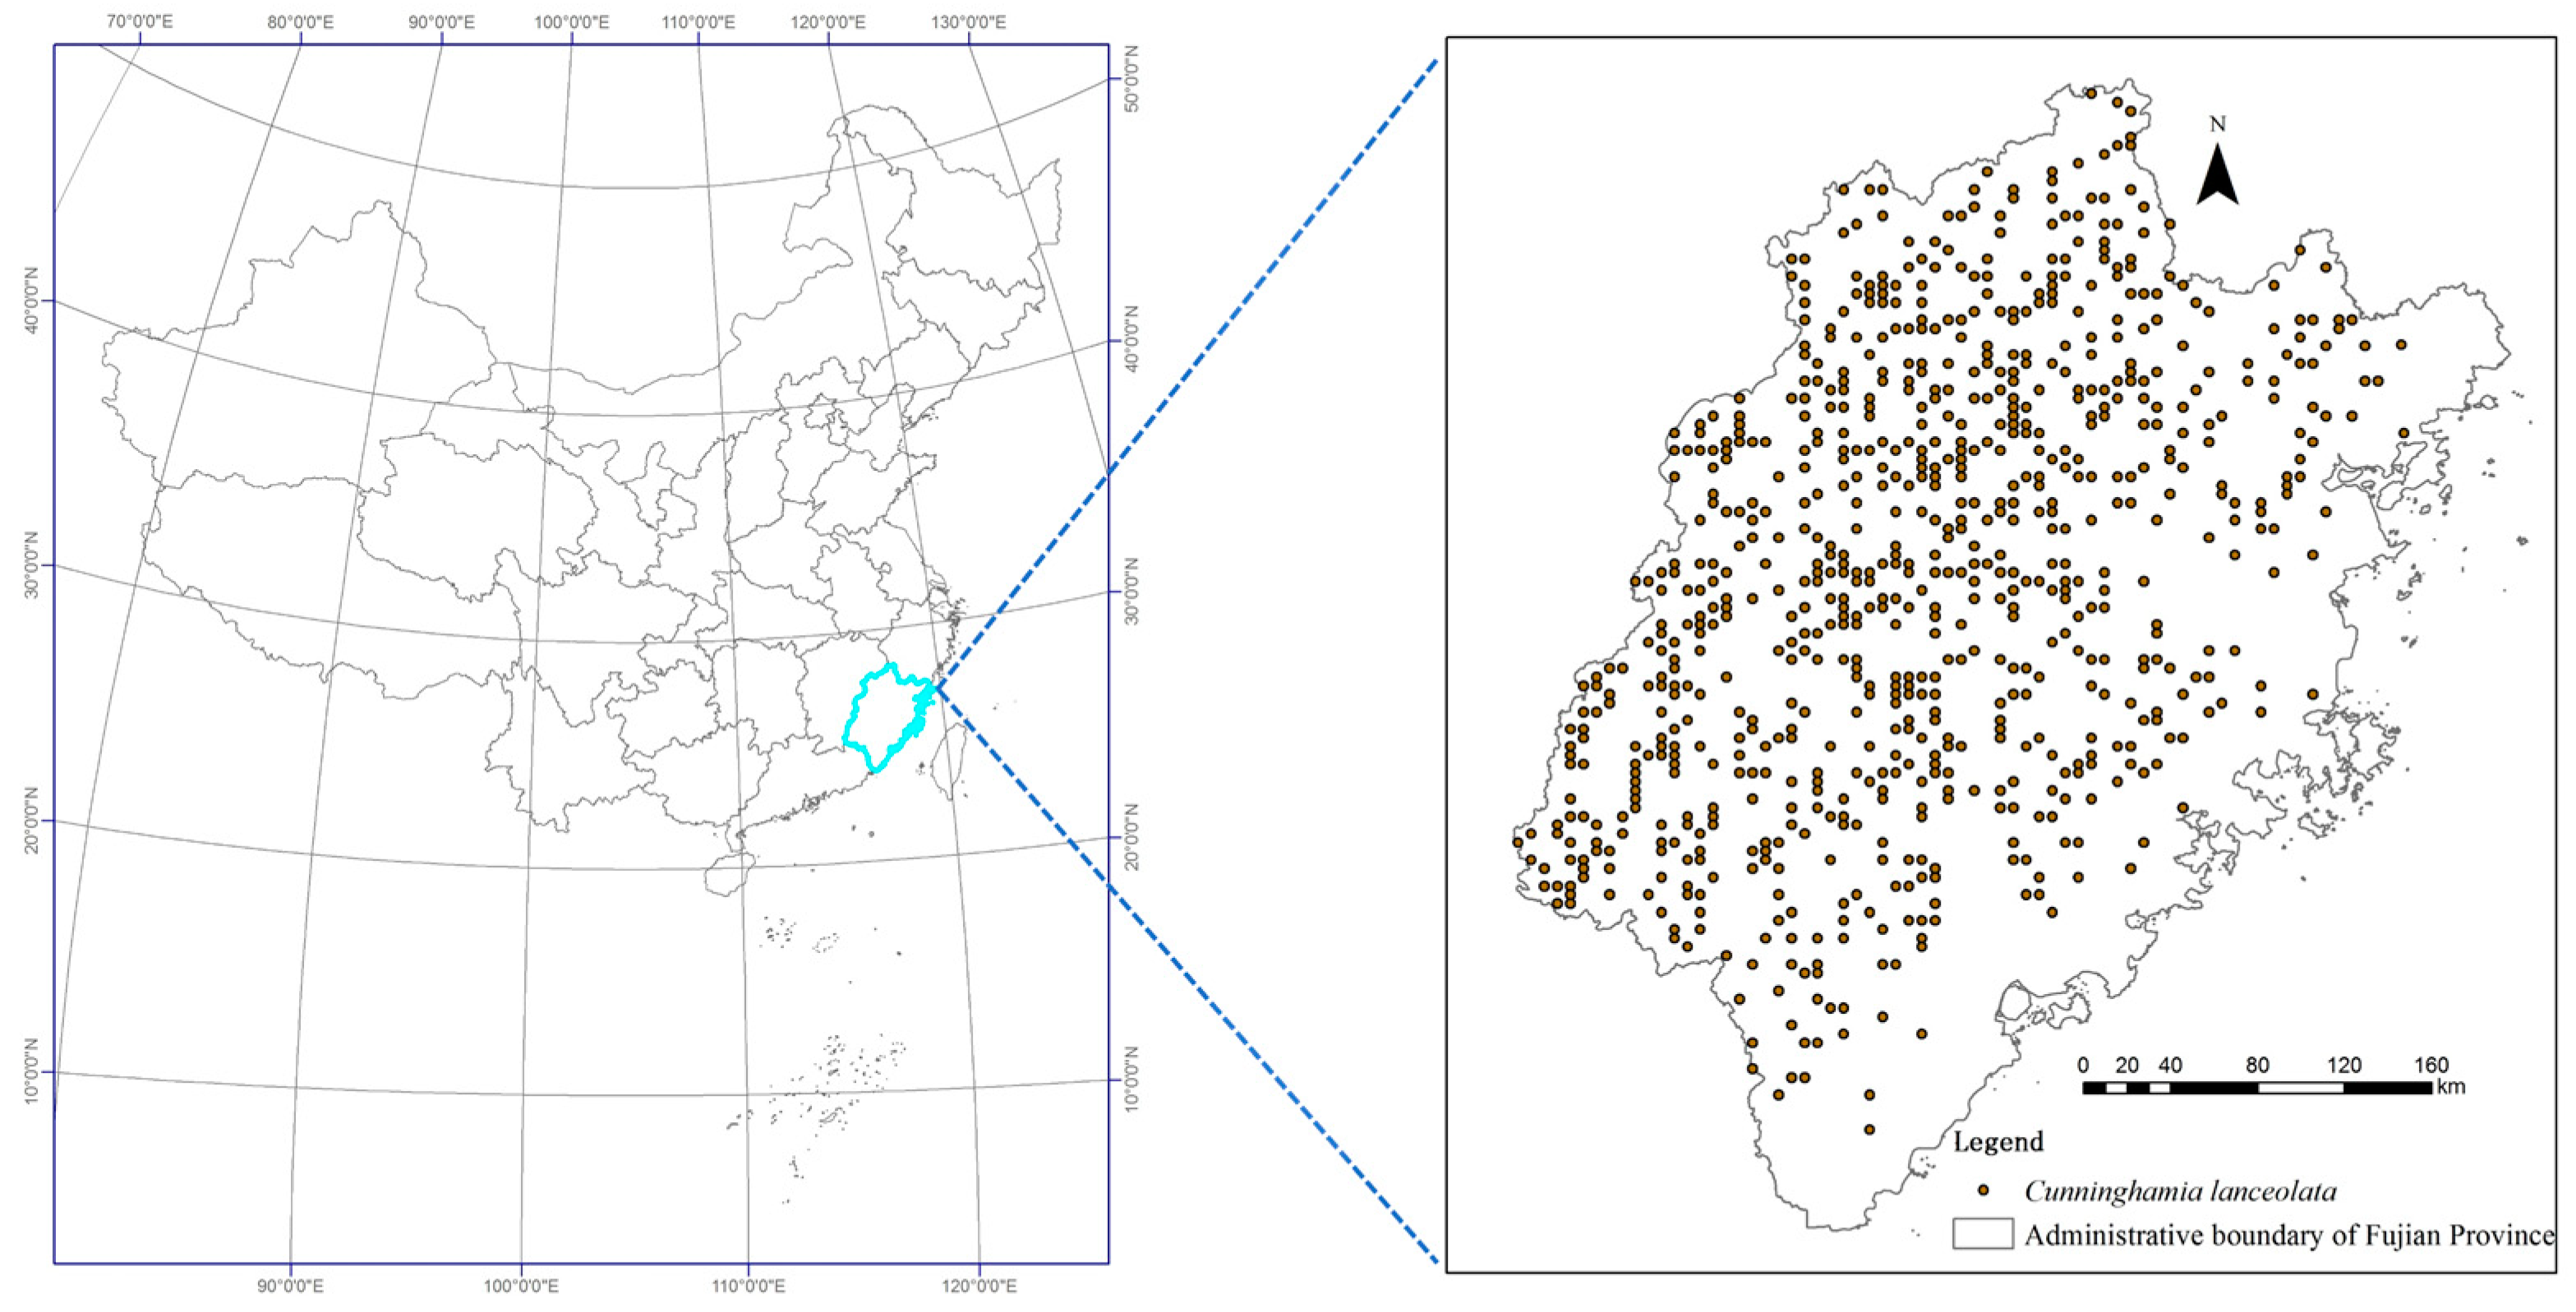
Cunninghamia lanceolata) is a fast-growing tree species unique to China, with a wide distribution area and high economic value [1,2,3]. According to the Ninth Chinese National Forest Resources Inventory [4], Chinese fir plantations have reached 9.9 million hectares, making them the most widespread plantation tree species in China. With the advantages of good texture and a high yield, the Chinese fir plays an important role in the country’s wood supply and economic development [5,6]. The wood of the Chinese fir is widely used in decoration, construction, shipbuilding, bridge construction, and other fields, and the root and bark of the Chinese fir have certain medicinal values. The growth period of the Chinese fir is quite short, but the economy around its cultivation is considerable. Therefore, Chinese fir plantations have long been a hot research topic among forestry researchers [1,2,3,5,6,7,8,9,10].
As the trend of forest management develops worldwide, the mixed forest performs the functions of enhancing forest stability, increasing species diversity, improving site quality, and enhancing protective benefits [11,12,13]. In particular, the conifer–broadleaf mixed forest has a higher productivity, ecological resilience, and resistance to pests and diseases [14,15,16]. Under traditional intensive management methods, the ecosystem structure of pure Chinese fir forests is quite simple, and problems of soil erosion and productivity decline have appeared repeatedly [15]. Constructing a mixed forest is an effective way to overcome the fertility decline in pure Chinese fir forests, as it can effectively enrich the tree species’ structure, improve nutrient cycling, and improve the forest’s ability to resist natural disasters.
Chinese fir can be mixed with coniferous species as well as broad-leaved species. The main conifer used for mixing with Chinese fir is Pinus massoniana, while the broad-leaved species used for mixing are diverse and include Schima superba, Castanopsis hystrix, Michelia macclurei, and Phoebe bournei. Research has shown that different mixed tree species and mixing ratios have different effects on the growth of Chinese fir [17,18]. Therefore, there is an urgent need for deeper exploration and research on the construction of mixed forests with Chinese fir, the selection of the mixed species and the mixing ratio, and the prediction of stand growth and yield.
The stand growth and yield models are important tools for forest management [19]. They describe the relationship between tree growth, the stand state, and site conditions in the form of one or a set of mathematical equations, enabling the prediction of stand growth and harvest yields [20]. Most stand-level growth and yield models are used for pure forests, using age to predict the average DBH (diameter at breast height), average height, and volume of the stand. Many studies have shown that stand height increases with the improvement in the site quality, while the average DBH and stocking volume are closely related to the site quality and stand density [21,22,23]. Generally, the average DBH and stand volume also increase with high site quality. A stand with a larger density had a smaller average DBH, while a stand with a lower density had a larger average DBH. The impact of stand density on volume occurred when, after reaching a certain density range, stand volume increased with the increase in stand density [24].
At present, many growth and yield models for pure Chinese fir forests have been developed, but there are few studies on mixed Chinese fir forests, and a prediction model combining site quality, stand density, and tree species composition is still lacking [25,26]. Therefore, the purpose of this study is to build growth and yield models for mixed Chinese fir forests, considering site quality, stand density, and tree species composition. The aim is to provide a reference for accurately predicting the yield, optimizing management plans, and evaluating the forest assets of mixed Chinese fir forests.

2. Materials and Methods

2.1. Study Area

The study area is located in the Fujian Province of southeast China (23°33′~28°20′ N, 115°50′~120°40′ E). Fujian Province has a subtropical climate with abundant rainfall and sufficient sunlight. The annual average temperature is 17–21 °C, and the average rainfall is 1400–2000 mm. The accumulated temperature of 10 °C or higher in 70% of Fujian Province reaches 5000–7600 °C. Fujian is the province with the highest forest coverage rate in China, with an area of 8.12 million hectares and a coverage rate of 66.8% [4]. The main tree species in Fujian Province include Cunninghamia lanceolata, Pinus massoniana, Phyllostachys edulis, Schima superba, Cinnamomum camphora, and so on.

2.2. Data

Data in this study were collected from the re-measured permanent plots in the National Forest Inventory (NFI) and the Forest Management and Planning Inventory (FMPI) of Fujian Province. The NFI plots were measured in 2008, 2013, and 2018, and the FMPI plots were measured in 2007 and 2017. All plots were distributed in mountainous areas and some coastal cities in Fujian Province, and each plot was square with an area of 0.067 ha. As a result, a total of 430 plots were generated. Figure 1 displays the locations of the sampling plots.
The tree species mixed with Chinese fir were mainly Pinus massoniana and broad-leaved species, including Schima superba, Phoebe bournei, Cinnamomum camphora, Liquidambar formosana, Quercus glauca, Acacia melanoxylon, Acacia concinnatai, and Castanopsis hystrix. After removing abnormal data using the threefold standard deviation method, 418 plots remained, of which two-thirds (278 plots) were randomly selected for model fitting and one-third (140 plots) was used for model validation. Table 1 displays the stand attribute statistics for both fit and validation data.

2.3. Methods

2.3.1. Base Model

Five common theoretical growth equations, namely, the Schumacher, Korf, Logistic, Mitscherlich, and Richards equations, were selected as the base models. The model forms are as follows:
Schumacher   ( M 1 ) :   y = a exp ( b / t )
Korf   ( M 2 ) :   y = a exp ( b t c )
Logistic   ( M 3 ) :   y = a / [ 1 + b exp ( c t ) ]
Mitscherlich   ( M 4 ) :   y = a [ 1 exp ( b t ) ]
Richards   ( M 5 ) :   y = a [ 1 exp ( b t ) ] c
where y represents the dependent variable of stand factors, including stand average DBH (D), average height (H), and volume (V); t represents stand age; and a, b, and c are model parameters.

2.3.2. Site Quality

In this study, the site class index (SCI) represented stand site quality, which is a quantitative indicator that evaluates forest site quality based on the average height of the dominant tree species at reference age. Compared to other site indicators, the high accessibility of the stand average height gives the SCI an advantage in modeling when using large-scale forest inventory data [27]. The SCI takes the prediction model of the stand average height as the guide curve and uses the change in stand age to describe the change in stand average height. The stand average height model was also selected from the five base models (Equations (1)–(5)).
When the SCI was introduced into the base models, their parameters were re-parameterized in exponential form. For example, parameters a, b, and c were set as a 1 S C I a 2 , b 1 S C I b 2 , and c 1 S C I c 2 , respectively.

2.3.3. Stand Density

The stand density index (SDI), which is calculated by converting the number of trees in a real stand to the number of trees per unit area when the stand has a standard average diameter (also known as comparison diameter), was used to describe stand density. The SDI can not only reflect the crowding degree of trees in the stand, but also has no close relationship with stand age and site conditions [28]. Therefore, the SDI is widely used in forest modeling and management practices [29].
The calculation of the SDI is as follows:
S D I = N ( D 0 / D ) b
where N is the number of trees per hectare; D0 is the standard average diameter, which is 20 cm in this study; D is the actual stand average diameter; and b is the slope of the maximum density line, which was calculated as −1.4913 in this study.
Similar to the SCI, the parameters of the base models were also re-parameterized in the exponential form of the SDI to include stand density in the models. For example, parameters a, b, and c were set as a 1 S D I a 2 , b 1 S D I b 2 , and c 1 S D I c 2 , respectively.

2.3.4. Tree Species Composition

The tree species composition coefficient (TSCC) was used to describe tree species composition in Chinese fir mixed forests. The TSCC was calculated as the proportion of the volume of each tree species to the total volume of the stand [30]. In this study, the tree species in Chinese fir mixed forests were divided into three species groups: Cunninghamia lanceolata, Pinus massoniana, and broad-leaved species. The value of the TSCC for each tree species ranges from 0 to 1, and the sum of the TSCC for all tree species in a stand is 1. We used L1, L2, and L3 to represent the TSCC of Cunninghamia lanceolata, Pinus massoniana, and broad-leaved species, respectively; thus, L1 + L2 + L3 = 1.
In this study, the TSCC was introduced into the models after the SCI and SDI were already considered, and the model parameters were re-parameterized in the linear form of the TSCC for all three species groups. For example, parameter a1 was set as (a11L1 + a12L2 + a13L3).

2.3.5. Model Evaluation Statistics

The root mean square error (RMSE), mean absolute relative error (MARE), and coefficient of determination (R2) were applied to evaluate the different models. The smaller the values of RMSE and MARE and the larger the value of R2, the better the fitting effect of the model. Meanwhile, the total relative error (TRE), mean relative error (MRE), MARE, and prediction accuracy (P) were used as evaluation criteria to test the applicability of the model. The formula of each index is as follows:
R M S E = ( i = 1 n ( X i X i ) 2 ) / n
M A R E = 1 n i = 1 n ( X i X i ) / X i × 100 %
R 2 = 1 i = 1 n ( X i X i ) 2 / i = 1 n ( X i X i ¯ ) 2
T R E = ( i = 1 n X i i = 1 n X i ) / i = 1 n X i × 100 %
M R E = 1 n i = 1 n ( ( X i X i ) / X i ) × 100 %
P = 1 t 0.05 i = 1 n ( X i X i ) 2 / ( X i ¯ n ( n k ) ) × 100 %
where Xi and X i are respectively the observed and estimated values of D, H, or M; X i ¯ and X i ¯ are respectively the average values of Xi and X i ; n is the number of plots, k is the number of parameters, and t0.05 represents the t distribution value at the confidence level α = 0.05.

3. Results

3.1. Selection of Base Model

The prediction models for stand average DBH (D), average height (H), and stand volume (V) were developed utilizing the five candidate base models (Equations (1)–(5)). The model parameters and evaluation statistics were calculated to select the optimal base model for each of the dependent variables. From Table 2, the Richards equation (M5) exhibited the highest R2 and the lowest RMSE and MARE for all the prediction models of Chinese fir mixed forests. The R2 values of the Richards equation for predicting D, H, and V were 0.63, 0.60, and 0.61, RMSE values were 2.811, 2.587, and 48.329, and MARE values were 18.29%, 21.00% and 22.00%, respectively. Therefore, the Richards equation (M5) was selected as the optimal base model for predicting average DBH, average height, and stand volume of Chinese fir mixed forests. The three optimal base models are as follows:
D = 22.7565 [ 1 exp ( 0.0912 t ) ] 2.0471
H = 17.2321 [ 1 exp ( 0.1079 t ) ] 1.9213
V = 338.0843 [ 1 exp ( 0.0502 t ) ] 1.9039

3.2. Height Prediction Model Based on the SCI

Since the Richards equation was the optimal model for stand average height, it was also used to construct the site class index model. Using Equation (14) as the guide curve, the SCI is the stand average height at the reference age t0. The SCI is calculated as follows:
S C I = H ( 1 e b t 0 1 e b t ) c
where H is stand average height; t is stand age; t0 is the reference age, which is 20 in this study; a, b, c are the parameters in Equation (14), i.e., a = 17.2321, b = 0.1079, c = 1.9213.
On the basis of the Richards equation, the stand average height model including the SCI was constructed by introducing the SCI into all parameters of the equation. Parameters a, b, and c were re-parameterized in the exponential form of the SCI, and they were set as a 1 S C I a 2 , b 1 S C I b 2 , and c 1 S C I c 2 , respectively. The estimated parameters and fitting statistics for each model are shown in Table 3.
Compared to the base model, the fitting results of the seven models considering the SCI were greatly improved, with the best performance being model M6, which introduced the SCI into parameter a, which received the largest R2 and the smallest RMSE and MARE values. The R2 of M6 was 0.36 larger than that of the base model, and the RMSE and MARE were 1.763 and 13.07% lower than that of the base model, respectively. Following M6 were models M9, M10, and M12, which introduced the SCI into parameters a and b, a and c, and a, b, and c, respectively. The common denominator of these four models was the introduction of the SCI into parameter a, and the fitting effects were similar. In order to simplify the model and avoid overfitting, M6 was chosen as the prediction model for stand average height, and its expression is:
H = ( 1 . 3888 S C I 0.9788 ) [ 1 exp ( 0.1028 t ) ] 1.9043

3.3. Diameter and Volume Prediction Model Based on the SCI and SDI

The stand average DBH and volume models containing the SCI and SDI were developed on the basis of their optimal base model (Equations (13) and (15)). Parameters a, b, and c were re-parameterized by the SCI and SDI in exponential form and were set as a 1 S C I a 2 , b 1 S C I b 2 , c 1 S C I c 2 , a 1 S D I a 2 , b 1 S D I b 2 , and c 1 S D I c 2 , respectively.

3.3.1. Stand Prediction Model of Average DBH

The parameter estimates and fitting statistics of the diameter prediction models containing the SCI and SDI are shown in Table 4. The fitting effects of different models were relatively close, and all fitting criteria performed well and showed significant improvement over the base model. Among them, the model with the best performance was M13 in which the SCI and SDI were introduced into parameters a and b, respectively. The R2 of M13 increased by 32.77% compared with the base model, while the RMSE and MARE decreased by 0.806 and 5.24%, respectively. Therefore, M13 was selected as the optimal diameter prediction model containing the SCI and SDI, and its expression is:
D = 20.3737 S C I 0.0353 1 exp ( ( 0.0908 S D I 0.0181 ) t ) 2.2214

3.3.2. Stand Prediction Model of Volume

Similarly, Table 5 shows the parameter estimation and fitting statistics of volume models that contain different combinations of the SCI and SDI. The best performing model was M25, which introduced the SCI into parameter a and the SDI into parameter b. M25 had an R2 of 0.82, which was 34.80% larger than that of the base model, and the smallest RMSE and MARE, which were 13.409 and 8.38% smaller than the base model, respectively. Therefore, M25 was selected as the optimal volume prediction model at this stage, and its expression is:
V = 29.5586 S C I 0.7593 1 exp ( ( 0.0615 S D I 0.1641 ) t ) 7.3515

3.4. Model Construction with Inclusion of Species Composition

3.4.1. Height Prediction Model including the TSCC

Based on the previous optimal height prediction model M6, the parameters were re-parameterized by the TSCC of the three tree species groups; a1 was transformed into (a11L1 + a12L2 + a13L3), a2 was transformed into (a21L1 + a22L2 + a23L3), b was transformed into (b11L1 + b12L2 + b13L3), and c was transformed into (c11L1 + c12L2 + c13L3). Then, parameter estimation and fitting criteria calculations were carried out for the height prediction models containing different TSCC combinations, as shown in Table 6. Among the models, M40, where Li was introduced into parameter c, had the largest R2 (0.97) and the smallest RMSE (0.798) and MARE (7.90%). Compared with M6, the improvement in the fitting effect of M40 was minimal, with the R2 increased by 0.002, RMSE decreased by 0.025, and MARE decreased by 0.03%. Considering the calculation amount and the model convenience, it was not recommended to include the TSCC in the height prediction model.

3.4.2. Diameter Prediction Model including the TSCC

Similarly, parameters a1, a2, b1, b2, and c of the previous optimal diameter model M13 were re-parameterized by the TSCC of the three tree species groups (L1, L2, and L3). Table 7 shows the fitting criteria for the diameter prediction models containing different TSCC combinations. The model displaying the best statistics was M56, in which Li was introduced into a1 and c, with an R2 of 0.92, an RMSE of 1.387, and a MARE of 9.02%. Compared with the optimal model M13, into which only the SCI and SDI were introduced, the fitting indices of M56 were improved significantly, with R2 increased by 11.07%, and RMSE and MARE decreased by 0.618 and 4.02%, respectively. The expression of M56 is as follows:
D = ( 19.6177 L 1 + 22.3716 L 2 + 18.5414 L 3 ) S C I 0.0521 1 exp ( ( 0.0903 S D I 0.0138 ) t ) 2.0579 L 1 + 2.7934 L 2 + 1.9120 L 3

3.4.3. Volume Prediction Model including the TSCC

After including the TSCC in the parameters of M25, Table 8 displays the fitting statistics for the volume prediction models containing different TSCC combinations. The R2 of the different models varied, with the largest being M62 (0.96), followed by M73 (0.93), and the smallest being M67 (0.87). Meanwhile, M62 obtained the smallest RMSE and MARE values of 20.317 and 7.93%, respectively. Compared with the optimal volume model M25, into which only the SCI and SDI were introduced, M62 significantly improved all statistical criteria, with R2 increased by 17.55%, RMSE and MARE decreased by 14.603 and 5.70%, respectively. The expression of M62 is as follows:
V = ( 28.1049 L 1 + 26.8638 L 2 + 28.9530 L 3 ) S C I 0.7793 × 1 exp ( ( 0.0666 S D I 0.1576 ) t ) 7.8910

3.5. Model Applicability Test

By using the validation data, we assessed the applicability of the optimal models in each stage, and the results are displayed in Table 9. The TRS and MRE of all models were within ±5%, the MARE decreased from 18.44%–22.74% to 8.02%–9.79%, and P increased from 94.90%–97.03% to 97.82%–99.00%. The results indicated that all eight models passed the test and were applicable. Among them, M6, M56, and M62 showed the best applicability for predicting H, D, and V, respectively.
Figure 2 shows the comparison of the residual distributions between the base and optimal models for D, H, and V against stand age. The percentages of the residuals of the optimal models for D (M56), H (M6), and V (M62) were reduced significantly more than those of the base models (M5). The residual distribution of each optimal model was relatively uniform, and the absolute value of the residual percentage generally showed a trend of decreasing with the increase in stand age. The residual performance of the optimal models M6, M56, and M62 revealed that the model system developed in this study had good performance and could accurately estimate the growth and yield of Chinese fir mixed forests, especially for mature forests that have reached the age of final felling.

4. Discussion

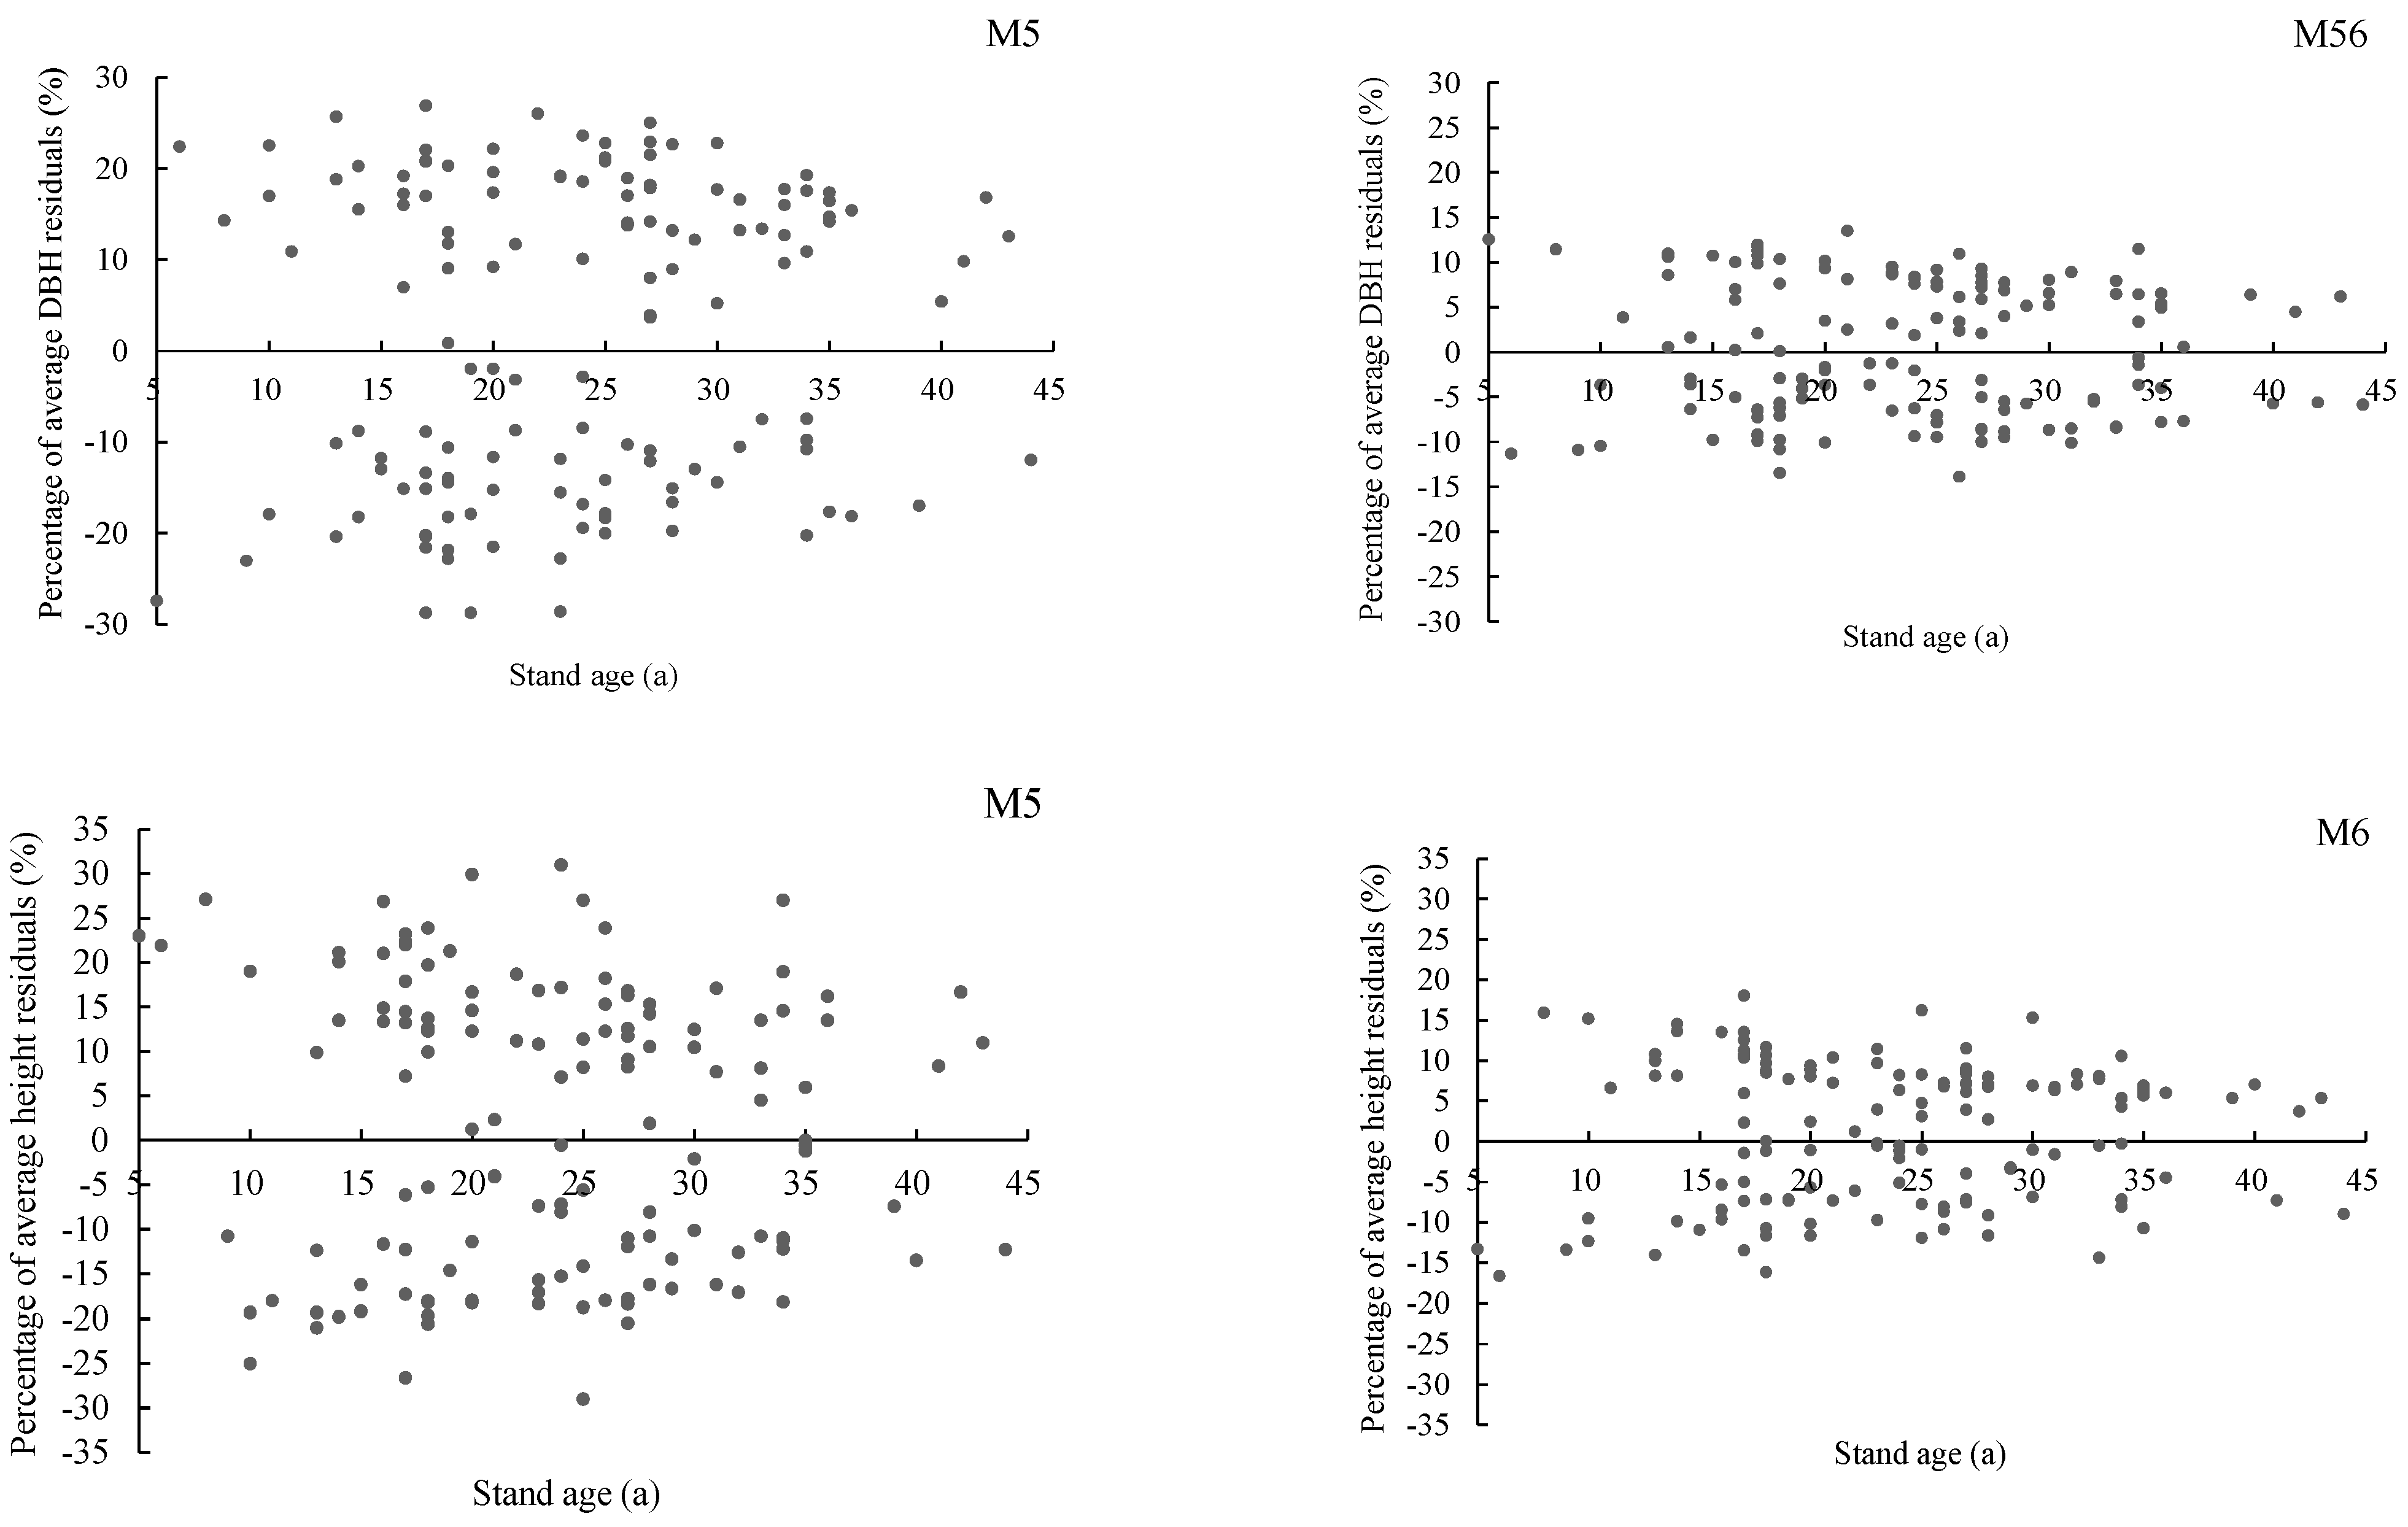
In the stand height model of Chinese fir mixed forests, the inclusion of the site class index (SCI) improved the fitting effect of the model, confirming the close relationship between stand average height and site quality. According to the biological significance of the Richards equation parameters, parameter a represents the maximum value of tree height growth [31]. We found that adding the SCI to parameter a of the base model had the best fitting effect, which may indicate that the maximum tree height was mainly affected by site quality, and this conclusion has been demonstrated by many studies [6,7,21,32,33]. The addition of the tree species composition coefficient (TSCC) did not significantly improve the accuracy of the height model, possibly because the stand average height of Chinese fir mixed forests was the average height of the dominant tree species, which had little relationship with the species composition but was closely related to the stand site quality [30]. Because adding the TSCC will greatly increase the calculation amount of the model, we do not recommend introducing the TSCC into the average height model of Chinese fir mixed forests. Instead, including only the SCI in the height model would be a better choice.
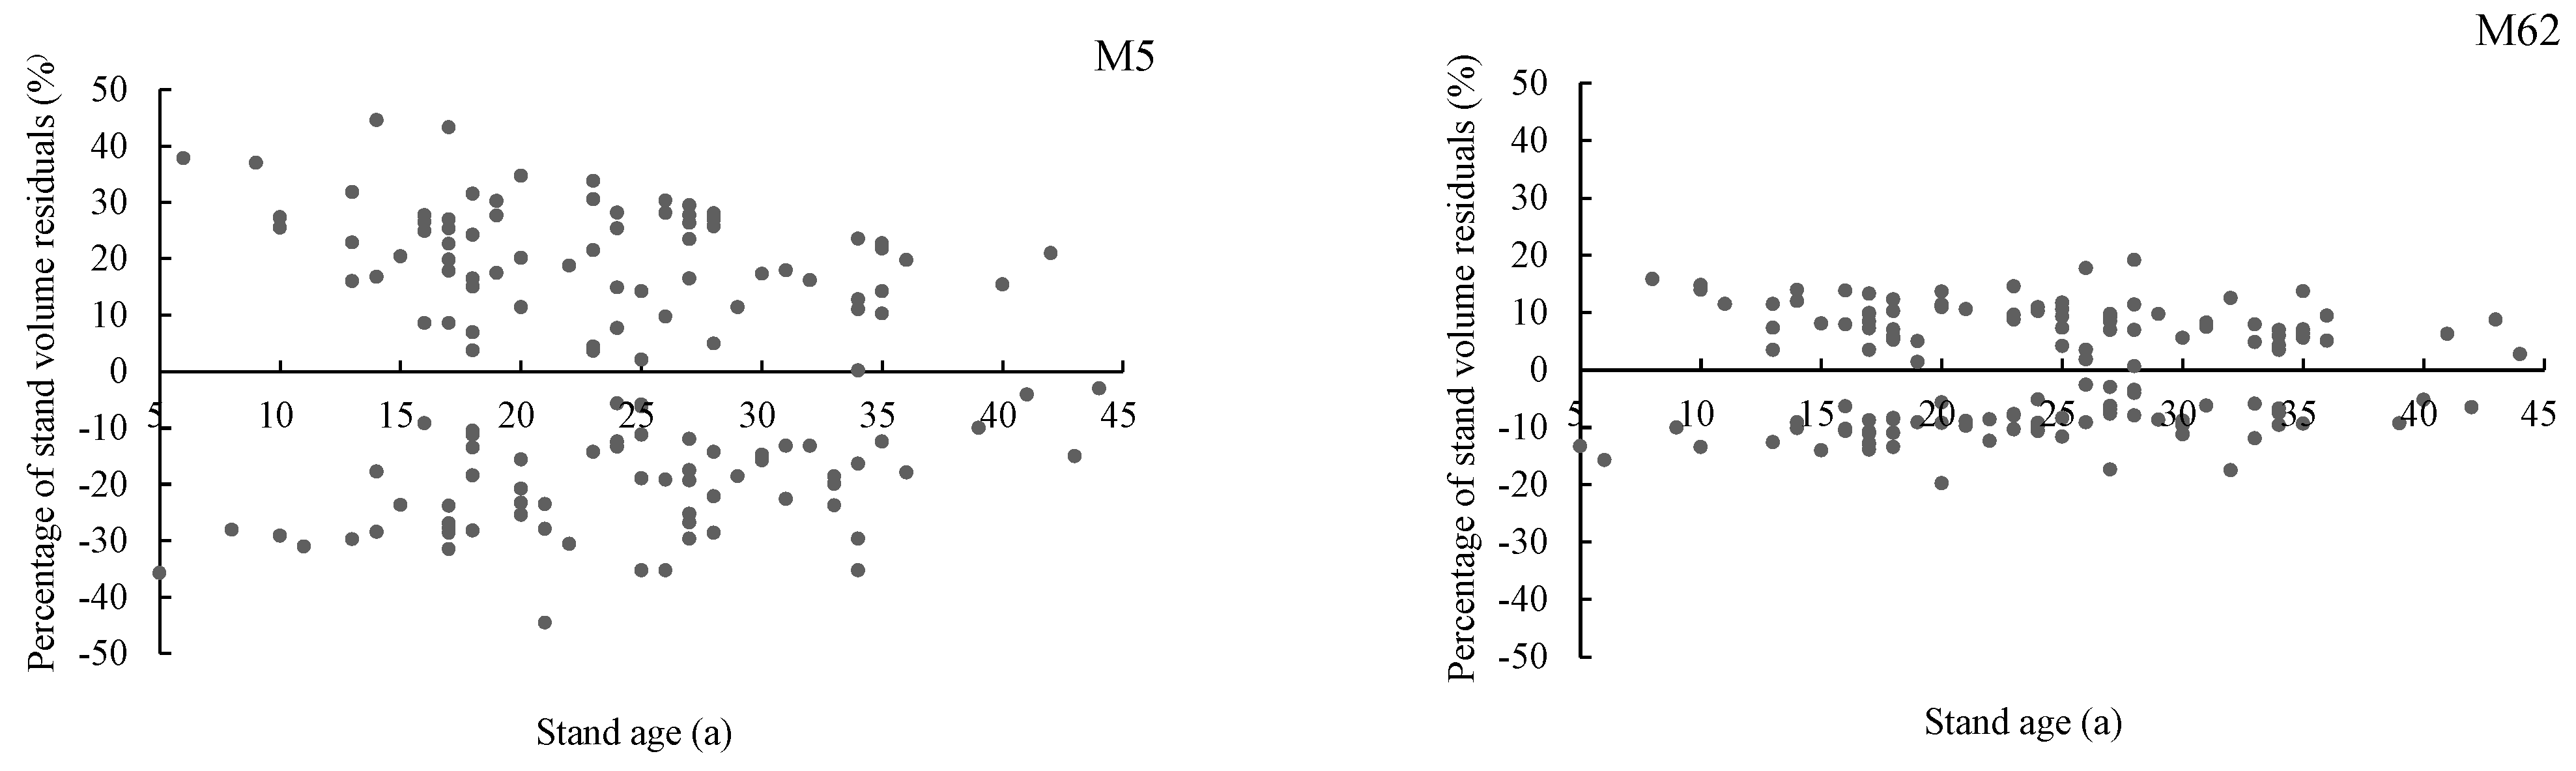
In the models predicting stand average DBH and volume of Chinese fir mixed forests, the inclusion of the SCI and SDI improved the model performance, and the model fitting statistics were the best when the SCI was introduced into parameter a and the SDI was introduced into parameter b. This indicated that site quality mainly affected the maximum values of stand average DBH and volume, while stand density mainly affected their growth rate. The findings that stand average DBH and volume were affected by site quality and stand density are consistent with the results of other studies [34,35,36,37]. However, these results may also be related to the stand age. In this study, the average stand age was 23 years, which is mature for Chinese fir, and its DBH and volume may be more sensitive to the stand density index [19,24]. Therefore, the relationship between stand yield and the SCI/SDI for young Chinese fir mixed forests remains to be further studied.
Including the tree species composition coefficient (TSCC) in the stand average DBH and volume models significantly improved their accuracy. The best fitting results were obtained when the TSCC was introduced into parameters a1 and c of the stand average DBH model, and when the TSCC was introduced into parameter a1 of the stand volume model. The influence of species composition on the average DBH and stand volume were different but had one common aspect, that is, the models containing the TSCC in parameter a1 of the SCI had the best fitting performance. Therefore, it can be inferred that the composition of tree species will affect the maximum values of the stand average diameter and volume. The reason may be that, because of the greater diversity of tree species, the increased complementary effects among the different tree species will promote the full utilization of space within the stand, thereby increasing the maximum values of the stand average diameter and volume [11,38]. This suggests that the construction of artificial mixed forests can not only improve the ecological benefits but also increase timber production and generate more economic benefits.
In this study, the TSCC was the default fixed value for a certain period of time. However, with the increase in stand age, the interspecific competition within the stand will change, and factors such as growth rate, growth status, and the dominance of different tree species will also lead to changes in the TSCC [16,17,38]. Therefore, follow-up studies can be carried out on the basis of this study, such as developing a dynamic tree species composition coefficient model to provide a more reliable TSCC for predicting the stand dynamics of mixed forests or including air temperature, moisture, nutrients, slope, altitude, management level, and other indicators to build a more accurate stand growth and yield model.

5. Conclusions

In this study, the effects of site quality, stand density, and species composition on the average height, average DBH, and stand volume of mixed Chinese fir forests were explored, and a growth and yield model system was developed. Among them, site quality had a close relationship with the growth limits of stand average height, average DBH, and volume; stand density was closely related to the growth rate of stand average DBH and volume; species composition had an impact on the maximum growth of stand DBH and volume. The accuracy and applicability of the established model system were good, which can provide theoretical support for harvest prediction, tree species matching, and forestry production planning for Chinese fir mixed forests.

Author Contributions

Conceptualization, X.P. and X.J.; data collection, J.L., C.Z. and X.J.; methodology and software, X.P. and W.H.; drafting of the manuscript, X.P. and J.L.; visualization, W.H. and C.Z.; revisions and suggestions, S.S. and X.J.; funding acquisition, S.S. and X.J. All authors have read and agreed to the published version of the manuscript.

Funding

This research was funded by the Natural Science Foundation of Fujian Province (grant number 2022J05030), the National Key R&D Program of China (grant number 2021YFD2201302), and the Fujian Forestry Science and Technology Project (grant numbers KLB18H18A and KFA17283A).

Data Availability Statement

The data is available on request from the corresponding author.

Conflicts of Interest

Author Jun Li was employed by the company Fujian Funong Agricultural Materials Group Co., Ltd. and Fujian Funong Crop Sciences Co., Ltd. The remaining authors declare that the research was conducted in the absence of any commercial or financial relationships that could be construed as a potential conflict of interest.

References

  1. Guo, J.; Feng, H.; Roberge, G.; Feng, L.; Pan, C.; McNie, P.; Yu, Y. The negative effect of Chinese fir (Cunninghamia lanceolata) monoculture plantations on soil physicochemical properties, microbial biomass, fungal communities, and enzymatic activities. For. Ecol. Manag. 2022, 519, 120297. [Google Scholar] [CrossRef]
  2. Zhang, X.; Wang, Z.; Chhin, S.; Wang, H.; Duan, A.; Zhang, J. Relative contributions of competition, stand structure, age, and climate factors to tree mortality of Chinese fir plantations: Long-term spacing trials in southern China. For. Ecol. Manag. 2020, 465, 118103. [Google Scholar] [CrossRef]
  3. Kang, H.; Seely, B.; Wang, G.; Cai, Y.; Innes, J.; Zheng, D.; Chen, P.; Wang, T. Simulating the impact of climate change on the growth of Chinese fir plantations in Fujian province, China. N. Z. J. For. Sci. 2017, 47, 20. [Google Scholar] [CrossRef]
  4. National Forestry and Grassland Administration of China. China Forest Resources Report 2014–2018; China Forestry Publishing House: Beijing, China, 2019; pp. 28–30. [Google Scholar]
  5. Wen, H.; Deng, X.; Zhang, Y.; Wei, X.; Wang, G.; Zhou, B.; Xiang, W.; Zhu, N. Cunninghamia lanceolata variant with red-heart wood: A mini-review. Dendrobiology 2018, 79, 156–167. [Google Scholar] [CrossRef]
  6. Zhang, X.; Chhin, S.; Fu, L.; Lu, L.; Duan, A.; Zhang, J. Climate-sensitive tree height–diameter allometry for Chinese fir in southern China. Forestry 2019, 92, 167–176. [Google Scholar] [CrossRef]
  7. Lu, L.; Chhin, S.; Zhang, J.; Zhang, X. Modelling tree height-diameter allometry of Chinese fir in relation to stand and climate variables through Bayesian model averaging approach. Silva. Fenn. 2021, 55, 10415. [Google Scholar] [CrossRef]
  8. Wang, Q.; Zhang, W.; Sun, T.; Chen, L.; Pang, X.; Wang, Y.; Xiao, F. N and P fertilization reduced soil autotrophic and heterotrophic respiration in a young Cunninghamia lanceolata forest. Agric. For. Meteorol. 2017, 232, 66–73. [Google Scholar] [CrossRef]
  9. Xiang, W.; Li, L.; Ouyang, S.; Xiao, W.; Zeng, L.; Chen, L.; Lei, P.; Deng, X.; Zeng, Y.; Fang, J.; et al. Effects of stand age on tree biomass partitioning and allometric equations in Chinese fir (Cunninghamia lanceolata) plantations. Eur. J. For. Res. 2021, 140, 317–332. [Google Scholar] [CrossRef]
  10. Zhao, Y.; Deng, X.; Xiang, W.; Chen, L.; Ouyang, S. Predicting potential suitable habitats of Chinese fir under current and future climatic scenarios based on Maxent model. Ecol. Infor. 2021, 64, 101393. [Google Scholar] [CrossRef]
  11. Pretzsch, H.; Forrester, D.; Bauhus, J. Mixed-Species Forests; Springer: Berlin, Germany, 2017; pp. 1–26. [Google Scholar] [CrossRef]
  12. Marron, N.; Epron, D. Are mixed-tree plantations including a nitrogen-fixing species more productive than monocultures? For. Ecol. Manag. 2019, 441, 242–252. [Google Scholar] [CrossRef]
  13. Xu, Y.; Ren, S.; Liang, Y.; Du, A.; Li, C.; Wang, Z.; Zhu, W.; Wu, L. Soil nutrient supply and tree species drive changes in soil microbial communities during the transformation of a multi-generation Eucalyptus plantation. Appl. Soil Ecol. 2021, 166, 103991. [Google Scholar] [CrossRef]
  14. Ishida, A.; Nara, K.; Hogetsu, T. Host effects on ectomycorrhizal fungal communities: Insight from eight host species in mixed conifer–broadleaf forests. New Phytol. 2007, 174, 430–440. [Google Scholar] [CrossRef]
  15. Cui, Y.; Zhang, Q.; Yan, Y.; Jiang, C.; Fan, R.; Ye, S. Distribution characteristics of soil aggregate organic phosphorus in pure and mixed Cunninghumia lanceolata. Acta Bot. Boreal. Occident. Sin. 2023, 43, 1547–1556. [Google Scholar] [CrossRef]
  16. Yang, R.; Wang, L.; Tian, Q.; Xu, N.; Yang, Y. Estimation of the conifer-broadleaf ratio in mixed forests based on time-series data. Remote Sens. 2021, 13, 4426. [Google Scholar] [CrossRef]
  17. Huang, Y.; Wang, S.; Feng, Z.; Ouyang, Z.; Wang, X.; Feng, Z. Changes in soil quality due to introduction of broad-leaf trees into clear-felled Chinese fir forest in the mid-subtropics of China. Soil Use Manag. 2004, 20, 418–425. [Google Scholar] [CrossRef]
  18. Li, Y.; Xu, J.; Wang, H.; Nong, Y.; Sun, G.; Yu, S.; Liao, L.; Ye, S. Long-term effects of thinning and mixing on stand spatial structure: A case study of Chinese fir plantations. Iforest Biogeosciences For. 2021, 14, 113–121. [Google Scholar] [CrossRef]
  19. Burkhart, H.; Tomé, M. Modeling Forest Trees and Stands; Springer: Dordrecht, The Netherlands, 2012; pp. 245–258. [Google Scholar]
  20. Hong, L.; Lei, X.; Li, Y. Integrated stand growth model of Mongolian oak and it’s application. For. Res. 2012, 25, 201–206. [Google Scholar]
  21. Sharma, M.; Amateis, R.; Burkhart, H. Top height definition and its effect on site index determination in thinned and unthinned loblolly pine plantations. For. Ecol. Manag. 2002, 168, 163–175. [Google Scholar] [CrossRef]
  22. Allen, M.; Burkhart, H. Growth-density relationships in loblolly pine plantations. For. Sci. 2018, 65, 250–264. [Google Scholar] [CrossRef]
  23. Hua, W.; Pan, X.; Zhu, D.; Wu, C.; Chi, S.; Zhuang, C.; Jiang, X.; Liu, J.; Wu, J. Developing growth and harvest prediction models for mixed coniferous and broad-leaved forests at different ages. Forests 2023, 14, 1416. [Google Scholar] [CrossRef]
  24. Weiskittel, A.; Hann, D.; Kershaw, J., Jr.; Vanclay, J. Forest Growth and Yield Modeling; John Wiley & Sons: New York, NY, USA, 2011; pp. 53–60. [Google Scholar]
  25. Zhang, X.; Duan, A.; Dong, L.; Cao, Q.V.; Zhang, J. The application of Bayesian model averaging in compatibility of stand basal area for even-aged plantations in southern China. For. Sci. 2013, 60, 645–651. [Google Scholar] [CrossRef]
  26. Xu, H. An approach to growth and yield models for individual China-fir (Cunninghamia Lanceolata) trees in southeast China. Appl. Ecol. Env. Res. 2019, 17, 15403–15418. [Google Scholar] [CrossRef]
  27. Jiao, Y.; Feng, J. Study of the site class index chart of larch plantation based on the Mitscherlich model1. IOP Conf. Ser. Earth Environ. Sci. 2021, 658, 012028. [Google Scholar] [CrossRef]
  28. Reineke, L. Perfection a stand-density index for even-aged forest. J. Agri. Res. 1933, 46, 627–638. [Google Scholar]
  29. Ducey, M.; Larson, B. Is there a correct stand density index? An alternate interpretation. West. J. Appl. For. 2003, 18, 179–184. [Google Scholar] [CrossRef]
  30. Meng, X. Forest Mensuration, 3rd ed.; China Forestry Publishing House: Beijing, China, 2019; pp. 44–58. [Google Scholar]
  31. Richards, F. A flexible growth function for empirical use. J. Exp. Bot. 1959, 10, 290–301. [Google Scholar] [CrossRef]
  32. Ouzennou, H.; Pothier, D.; Raulier, F. Adjustment of the age-height relationship for uneven-aged black spruce stands. Can. J. For. Res. 2008, 38, 2003–2012. [Google Scholar] [CrossRef]
  33. Özçelik, R.; Cao, Q.V.; Trincado, G.; Göçer, N. Predicting tree height from tree diameter and dominant height using mixed-effects and quantile regression models for two species in Turkey. For. Ecol. Manag. 2018, 419–420, 240–248. [Google Scholar] [CrossRef]
  34. Dunbar, A.; Dhubhain, A.; Bulfin, M. The productivity of Douglas fir in Ireland. Forestry 2002, 75, 537–545. [Google Scholar] [CrossRef]
  35. Tewari, V.; Vindhya, P. Variable density yield model for irrigated plantations of Dalbergia sissoo grown under hot arid conditions in India. J. For. Sci. 2012, 28, 205–211. [Google Scholar] [CrossRef]
  36. Guzmán, G.; Pukkala, T.; Palahí, M.; de-Miguel, S. Predicting the growth and yield of Pinus radiata in Bolivia. Ann. For. Sci. 2012, 69, 335–343. [Google Scholar] [CrossRef]
  37. Kurinobu, S.; Arisman, H.; Hardiyanto, E.; Miyaura, T. Growth model for predicting stand development of Acacia mangium in South Sumatra, Indonesia, using the reciprocal equation of size-density effect. For. Ecol. Manag. 2006, 228, 91–97. [Google Scholar] [CrossRef]
  38. del Río, M.; Pretzsch, H.; Alberdi, I.; Bielak, K.; Bravo, F.; Brunner, A.; Condés, S.; Ducey, M.J.; Fonseca, T.; von Lüpke, N.; et al. Characterization of the structure, dynamics, and productivity of mixed-species stands: Review and perspectives. Eur. J. For. Res. 2016, 135, 23–49. [Google Scholar] [CrossRef]
Figure 1. Study area and locations of sampling plots.
Forests 14 02315 g001
Figure 2. Residual distributions of the base (M5) and optimal models for D (M56), H (M6) and V (M62) against stand age.
Forests 14 02315 g002aForests 14 02315 g002b
Table 1. Statistics of stand attributes for fit and validation data.
Data TypeStand AttributesMeanMin.Max.SDCV%
Fit data
(278 plots)
Average DBH (cm)13.83 6.50 24.30 3.60 26.06
Average height (m)11.09 4.20 19.00 3.24 29.24
Stand age (a)22.96 6.00 47.00 7.74 33.69
Stand volume (m3/ha)153.75 11.80 421.46 60.84 39.57
Stand density (trees/ha)1918.55 345.00 4560.00 914.88 47.69
Validation data (140 plots)Average DBH (cm)14.60 7.80 24.60 3.65 25.02
Average height (m)11.59 5.00 19.20 2.99 25.78
Stand age (a)23.70 5.00 44.00 8.01 33.80
Stand volume (m3/ha)153.86 17.34 414.83 64.88 42.17
Stand density (trees/ha)1783.71 330.00 4590.00 936.94 52.53
Table 2. Parameter estimates and fitting statistics of the base models.
Dependent VariableModel No.ModelParameter EstimationFitting Statistic
abcRMSEMARE%R2
D (cm)M1Schumacher28.252711.0819 2.97619.370.56
M2Korf25.2272 23.9707 1.32242.905 18.90 0.59
M3Logistic21.4882 7.1317 0.1572 2.844 18.50 0.61
M4Mitscherlich24.0049 0.0536 2.879 18.73 0.60
M5Richards22.75650.09122.04712.81118.290.63
H (m)M1Schumacher17.5724 11.3259 2.824 22.93 0.49
M2Korf12.8521 473.5443 2.5784 2.756 22.37 0.53
M3Logistic12.0700 19.5583 0.2446 2.757 22.38 0.53
M4Mitscherlich14.5786 0.0572 2.845 23.10 0.48
M5Richards17.23210.10791.92132.58721.000.60
V (m3/ha)M1Schumacher259.2937 11.9968 52.390 23.85 0.51
M2Korf182.5759 1192.0277 2.9076 52.720 24.00 0.50
M3Logistic176.6615 32.5480 0.272850.629 23.05 0.55
M4Mitscherlich213.52410.0544 52.838 24.06 0.50
M5Richards338.08430.05021.903948.32922.000.61
Note: Bold numbers denote the best model for each criterion.
Table 3. Parameter estimates and fitting statistics of the average height models containing SCI.
Model No.ParameterizationParameter EstimationFitting Statistic
SCIaa1a2bb1b2cc1c2RMSEMARE%R2
M6a 1.38880.97880.1028 1.9043 0.8237.930.97
M7b14.7145 0.00081.86211.0951 1.723 15.54 0.85
M8c1204.5296 9.6762 0.5910−0.20361.971 17.78 0.79
M9a, b 1.08331.0210 0.2145−0.00378.8912 0.938 8.46 0.96
M10a, c 1.08871.01880.2127 8.89920.00020.938 8.46 0.96
M11b, c14.2879 0.00022.6097 0.03071.67881.635 14.75 0.86
M12a, b, c 1.05221.0329 0.2736−0.1028 17.4751−0.27420.938 8.46 0.96
Note: Bold numbers denote the best model for each criterion. a, b and c are the parameters of the base model M5 for height prediction. For M6, parameter a is re-parameterized to a 1 S C I a 2 by the SCI; thus, its equation becomes H = a 1 S C I a 2 [ 1 exp ( b t ) ] c . The other equations can be deduced by analogy.
Table 4. Parameter estimates and fitting statistics of the average DBH models containing the SCI and SDI.
Model No.ParameterizationParameter EstimationFitting Statistic
SCISDIaa1a2bb1b2cc1c2RMSEMARE%R2
M13ab 20.37370.0353 0.09080.01812.2214 2.00513.050.83
M14ac 20.34600.03590.1032 2.6084−0.02252.013 13.10 0.83
M15ba 20.76510.0090 0.09020.05852.2396 2.065 13.44 0.82
M16bc22.1461 0.08960.0588 2.5884−0.02212.066 13.44 0.82
M17ca 20.73870.00920.1035 2.7449−0.08682.066 13.45 0.82
M18cb22.1481 0.09030.0182 2.6968−0.08502.066 13.44 0.82
M19ab, c 20.43170.0330 0.04120.1338 0.47260.22722.016 13.12 0.83
M20ba, c 20.72630.0093 0.09030.0585 2.22490.00102.065 13.44 0.82
M21ca, b 22.7224−0.0036 0.08690.0235 2.6843−0.08462.065 13.44 0.82
M22a, bc 21.59700.0106 0.09280.0443 2.5939−0.02222.013 13.10 0.83
M23b, ca 20.85020.0084 0.04990.3128 0.71190.49232.066 13.45 0.82
M24a, cb 20.52020.0323 0.09070.0181 2.2784−0.01102.012 13.09 0.83
Note: Bold numbers denote the best model for each criterion. a, b, and c are the parameters of the base model M5 for diameter prediction. For M13, parameters a and b are re-parameterized to a 1 S C I a 2 and b 1 S D I b 2 by the SCI and SDI, respectively; thus, its equation becomes D = a 1 S C I a 2 [ 1 exp ( b 1 S D I b 2 t ) ] c . The other equations can be deduced by analogy.
Table 5. Parameter estimates and fitting statistics of the stand volume models containing the SCI and SDI.
Model No.ParameterizationParameter EstimationFitting Statistic
SCISDIaa1a2bb1b2cc1c2RMSEMARE%R2
M25ab 29.55860.7593 0.06150.16417.3515 34.92013.630.82
M26ac 29.45130.76180.1879 186.8887−0.476738.218 14.91 0.78
M27ba 72.17640.1386 0.01120.98072.3595 44.287 17.28 0.69
M28bc203.3057 0.00501.1614 26.6712−0.423144.195 17.25 0.69
M29ca 69.77640.13890.1327 207.2330−1.792145.731 17.85 0.66
M30cb197.4059 0.01390.2638 71.4353−1.612245.975 17.94 0.66
M31ab, c 29.54080.7599 0.08410.1178 18.9860−0.141238.143 14.89 0.78
M32ba, c 117.34960.0725 0.00821.0495 11.8602−0.262344.039 17.19 0.69
M33ca, b 83.50480.1138 0.09170.0495 185.3114−1.762045.704 17.84 0.66
M34a, bc 21.23110.8997 0.3367−0.2472 179.4847−0.473241.374 16.15 0.78
M35b, ca 73.64090.1364 0.00231.6743 0.04441.758543.694 17.05 0.70
M36a, cb 23.31470.8599 0.06100.1623 1.75880.575037.807 14.75 0.78
Note: Bold numbers denote the best model for each criterion. a, b and c are the parameters of the base model M5 for volume prediction. For M25, parameters a and b are re-parameterized to a 1 S C I a 2 and b 1 S D I b 2 by the SCI and SDI, respectively; thus, its equation becomes V = a 1 S C I a 2 [ 1 exp ( b 1 S D I b 2 t ) ] c . The other equations can be deduced by analogy.
Table 6. Fitting statistics of the average height models containing the SCI and TSCC.
Model no.ParameterizationFitting Statistic
TSCCRMSEMARE%R2
M37a1, a21.66915.050.86
M38a11.0789.720.94
M39b1.12510.150.94
M40c0.7987.900.97
M41a1, a2, b1.84916.680.82
M42a1, b1.18710.710.93
M43a1, a2, c1.0329.310.95
M44a1, c0.9448.520.96
M45b, c0.9748.780.95
M46a1, a2, b, c1.78216.070.84
M47a1, b, c1.0999.910.94
Note: Bold numbers denote the best model for each criterion. a1, a2, b, and c are parameters of the height prediction model M6. For M37, parameters a1 and a2 are re-parameterized to (a11L1 + a12L2 + a13L3) and (a21L1 + a22L2 + a23L3), respectively; thus, its equation becomes H = ( a 11 L 1 + a 12 L 2 + a 13 L 3 ) S C I ( a 21 L 1 + a 22 L 2 + a 23 L 3 ) 1 exp ( b t ) c . The other equations can be deduced by analogy.
Table 7. Fitting statistics of the average DBH models containing the SCI, SDI, and TSCC.
Model No.ParameterizationFitting Statistic
TSCCRMSEMARE%R2
M48a1, a21.808 11.77 0.87
M49a11.814 11.80 0.86
M50b1, b21.798 11.70 0.87
M51b11.813 11.80 0.86
M52c1.795 11.68 0.87
M53a1, a2, b1, b21.906 12.40 0.85
M54a1, b11.950 12.69 0.84
M55a1, a2, c1.552 10.10 0.90
M56a1, c1.3879.020.92
M57b1, b2, c1.788 11.63 0.87
M58b1, c1.767 11.50 0.87
M59a1, a2, b1, b2, c1.495 9.73 0.91
M60a1, b1, c1.551 10.09 0.90
Note: Bold numbers denote the best model for each criterion. a1, a2, b1, b2, and c are the parameters of the diameter prediction model M13. For M48, parameters a1 and a2 are re-parameterized to (a11L1 + a12L2 + a13L3) and (a21L1 + a22L2 + a23L3), respectively; thus, its equation becomes D = ( a 11 L 1 + a 12 L 2 + a 13 L 3 ) S C I ( a 21 L 1 + a 22 L 2 + a 23 L 3 ) [ 1 exp ( b 1 S D I b 2 t ) ] c . The other equations can be deduced by analogy.
Table 8. Fitting statistics of the stand volume models containing the SCI, SDI, and TSCC.
Model No.ParameterizationFitting Statistic
TSCCRMSEMARE%R2
M61a1, a223.645 9.23 0.92
M62a120.3177.930.96
M63b1, b229.620 11.56 0.87
M64b128.535 11.14 0.88
M65c22.699 8.86 0.93
M66a1, a2, b1, b226.968 10.52 0.90
M67a1, b130.127 11.76 0.87
M68a1, a2, c28.955 11.30 0.88
M69a1, c26.445 10.32 0.90
M70b1, b2, c28.535 11.14 0.88
M71b1, c25.092 9.79 0.91
M72a1, a2, b1, b2, c23.988 9.36 0.920
M73a1, b1, c21.975 8.58 0.93
Note: Bold numbers denote the best model for each criterion. a1, a2, b1, b2, and c are the parameters of the volume prediction model M25. For M61, parameters a1 and a2 are re-parameterized to (a11L1 + a12L2 + a13L3) and (a21L1 + a22L2 + a23L3), respectively; thus, its equation becomes V = ( a 11 L 1 + a 12 L 2 + a 13 L 3 ) S C I ( a 21 L 1 + a 22 L 2 + a 23 L 3 ) [ 1 exp ( b 1 S D I b 2 t ) ] c . The other equations can be deduced by analogy.
Table 9. Evaluation statistics of model applicability.
Model No.Dependent VariableEvaluation Statistic
TRS/%MRE/%MARE/%P/%
M5D−3.47 3.67 18.44 97.03
M5H3.273.1321.73 96.87
M5V4.71 4.38 22.74 94.90
M6H−0.560.608.1399.00
M13D1.321.1213.8697.87
M25V1.741.7414.3396.29
M56D−0.580.679.7998.41
M62V0.730.898.0297.82
Disclaimer/Publisher’s Note: The statements, opinions and data contained in all publications are solely those of the individual author(s) and contributor(s) and not of MDPI and/or the editor(s). MDPI and/or the editor(s) disclaim responsibility for any injury to people or property resulting from any ideas, methods, instructions or products referred to in the content.

