Abstract
Ecotourism in protected areas facilitates responsible travel to natural places that conserve the environment, deliver economic benefits to local communities, and offer interpretation and education to visitors. Proper planning and sufficient monitoring of ecotourism sustainability indicators is needed to manage visitor activities in protected areas. Therefore, identifying the major impacts and mitigating them in the early stages of ecotourism development could contribute significantly to the achievement of sustainable development. There is a current gap between the situation in the field and academic contributions to this problem in protected areas of Iran. In the present study, we evaluated ecotourism sustainability levels in four different types of protected areas in Iran, including Lar National Park, Jajrud Protected Area with Sustainable Use of Natural Resource Areas, Tangeh Vashi National Natural Monument, and Kavdeh Wildlife Refuge. We developed a comprehensive list of ecotourism sustainability indicators, including 38 indicators in the environmental–physical dimension, 42 indicators in the demographic–social dimension, and 30 indicators in the economic–institutional dimension. Harnessing local community expertise, we adopted a Delphi approach to determine sustainability levels and factors impacting sustainability. Ecotourism in Lar National Park was most sustainable because of the high levels of restrictions protecting the area and the difficulty in access. Conversely, ecotourism sustainability was lowest at Tangeh Vashi National Natural Monument, which allowed for an uncontrolled influx of visitors. We discuss further factors that impact sustainability, such as population growth, expanding urbanization, an increase in physical and economic activities, and extended annual periods of ecotourism activities. Although the presented ecotourism sustainability indicators are specific to Iran, this study can also be seen to provide a template to plan for sustainable ecotourism in other countries. Altogether, our results suggest conducting a type-by-type analysis of the particular circumstances of various protected areas.
1. Introduction
Protected areas are needed to conserve nature and its environmental, cultural, and socioeconomic value [1,2]. Providing ecotourism experiences in protected areas helps conserve nature while offering economic and educational benefits to communities and visitors [3,4,5]. Sustainable ecotourism has been promoted as an alternative to mass tourism, fostering community empowerment and environmental protection [6,7,8]. However, multiple conflicting goals of protected areas may cause a dilemma between resource protection and recreation provision [9,10]. The challenge is to manage adverse environmental, cultural, and economic impacts of ecotourism on natural ecosystems [11]. Many factors may contribute to the failure of ecotourism initiatives, such as the lack of operational and strategic planning or weak decision making [12,13,14,15], leading to uncontrolled development of ecotourism environmental pollution, loss of biodiversity, species destruction, an increase in waste levels, habitat destruction, and a reduction in biological resources [16]. Here, we focus on the impacts of ecotourism in protected areas of Iran, namely in Lar National Park, the Jajrud Protected Area with Sustainable Use of Natural Resource Areas, Tangeh Vashi National Natural Monument, and Kavdeh Wildlife Refuge. Many factors have contributed to the unsustainability of ecotourism in these areas, including the widespread development of new ecotourism ventures, overexploitation of natural resources, lack of monitoring, and increasing visitation numbers. This has threatened a variety of plants and wildlife species, as well as numerous attractions of national and regional importance, such as Lar Lake and Dam, the Landscape of Damavand Peak, Jajrud River, Latian Dam, Kamard Waterfall, the unique forests of Pistacia atlantica, historical monuments of Tangeh Vashi, Ahanak Lake, and the scenic landscapes of the Firoozkooh villages [17]. Therefore, indicators need to be established to monitor and manage impacts in order to develop ecotourism sustainably.
Ecotourism developed as an alternative form of tourism in the 1980s because of an increased awareness of the impacts of conventional mass tourism [18,19,20]. Ecotourism rapidly gained popularity under the sustainability banner [21,22,23]. Accordingly, the term sustainable ecotourism is defined as “tourism that takes full account of its current and future economic, social and environmental impacts, addressing needs of visitors, industry, and the environment and host communities” [24]. To achieve these goals, ecotourism ventures and their potential impacts need to be monitored using the expertise of various stakeholders. A commonly accepted methodology to evaluate whether an ecotourism venture is sustainable is to build a measurement system using sustainability indicators [4,24,25]. This was deemed most effective for achieving positive planning and policy outcomes [26].
Multiple dimensions need to be considered to assess ecotourism sustainability, including economic, environmental, social, cultural, and institutional aspects [27,28,29,30]. These indicators vary geographically, and the process of identification involves complex decision making [24,31,32]. Selecting an adequate method to identify indicators has also proved a challenge [33]. Recommendations by the UNWTO [34] are often used to develop indicator lists based on physical–environmental, demographic–social, and economic–institutional variables. These constituent elements need to be treated as equally important, interconnected, and balanced to strive towards sustainability [35,36,37].
A number of studies provide good examples of how to identify ecotourism indicators. For example, Avelino et al. [38] studied ecotourism indicators for marine protected areas using a multicriteria decision-making method. Their study highlights the importance of stakeholder knowledge, attitudes, and perceptions. Sustainability was measured by conducting household surveys within the local coastal community. The authors concluded that although awareness was raised, stakeholders still did not comprehend coral cover/reef health issues. Ocampo et al. [39] studied sustainable ecotourism indicators in the Philippines, adopting a fuzzy Delphi method to address vagueness and uncertainty of judgment, which are typical of stakeholder assessments. The Delphi method is simple in its approach yet offers flexibility when specific conditions require an increase or decrease in the number of indicators. Agyeiwaah et al. [40] reviewed commonalities among studies that research ecotourism indicators as a starting point for enterprises to move towards a more sustainable path. Ristić et al. [41] studied tourism and sustainable development of rural settlements in protected areas of Serbia and defined 20 indicators that determine the sustainable rural development index (SRDI). Blackstock et al. [42] analyzed indicators measuring sustainable tourism and local development in protected areas of England. Castellani and Sala [43] prepared a sustainable performance index for tourism policy development in protected areas of Europe. Blanco-Cerradelo et al. [44] reported that the tourist sustainability of protected areas in Spain was related to the preservation of nature, the creation of a sense of community, and the economic welfare of the local community. Jamal and Stronza [45] found that an evolving partnership between local and international stakeholders toward local control could be helpful for sustainable ecotourism in protected areas of the USA. Zhang et al. [46] identified 52 indicators in accordance with sustainable tourism development goals in Qinghai Lake Nature Reserve, China. Recently, Hasana et al. [47] used a bibliometric analysis, providing a comprehensive overview of the literature on ecotourism in protected areas with the aid of three bibliometric indicators: quantity, quality, and structural indicators. They found a steady growth in publications with a significant increase in citations, implying ecotourism in protected areas is a significant research area.
In this research, we present a detailed examination of sustainable ecotourism indicators and levels for four different types of protected areas in Iran, including a national park, a protected area with sustainable use of natural resources, a national natural monument, and a wildlife refuge. We adopted a Delphi method to identify and evaluate factors influencing levels of sustainability in these areas, drawing on community expertise. Hence, the goal of our research was to (1) identify and assess ecotourism sustainability indicators using the Delphi method, (2) evaluate the level of sustainability of ecotourism offers in the protected areas of Tehran, and (3) determine the main impacts of unsustainable operations in these areas.
2. Materials and Methods
2.1. Protected Areas of Tehran Province
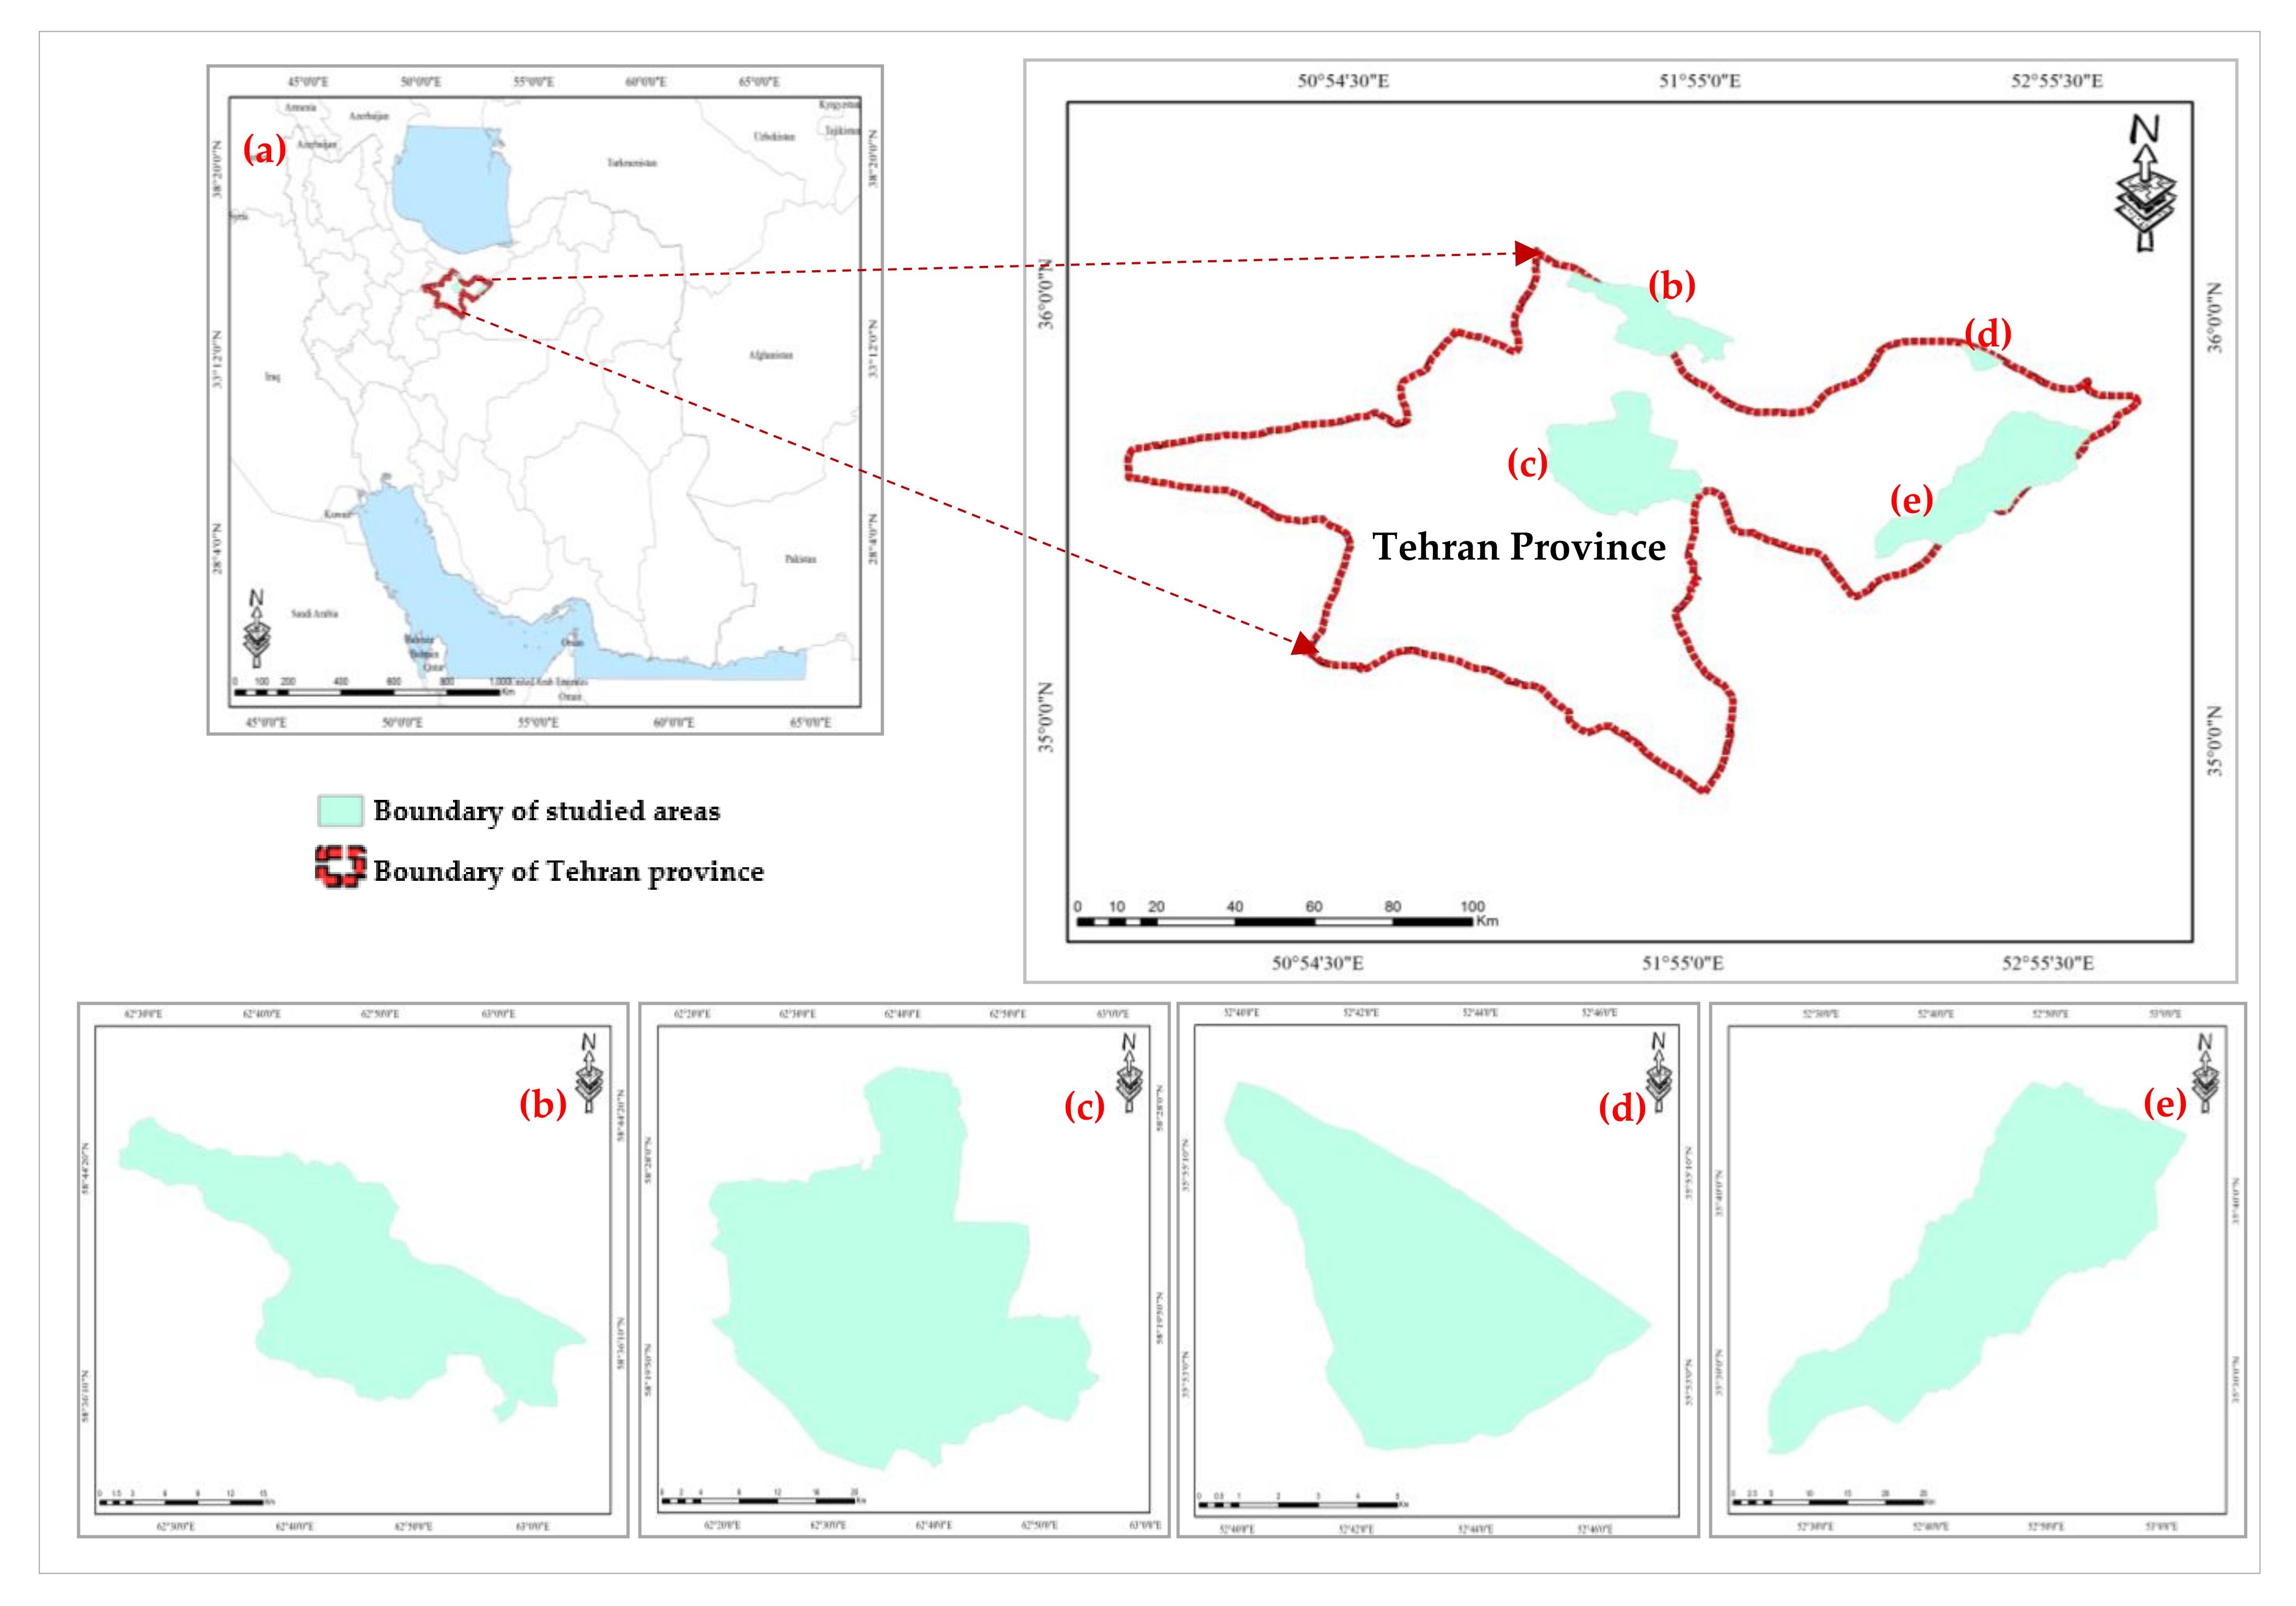
We selected four different types of protected areas located in Tehran province, Iran, for study, namely Lar National Park, Jajrud Protected Area with Sustainable Use of Natural Resource Areas, Tangeh Vashi National Natural Monument, and Kavdeh Wildlife Refuge (Figure 1 and Table 1). The selection was based on increasing unmanaged tourism activities in these areas, land use/land cover (LULC) changes, progressing urbanization, and the uncontrolled expansion of various physical and economic activities.

Figure 1.
Studied areas: (a) Iran and Tehran province, (b) Kavdeh Wildlife Refuge, (c) Tangeh Vashi National Natural Monument, (d) Jajrud Protected Area with Sustainable Use of Natural Resource Areas, (e) Lar National Park.

Table 1.
Geographical information of the four study areas in Tehran province, Iran.
Lar covers an area of 35,765 ha and is located about 70 km from Tehran. There are 405 plant species and 159 animal species know in this area [48].The predominant vegetation and animal species include pasture plants, as well as Ovis orientalis and Capra aegagrus. In addition, the main habitat of Salmo trutta fario can be found here, one of the rarest aquatic species in Iran [49,50]. Jajrud covers an area of about 74,811 ha and is located in the Tehran metropolis. In this area, 517 plant species have been identified, the most important of which are Astragalus species. As for animal species, O. orientalis and C. aegagrus are the most dominant [50,51]. Tangeh Vashi covers an area of 3650 ha and is located about 160 km from the metropolis of Tehran. The main animal species identified in Tangeh Vashi are O. orientalis and C. aegagrus. The dominant plant species is Ferula galbaniflua [52]. Kavdeh covers an area of 76,900 ha and is located in Firoozkooh city, 160 km from the Tehran metropolis. In this area, 405 plant species and 159 animal species have been identified, including O. orientalis, C. aegagrus, Panthera pardus saxicolor, and Canis lupus. The vegetation type is predominantly pasture plants and grasslands [17]. Figure 1 depicts the location of the studied areas.
2.2. Research Methods
2.2.1. General Framework
This study was survey-based, and data were collected from documentary and field studies. The present study consists of two parts: (1) the design and extraction of sustainable ecotourism indicators along physical–environmental, demographic–social, and economic–institutional dimensions; and (2) the evaluation of ecotourism sustainability levels based on the opinion of the local community. A cluster sampling method of community residents was performed, yielding 352 samples in Lar National Park, 382 samples in Jajrud Protected Area with Sustainable Use of Natural Resource Areas, 293 samples in Tangeh Vashi Tangeh Vashi National Natural Monument, and 341 samples in Kavdeh Wildlife Refuge. These samples were selected using Cochran’s formula with a confidence level of 95%. Table 2, Table 3 and Table 4 list 110 indicators accrued from a literature review and study of previous research. Indicators were selected considering various criteria, including their relevance, scientific precision, measurability, transparency, adaptability, comparability, cost efficiency, territorial representation, temporal representation, sensitivity, and communication [53,54]. Respondents were asked to rate their viewpoints and level of agreement on a Likert scale (“strongly agree = 5”, “agree = 4”, “neutral = 3”, “disagree = 2”, and “strongly disagree = 1”) as to the ecotourism sustainability in the studied areas. To achieve a consensus among the different views, we used the Delphi method, which has been widely applied in numerous tourism works focused on ecotourism indicators [25,55].
Table 2.
Sustainable ecotourism indicators in the environmental–physical dimension.
Table 3.
Sustainable ecotourism indicators in the demographic–social dimension.
Table 4.
Sustainable ecotourism indicators in the economic–institutional dimension.
Our list of ecotourism sustainability indicators includes the three physical–environmental, demographic–social, and economic–institutional dimensions across 22 variables, including 38 indicators in the environmental–physical dimension, 42 indicators in the demographic–social dimension, and 30 indicators in the economic–institutional dimension.
2.2.2. Delphi Method
The Delphi method is a structured process to predict and help in decision making to reach group consensus following multiple survey rounds [82,83]. It simplifies complex problems, especially when there is limited information and knowledge or disagreement in the studied field [84]. The main components of the Delphi method include consultation with a group of experts, controlled repetition and feedback, anonymity, analysis of results, and reaching consensus [85,86,87].
In our study, experts were selected from academia, encompassing related scientific fields such as environmental engineering, ecotourism, tourism management, geography, tourism planning, travel and tourism services, and hotel management. To identify and evaluate factors influencing sustainability levels, we queried 40 experts on 37 factors from the physical–environmental, demographic–social, and economic–institutional dimensions. Then, experts were asked to rate each factor on a five-point Likert scale to determine to what extent they agreed that these factors decreased sustainability.
The Delphi process consisted of three rounds. In the first two rounds, the same questionnaire was administered and then repeated. In the third round, responses were presented to participants, who were asked to evaluate and rate their initial responses. Altogether, 36 questionnaires were completed and analyzed. Finally, a consensus was reached in evaluating sustainability levels in the studied areas.
3. Results
3.1. Participant Demographics
Survey participants from local communities were mostly male and between 40 and 50 years old. A considerable percentage of local participants held a diploma (Table 5). Most participants had resided in their respective communities for more than 25 years. Among the respondents, most were between 30 and 40 years old (45%). In terms of education level, respondents had a high level of education; 20% had an M.Sc. degree, and 80% had a Ph.D. degree. Moreover, they were selected from among academics scientific fields, including 12% in environmental engineering, 30% in ecotourism, 20% in tourism management, 7% in geography and tourism planning, 18% in travel and tourism services, and 12% in tourism and hotel management.
Table 5.
Descriptive profile of survey respondents.
3.2. Evaluation of Ecotourism Sustainability Levels
The ecotourism sustainability levels for Lar National Park, Jajrud Protected Area with Sustainable Use of Natural Resource Areas, Tangeh Vashi National Natural Monument, and Kavdeh Wildlife Refuge were evaluated (Table 6). High ratings were achieved for most environmental–physical and demographic–social sustainability factors for Lar National Park, with a mean of 4.71 and 3.82, respectively (Table 6). That means that these factors contribute to high levels of sustainability in Lar National Park. Economic–institutional sustainability was rated most highly for Jajrud Protected Area with Sustainable Use of Natural Resource Areas, with a mean of 3.71. In Tangeh Vashi National Natural Monument, demographic–social dimensions were most important, although they achieved a mean of only 2.81 below the midpoint. In Kavdeh Wildlife Refuge, environmental–physical dimensions were thought to be most important, reaching a mean of 4.02. Overall, ecotourism sustainability levels in Lar National Park were rated to be the highest, with a mean of 4.01, whereas the opposite was the case for Tangeh Vashi National Natural Monument, reaching a mean of 2.34.
Table 6.
Evaluation of ecotourism sustainability levels in the studied areas.
3.3. Factors Decreasing Ecotourism Sustainability
As described above, the Delphi process was repeated across three rounds. The results of the first two rounds are presented in the Supplementary Files (Tables S1 and S2), whereas the results of round 3 are presented in Table 7. As demonstrated in Table S1, 38 and 36 indicators were extracted in the first and second round of the Delphi process, respectively (Table S2). In the first round, the following factors were removed: “existence of abundant water resources” and “a high number of restaurants and food stores” (Table S1). Likewise, in the second round, the factor “natural attractions exist” was removed from the questions (Table S2). In the third round, 35 factors were identified, including 16 factors in the environmental–physical dimension, 8 indicators in the demographic–social dimension, and 10 indicators in the economic–institutional dimension (Table 7). Table 7 shows the factors that have a negative impact on sustainability. In Lar National Park, the most problematic factor was livestock overgrazing, with a score of 4.22. In Jajrud Protected Area with Sustainable Use of Natural Resource Areas, the level of access to ways and roads caused the greatest issues, with a score of 4.48. In Tangeh Vashi National Natural Monument, an increased number of tourists and visitors was most problematic, reaching a score of 4.27. Finally, in Kavdeh Wildlife Refuge, low numbers of guard stations and environmental guardians impacted sustainability, with a score of 4.20.
Table 7.
List of factors impacting ecotourism sustainability levels in the studied areas.
4. Discussion
In the present study, we evaluated ecotourism sustainability, harnessing community opinion in different types of protected areas in Iran. Ecotourism achieved the highest levels of sustainability in Lar National Park. This national park is most protected because of the legal restrictions and prohibitions aligned with IUCN recommendations [88,89,90]. Accordingly, the main goal of national park management is to minimize the impacts of human activities, such as the development of ecotourism activities [2]. Consequently, visitation to this area is limited to the summer months. Entry and participation in ecotourism activities here requires a license from the Department of the Environment as the custodian of the areas. Another reason for the comparatively high sustainability levels is the long distance from human habitats, a low level of infrastructure and tourism services, a high number of guard stations and environmental guardians, high levels of monitoring and control of ecotourism activities, access restrictions, and limited development of ecotourism due to high levels of slope and altitude. These combined factors have led to increased sustainability levels in this area. Conversely, the main factor impacting on ecotourism sustainability here is livestock overgrazing by nomads (the number of livestock exceeds the capacity of pastures), which has decreased the volume of vegetation, especially of high-density pastures. For example, Törn et al. [91] confirmed the impacts of ecotourism activities on vegetation in the natural areas of Finland, and the results indicated that these impacts lead to delays in the restoration of vascular plant species. Other factors affecting the sustainability of ecotourism in this area include the area’s high potential for developing ecotourism activities; the existence of various famous tourist attractions; and uncontrolled movement of visitors for hunting, walking, mountaineering, and rock climbing. These findings have been confirmed by other studies [49,50,92,93,94], demonstrating the significant issues associated with the development of human activities and insufficient protection of the ecological sensitivity of this area.
Conversely, ecotourism sustainability was lowest in the Tangeh Vashi National Natural Monument because of the lack of monitoring of the entry of visitors, especially on weekends and holidays, permitting large numbers of visitors access. Furthermore, the lack of adequate tourism infrastructure led to a decrease in sustainability, increased habitat destruction, and the extinction of valuable species in this area. High levels of tourism activities and their impacts on vegetation considered important in this area include horse riding, vehicles being driven off-road, trampling, erosion and short cutting, soil compaction, disturbance, changes to hydrology, and increased direct vegetation clearance. For example, Pickering et al. [95] showed that horse riding was a critical issue for vegetation conservation and ecotourism sustainability. Horse riding negatively impacts ecosystem sustainability, principally through trampling, resulting in loss of vegetation, erosion, and changes to hydrology [95,96]. In contrast to the studied national park and national natural monument, human activities have not been controlled well in Tangeh Vashi National Natural Monument [89,90], leading to an increasing influx of visitors without a sufficient monitoring system in place to protect the many historical, natural, and cultural attractions. Additionally, soil compaction, disturbance, and erosion are all well-documented adverse effects of ecotourism use due to trampling [97,98]. Other studies have confirmed these findings [72,99,100]. The results indicate that the continued human exploitation of this area will lead to increased unsustainability and the destruction of valuable national resources.
The Jajrud Protected Area with Sustainable Use of Natural Resource Areas is located within the city limits and is fully exposed to population growth, expanding urbanization, an increase in physical and economic activities, development of tourism activities, short distance from human habitats, extended annual periods of ecotourism activities, and increasing visits to the area. The presence of humans in and around the protected areas has often threatened their effectiveness, in some cases causing ecosystem decline despite the protected status [101,102]. Sustainability levels have decreased considerably because of poor management and development of physical and economic activities. High levels of access to ways and road, high levels of human activities, and LULC changes are particularly problematic. These findings have been confirmed by other studies [50,51,94,103], which revealed that the development of human activities, especially economic exploitation by various organizations and ecotourism activities, has led to the extinction of species and decreased biodiversity in this area.
Finally the Kavdeh Wildlife Refuge area suffers from insufficient numbers of guard stations and environmental guardians; a lack of necessary protective equipment for the monitoring of ecotourism activities; and the presence of hunters, which has led to increased poaching and threat to animal species. Similar to our results, interviews with protected area managers of 93 protected areas globally suggested that only one factor was significantly correlated with protected areas’ ability to deter habitat change: the density of guards in the protected area [104]. Kavdeh Wildlife Refuge reached the highest levels of sustainability behind Lar National Park. These findings have been confirmed by other studies [17,105]. The most important factor affecting sustainability in this area is the low number of guard stations and environmental guardians, which is a particular problem, considering the high levels of poaching, even in areas dedicated as wildlife refuges.
Despite some limitations, our findings provide a good starting point for further research on various types of protected areas. It is suggested to use the same indicators with MCDA methodologies (e.g., TOPSIS, fuzzy TOPSIS, fuzzy AHP, and fuzzy ANP) to compare the results.
5. Conclusions
Identifying and evaluating factors influencing sustainability can assist protected area managers in the proper planning and development of sustainable ecotourism operations [41,106]. In the present study, we evaluated and analyzed ecotourism sustainability in four different protected areas in Iran. Sustainability indicators can be used for decision making and to prioritize strategies for medium- and long-term planning of ecotourism in protected areas. Our results demonstrate that ecotourism consists of opportunities and threats for protected areas. A lack of proper planning and insufficient monitoring in our study areas led to a decrease in sustainability. The level of decrease depends on the type of protected area; protected areas that were more restricted in their use achieved higher levels of sustainability. According to the IUCN, various protected areas have specific management objectives and need to achieve multiple goals (education, research, conservation, and recreation). Accordingly, the development of sustainable ecotourism in protected areas needs to consider the quality of visitor experience; the quality of life of the local community; protection of natural resources; and the balance between the needs of the local community, visitors, and the environment. Overall, ecotourism sustainability levels in Lar National Park were rated to be the highest, with a mean of 4.01. Therefore, restrictions in Tangeh Vashi National Natural Monument (total mean of ecotourism sustainability level = 2.34) and Jajrud Protected Area with Sustainable Use of Natural Resource Areas (total mean of ecotourism sustainability level = 3.00) are needed to protect the tremendous ecological sensitivity and significance of these areas.
The results of this study highlight the importance of classifications of protected areas in association with different levels of management and intervention. For example, development of ecotourism in national parks and natural monuments needs to be small-scale (extensive tourism) and well monitored because of the high ecological sensitivity and value of these areas. Other protected areas, such as wildlife refuges, might accommodate larger-scale developments (intensive tourism), noting that such development brings decreased levels of sustainability.
Supplementary Materials
The following supporting information can be downloaded at: https://www.mdpi.com/article/10.3390/f13050740/s1, Table S1. List of factors affecting decrease in sustainability in these areas (results of round 1 of Delphi method), Table S2. List of factors affecting decrease in sustainability in these areas (results of round 2 of Delphi method).
Author Contributions
Conceptualization, P.S. and H.E.; methodology, P.S., H.E. and S.M.M.S.; software, P.S.; validation, P.S. and H.E.; formal analysis, P.S., H.E. and S.M.M.S.; investigation, P.S. and H.E.; data curation, P.S. and H.E.; visualization, S.M.M.S.; writing—original draft preparation, P.S.; writing—review and editing, S.M.M.S., M.V.M. and I.D.W.; supervision, H.E., S.M.M.S. and M.V.M.; funding acquisition, S.M.M.S. and M.V.M. All authors have read and agreed to the published version of the manuscript.
Funding
This research received no external funding.
Data Availability Statement
The data that support the findings of this study are available from the corresponding author (H.E.) upon reasonable request.
Acknowledgments
Seyed Mohammad Moein Sadeghi’s research at Transilvania University of Brasov, Romania, was supported by the program entitled “Transilvania Fellowship for Postdoctoral Research/Young Researchers”.
Conflicts of Interest
The authors declare no conflict of interest. The views expressed are strictly those of the authors and do not necessarily represent the positions or policies of their respective institutions.
References
- Dudley, N. Guidelines for Applying Protected Area Management Categories; IUCN: Gland, Switzerland, 2008. [Google Scholar]
- IUCN World Commission on Protected Areas. Establishing Resilient Marine Protected Area Networks—Making It Happen; IUCN: Gland, Switzerland, 2008. [Google Scholar]
- Valdivieso, J.C.; Eagles, P.F.; Gil, J.C. Efficient management capacity evaluation of tourism in protected areas. J. Environ. Plan. Manag. 2015, 58, 1544–1561. [Google Scholar] [CrossRef]
- United Nations World Tourism Organization (UNWTO). Tourism and the Sustainable Development Goals—Journey to 2030; UNWTO: Madrid, Spain, 2017. [Google Scholar]
- Lee, T.H.; Jan, F.-H. Can community-based tourism contribute to sustainable development? Evidence from residents’ perceptions of the sustainability. Tour. Manag. 2019, 70, 368–380. [Google Scholar] [CrossRef]
- Honey, M. Ecotourism and Sustainable Development: Who Owns Paradise; Island Press: Washington, DC, USA, 2008. [Google Scholar]
- Ambe, T.; Tsi, E.; Chi, G.; Siri, B.; Tita, D. Ecological Tourism and Cameroon—Opportunities and Threats. In Ecotourism: Development, Management and Impact; Krause, A., Weir, E., Eds.; Nova Science Publishers: Hauppauge, NY, USA, 2010; pp. 113–133. [Google Scholar]
- Snyman, S. The Impact of Ecotourism Employment on Rural Household Incomes and Social Welfare in Six Southern African Countries. Tour. Hosp. Res. 2014, 14, 37–52. [Google Scholar] [CrossRef]
- Marion, J.L.; Reid, S.E. Minimising Visitor Impacts to Protected Areas: The Efficacy of Low Impact Education Programmes. J. Sustain. Tour. 2007, 15, 5–27. [Google Scholar] [CrossRef]
- Pearce, J.; Dowling, R. Monitoring the quality of the visitor experience: An evolutionary journey. J. Outdoor Recreat. Tour. 2019, 25, 87–90. [Google Scholar] [CrossRef]
- Wang, S.-H.; Lee, M.-T.; Château, P.-A.; Chang, Y.-C. Performance Indicator Framework for Evaluation of Sustainable Tourism in the Taiwan Coastal Zone. Sustainability 2016, 8, 652. [Google Scholar] [CrossRef] [Green Version]
- Björk, P. Definition Paradoxes: From Concept to Definition. In Critical Issues in Ecotourism: Understanding a Complex Tourism Phenomenon; Higham, J., Ed.; Elsevier: Oxford, UK; Burlington, NJ, USA, 2007; pp. 23–45. [Google Scholar]
- Chan, R.; Bhatta, K.D. Ecotourism Planning and Sustainable Community Development: Theoretical Perspectives for Nepal. South Asian J. Tour. Herit. 2013, 6, 69–96. [Google Scholar]
- Backman, K.F.; Munanura, I. Introduction to the special issues on ecotourism in Africa over the past 30 years. J. Ecotourism 2015, 14, 95–98. [Google Scholar] [CrossRef]
- Diamantis, D. Stakeholder ecotourism management: Exchanges, coordination’s and adaptations. J. Ecotourism 2018, 17, 203–205. [Google Scholar] [CrossRef] [Green Version]
- Zhong, L.; Wang, J. Investigation and Analysis on Situation of Ecotourism Development in Protected Areas of China. Acta Ecol. Sin. 2011, 31, 7450–7457. [Google Scholar]
- Department of Environment of Tehran. Natural Environment and Biodiversity, Habitat and Regionals Affairs Office; Department of Environment of Tehran: Tehran, Iran, 2019.
- Weaver, D.B. Reflections on sustainable tourism and paradigm change. In Sustainable Tourism Futures Perspectives on Systems, Restructuring and Innovations; Gössling, S., Hall, C.M., Weaver, D.B., Eds.; Routledge: London, UK; New York, NJ, USA, 2009; pp. 33–40. [Google Scholar]
- Koens, J.F.; Dieperink, C.; Miranda, M. Ecotourism as a development strategy: Experiences from Costa Rica. Environ. Dev. Sustain. 2009, 11, 1225–1237. [Google Scholar] [CrossRef] [Green Version]
- Mondino, E.; Beery, T. Ecotourism as a learning tool for sustainable development. The Case of Monviso Transboundary Biosphere Reserve, Italy. J. Ecotourism 2019, 18, 107–121. [Google Scholar] [CrossRef]
- Mckercher, B. Academia and the Evolution of Ecotourism. Tour. Recreat. Res. 2010, 35, 15–26. [Google Scholar] [CrossRef]
- Walter, P.G. Theorising visitor learning in ecotourism. J. Ecotour. 2013, 12, 15–32. [Google Scholar] [CrossRef]
- Jamaliah, M.M.; Powell, R.B. Ecotourism resilience to climate change in Dana Biosphere Reserve, Jordan. J. Sustain. Tour. 2018, 26, 519–536. [Google Scholar] [CrossRef]
- UNEP; WTO. Making Tourism More Sustainable. In A Guide for Policy Makers; WTO: Paris, France, 2005. [Google Scholar]
- Lee, T.H.; Hsieh, H.-P. Indicators of sustainable tourism: A case study from a Taiwan’s wetland. Ecol. Indic. 2016, 67, 779–787. [Google Scholar] [CrossRef]
- Hoernig, H.; Seasons, M. Monitoring of indicators in local and regional planning practice: Concepts and issues. Plan. Pract. Res. 2004, 19, 81–99. [Google Scholar] [CrossRef]
- Edén, M.; Falkheden, L.; Malbert, B. The Built Environment and Sustainable Development: Research Meets Practice in a Scandinavian Context. Plan. Theory Prac. 2000, 1, 260–272. [Google Scholar]
- Yoon, Y.; Gursoy, D.; Chen, J.S. Validating a tourism development theory with structural equation modeling. Tour. Manag. 2001, 22, 363–372. [Google Scholar] [CrossRef]
- Choi, H.C.; Sirakaya, E. Sustainability indicators for managing community tourism. Tour. Manag. 2006, 27, 1274–1289. [Google Scholar] [CrossRef]
- Bhuiyan, M.; Hossain, A.; Siwar, C.; Ismail, S.M. Sustainability Measurement for Ecotourism Destination in Malaysia: A Study on Lake Kenyir, Terengganu. Soc. Indic. Res. 2016, 128, 1029–1045. [Google Scholar] [CrossRef]
- Brun, G.; Hadorn, G.H. Ranking policy options for sustainable development. Poiesis Prax. 2008, 5, 15–31. [Google Scholar] [CrossRef]
- Pérez, V.; Guerrero, F.; González, M.; Pérez, F.; Caballero, R. Composite indicator for the assessment of sustainability: The case of Cuban nature-based tourism destinations. Ecol. Indic. 2013, 29, 316–324. [Google Scholar] [CrossRef]
- Vila, M.; Costa, G.; Rovira, X. The creation and use of scorecards in tourism planning: A Spanish example. Tour. Manag. 2010, 31, 232–239. [Google Scholar] [CrossRef]
- UNWTO. Compendium of Tourism Statistics: Data 2008–2012; UNWTO: Madrid, Spain, 2012. [Google Scholar]
- Fernández, J.I.P.; Rivero, M.S. Measuring Tourism Sustainability: Proposal for a Composite Index. Tour. Econ. 2009, 15, 277–296. [Google Scholar] [CrossRef] [Green Version]
- Zamfir, A.; Corbos, R.-A. Towards Sustainable Tourism Development in Urban Areas: Case Study on Bucharest as Tourist Destination. Sustainability 2015, 7, 12709–12722. [Google Scholar] [CrossRef] [Green Version]
- Tudorache, D.M.; Simon, T.; Frent, C.; Musteaţă-Pavel, M. Difficulties and Challenges in Applying the European Tourism Indicators System (ETIS) for Sustainable Tourist Destinations: The Case of Braşov County in the Romanian Carpathians. Sustainability 2017, 9, 1879. [Google Scholar] [CrossRef] [Green Version]
- Avelino, J.E.; Sasaki, J.; Esteban, M.; Salah, P.; Jamero, M.L.; Valenzuela, V.P. Sustainability Evaluation of Marine Protected Areas Index (SEMPAI): A multi-criteria decision-making method to determine the effectiveness of the El Nido-Taytay Managed Resource Protected Area. Ocean Coast. Manag. 2019, 181, 104891. [Google Scholar] [CrossRef]
- Ocampo, L.; Ebisa, J.A.; Ombe, J.; Escoto, M.G. Sustainable Ecotourism Indicators with Fuzzy Delphi Method—A Philippine Perspective. Ecol. Indic. 2018, 93, 874–888. [Google Scholar] [CrossRef]
- Agyeiwaah, E.; McKercher, B.; Suntikul, W. Identifying Core Indicators of Sustainable Tourism: A Path Forward? Tour. Manag. Perspect. 2017, 24, 26–33. [Google Scholar] [CrossRef]
- Ristić, D.; Vukoičić, D.; Milinčić, M. Tourism and Sustainable Development of Rural Settlements in Protected Areas-Example NP Kopaonik (Serbia). Land Use Policy 2019, 89, 104231. [Google Scholar] [CrossRef]
- Blackstock, K.L.; White, V.; McCrum, G.; Scott, A.; Hunter, C. Measuring Responsibility: An Appraisal of a Scottish National Park’s Sustainable Tourism Indicators. J. Sustain. Tour. 2008, 16, 276–297. [Google Scholar] [CrossRef]
- Castellani, V.; Sala, S. Sustainable performance index for tourism policy development. Tour. Manag. 2010, 31, 871–880. [Google Scholar] [CrossRef]
- Cerradelo, L.B.; Gueimonde-Canto, A.; Brea, J.A.F.; Diéguez-Castrillón, M.I. Dimensions of destination competitiveness: Analyses of protected areas in Spain. J. Clean. Prod. 2018, 177, 782–794. [Google Scholar] [CrossRef]
- Jamal, T.; Stronza, A. Collaboration theory and tourism practice in protected areas: Stakeholders, structuring and sustainability. J. Sustain. Tour. 2009, 17, 169–189. [Google Scholar] [CrossRef]
- Zhang, X.; Zhong, L.; Yu, H. Sustainability assessment of tourism in protected areas: A relational perspective. Glob. Ecol. Conserv. 2022, 35, e02074. [Google Scholar] [CrossRef]
- Hasana, U.; Swain, S.K.; George, B. A bibliometric analysis of ecotourism: A safeguard strategy in protected areas. Reg. Sustain. 2022, 3, 27–40. [Google Scholar] [CrossRef]
- Sobhani, P.; Esmaeilzadeh, H.; Barghjelveh, S.; Sadeghi, S.M.M.; Marcu, M.V. Habitat Integrity in Protected Areas Threatened by LULC Changes and Fragmentation: A Case Study in Tehran Province, Iran. Land 2021, 11, 6. [Google Scholar] [CrossRef]
- Department of the Environment of Iran. Lar National Park Environmental Management Plan; Department of the Environment of Iran: Tehran, Iran, 2003.
- Department of the Environment of Iran. Jajrud Collection Management Plan; Department of the Environment of Iran: Tehran, Iran, 2012.
- Department of the Environment of Iran. Jajroud Collection Management Plan; Department of the Environment of Iran: Tehran, Iran, 2001.
- Department of the Environment of Iran. Tangeh Vashi National Natural Monument Management Plan; Department of the Environment of Iran: Tehran, Iran, 2014.
- Bell, S.; Morse, S. Breaking through the Glass Ceiling: Who Really Cares about Sustainability Indicators? Local Environ. 2001, 6, 291–309. [Google Scholar] [CrossRef]
- White, C.; Turoff, M.; Van de Walle, B. A Dynamic Delphi Process Utilizing a Modified Thurstone Scaling Method: Collaborative Judgment in Emergency Response. Proc. ISCRAM 2007, 4, 13–16. [Google Scholar]
- Barzekar, G.; Aziz, A.; Mariapan, M.; Ismail, M.H. Delphi Technique for Generating Criteria and Indicators in Monitoring Ecotourism Sustainability in Northern Forests of Iran: Case Study on Dohezar and Sehezar Watersheds. Folia For. Pol. 2011, 53, 130–141. [Google Scholar]
- Butler, R.W. Sustainable tourism: A state-of-the-art review. Tour. Geogr. 1999, 1, 7–25. [Google Scholar] [CrossRef] [Green Version]
- Innes, J.E.; Booher, D.E. Indicators for Sustainable Communities: A Strategy Building on Complexity Theory and Distributed Intelligence. Plan. Theory Pract. 2000, 1, 173–186. [Google Scholar] [CrossRef]
- Miller, G. The development of indicators for sustainable tourism: Results of a Delphi survey of tourism researchers. Tour. Manag. 2001, 22, 351–362. [Google Scholar] [CrossRef] [Green Version]
- Ceron, J.-P.; Dubois, G. Tourism and Sustainable Development Indicators: The Gap between Theoretical Demands and Practical Achievements. Curr. Issues Tour. 2003, 6, 54–75. [Google Scholar] [CrossRef]
- Dhakal, S.; Imura, H. Policy-Based Indicator Systems: Emerging Debates and Lessons. Local Environ. 2003, 8, 113–119. [Google Scholar] [CrossRef]
- Ko, T.G. Development of a tourism sustainability assessment procedure: A conceptual approach. Tour. Manag. 2005, 26, 431–445. [Google Scholar] [CrossRef]
- Van der Duim, R.; Van Marwijk, R. The Implementation of an Environmental Management System for Dutch Tour Operators: An Actor-Network Perspective. J. Sustain. Tour. 2006, 14, 449–472. [Google Scholar] [CrossRef]
- White, V.; McCrum, G.; Blackstock, K.; Scott, A. Indicators and Sustainable Tourism: Literature Review; Macaulay Institute: Aberdeen, UK, 2006. [Google Scholar]
- Liu, C. A Study on Sustainable Development Evaluation Indictors in Alishan’s Dabang Ecotourism Destination. J. Tour. Stud. 2007, 13, 235–264. [Google Scholar]
- Schianetz, K.; Kavanagh, L. Sustainability Indicators for Tourism Destinations: A Complex Adaptive Systems Approach Using Systemic Indicator Systems. J. Sustain. Tour. 2008, 16, 601–628. [Google Scholar] [CrossRef]
- Lee, T.H. A Structural Model to Examine How Destination Image, Attitude, and Motivation Affect the Future Behavior of Tourists. Leis. Sci. 2009, 31, 215–236. [Google Scholar] [CrossRef]
- Chávez-Cortés, M.; Maya, J.A.A. Identifying and Structuring Values to Guide the Choice of Sustainability Indicators for Tourism Development. Sustainability 2010, 2, 3074–3099. [Google Scholar] [CrossRef] [Green Version]
- Blancas, F.J.; Lozano, M.G.; González, M.; Guerrero, F.M.; Caballero, R. How to use sustainability indicators for tourism planning: The case of rural tourism in Andalusia (Spain). Sci. Total Environ. 2011, 412–413, 28–45. [Google Scholar] [CrossRef] [PubMed]
- Lozano, M.G.; Blancas, F.J.; González, M.; Caballero, R. Sustainable tourism indicators as planning tools in cultural destinations. Ecol. Indic. 2012, 18, 659–675. [Google Scholar] [CrossRef]
- Salerno, F.; Viviano, G.; Manfredi, E.C.; Caroli, P.; Thakuri, S.; Tartari, G. Multiple Carrying Capacities from a management-oriented perspective to operationalize sustainable tourism in protected areas. J. Environ. Manag. 2013, 128, 116–125. [Google Scholar] [CrossRef] [PubMed]
- Tanguay, G.A.; Rajaonson, J.; Therrien, M.-C. Sustainable tourism indicators: Selection criteria for policy implementation and scientific recognition. J. Sustain. Tour. 2013, 21, 862–879. [Google Scholar] [CrossRef] [Green Version]
- Asian Development Bank. Regional State of the Coral Triangle. Coral Triangle Marine Resources: Their Status, Economies, and Management; Asian Development Bank: Tokyo, Japan, 2014. [Google Scholar]
- Torres-Delgado, A.; Palomeque, F.L. Measuring sustainable tourism at the municipal level. Ann. Tour. Res. 2014, 49, 122–137. [Google Scholar] [CrossRef]
- Global Footprint Network, National Footprint Accounts. Available online: http://www.footprintnetwork.org/en/index.php/GFN/page/licenses1/ (accessed on 10 August 2021).
- The World Bank. The World Bank Indicators; The World Bank: Washington, WA, USA, 2015. [Google Scholar]
- Blancas, F.J.; Lozano-Oyola, M.; González, M. A European Sustainable Tourism Labels proposal using a composite indicator. Environ. Impact Assess. Rev. 2015, 54, 39–54. [Google Scholar] [CrossRef]
- Laurila-Pant, M.; Lehikoinen, A.; Uusitalo, L.; Venesjärvi, R. How to Value Biodiversity in Environmental Management? Ecol. Indic. 2015, 55, 1–11. [Google Scholar] [CrossRef] [Green Version]
- Mascarenhas, A.; Nunes, L.M.; Ramos, T.B. Selection of sustainability indicators for planning: Combining stakeholders’ participation and data reduction techniques. J. Clean. Prod. 2015, 92, 295–307. [Google Scholar] [CrossRef]
- Huang, Y.; Coelho, V.R. Sustainability performance assessment focusing on coral reef protection by the tourism industry in the Coral Triangle region. Tour. Manag. 2017, 59, 510–527. [Google Scholar] [CrossRef]
- Zhang, H.Q.; Fan, D.X.F.; Tse, T.S.M.; King, B. Creating a scale for assessing socially sustainable tourism. J. Sustain. Tour. 2017, 25, 61–78. [Google Scholar] [CrossRef] [Green Version]
- European Commission. The European Tourism Indicator System: Toolkit for Sustainable Destinations; European Union: Luxembourg, 2013. [Google Scholar]
- Dunham, R.B. The Delphi Technique. Available online: http://www.slais.ubc.ca/resources/researchmethods/group.htm (accessed on 17 February 2022).
- Kennedy, H.P. Enhancing Delphi research: Methods and results. J. Adv. Nurs. 2004, 45, 504–511. [Google Scholar] [CrossRef] [PubMed]
- Okoli, C.; Pawlowski, S.D. The Delphi method as a research tool: An example, design considerations and applications. Inf. Manag. 2004, 42, 15–29. [Google Scholar] [CrossRef] [Green Version]
- Windle, P.E. Delphi technique: Assessing component needs. J. PeriAnesthesia Nurs. 2004, 19, 46–47. [Google Scholar] [CrossRef] [PubMed]
- Chu, H.-C.; Hwang, G.-J. A Delphi-based approach to developing expert systems with the cooperation of multiple experts. Expert Syst. Appl. 2008, 34, 2826–2840. [Google Scholar] [CrossRef]
- Moradi, F.; Darvishsefat, A.A.; Pourrahmati, M.R.; Deljouei, A.; Borz, S.A. Estimating Aboveground Biomass in Dense Hyrcanian Forests by the Use of Sentinel-2 Data. Forests 2022, 13, 104. [Google Scholar] [CrossRef]
- Eidsvik, H. National Parks Planning Process. Parks 1997, 2, 8–12. [Google Scholar]
- Majnonian, H. Instructions for Preparing of Management Plan in PAs; Publications of the Management and Planning Organization: Tehran, Iran, 2002. [Google Scholar]
- Majnonian, H. National Parks Planning (Park Management, Planning of National Parks and PAs. A Manual with Annotated Examples; Publications of Day Negar: Tehran, Iran, 2015. [Google Scholar]
- Törn, A.; Rautio, J.; Norokorpi, Y.; Tolvanen, A. Revegetation after Short-Term Trampling at Subalpine Heath Vegetation. In Annales Botanici Fennici; Finnish Zoological and Botanical Publishing Board: Helsinki, Finland, 2006; pp. 129–138. [Google Scholar]
- Karobi, M.; Yavari Gohar, F.; Sarkheil, R. The Impact of Eco-tourism Culture in Conservation of National Parks (Case Study: Lar National Park). Tour. Manag. Stud. 2019, 14, 25–56. [Google Scholar]
- Haji Mirzaei, A.; Ghelichi Pour, Z. Development of Sustainable Tourism Indicator in Protected Area of Iran (Case Study: Lar National Parks); University of Knowledge and Culture: Tehran, Iran, 2018. [Google Scholar]
- Sobhani, P.; Esmaeilzadeh, H.; Sadeghi, S.M.M.; Marcu, M.V. Estimation of Ecotourism Carrying Capacity for Sustainable Development of Protected Areas in Iran. Int. J. Environ. Res. Public Health 2022, 19, 1059. [Google Scholar] [CrossRef]
- Pickering, C.M.; Harrington, J.; Worboys, G. Environmental Impacts of Tourism on the Australian Alps Protected Areas. Mt. Res. Dev. 2003, 23, 247–254. [Google Scholar] [CrossRef] [Green Version]
- Tighmand, S.; Karam, A.; Ghanavati, E. Explain the Capabilities and Tourism Management of Geosites Based on the Assessment of Diversity Areas Land (Case Study: Vashi Strait Tourist Area in Firoozkooh City). J. App. Res. Geograph. Sci. 2021, 65, 303–323. [Google Scholar]
- Buckley, R.B.; Pickering, C.M.; Warnken, J. Environmental Management for Alpine Tourism and Resorts in Australia. In Tourism and Development in Mountain Regions; Godde, P.M., Price, M.F., Zimmermann, F.M., Eds.; CABI Publishing: Oxon, UK, 2000; pp. 27–45. [Google Scholar]
- Edwards, I.J. The Ecological Impact of Pedestrian Traffic on Alpine Vegetation in Kosciusko National Park. Aust. For. 1977, 40, 108–120. [Google Scholar] [CrossRef]
- Sayadi, F.; Moghadasi, R. Economic Valuation of Environmental Climate (Case Study of Vashi Strait and Savashi Waterfall Tourism Area in Firoozkooh County). J. Renew. Nat. Resour. Res. 2011, 3, 34–43. [Google Scholar]
- Deljouei, A.; Sadeghi, S.M.M.; Abdi, E.; Bernhardt-Römermann, M.; Pascoe, E.L.; Marcantonio, M. The impact of road disturbance on vegetation and soil properties in a beech stand, Hyrcanian forest. Eur. J. For. Res. 2018, 137, 759–770. [Google Scholar] [CrossRef]
- Harris, P.G. Environmental Policy and Sustainable Development in China: Hong Kong in Global Context; University of Bristol Policy Press: Bristol, UK, 2012. [Google Scholar]
- Liu, J.; Linderman, M.; Ouyang, Z.; An, L.; Yang, J.; Zhang, H. Ecological Degradation in Protected Areas: The Case of Wolong Nature Reserve for Giant Pandas. Science 2001, 292, 98–101. [Google Scholar] [CrossRef] [Green Version]
- Danehkar, A.; Jafari, S. Degradation Assessment of Jajrood Protected Area Using Landscape Degradation Model. J. RS GIS Natural Resour. 2017, 8, 17–32. [Google Scholar]
- Bruner, A.G.; Gullison, R.E.; Rice, R.E.; da Fonseca, G.A.B. Effectiveness of Parks in Protecting Tropical Biodiversity. Science 2001, 291, 125–128. [Google Scholar] [CrossRef] [Green Version]
- Majnonian, H.; Ghoshtasb, H. Lundville Wildlife Refuge Environmental Planning; Publications of the Department of Environment of Iran: Tehran, Iran, 2003.
- Oviedo-García, M.; Vega-Vázquez, M.; Castellanos-Verdugo, M.; Orgaz-Agüera, F. Tourism in protected areas and the impact of servicescape on tourist satisfaction, key in sustainability. J. Destin. Mark. Manag. 2019, 12, 74–83. [Google Scholar] [CrossRef]
Publisher’s Note: MDPI stays neutral with regard to jurisdictional claims in published maps and institutional affiliations. |
© 2022 by the authors. Licensee MDPI, Basel, Switzerland. This article is an open access article distributed under the terms and conditions of the Creative Commons Attribution (CC BY) license (https://creativecommons.org/licenses/by/4.0/).