Abstract
In-forest drying of roundwood and biomass (residues) can result in more efficient transport operations from an economical and environmental perspective. On the negative side, in-forest drying may result in dry matter losses (DML), impacting the quantity and quality of residues delivered to energy plants. This paper investigated the impact of roundwood and residues in-forest drying and DML on supply chain costs and Greenhouse Gas (GHG) emissions. For the assessment, a short-term optimization planning tool was applied to a supply chain located in Asturias, Spain, consisting of fourteen supply points and two demand points: A pulp mill (demanding roundwood) and a power plant (demanding residues). Four scenarios were included in the analysis comprising different combinations of DML for roundwood and residues resulting from in-forest drying. Our results indicate that in scenarios that include in-forest drying and DML, the negative economic effects are offset by the substantial reductions in transport costs and GHG emissions. In-forest drying of roundwood and residues without DML can result in a 6.5% reduction in supply chain costs, 14.9% fewer truckloads to destination points, and 18.1% less fuel consumption and GHG emissions.
1. Introduction
The delivery of roundwood and biomass (residues) with a high MC (Moisture Content) from the forest to end customers can significantly impact transport costs. This is because wood is approximately 50–55% water by weight when freshly felled, which means that a substantial proportion of delivered costs pays for the transportation of water. To face this issue, many companies worldwide have commenced establishing programs to manage and control MC through the supply chain [1,2,3,4]. For example, a study conducted in Tasmania, Australia, concluded that decreasing the MC of Eucalyptus nitens pulp logs from 60% to 52% has the potential to reduce transportation costs by up to $2–3 per tonne and the number of truckloads by at least 20% [5]. Moreover, because of the increasing shipping costs, overseas customers demand products with stringent requirements regarding the MC of the products to be delivered/exported. In the case of wood biomass, MC is the most critical quality attribute; it affects the heating value, storage properties, transport costs, and the price of the fuel [1,6]. Industrial boilers require wood biomass with an MC below 50% MC (dry basis) to operate efficiently as the heating value of this material increases as MC decreases [2]. Dealing with these requirements may require the drying and storage of large quantities of roundwood and biomass in the yard for long periods, especially during the winter season. Hence, yard management planning is crucial to avoid negative impacts on the efficiency and economics of logistics activities performed by heavy equipment such as sorting and handling [7].
In the Southern Hemisphere and parts of the Iberian Peninsula, some forest growers owning short-rotation Eucalyptus globulus, Eucalyptus nitens, and Pinus radiata plantations have commenced implementing in-forest drying programs of roundwood and biomass before their transport to pulp mills and energy plants. Consequently, drying trials have been established, and predictive drying models have been developed for these species [2,8,9]. It has become more common for residues from integrated harvest operations to be collected, dried, and transported to biomass plants for steam, heat, and electricity generation [10,11]. For example, in Northern Spain, approximately 40% of the residues are transported as bundles from forest coupes to end customers or logistics terminals where they are stored to meet MC requirements. This is considered an effective option, especially when the bundles need to be transported to large energy plants for long distances [3,12].
From a procurement and logistics point of view, some tradeoffs need to be considered when implementing MC management strategies for roundwood and biomass delivered to pulp and energy plants. On the negative side, in-forest drying, storage, and handling of forest residues can result in high DML, which affects the quantity and quality of the biomass delivered to energy plants [13]. These weight losses can be caused either by microbial activity, most commonly fungal attacks (biological losses), or spillage of material during handling and storage (technical losses) [14]. During storage, biological losses will depend on the raw material properties and the storage conditions [15], while technical losses are affected by the methods and machinery used for handling, comminution, and transport [16]. In the case of Nordic countries and Northern Spain, biomass bundlers are commonly used to collect, compress, and bind forest residues of conifers (e.g., Picea abies) and hardwood (e.g., Eucalyptus globulus) species [17,18]. Substantial DML can occur during the handling, storage, and transport of the residues. In Sweden, DML of up to 18.1.% has been reported for compacted logging residues (bundles) [16], while in Finland, DML of up to 24% (3% per month over a period of 8 months) have been reported in experimental studies conducted with piles of residues placed on racks [14]. It is known that the storage of logs of Eucalyptus globulus and particularly Eucalyptus nitens can result in severe splitting [19]; also, some studies have reported different levels of shrinkage during the drying of sawn wood for a few Eucalyptus hybrid species [20]. However, there is a shortage of studies that have investigated the impact of air-drying on DML of Eucalyptus logs and residues. One study conducted on energy plantations of Eucalyptus spp. in Italy reported DML for logs of 1% per month [21], with a similar mass loss estimated for wood chips stored outdoors in Sweden [22]. Furthermore, data from unpublished reports, anecdotal evidence, and personal communications with forest operators and harvesting managers indicate that DML of up to 6–12% per year might be expected after drying Eucalyptus globulus and Eucalyptus nitens logs. In addition to the impact on DML, several studies have reported the potential negative impact of reduced MC (due to drying) on the costs and energy consumption associated with the chipping of pulp logs, and comminution of forest residues [23,24,25,26].
On the positive side associated with better MC management of roundwood and biomass, in-forest drying results in more efficient transport operations and increased calorific values of the biomass delivered to energy plants [27]. The transport of roundwood and biomass with a reduced MC increases the volumetric capacity of the trucks. This, in turn, results in fewer round trips, a reduced fleet size, and less fuel consumption and GHG emissions released into the atmosphere [3,5,28]. In the latter case, some studies have emphasized that improving and optimizing transport logistics and the location of energy plants is critical to reducing GHG emissions [28,29,30,31,32]. Other studies have also investigated the relationship between MC and GHG emissions. For example, in Austria, Kanzian et al. [33] reported that on a per-dry-tonne basis, reducing MC from 40% to 30% can save approximately 4% of GHG emissions associated with the transport of biomass to energy plants. In several studies, supply chain optimization tools that combine spatial modeling with Life Cycle Assessment (LCA) methodologies have been implemented to quantify and assess the economics of transport operations and their environmental impacts. In these studies, GHG emissions have been used as a critical indicator of environmental performance [26,27,34,35,36].
Only a few previous articles have included MC curves as explicit parameters in optimization models such as the one presented in our study. For example, Acuna et al. [1] developed a non-spatial linear programming decision support system called BIOPLAN, which was applied in a case study in Finland. The authors investigated the effect of MC on storage, chipping, and transportation costs of biomass material delivered to the energy plant under different MC constraints, supply chain, and biomass covering scenarios. Later, Ghaffariyan et al. [10] and Sosa et al. [37] extended the BIOPLAN model to analyze wood and biomass supply chains in Australia and Ireland, respectively. Recently, optimization modelling has been employed to compare the impact of roadside drying of Pinus radiata D. Don logs and logging residues on delivered costs using high-capacity trucks in Australia [38]. However, a comprehensive literature review of the above scientific articles has revealed a lack of studies that analyze optimal drying strategies (including DML) and compared them with scenarios that exclude roundwood and biomass drying, particularly in short-rotation Eucalyptus plantations. In addition, our study expands the knowledge regarding the economic (supply chain costs), operational (tonnage delivered and truckloads), and environmental (fuel consumption and GHG emissions) impacts that result from MC reductions and subsequent roundwood and biomass DML.
The objective of our study was to investigate the impact of roundwood and residues in-forest drying and DML on supply chain costs and Greenhouse Gas (GHG) emissions. In addition, the study aimed at determining the impact of MC and DML on the supply of roundwood and residues to customers and fleet size.
The present document is organized as follows: Section 2 describes the material and methods, including the optimized model approach used for the analysis and the supply chains used in the scenarios that were modeled and compared. Section 3 presents the results by scenario, including MC and drying time and the monthly tonnage of roundwood and residues delivered to the plants. In addition, results on the impact of MC on fleet size, truckloads, supply chain costs, and GHG emissions are presented for each scenario. In Section 4, a comprehensive discussion of the results is provided. Finally, Section 5 offers some concluding remarks, including the significant findings and limitations of the study and some aspects to consider in future research.
2. Materials and Methods
2.1. Location of the Study Site
The demand points (end customers) in our optimization approach comprised a pulp mill and a power plant within an industrial complex located in the town of Navia, Principality of Asturias, Spain. The pulp mill demands approximately 1.5 million tonnes of Eucalyptus logs per year (mainly Eucalyptus globulus logs) to produce cellulose, of which approximately 672,000 m3 are supplied from forest stands located in Asturias. The power plant utilizes residues that are collected in the forest after logging operations (bark, branches, leaves) and the black liquor generated in the pulping process.
The supply chain included 2 products (roundwood and residues), 14 supply areas, and 2 demand points: A pulp mill (roundwood) and a power plant (residues) (Figure 1). The distances between the center of each supply area and the demand points were calculated using the shortest route by road (Figure 1), using road network data from the Spanish national cartographic database [39] E: 1:200,000. The network data were processed with the “Closest Facility” tool of the “Network Analyst” module in the ArcGIS 10.4 software, which implements Dijkstra’s shortest route algorithm [40]. Table 1 presents the transport distances from supply areas to end customers and the volume of roundwood (672,000 m3) and residues (101,921 m3) available in each supply area.
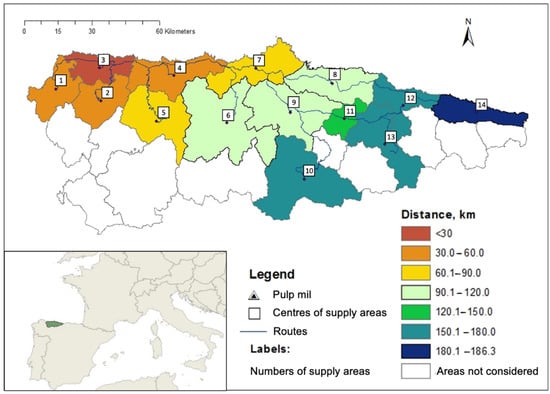
Figure 1.
Supply chain network with distances to end customers from supply areas used for the analysis.

Table 1.
Distance to customers and volume of roundwood and residues available in each supply area.
2.2. Description of the Supply Chains Used for the Analysis
In Northern Spain, Eucalyptus globulus stands are typically managed as coppice and harvested in clearfelling operations with the cut-to-length (CTL) harvesting system. Tree felling is performed manually, while stem processing is performed mechanically by a harvester; this results in large amounts of residues, including bark, tops, and branches, which are left on the ground after completion of the harvest operations. The analysis considered two different supply chains: Supply chain I (SCI) for roundwood (pulp logs) and Supply chain II (SCII) for logging residues. The tasks and products associated with each supply chain are shown in Figure 2. Most of the results presented in this paper are related to SCI.
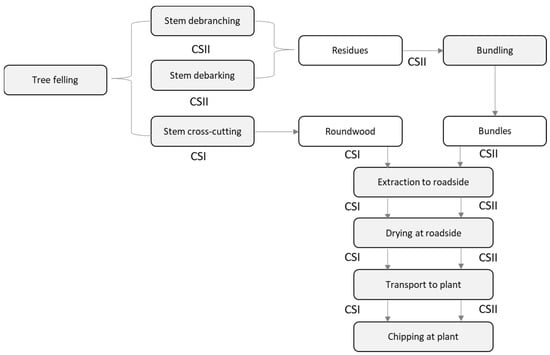
Figure 2.
Supply chains SCI and SCII included in the study.
Table 2 provides details of the technical characteristics of the equipment used in both supply chains, while Figure 3 shows images of the equipment. A harvester/processor performed tree felling, debarking, debranching, and crosscutting of stems into 2.4-m logs. In SCI (roundwood), the extraction of logs to the roadside and stacking for drying were performed with a 15-t forwarder. Furthermore, 45-t self-loading trucks were used to transport the logs to the pulp mill. Residues, branches, leaves, and bark are left scattered on the ground across the harvested area for later processing and bundling. In SCII (residues), the compaction and bundling of logging residues included a MONRA Enfo2000 bundler machine, which uses a shear system to cut the bundles. The same equipment (forwarders, trucks) as in SCI was used to extract the bundles to the roadside and transport them to the power plant.
Table 2.
Technical specifications of the machines in SCI and SCII included in the study.
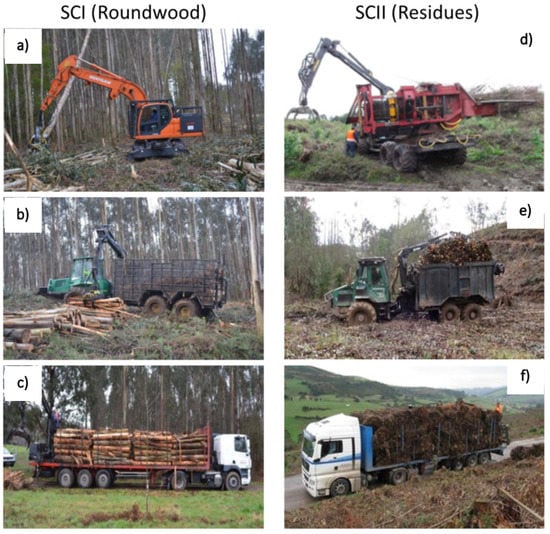
Figure 3.
Equipment used in SCI and SCII: (a) Tree felling, debarking, debranching, (b) extraction of logs, (c) transport of logs, (d) bundling, (e) extraction of bundles, (f) transport of bundles.
2.3. Description of the Supply Chain Optimization Model
The MCPLAN tool was used to quantify the impact of roundwood and biomass drying and raw material losses on supply chain costs and GHG emissions. The tool builds on and extends a previous tool (BIOPLAN), which has been used to investigate alternative biomass supply chains in Europe and Australia [1]. MCPLAN runs a linear programming model implemented with Visual Basic™ macros and solved with the What’s best™ solver add-in for MS Excel™. The model’s objective function minimizes harvesting, transport, chipping, and in-forest drying costs, subject to several constraints. These constraints ensure (1) that the capacity of roundwood and biomass in each supply area is not exceeded, (2) that the demand for roundwood and biomass at the mills is met in each period, and (3) that an even volume of roundwood and residues are harvested in each period (usually a month).
The optimal solution obtained with MCPLAN provides the volume of roundwood and residues to be harvested, collected, and dried in each period of the planning horizon set by the user. In the basic version, MCPLAN includes a planning horizon of 24 months, which coincides with the maximum drying time of roundwood and residues in the forest. The last 12 months of this planning horizon correspond to the period of production and consumption; during this time frame, the supply must meet the demand for roundwood and residues. Both roundwood and bundles are consumed during the same period (month) as they arrive at the industrial complex, which means there are no costs associated with the storage of roundwood at the pulp mill or bundles at the power plant. A detailed description of the mathematical model implemented in MCPLAN is presented in [5], which has been extended in the present study to include the impact of DML on various supply chains’ performance metrics, including fuel consumption and GHG emissions.
Several input parameters are required in MCPLAN. Travel distances are shown in Table 1, while transport, harvesting, and chipping costs are presented in Table 3. Costs associated with in-forest drying are calculated assuming that the collection of roundwood and residues are paid at the harvest time. At the same time, their transport to the industrial complex is conducted only at the end of the drying period. Thus, in-forest drying costs are the interest charge (6% per year) on the harvesting and extraction to roadside costs since the wood owner incurs a delay due to drying in being reimbursed for these costs [10]. Stumpage costs were not included as the forest owner was also the pulp mill and power plant owner. In addition, the production of roundwood and residues from Eucalyptus globulus was assumed to have a basic density of 565 kg/m3 and 350 kg/m3, respectively, for all the supply points. For the transport of roundwood and residues (bundles), the analysis assumed a 40-t truck (maximum legal gross vehicle mass in Spain) with a tare of 15.5 t, a net payload of 25.8 t, and a gross volume of 65.6 m3 [41]. A monthly demand of 56,000 m3 of roundwood at the pulp mill was also assumed (annual demand of 672,000 m3). In the case of residues, a biomass factor of 0.15 was used, i.e., 150 kg of residues delivered to the biomass plant from every tonne of roundwood harvested [41]. In-forest drying curves for roundwood and residues are a key parameter in the optimization model implemented in MCPLAN. The most common methods used to determine MC in log and forest biofuel drying trials have been taking samples, lifting and weighing the pile, or using a moisture measurement tool [42]. Moreover, automated weighing platforms use a frame attached to load cells to monitor weight changes of a log or biofuel pile (and hence MC changes) over time [14,42,43]. Thus, several drying models have been developed from these studies. They usually include the variation of MC as the response variable as well as the initial MC and meteorological data (e.g., average air temperature, average air relative humidity, evapotranspiration, rainfall, mean daily wind speed, and daily solar radiation) as the explanatory variables [2,42]. Due to the lack of drying models for Eucalyptus globulus roundwood and biomass in Asturias, Spain, MC models in our study were derived and adjusted from other studies conducted for conifers in Europe [1] and from some studies conducted for Eucalyptus species in Australia [10,42].
Table 3.
Harvesting, transport, and chipping costs for roundwood and residues used in the study.
As outputs, MCPLAN reports spatial and temporal solutions, including (1) the amount of roundwood and residues (volume and tonnage) to be harvested per period and supply point, (2) the drying times for roundwood and biomass, and (3) the flows (tonnes, m3, and truckloads) from supply to demand points (e.g., pulp mills and biomass plants). Costs are reported per solid m3, per green tonne, per loose m3, per truckload, and per MWh (biomass).
2.4. Calculation of GHG Emissions
For the calculation of GHG emissions associated with road transport, the following formula (Equation (1)) was used using the approach presented in [44], which follows the international standards:
where,
E = emissions of CO2, CH4, and N2O from diesel oil (CO2-e kg).
Q = quantity of diesel combusted for transport energy purposes (L). Fuel consumption of 40 L/100 km was used for the calculations.
EC = energy content factor of diesel oil used for transport energy purposes (38.6 GJ kL−1).
EFj = emission factor for each gas type (j) for diesel oil (CO2-e kg GJ−1) used for transport energy purposes. For diesel oil, EF CO2 = 69.9, EF CH4 = 0.1, EF N2O = 0.5.
As per the above equation, emissions from the combustion of individual fuel types are estimated by multiplying a (physical) quantity of fuel combusted by a fuel-specific energy content factor and a fuel-specific emission factor. This is performed for each relevant greenhouse gas (in this case, carbon dioxide, methane, and nitrous oxide), and separate calculations are carried out for each fuel type. Thus, total GHG emissions are calculated by adding up the emissions of each fuel type and each greenhouse gas.
2.5. Scenarios Analyzed
Four hypothetical scenarios were analyzed to investigate the potential impact of in-forest drying and associated raw material losses on supply chain costs and GHG emissions (Table 4). Due to technical and biological factors, these raw material losses (in the form of solid volume reductions) were added as new input parameters in MCPLAN. Material losses assumed for Eucalyptus globulus roundwood were adjusted from values found in previous studies [19,45], and personal communications with forest operators and forest managers. Likewise, volumetric reductions for residues were obtained from previous studies and adjusted to suit Eucalyptus globulus conditions in Northern Spain [14,17,18]. Due to the lack of scientific studies on the seasonal variation of raw material losses for roundwood and residues for the study species and location, we assumed monthly volumetric losses that were constant throughout the year. The Drying/No DML scenario includes drying without losses; Drying/Small DML is a rather conservative scenario, with a volumetric loss in 12 months of 3% for roundwood and 6% for residues; the Drying/Large DML scenario considers a volumetric loss in 12 months of 6% for roundwood and residues; finally, the No Drying/No DML scenario does not include drying, which means that roundwood and bundles are delivered during the same period (month) as they are harvested and collected in the forest.
Table 4.
Hypothetical scenarios used in the study.
The optimal solutions obtained with MCPLAN were the basis for the analysis and comparison between scenarios, which included the following metrics:
- Variation in MC of roundwood and biomass delivered to customers.
- In-forest drying time of roundwood and residues.
- Tonnage of roundwood and residues (bundles) delivered to customers by month and scenario.
- Truckloads of roundwood and residues (bundles) by scenario and season.
- GHG emissions.
- Supply chain costs.
3. Results
3.1. Variation in MC of Roundwood and Biomass Delivered to Customers
Figure 4 shows the variation in MC of the roundwood and residues delivered from supply areas to customers. In the four scenarios, similar values of MC were obtained for both materials as per the optimal solution obtained with MCPLAN.
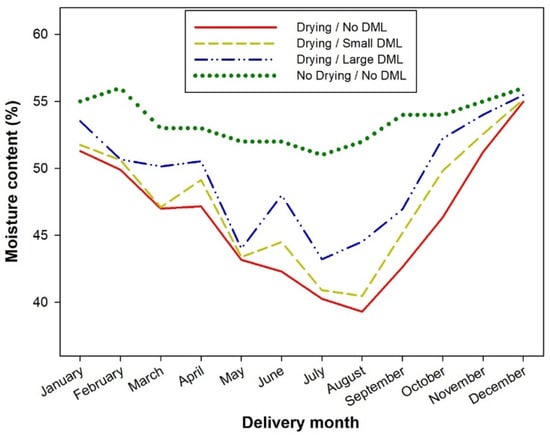
Figure 4.
MC variation for roundwood and residues for the four scenarios.
The MC of roundwood and residues varied among scenarios. Mean MC values by scenario were 46.3% (Drying/No DML), 47.5% (Drying/Small DML), 49.4% (Drying/Large DML), and 53.6% (No Drying/No DML). The Drying/No DML scenario presented the greatest variation throughout the year, with minimum and maximum MC values of 39.3% and 55.0%, respectively. In contrast, the lowest variation was obtained in the No Drying/No DML scenario, with minimum and maximum MC values of 51.0% and 56.0%, respectively. The greatest differences in MC between the No Drying/No DML scenario and the other three scenarios were 12.7% (August) for Drying/No DML, 11.5% (August) for Drying/Small DML, and 8.0% (May), for Drying/Large DML; this was a consequence of the low MC of the materials delivered to customers during the summer months in the scenarios that included drying. In scenarios that included drying and material losses, the MC curve showed a somewhat erratic pattern in the summer months. There was a substantial drop from April to May (50.0% to 44.0%), followed by a rise in June. Compared to the No Drying/No DML scenario, the other three scenarios presented MC differences of less than 5% during the winter months.
Figure 5 shows the average MC of roundwood delivered to customers by scenario and supply area. The same values were obtained for residues. MC values declined with increased transport distances, especially in scenarios that included in-forest drying of roundwood and residues. On average, MC dropped at higher rates in the scenarios that included drying (reduction rates of 0.94%, 0.85%, and 0.90% per every 10 km, respectively) than in the No Drying/No DML scenario (reduction rate of 0.28% per every 10 km). In the three first scenarios, MC was less than 44% in supply areas that exceeded a transport distance of 150 km, while it was over 50% in supply areas located within 50 km from the industrial complex. In contrast, the difference in MC between the closest supply area (9.3 km from the industrial complex) and the most distant supply area (186.4 km from the industrial complex) was only 2.6% in the No Drying/No DML scenario, with MC values that exceeded 50% in all cases.
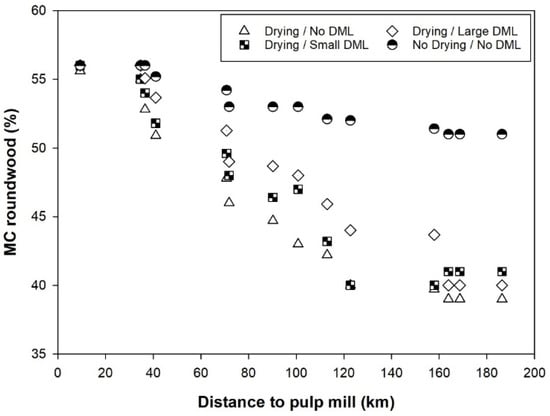
Figure 5.
Relationship between MC and distance to the pulp mill by scenario.
3.2. Drying Time of Wood and Biomass
Table 5 shows the average drying time (in months) by scenario and supply area for roundwood and residues. For scenarios that included drying, the longest average drying time occurred in the Drying/No DML scenario (mean = 7.2 months, median = 6.6 months), and was approximately 0.5 months longer than in the Drying/Small DML scenario (mean = 6.7 months, median = 4.3 months), and 5 months longer than in the Drying/Large DML scenario (mean = 2.0 months, median = 1.4 months). In the Drying/No DML scenario, there was only one supply area with a drying time = 0 months (supply area #2, located at 34.7 km from the pulp mill and power plant), and approximately 75% of the supply areas had a drying time not exceeding 13 months. In the Drying/Small DML scenario, two supply areas had a drying time = 0 months (supply areas #1 and #2, located at 9.3 km and 34.7 km from the pulp mill and power plant, respectively), and approximately 75% of the supply areas had a drying time not exceeding 12.6 months. Finally, in the Drying/Large DML scenario, three supply areas had a drying time = 0 months (supply areas #1, #2, and #3, located at 9.3 km, 34.7 km, and 36.5 km from the industrial complex, respectively), while 75% of the supply areas had a drying time shorter than 4.0 months.
Table 5.
Drying time (in months) of roundwood and biomass by scenario and supply area.
The single maximum drying time was 16.8 months and was obtained in the Drying/Small DML scenario, supply area #14 (located at 186.4 km from the industrial complex). Supply areas #12 and #13 also had long drying times (16 months in both cases). Likewise, the maximum drying time in the Drying/No DML scenario was 14.2 months (supply area #5 located 71.8 km from the industrial complex). Three other supply areas (areas #12, #13, and #14) had a drying time of 13 months; these areas were 163.9 km, 168.7 km, and 186.4 km from the industrial complex, respectively. In the Drying/Large DML scenario, the maximum drying time was only 5.0 months (supply area #14 located at 186.4 km from the industrial complex). Supply areas #11, #12, and #13 (located at 157.9 km, 163.9 km, and 168.7 km from the industrial complex, respectively) had drying times between 4.0 and 4.5 months.
Figure 6 is a scatterplot depicting the relationship between drying times and MC of roundwood and residues delivered to the industrial complex. In the Drying/No DML scenario, the seven most distant supply areas (>100 km from the industrial complex) had an MC and drying time that ranged between 39% and 43% and between 3.0 and 13.0 months, respectively. In contrast, in the seven supply areas closest to the industrial complex, the MC and drying times ranged between 44.7% and 55.6% and between 0.0 and 14.2 months, respectively. Overall, there was a reduction in MC with longer drying times. One exception to this trend was supply area #6 (located at 71.8 km from the industrial complex), which had an MC of 46%, and the longest drying time (14.2 months). The results for scenarios Drying/No DML and Drying/Small DML showed the same trend. In the latter scenario, for the seven most distant supply areas (>100 km from the industrial complex), MC and drying times ranged between 41% and 47% and between 3.0 and 16.0 months, respectively. In contrast, in the seven supply areas closest to the industrial complex, MC and drying times ranged between 46.4% and 56% and between 0.0 and 5.3 months, respectively. In the Drying/Large DML scenario, although drying time only ranged between 0.0 and 5.0 months, there was a high variation in MC (between 40% and 56%) among periods. In all scenarios, the highest MC values (>49%) were obtained in supply areas within 50 km of the industrial complex. In contrast, in the No Drying/No DML scenario, which did not include drying, MC ranged between 51% and 56%.
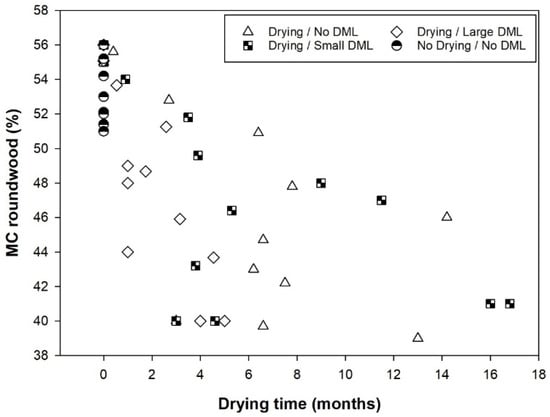
Figure 6.
Relationship between the MC of the roundwood delivered to the pulp mill and drying time by scenario.
3.3. Roundwood Delivered to the Pulp Mill by Month and Scenario
A summary of the monthly roundwood supply (solid m3) for the four scenarios is presented in Figure 7. The same trend was observed for residues. There was a very high correlation between tonnage and the MC of roundwood and residues delivered to the pulp mill and power plant (r > 0.99, p < 0.001). Furthermore, the pulp mill demand (56,000 solid m3 per month) was met in all the scenarios. However, the equivalent tonnage varied substantially among scenarios, which was a consequence of the monthly MC variation in the roundwood delivered. In the Drying/No DML scenario, the roundwood delivered throughout the year totaled 712,753 t. In contrast, the roundwood delivered amounted to 730,096 t in the Drying/Small DML scenario (2.4% increase), 756,433 t in the Drying/Large DML scenario (6.1% increase), and 818,965 t in the No Drying/No DML scenario (14.9% increase). As expected, in the latter scenario, there was reduced variation (std. dev. = 2476 t) in the monthly tonnage delivered to the pulp mill, with values that ranged between 64,571 t (July) and 71,909 t (December). In contrast, the variation in monthly tonnage increased in scenarios that included drying. Thus, monthly tonnage ranged between 52,126 t (August) and 70,308 t (December) in the Drying/No DML scenario (std. dev. = 5579 t), between 53,186 t (August) and 70,567 t (December) in the Drying/Small DML scenario (std. dev. = 5496 t), and between 55,810 t (July) and 71,101 t (December) in the Drying/Large DML scenario (std. dev = 5071 t). These results are also reflected in the ratio tonne-to-solid m3 of roundwood delivered to the pulp mill. Mean ratios were 1.06 (range between 0.93 and 1.26) in the Drying/No DML scenario, 1.09 (range between 0.95 and 1.26) in the Drying/Small DML scenario, 1.14 (range between 1.00 and 1.27) in the Drying/Large DML scenario, and 1.22 (range between 1.15 and 1.28) in the No Drying/No DML scenario. The lowest ratios were obtained in August for the two former scenarios, and in July for the two latter scenarios. In contrast, the highest ratios were obtained in December for all scenarios.
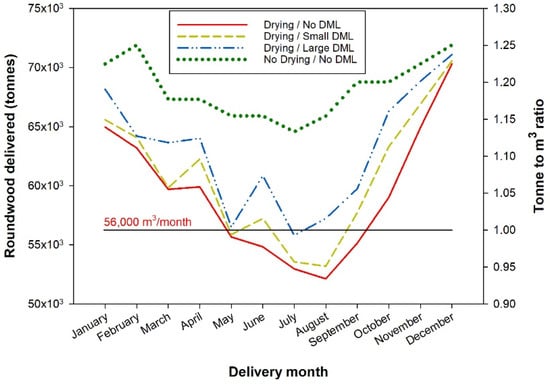
Figure 7.
Tonnes of roundwood delivered to the pulp mill and tonnes-to-m3 ratios by scenario and month. The horizontal solid black line represents the demand for roundwood that must be satisfied each month.
3.4. Truckloads of Roundwood and Residues by Scenario and Season
The number of truckloads (roundwood and bundles of residues combined) by scenario and transport season is presented in Figure 8. As expected, there was a high correlation (r = 0.98, p < 0.05) between tonnage and the number of truckloads delivered to the industrial complex. Denying in-forest drying of roundwood and residues before transportation (No Drying/No DML scenario) resulted in an extra 4790 truckloads (14.9%), 4039 truckloads (12.3%), and 2822 truckloads (8.2%) in comparison to the Drying/No DML, Drying/Small DML, and Drying/Large DML scenarios, respectively. On average, roundwood and bundles accounted for 87% and 13% of the truckloads, respectively.
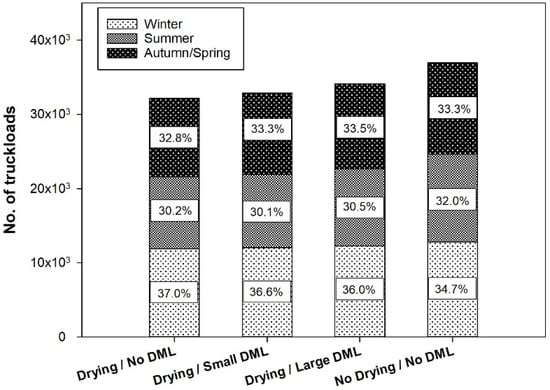
Figure 8.
Truckloads of roundwood and residues (bundles) by scenario and season.
The largest proportion of truckloads delivered to the industrial complex occurred during the winter months (January, February, November, and December), with values that ranged between 34.7% (No Drying/No DML) and 36% (Drying/Large DML). In contrast, the smallest proportion of truckloads delivered occurred during the summer months (May through August), with values that ranged between 30.1% (Drying/Small DML) and 32.0% (No Drying/No DML). The number of truckloads by season was rather similar for the Drying/No DML and Drying/Large DML scenarios, but they differed from those calculated for the No Drying/No DML scenario, particularly during the winter and summer months.
3.5. Fuel Consumption and GHG Emissions
Figure 9 shows the total fuel consumption and GHG emissions (CO2-e) that resulted from the transport of roundwood and residues (bundles) to the industrial complex. The total fuel consumption was 2.09 M L (Drying/No DML scenario), 2.15 M L (Drying/Small DML scenario), 2.24 M L (Drying/Large DML scenario), and 2.46 M L (No Drying/No DML scenario). Thus, compared to the Drying/No DML scenario, total fuel consumption increased by 3.4% (68,305 L), 7.4% (154,609 L), and 18.1% (378,061 L) in the Drying/Small DML, Drying/Large DML, and No Drying/No DML scenarios, respectively. All the differences with the Drying/No DML scenario were statistically significant (p-value = 0.05). Likewise, on a per-tonne basis of roundwood delivered to the pulp mill, fuel consumption was 2.55 L (Drying/No DML scenario), 2.57 L (Drying/Small DML scenario), 2.58 L (Drying/Large DML scenario), and 2.62 L (No Drying/No DML scenario). Fuel consumption per tonne was the same for residues since there was a direct correlation between the tonnes of roundwood and bundles delivered to the industrial complex.
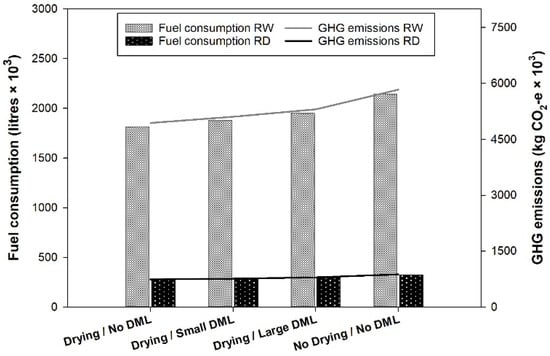
Figure 9.
Fuel consumption and GHG emissions by scenario for roundwood (RW) and residues (RD).
As expected, GHG emissions had a strong correlation with fuel consumption. GHG emissions totaled 5.68 M kg CO2-e (Drying/No DML scenario), 5.86 M kg CO2-e (Drying/Small DML scenario), 6.10 M kg CO2-e (Drying/Large DML scenario), and 6.71 M kg CO2-e (No Drying/No DML scenario). Thus, compared to the Drying/No DML scenario, the total GHG emissions increased by 3.4% (185,878 kg CO2-e), 7.4% (420,738 kg CO2-e), and 18.1% (1.03 M kg CO2-e) in the Drying/Small DML, Drying/Large DML, and No Drying/No DML scenarios, respectively. All the differences in the Drying/No DML scenario were statistically significant (p-value = 0.05). Likewise, on a per-tonne basis of roundwood delivered to the pulp mill, GHG emissions totaled 6.93 kg CO2-e (Drying/No DML scenario), 6.99 kg CO2-e (Drying/Small DML scenario), 7.01 kg CO2-e (Drying/Large DML scenario), and 7.12 kg CO2-e (No Drying/No DML scenario), respectively. Similar to fuel consumption, GHG emissions per tonne were also the same for roundwood and residues.
3.6. Supply Chain Costs
Unit supply chain costs per cubic meter are presented in Figure 10 by scenario and operational activity. Total costs amounted to 41.7$ m−3 (Drying/No DML scenario), 42.3$ m−3 (Drying/Small DML scenario), 42.8$ m−3 (Drying/Large DML scenario), and 44.4$ m−3 (No drying/No DML scenario). Compared to the Drying/No DML scenario, this represented a rise in supply chain costs per m3 of 1.4%, 2.8%, and 6.5% for scenarios Drying/Small DML, Drying/Large DML, and No Drying/No DML, respectively. Since MC and losses did not impact them, harvesting costs were nearly the same across all scenarios. Conversely, MC and material losses substantially impacted chipping costs and transport costs. Thus, chipping costs in the Drying/Small DML, Drying/Large DML, and No Drying/No DML scenarios were 2.2% (0.23$ m−3), 5.6% (0.58$ m−3), and 13.2% (1.35$ m−3) higher than those in the Drying/No DML scenario, respectively. Likewise, transport costs were 3.4% (0.44$ m−3), 7.4% (0.96$ m−3), and 18.1% (2.34$ m−3) higher than the Drying/No DML scenario, respectively. Furthermore, drying costs were rather marginal compared to harvesting, transport, and chipping costs.
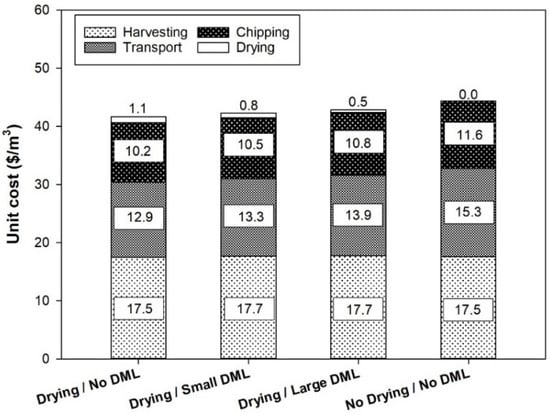
Figure 10.
Supply chain costs per m3 by scenario and activity (harvesting, transport, chipping, and drying).
Figure 11 presents supply chain costs per cubic meter as a function of transport distance. The difference in costs among scenarios increased with longer transport distances. Thus, for example, the cost difference between the Drying/No DML and the No Drying/No DML scenarios was 1.1$ m−3 for supply area #1 (located at 9.3 km from the industrial complex), 3.7$ m−3 for supply area #8 (located at 100.8 km from the industrial complex), and 6.4$ m−3 for supply area #14 (located at 186.4 km from the industrial complex). The differences between the Drying/No DML scenario and scenarios Drying/Small DML and Drying/Large DML were minor. When comparing all scenarios, cost differences remained under 2.0$ m−3 for distances shorter than 70 km, but they increased to 5.0–6.0$ m−3 for transport distances longer than 100 km.
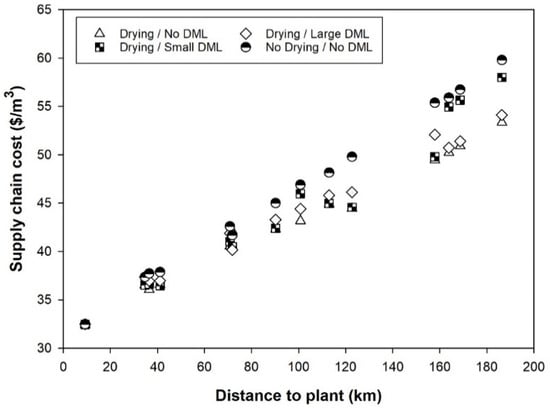
Figure 11.
Supply chain costs per m3 by transport distance and scenario.
4. Discussion
This study applied an optimization modeling approach to determine the impact of roundwood and biomass drying and raw material losses on supply chain costs, number of truckloads, fuel consumption, and GHG emissions, among other factors. A few other studies have investigated the potential impact of MC on biomass and wood supply chain costs [1,3,37,38], and DML resulting from biomass and roundwood associated with air drying [46,47,48]. However, we are not aware of previous studies investigating the combined impact of in-forest drying and DML on the economics and GHG emissions of Eucalyptus globulus wood and biomass supply chains using an optimization approach.
Our results have confirmed the findings from previous studies [1,6,49,50], which have revealed that MC is one of the most important factors to manage and control when implementing and analyzing the economics of wood and biomass supply chains. At harvest time, water constitutes approximately 50% of the mass in leaving trees, so large savings can be attained when biomass (logging residues) and roundwood undergo air-drying at the stump or roadside [2]. Since drying models for Eucalyptus globulus roundwood and biomass in Asturias, Spain, are inexistent, in our study, they were derived and adjusted from other studies conducted for conifers in Europe [1] and from some studies conducted for Eucalyptus species in Australia [10,42]. These models might not accurately reflect Asturias’s weather conditions, so future studies should be conducted to derive models that can predict changes in MC of roundwood and biomass more accurately based on local meteorological data. These studies should also investigate how the moisture loss rate varies with tree and log size and in different sections of Eucalyptus globulus trees, the difference between branched and debranched trees, and between barked debarked trees and logs. Previous studies conducted for wood used for bioenergy in Europe have reported the following findings: (1) Broadleaved trees dry more effectively when debarked [6], (2) the moisture loss rate increases as the size of the truck increases and a higher moisture rate is observed in the top parts of the trunks that are not delimbed after felling [51], and (3) a more effective method of drying is to leave whole trees after felling, as opposed to timber stored in a pile [49]. Furthermore, a study conducted in Chile reported that Eucalyptus globulus logs dried 20% faster than Eucalyptus nitens logs, debarked logs dried 8% faster than barked logs, and 244 cm logs dried 3% faster than 350 cm logs [2].
Constant weight monitoring shows the drying of the biomass can be disturbed by DML. The weight change includes the water added or removed and the dry matter (mainly) removed from the pile by micro biological processes [14,46]. This is an important aspect to investigate further since many studies assume that all the weight loss of roundwood and biomass during air-drying results from MC losses only. Thus, unlike in our research, they do not account for DML’s impact on weight loss and, consequently, on supply chain costs. Due to the lack of studies on DML in Eucalyptus globulus roundwood and biomass, we used and adjusted some figures from previous studies in Europe. In the case of biomass (residues), we used some figures reported by Johansson et al. [17] and Routa et al. [14] and adjusted (reduced) them to reflect the conditions in Asturias. In the case of roundwood (logs), we found only one study reporting DML losses for Eucalyptus species [21], which were also reduced to reflect the conditions in Asturias. As in the case of MC, future studies should also be conducted to quantify DML in a range of scenarios, including barked versus debarked logs, branched versus debranched trees, short versus long logs, drying of residues at stump versus in piles, different pile sizes, etc.
The results of our study show that air-drying and DML impact drying times and the MC of the roundwood and biomass delivered to end customers. As expected, in the absence of drying, the roundwood and biomass delivered to customers exhibited a low variation in MC throughout the year, with values ranging between 52% and 55%. In contrast, higher MC variations throughout the year were obtained when in-forest drying and DML were included in the model. These variations were much more pronounced in the Drying/Large DML scenario, which included the highest DML. A similar trend was obtained in a study conducted by Acuna et al. [1] in Finland that investigated the impact of MC on supply chain costs for whole trees, stem wood, and logging residues. In their study, a constraint was added to the model to limit the MC range of the biomass delivered to the end customer, which resulted in biomass being delivered to the power plant within a very narrow range of MC (41–43%). When relaxing the MC range restriction, the variation in MC increased, showing similar trends to those found in our study for the scenarios Drying/No DML, Drying/Small DML, and Drying/Large DML. The high variation in MC observed in our study for these three scenarios is also consistent with the results reported by Sosa et al. [3,37], where a high variation in MC was observed irrespective of the MC constraint imposed on the woodchips produced from whole trees. Furthermore, as expected, drying times had a high correlation with MC, and clearly, our results confirm that shorter drying times occur in scenarios with higher DML. This is because the optimization model minimizes total costs by controlling the MC of roundwood and biomass and minimizing the DML of these products.
Our study has confirmed that the benefits that result from controlling MC and reducing DML of roundwood and biomass are primarily associated with the transport of these products to end customers. Overall, air drying reduces the need to transport the water contained in green material, thus increasing the net energy content of each truckload of biomass. In addition, it allows trucks to travel at their maximum volumetric capacity, which subsequently results in fewer trips to move the same volume (roundwood) and net energy content to markets, thus reducing fuel consumption and GHG emissions [52]. Another interesting result from our study is that MC drops with increased transport distances; hence, a higher reduction in MC was obtained with longer transport distances for the scenarios that included in-field drying. Contrarily, in the No Drying/No DML scenario, transport distances had a minor impact on the MC of the roundwood and biomass delivered since these materials are delivered with a high MC, irrespective of the distance to the end customers. Transport was the single most significant cost component in the supply chains examined in our study. Thus, the optimization model minimized transport costs by increasing the drying times of roundwood and biomass located in further supply areas, resulting in a reduced MC of these materials. Moreover, previous studies have examined the impact of roadside drying on the volumetric capacity of trucks. For example, Strandgard et al. [38] examined the effect of roadside drying and the use of high-volumetric capacity trucks on delivered costs of Pinus radiata pulp-logs and logging residue (chips supplying a gasification plant in Australia). Without roadside drying, truck trips transporting logs were directly related to truck weight capacity. Additional volumetric capacity enabled HV semi-trailers and B-doubles to transport 6% and 4% more logging residue chips than standard versions, respectively, with equivalent truck trip reductions. These results support those obtained in our study, where we obtained an increased volumetric capacity of up to 15%. The magnitude of the differences from those reported by Strandgard et al. [38] is explained by the truck configurations used in both studies (GVM over 60 tonnes in Australia and 45 tonnes in Asturias).
In our study, the substantial reduction in trips (14.9%) resulted in a 6.5% reduction in supply chain costs and 18.1% less fuel consumption and GHG emissions due to in-forest drying. These results are consistent with those from previous studies. For example, in Austria, Kanzian et al. [33] examined the effects of MC on costs and greenhouse gas (GHG) emissions for an optimized supply network using a multi-criteria optimization model. In their study, emissions decreased with a decreasing MC, and the effect on emissions was less prominent than the effect on profit. They report savings in GHG per dry tonne of approximately 4% when reducing MC from 40 to 30%. Differences in savings are explained by the complexity and size of the analyzed supply chains and the products delivered in each case. While our study included two products (roundwood and biomass) and a single destination, their study included only biomass, several terminals, and many more supply and demand points. In Ireland, Sosa et al. [37] reported truckload reductions of up to 14.8% when controlling MC and using 6-axles trucks. These results are very close to those obtained in our study, and are, in part, explained by the similar truck configurations included in both studies.
An aspect that needs to be further investigated is the impact of MC on the cost and fuel consumption of chipping operations. Logging contractors usually report a much shorter operating life for chipper knives between sharpening and processing dried material, which increases maintenance costs and reduces knife life. This, in turn, can also reduce chipper productivity due to reduced mechanical availability. Furthermore, chipping drier material could negatively impact fuel consumption per green ton if the chipper increases the amount of work to produce the same volume [23,25,52].
Finally, we are aware of some of the limitations of this study. Firstly, the datasets were collected in only one region in northern Spain, and only two supply chains were simulated. Tree characteristics, harvesting, chipping, transport technology, and geographical and weather conditions, among others, will affect the impacts of drying and DML losses on supply chain costs and GHG emissions. Expanding the number of data sets will hopefully overcome these limitations. Secondly, our analysis included drying curves and DML rates from previous studies, adjusted to local conditions. Certainly, future research should validate these parameters to confirm the results obtained in our study.
5. Conclusions
The findings of our study have confirmed that transport costs of roundwood and biomass are substantially impacted by reductions in MC and DML. Overall, air drying reduces the need to transport the water contained in green material, thus increasing the net energy content of each truckload of biomass and maximizing net payload in the case of roundwood. Furthermore, it allows trucks to travel at their maximum volumetric capacity, which subsequently results in fewer trips to move the same volume (roundwood) and net energy content to markets, thus reducing fuel consumption and GHG emissions. In scenarios that include in-forest drying and result in DML, the adverse economic effects are offset by the substantial reductions in transport costs and GHG emissions. Controlling MC through in-forest drying and reducing DML can result in a 6.5% reduction in supply chain costs, 14.9% fewer truckloads to destination points, and 18.1% less fuel consumption and GHG emissions. Future studies should expand the datasets included in our study, investigating the impact of MC and DML in other supply chains with different tree characteristics, harvesting, chipping, transport technology, and geographical and weather conditions. It will also be possible to estimate the actual supply chain more accurately by developing MC and DML models that are better adjusted to local conditions.
Author Contributions
Conceptualization, M.A., S.S.-G. and E.C.; methodology, M.A. and S.S.-G.; formal analysis, M.A.; investigation, M.A., S.S.-G. and E.C.; writing—original draft preparation, M.A. and S.S.-G.; writing—review and editing, M.A., S.S.-G. and E.C. All authors have read and agreed to the published version of the manuscript.
Funding
This research received no external funding.
Data Availability Statement
Not applicable.
Conflicts of Interest
The authors declare no conflict of interest.
References
- Acuna, M.; Anttila, P.; Sikanen, L.; Prinz, R.; Asikainen, A. Predicting and Controlling moisture content to Optimise forest biomass logistics. Predvidanje i Praćenje Sadržaja Vlage Radi Poboljšanja u Logist. Pridobivanja Biomase 2012, 33, 225–238. [Google Scholar]
- Bown, H.E.; Lasserre, J.-P. An air-drying model for piled logs of Eucalyptus globulus and Eucalyptus nitens in Chile. N. Z. J. For. Sci. 2015, 45, 17. [Google Scholar] [CrossRef]
- Sosa, A.; Acuna, M.; McDonnell, K.; Devlin, G. Managing the moisture content of wood biomass for the optimisation of Ireland’s transport supply strategy to bioenergy markets and competing industries. Energy 2015, 86, 354–368. [Google Scholar] [CrossRef]
- Belart, F.; Leshchinsky, B.; Sessions, J. Finite element analysis to predict in-forest stored harvest residue moisture content. For. Sci. 2017, 63, 362–376. [Google Scholar] [CrossRef]
- Acuna, M. Timber and biomass transport optimization: A review of planning issues, solution techniques and decision support tools. Croat. J. For. Eng. 2011, 38, 279–290. [Google Scholar]
- Röser, D.; Mola-Yudego, B.; Sikanen, L.; Prinz, R.; Gritten, D.; Emer, B.; Väätäinen, K.; Erkkilä, A. Natural drying treatments during seasonal storage of wood for bioenergy in different European locations. Biomass Bioenergy 2011, 35, 4238–4247. [Google Scholar] [CrossRef]
- Rentizelas, A.A.; Tolis, A.J.; Tatsiopoulos, I.P. Logistics issues of biomass: The storage problem and the multi-biomass supply chain. Renew. Sustain. Energy Rev. 2009, 13, 887–894. [Google Scholar] [CrossRef]
- Strandgard, M.; Mitchell, R.; Acuna, M.; Ghaffariyan, M.R.; Brown, M. Control and Manage the Moisture Content of Logs and Biomass to Maximise Benefits Along the Wood Supply Chain; Final Report; Forest & Wood Products Australia: Melbourne, Australia, 2020; 56p. [Google Scholar]
- Visser, R.; Berkett, H.; Spinelli, R. Determining the effect of storage conditions on the natural drying of radiata pine logs for energy use. N. Z. J. For. Sci. 2014, 44, 3. [Google Scholar] [CrossRef]
- Ghaffariyan, M.R.; Acuna, M.; Brown, M. Analysing the effect of five operational factors on forest residue supply chain costs: A case study in Western Australia. Biomass Bioenergy 2013, 59, 486–493. [Google Scholar] [CrossRef]
- Sánchez-García, S.; Eliasson, L.; Tolosana, E.; Majada, J.; Canga, E. Evaluation of technological improvements in bundling units for the collection of eucalyptus logging residues on steep terrain in Spain. For. Syst. 2015, 24, 30. [Google Scholar] [CrossRef][Green Version]
- Cabrera, M.; Vera, A.; Cornejo, J.; Ordás, I.; Tolosana, E.; Ambrosio, Y.; Martínez, I.; Vignote, S.; Hotait, N.; Lafarga, A.; et al. Evaluación del Potencial de Energía de la Biomasa. Estudio Técnico PER 2011–2020; Instituto parala Diversificación y Ahorro de la Energía (IDAE): Madrid, Spain, 2011; 192p. [Google Scholar]
- Filbakk, T.; Høibø, O.A.; Dibdiakova, J.; Nurmi, J. Modelling moisture content and dry matter loss during storage of logging residues for energy. Scand. J. For. Res. 2011, 26, 267–277. [Google Scholar] [CrossRef]
- Routa, J.; Kolström, M.; Ruotsalainen, J.; Sikanen, L. Precision measurement of forest harvesting residue moisture change and dry matter losses by constant weight monitoring. Int. J. For. Eng. 2015, 26, 71–83. [Google Scholar] [CrossRef]
- Pecenka, R.; Lenz, H.; Hering, T. Options for Optimizing the Drying Process and Reducing Dry Matter Losses in Whole-Tree Storage of Poplar from Short-Rotation Coppices in Germany. Forests 2020, 11, 374. [Google Scholar] [CrossRef]
- Pettersson, M.; Nordfjell, T. Fuel quality changes during seasonal storage of compacted logging residues and young trees. Biomass Bioenergy 2007, 31, 782–792. [Google Scholar] [CrossRef]
- Johansson, J.; Liss, J.-E.; Gullberg, T.; Björheden, R. Transport and handling of forest energy bundles—Advantages and problems. Biomass Bioenergy 2006, 30, 334–341. [Google Scholar] [CrossRef]
- Sánchez-García, S.; Canga, E.; Tolosana, E.; Majada, J. Analysis of Productivity and Cost of Forwarding Bundles of Eucalyptus Logging Residues on Steep Terrain. Croat. J. For. Eng. 2016, 37, 241–249. [Google Scholar]
- Vega, M.; Hamilton, M.G.; Blackburn, D.P.; McGavin, R.L.; Baillères, H.; Potts, B.M. Influence of site, storage and steaming on Eucalyptus nitens log-end splitting. Ann. For. Sci. 2016, 73, 257–266. [Google Scholar] [CrossRef]
- McComb, J.A.; Meddings, R.A.; Siemon, G.; Davis, S. Wood density and shrinkage of five-year-old Eucalyptus camaldulensis × E. globulus hybrids: Preliminary assessment. Aust. For. 2004, 67, 236–239. [Google Scholar] [CrossRef]
- Pari, L.; Bergonzoli, S.; Cetera, P.; Mattei, P.; Alfano, V.; Rezaei, N.; Suardi, A.; Toscano, G.; Scarfone, A. Storage of fine woodchips from a medium rotation coppice Eucalyptus plantation in central Italy. Energies 2020, 13, 2355. [Google Scholar] [CrossRef]
- Wästerlund, I.; Nilsson, P.; Gref, R. Influence of storage on properties of wood chip material. J. For. Sci. 2017, 63, 182–191. [Google Scholar] [CrossRef]
- Warguła, Ł.; Kukla, M.; Krawiec, P.; Wieczorek, B. Reduction in Operating Costs and Environmental Impact Consisting in the Modernization of the Low-Power Cylindrical Wood Chipper Power Unit by Using Alternative Fuel. Energies 2020, 13, 2995. [Google Scholar] [CrossRef]
- Waste To Wisdom: Utilizing Forest Residues for the Production of Bioenergy and Biobased Products; Final Report; U.S. Department of Energy: Washington, DC, USA, 2018; 78p.
- Manzone, M. Energy consumption and CO2 analysis of different types of chippers used in wood biomass plantations. Appl. Energy 2015, 156, 686–692. [Google Scholar] [CrossRef]
- Lijewski, P.; Merkisz, J.; Fuć, P.; Ziółkowski, A.; Rymaniak, Ł.; Kusiak, W. Fuel consumption and exhaust emissions in the process of mechanized timber extraction and transport. Eur. J. For. Res. 2017, 136, 153–160. [Google Scholar] [CrossRef]
- Gautam, S.; Pulkki, R.; Shahi, C.; Leitch, M. Fuel quality changes in full tree logging residue during storage in roadside slash piles in Northwestern Ontario. Biomass Bioenergy 2012, 42, 43–50. [Google Scholar] [CrossRef]
- Sánchez-García, S.; Athanassiadis, D.; Martínez-Alonso, C.; Tolosana, E.; Majada, J.; Canga, E. A GIS methodology for optimal location of a wood-fired power plant: Quantification of available woodfuel, supply chain costs and GHG emissions. J. Clean. Prod. 2017, 157, 201–212. [Google Scholar] [CrossRef]
- Morales, M.; Aroca, G.; Rubilar, R.; Acuna, E.; Mola-Yudego, B.; González-García, S. Cradle-to-gate life cycle assessment of Eucalyptus globulus short rotation plantations in Chile. J. Clean. Prod. 2015, 99, 239–249. [Google Scholar] [CrossRef]
- Wolfsmayr, U.J.; Rauch, P. The primary forest fuel supply chain: A literature review. Biomass Bioenergy 2014, 60, 203–221. [Google Scholar] [CrossRef]
- Quartucci, F.; Schweier, J.; Jaeger, D. Environmental analysis of Eucalyptus timber production from short rotation forestry in Brazil. Int. J. For. Eng. 2015, 26, 225–239. [Google Scholar] [CrossRef]
- Woo, H.; Acuna, M.; Moroni, M.; Taskhiri, M.S.; Turner, P. Optimizing the location of biomass energy facilities by integrating Multi-Criteria Analysis (MCA) and Geographical Information Systems (GIS). Forests 2018, 9, 585. [Google Scholar] [CrossRef]
- Kanzian, C.; Kühmaier, M.; Erber, G. Effects of moisture content on supply costs and CO2 emissions for an optimized energy wood supply network. Croat. J. For. Eng. J. Theory Appl. For. Eng. 2016, 37, 51–60. [Google Scholar]
- Delivand, M.K.; Cammerino, A.R.B.; Garofalo, P.; Monteleone, M. Optimal locations of bioenergy facilities, biomass spatial availability, logistics costs and GHG (greenhouse gas) emissions: A case study on electricity productions in South Italy. J. Clean. Prod. 2015, 99, 129–139. [Google Scholar] [CrossRef]
- Murphy, F.; Sosa, A.; McDonnell, K.; Devlin, G. Life cycle assessment of biomass-to-energy systems in Ireland modelled with biomass supply chain optimisation based on greenhouse gas emission reduction. Energy 2016, 109, 1040–1055. [Google Scholar] [CrossRef]
- Paolucci, N.; Bezzo, F.; Tugnoli, A. A two-tier approach to the optimization of a biomass supply chain for pyrolysis processes. Biomass Bioenergy 2016, 84, 87–97. [Google Scholar] [CrossRef]
- Sosa, A.; Acuna, M.; McDonnell, K.; Devlin, G. Controlling moisture content and truck configurations to model and optimise biomass supply chain logistics in Ireland. Appl. Energy 2015, 137, 338–351. [Google Scholar] [CrossRef]
- Strandgard, M.; Acuna, M.; Turner, P.; Mirowski, L. Use of modelling to compare the impact of roadside drying of Pinus radiata D.Don logs and logging residues on delivered costs using high capacity trucks in Australia. Biomass Bioenergy 2021, 147, 106000. [Google Scholar] [CrossRef]
- Instituto Geográfico Nacional Base Cartográfica Nacional BCN200. Available online: http://www.ign.es (accessed on 7 December 2018).
- Abiy, T.; Pang, H.; Williams, C.; Khim, J.; Ross, E. Dijkstra’s Shortest Path Algorithm. Available online: https://brilliant.org/wiki/dijkstras-short-path-finder/ (accessed on 27 April 2022).
- Sánchez García, S.; Canga Libano, E.; Picchi, G.; Nati, C. Analysis of the procurement system of Eucalyptus residues with bundling technology. In Proceedings of the FORMEC Conference, Graz, Austria, 26–29 June 2011. [Google Scholar]
- Strandgard, M.; Mitchell, R. Reducing Costs in the Wood Supply Chain through Controlling the Moisture Content of Logs and Chips: Preliminary Modelling Results for Air-Drying Eucalyptus globulus and Pinus radiata Log Piles; Final Report; Forest & Wood Products Australia: Melbourne, Australia, 2017; 31p. [Google Scholar]
- Erber, G.; Routa, J.; Wilhelmsson, L.; Raitila, J.; Toiviainen, M.; Riekkinen, J.; Sikanen, L. A Prediction Model Prototype for Estimating Optimal Storage Duration and Sorting; Finnish Forest Research Institute: Joensuu, Finland, 2014; 76p, ISBN 9789514024764. [Google Scholar]
- Australian Government, Department of the Environment and Energy. National Greenhouse Account Factors. 2021; 56p. Available online: https://www.industry.gov.au/data-and-publications/national-greenhouse-accounts-factors-2021 (accessed on 27 April 2022).
- Yang, J.L.; Baillères, H.; Okuyama, T.; Muneri, A.; Downes, G. Measurement methods for longitudinal surface strain in trees: A review. Aust. For. 2005, 68, 34–43. [Google Scholar] [CrossRef]
- Routa, J.; Kolström, M.; Sikanen, L. Dry matter losses and their economic significance in forest energy procurement. Int. J. For. Eng. 2018, 29, 53–62. [Google Scholar] [CrossRef]
- Routa, J.; Asikainen, A.; Björheden, R.; Laitila, J.; Röoser, D. Forest Energy Procurement: State of The Art In Finland and Sweden. WIREs Energy Environ. 2013, 2, 602–613. [Google Scholar] [CrossRef]
- Anerud, E.; Bergström, D.; Routa, J.; Eliasson, L. Fuel quality and dry matter losses of stored wood chips—Influence of cover material. Biomass Bioenergy 2021, 150, 106109. [Google Scholar] [CrossRef]
- Tomczak, A.; Grodziński, G.; Jakubowski, M.; Jelonek, T.; Grzywiński, W. Effects of short-term storage method on moisture loss and weight change in beech timber. Croat. J. For. Eng. 2018, 39, 35–43. [Google Scholar]
- Acuna, M.; Sessions, J.; Zamora, R.; Boston, K.; Brown, M.; Ghaffariyan, M.R. Methods to Manage and Optimize Forest Biomass Supply Chains: A Review. Curr. For. Rep. 2019, 5, 124–141. [Google Scholar] [CrossRef]
- Saralecos, J.D.; Keefe, R.F.; Tinkham, W.T.; Brooks, R.H.; Smith, A.M.S.; Johnson, L.R. Effects of harvesting systems and bole moisture loss on weight scaling of douglas-fir sawlogs (Pseudotsuga Menziesii var. glauca Franco). Forests 2014, 5, 2289–2306. [Google Scholar] [CrossRef]
- Cutshall, J.B. Options for Reducing Moisture and Ash Content. Ph.D. Thesis, University of Georgia, Athens, GA, USA, 2012; 122p. [Google Scholar]


Publisher’s Note: MDPI stays neutral with regard to jurisdictional claims in published maps and institutional affiliations. |
© 2022 by the authors. Licensee MDPI, Basel, Switzerland. This article is an open access article distributed under the terms and conditions of the Creative Commons Attribution (CC BY) license (https://creativecommons.org/licenses/by/4.0/).