Abstract
Forest fires can alter essential ecosystem processes, including soil nutrient cycling, potentially cascading into permanent vegetation changes. This is key to elucidate in ecosystems where fires are infrequent. We assessed the effects of fire severity on the spatio-temporal response of soil nutrients and plant diversity in old-growth forests of south-central Chile, 1, 2, and 3 years after a fire that occurred in 2015. Within ancient, old-growth Araucaria araucana (Mol.) K. Koch and Nothofagus pumilio (Poepp. and Endl.) Krasser forests, ranging from areas burned with fire of high severity to unburned forests, we evaluated nitrogen (N), phosphorus (P), potassium (K), and soil organic matter (SOM) content using spatial interpolation to predict their spatial distribution and assessed their availability over time. We also assessed plant species richness and abundance following the fire. The availability of N noticeably increased during the first year after fire but rapidly decreased in the following years, especially in areas of high fire severity. P, K, and SOM were less affected by the fire, remaining more constant over time. In the short term, plant species richness and diversity significantly decreased in severely burned areas, but over time, they became more similar to those of the unburned forests. The time since a fire and its severity determine a heterogeneous distribution of soil nutrients, with N shifting to a significantly lower availability after fire, which was more notable in areas of high fire severity. Here, vegetation exhibited a decrease in plant diversity and the establishment of exotic species, likely producing cascading effects at the community level.
1. Introduction
A forest fire is a wildfire that spreads uncontrolled through woody, shrubby, or herbaceous vegetation. Ecologically, fires could be an essential and natural factor benefiting the functioning of numerous ecosystems worldwide (e.g., the savannas and the chaparral and boreal forests). In this context, they can be considered an important element that shapes the landscape, history, and evolution of vegetation [1], which helps to maintain the structure and function of fire-prone communities [2,3,4]. Fire has also been historically used by humans as a tool for land management [5]. Nonetheless, fires can also produce major disturbances, especially in ecosystems with infrequent fire regimes. Wildfires have also been linked to reduced soil fertility [6], biodiversity loss [7], and degradation of forest ecosystems [8]. Wildfires at a global scale represent a complex process influencing biogeochemical cycles, human activities, and vegetation patterns [9], and the occurrence of these fires at a global scale might respond to synergistic effects between climate, vegetation, and human activities [10]. The overall effects of fires on forest ecosystems are complex, ranging from the removal of above-ground vegetation and litter to significant impacts on soil properties [11], and the magnitude of these impacts will depend on the severity, duration, and frequency of fire events [12]. The global increase in temperatures and drought due to climate change are also key factors that predict larger and more severe forest fires in the future. Therefore, shifts in fire regimes can greatly affect important components of ecosystems, including soil structure, nutrition, and microbial diversity and functioning in forest soils.
Soil is a non-renewable resource on a human time scale and provides fundamental ecosystem services that allow life on Earth, including the supply of food, fiber, fuels, carbon sequestration, water purification, and nutrient cycling [13]. For instance, before being available for plants, soil nutrients such as nitrogen (N), potassium (K), and phosphorus (P) are mostly recycled by microbes during decomposition processes in the soil. Thus, soil biochemical properties are essential for plant growth and recovery after disturbances (e.g., forest fires). However, many chemical, physical, and biological soil properties can be affected by forest fires, including a decrease in its humidity and infiltration capacity and higher rates of surface runoff and erosion, which in turn can lead to the loss of nutrients and soil fertility. In addition, fires can cause destruction of microbial communities and alter the organic strata in the soil [14,15].
Every year, an increasing number of forest fires take place worldwide, with an estimation of 350 million hectares burned annually [16]. In Chile, and according to the Chilean Forest Service (CONAF), fires are human caused in 99% of the cases, mainly due to negligence in the management of fire (i.e., poorly smothered bonfires) and agricultural practices (i.e., burning agricultural stubble). Peña and Valenzuela [17] reported that the increase in the number of forest fires in south-central Chile is related to the increase in areas planted with monocultures of highly flammable species and to the poor management of the rural–urban interface within the forestry plantation matrix.
Most wildfires in Chile occur in the south-central area, where most forests are located. In this area, and within the natural distribution of Araucaria araucana (Mol.) K. Koch and Nothofagus pumilio (Poepp. and Endl.) Krasser forests (hereafter termed as Auraucaria-Nothofagus forests), fire has been an historical disturbance, being considered one of the most important factors shaping the dynamics of these forests. Fire is recognized as a natural ecological process that has molded the landscape and forest ecosystems dominated by Araucaria-Nothofagus in Andean Mountains over at least the last 40 thousand years [18,19]. These forests have co-evolved with a fire regime characterized by a combination of uncommon severe fires and common low-severity fires (in intervals of ca. 60–100 years). This has determined the presence of adaptive traits in A. araucana, such as a thick bark, natural pruning of low branches, and the capacity for vegetative sprouting after a fire [20,21]. Nevertheless, this fire regime has been modified through the last decades, showing a remarkable increase in the frequency and severity of fires [7]. This coincides with the Euro-Chilean colonization of the area [17,22]. The increase has also been facilitated by the occurrence of droughts that have affected south-central Chile since 1960 [23].
Ecosystems formed by ancient A. araucana forests are particularly valuable because of their significant biodiversity and cultural value [24,25]. Historically, A. araucana forests used to cover ca. 500,000 ha in Chile, but during 1920–1970, the area covered by the species was drastically reduced, by almost 50%, due to logging, fires, and other disturbances [22]. Today, A. araucana is a natural monument and classified as an endangered species in Chile, with complete prohibition of logging. Despite the legal protection, A. araucana populations—including those in national parks and reserves—are still experiencing an increased risk of degradation [26,27,28].
Studies evaluating the impact of fire on soil properties of old-growth Araucaria-Nothofagus forests are scarce (but see Rivas et al. [29]) and usually short term [30,31]. Moreover, research examining the spatial distribution of soil nutrients over time is generally lacking for most of the native ecosystems in Chile. Thus, advances in elucidating both the temporal and spatial variation in nutrient availability and vegetation response to these potential variation in soils are indeed useful for better planning of restoration action within burned forests. Toward that end, the specific questions we set out to answer were, (a) what is the spatial and temporal variation in soil organic matter and macronutrient availability within a fire-severity gradient in ancient Araucaria-Nothofagus forests, and (b) how does this variation in soil nutrient relate to vegetation recovery after fire?
2. Materials and Methods
2.1. Study Area
This study was carried out in the National Reserve China Muerta, which is located in La Araucanía region in south-central Chile (38° S; Figure 1a). The landscape has a rough topography, with an altitude ranging from 800 to 1850 m a.s.l. The climate is temperate and warm, with less than 4 months of drought and snow because of the effect of altitude. The mean annual temperature for summer (December to March) is 19 °C, whereas for winter (June to September), it is 5 °C. The mean annual rainfall is 2500 mm, with a dry period between December and March. Soils are developed from recent volcanic ashes (Andisols and Histosols orders) and are well stratified, deep, and dark brown in color, with a coarse texture and permeability throughout the profile [32].
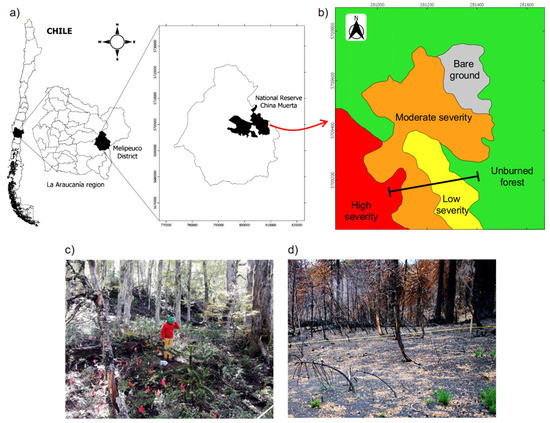
Figure 1.
(a) Study area in the National Reserve China Muerta, La Araucanía region (38° S, 71° W), south-central Chile. (b) Map of the different levels of fire severity that affected the study area, and the location of the transect used to sample soil variables. (c,d) Pictures of the study sites showing the unburned forest and areas of high fire severity, respectively.
The vegetation in the study area is dominated by the native conifer Araucaria araucana and the deciduous broad-leafed Nothofagus pumilio. This forest belongs to the Andean-Patagonian and to the Andean deciduous forests, which occur mostly in the Andes Mountains (37°45′ to 40°20′ S), including the Chilean and Argentinean range [33]. The understory vegetation is composed by the shrubs Chusquea culeou E. Desv., Maytenus disticha (Hook. f.) Urb., and Gaultheria poeppigii DC., and the herbaceous layer is represented by Osmorhiza chilensis Hook. and Arn., Viola reichei Skottsb., and Adenocaulon chilense Less. [34].
2.2. Description of the Forest Fire
During March and April of 2015, a wildfire outbreak affected the south-central area in Chile. The 2015 wildfire that affected the National Reserve China Muerta was active for 23 days and burned 3765 ha of Araucaria-Nothofagus natural forests. According to the Chilean Forest Service (CONAF), the fire started as the result of a poorly smothered bonfire that quickly spread throughout the landscape, which was favored by several preceding years of drought [35]. By using satellite imagery analyses (i.e., Landsat-8/OLI) and the dNBR index (differential normalized burn ratio; [36]), CONAF defined three levels of fire severity: high, moderate, and low (Figure 1b). The areas of low fire severity (LS) presented a dNBR between 0.1 and 0.35, the areas of moderate severity (MS) had a dNBR between 0.36 and 0.6, and the areas of high fire severity (HS) presented a dNBR index > 0.6 [37] (Figure 1d). Subsequent to this classification, we characterized each level of fire severity in the field by describing the degree of damage caused by the fire on trees and the understory vegetation (see details in Fuentes-Ramirez et al. [7]). Additionally, we used an adjacent unburned forest (UBF) with no signs of damage caused by the fire to serve as a reference (i.e., representing the conditions prior to fire). The unburned forest presented an dNBR index < 0.1 (Figure 1c) and is assumed to be similar in its soil variables to the burned areas before the fire.
2.3. Sampling Design and Data Collection
Within the study area, we selected an area of 60 ha (1200 × 500 m approximately) that included the three fire severity levels described above, as well as the unburned forest (i.e., 30 ha of UBF, 7 ha of LS, 14 ha of MS, and 9 ha of HS). This area presented homogeneous site conditions: a mean elevation of 1425 m a.s.l., a N-NE aspect, 10–20% slope, similar vegetation, and the same type of soil [7]. Within the burned area, we established a 130 m × 20 m transect that was designed to collect soil samples evenly spaced every 5 m along the burn gradient using a grid design (Figure 2). Each sampling location was marked using a metallic tag for further monitoring. All the recognizable plant material, as well as the ash and the charred organic matter, was removed before the soil sampling was conducted. Using a soil corer (10 cm × 12 cm diameter and height, respectively), we collected samples from the first 0–10 cm of the mineral soil horizon. Each sample (of approximately 1 kg) consisted of a mixture of four sub-samples collected randomly within a 50 cm diameter circle at each sampling location defined by the grid. We collected 35 samples of ca. 500 g from each of the three fire severity levels (i.e., HS, MS, and LS) and 35 from the UBF, totaling 140 samples. The sampling was conducted in April 2017 and was repeated in April 2018 using the same above-mentioned protocol and at the same locations. These periods represent soil conditions at 2 and 3 years after the fire, respectively. The soil samples were labeled in plastic bags and stored at 4 °C to be further processed for nutrient content in the Soil and Plant Laboratory at Universidad de La Frontera. The variables considered in the study were N, P, K, and SOM. The N content was determined by the Kjeldahl method [38]. The available P content was determined by extraction with NaHCO3 at pH 8.5 [39]. The available K was determined by the methodology developed by Mingorance [40]. The OM was determined by the method described by Walkley and Black [41].
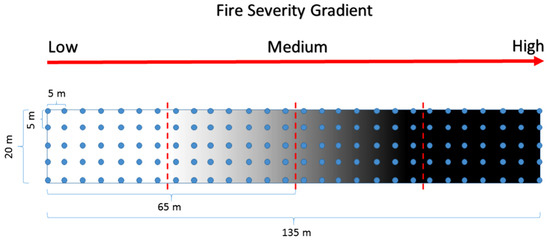
Figure 2.
Sampling design for the collection of soil data within a fire severity gradient. The dashed red line indicates the change from one fire severity level to another. The blue dots represent the places where we took soil samples from. Both the red arrow and the gray-shade gradient in the figure indicate the increase in fire severity along the experimental area running from the south to the north.
2.4. Vegetation Assessment
In addition to characterizing soil variables after fire, we surveyed the post-fire recovery of vegetation across the three levels of fire severity. A total of 20 permanent square sampling plots of 100 m2 each were established along the burn gradient (i.e., five per severity level and the unburned forest). Within each plot, we sampled all vascular plants in the summer season (January) of 2016, 2017, and 2018, which correspond to 1, 2, and 3 years after the fire, respectively. The unburned forest plots were measured in 2016 and were not remeasured in the following years as the area did not experience further disturbances, and the weather conditions were similar in 2017 and 2018 (see Urrutia-Estrada et al. [34]). We assessed species richness, plant abundance (i.e., the number of individuals at the plot scale), and species origin (i.e., native or non-native species). Unknown specimens and small seedlings were collected and identified afterward following specialized literature [42,43,44].
2.5. Statistical Analyses
Firstly, we determined whether the fire severity, the time elapsed since the fire, and the interaction of these two factors had a significant effect on the mean availability of soil nutrients (N, P, and K) and on the SOM. Since our data did not meet normality assumptions nor were normalized by traditional means (i.e., log-transformation of the response variable), we used the non-parametric Kruskal–Wallis test [45], with a significance level of α = 0.05.
Then, to determine significant differences between the levels of fire severity and the time since the fire, we used the Mann–Whitney U test [46]. We used the statistical software R to conduct these analyses [47].
Secondly, spatial interpolation analyses were performed based on the data obtained on N, P, and K in the years 2017 and 2018. We decided to exclude SOM from this analysis because it is measured in percentage, unlike N, P, and K, which are measured in mg/kg. To perform the analyses, we log-transformed the data to stabilize the variation [48]. Though this procedure is not indispensable to building the spatial semivariogram, it is essential for using the semivariogram in the interpolation process to predict values of a given variable, since spatial interpolation techniques are sensitive to extreme values [49].
We determined the distribution of N, P, and K through the Kriging method. This method uses the parameters estimated by the semivariogram fit to generate a spatial interpolation of soil variables. To model the experimental semivariograms and to obtain the spatial structure information, as well as the parameters for the estimation, we selected the exponential model. In addition, to check the goodness of the fit, we calculated the squared sum of errors (SSErr), which is widely used and a reliable measure for this analysis. We used the gstat R package to carry out these analyses [50,51]. To assess the post-fire availability of soil nutrients (i.e., net losses and gains after the fire), the predicted values obtained from the interpolation were re-transformed from the logarithmic scale back to natural numbers. With this, we calculated the balance of nutrient concentrations between 2017 and 2018, and the differences in these concentrations (i.e., delta values) were graphically represented to show the net availability of nutrients across the fire-severity gradient from the second to the third year.
Finally, we compared species richness between each level of severity, including the UBF, by carrying out a randomization test. This provides an assessment of plant recovery after fire. The analysis computes the quantiles at p = 0.975 and p = 0.025, corresponding to a global interval of 95%. If the observed difference in species richness is well above the upper quantile value, this indicates that the observed difference is much larger than expected under the null hypothesis of no difference between severity levels [7]. We used the R package rich for computing the randomization test [52]. We also computed the Shannon–Wiener diversity index (H’) for each fire severity level (including UBF condition) using the vegan package in R [53] and performed a paired t-test to identify statistical differences between fire severity levels for H’. Finally, we conducted repeated measurements ANOVAs with the stats R package to assess the plant abundance across the fire severity gradient for each year of the study [47].
3. Results
3.1. Temporal Variation in Soil Nutrients
After the wildfire that affected the forest, our results showed a rapid increase in N in the first year after the fire (i.e., 2016) across the entire severity gradient. However, N availability drastically decreased in the second (i.e., 2017) and the third (i.e., 2018) year following the fire (Figure 3a). There was a significant effect of fire severity, the time elapsed since the fire, and the interaction of both variables on the availability of N (Kruskal–Wallis; p-value < 0.05). We also found that there were significant differences between the unburned forest (UBF) and the other fire severity levels: LS, MS, and HS (Mann–Whitney U; p < 0.05). The test also showed that there were significant differences across all years (Mann–Whitney U; p < 0.05) and that the interaction between fire severity and the time elapsed since the fire showed significant differences in most of the cases (Mann–Whitney U; p < 0.05).
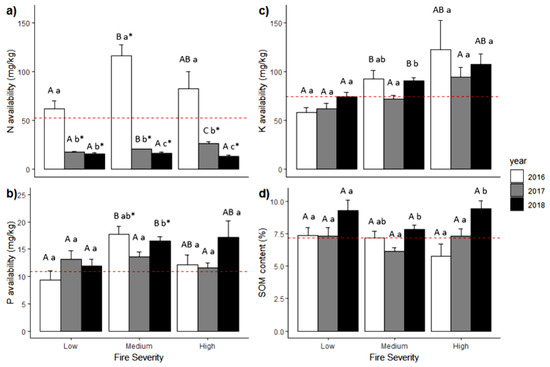
Figure 3.
Mean values (+SE) of nutrient availability within a fire gradient (low, moderate, and high severity) over the years for (a) N, (b) P, (c) K, and (d) soil organic matter. The dashed red line is the reference mean value from the unburned forest. The uppercase letters represent significance difference between the fire severity levels in the same year (α = 0.05), and the lowercase letters represent significance difference within the same fire severity level across the years (α = 0.05) using Mann–Whitney U test. The asterisk (*) represents a significant difference compared to the unburned forest.
Meanwhile, the availability of P increased in MS during the first and the second year (i.e., 2016 and 2017) and decreased slightly in HS. In addition, P availability during the third year (2018) increased across all fire severity levels compared to UBF (Figure 3b). The results showed that fire severity, the time elapsed since the fire, and the interaction between both variables had a significant effect on P availability (Kruskal–Wallis; p-value < 0.05). We also found that the interaction between fire severity and the time since the fire had significant differences in just a few cases.
Regarding K, we found that it was higher in the third year across all fire severity levels except in LS. K availability decreased during the second year but increased across all severity levels in the third year (Figure 3c). Our results indicate that fire severity, the time since the fire, and the interaction of both variables have a significant effect on K availability (Kruskal–Wallis; p-value < 0.05). Interaction between both variables showed that, in general, during the 3 years, there were significant differences between LS and MS and LS and HS across all the years, especially in the third year.
For soil organic matter (SOM), our results showed that its content increased from one year to another in LS and HS. In the second year (2017), the SOM content was lower in MS than in other years (Figure 3d). We found that the time elapsed since the fire and the interaction between fire severity and the time since the fire had significant effects on SOM content (Kruskal–Wallis; p-value < 0.05) and that fire severity by itself did not have a significant effect on the SOM content (Kruskal–Wallis; p-value > 0.05). Results also showed significant differences between the first (2016) and the third year (2018) and between the second (2017) and the third year (Mann-Whitney U, p < 0.05). The interaction between fire severity and the time since the fire showed significant differences in a few cases, mainly between the MS of the second year and the LS and the HS of the third year, between the HS of the first year and the LS and the HS of the third year, and between the HS of the second year and the HS of the third year.
Nitrogen availability in the first year varied between 61.6 and 116.2 mg/kg on average. The mean in this period exceeded the mean availability in the UBF, while in the following years, N availability decreased and kept between 17 and 26.1 mg/kg for the second year and between 13 and 16.3 mg/kg during the third year. The mean availability of P showed some variation through the fire severity gradient and across the time after the fire, keeping between 9.4 and 17.1 mg/kg. The mean K availability changed through the fire severity gradient and also with the time elapsed since the fire, going from 57.8 to 121.9 mg/kg. The mean content of SOM across all fire severity levels and the time since the fire varied between 5.8 and 9.4% (see Table S1 in Supplementary Material for details of summary statistics of the soil variables evaluated in the study).
3.2. Spatial Pattern of Soil Nutrients
We chose the exponential model to model the semivariogram based on its lower SSErr values. From fitting this model, we obtained the estimated parameters that were used to predict the soil nutrient concentration for N, P, and K through spatial interpolation, i.e., Kriging (see Table 1). Our results showed that when comparing the semivariograms for N between 2017 and 2018, the spatial variation in 2017 was much lower than that in 2018, meaning that the overall variability of N among locations increased and became more heterogeneous over time. Nitrogen was the nutrient whose spatial variation increased the most during the years of study, compared with P and K (Figure 4a). Contrarily, K showed a decrease of at least twice as much in the semivariance from one year to another, meaning that the overall spatial variability declined and became more homogeneous over time (Figure 4c). However, P did not undergo great changes in spatial variability between 2017 and 2018 (Figure 4b). Regarding the distance at which locations are spatially independent of each other (the range in the x-axis), this increased by almost 5 m in the case of N and P, unlike K, whose range decreased by approximately 1 m (Figure 4a–c).

Table 1.
Parameters of the fitted models for semivariograms of the soil nutrients. The Nugget (C0) indicates the variance not explained by the model. The Sill (C0 + C) represents the maximum semivariance found between a pair of sample points. The Range (m) is the distance at which the semivariance no longer increases (i.e., the distance at which soil nutrients are spatially independent among samples). The SSErr indicates the squared sum of errors associated to each model fit.
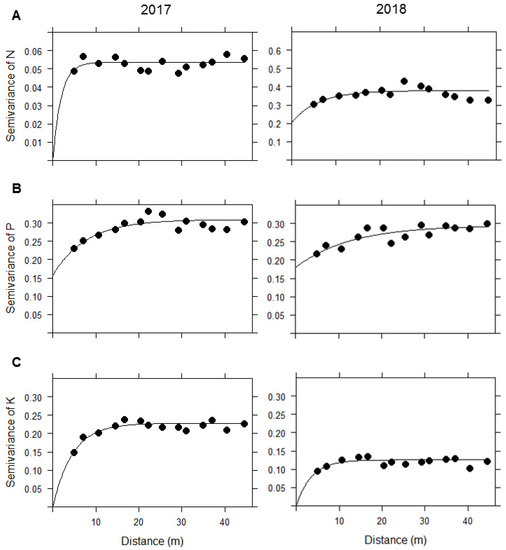
Figure 4.
Semivariograms of the fitted models for (A) N, (B) P, and (C) K in 2017 and 2018. The black dots indicate the semivariance values of the data as a function of distance, while the solid line represents the fitted exponential model associated with each nutrient.
The spatial distribution of the predicted concentrations for each nutrient in the fire severity gradient changed across the time, from 2017 to 2018 (Figure 5). For N, we found that there were losses for almost the entire gradient, but mainly in MS and HS, with an average of −6 mg/kg throughout the gradient (Figure 5a). The availability of P does not show a great variation through the fire severity gradient, except for areas of HS, where the gains are slightly higher (Figure 5b). On average, there is net gain for P of 2 mg/kg. For K, we found gains across the entire severity gradient, with an average of +15 mg/kg (Figure 5c).
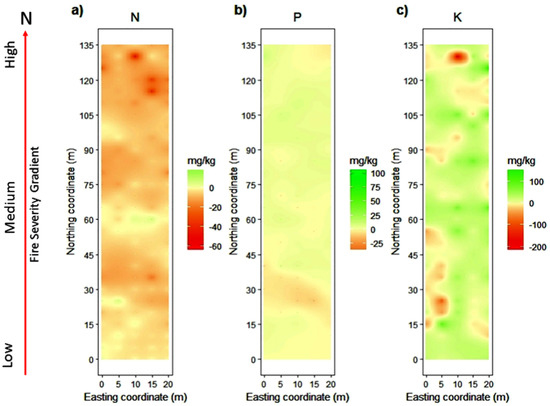
Figure 5.
Change in the soil nutrient balance from 2017 to 2018 for (a) N, (b) P, and (c) K within a fire severity gradient from low to high severity. Nutrient concentrations are expressed in mg/kg, and the red arrow indicates the direction in which the fire severity increases through the gradient in the study area.
3.3. Impact of Fire on Vegetation
In the unburned forest (UBF), which we assume corresponds to the conditions prior to fire, we recorded 31 vascular plant species. Among these, only one species was exotic. From the pool of species recovering only in the burned areas (i.e., LS, MS, and HS), in 2016 the pooled richness was 43 species (with 16.3% of exotics). In 2017, we found 49 species, (20.4% of exotics), and in the third year (2018), we recorded a pooled richness of 55 species, with 18.2% of exotics. Along the entire fire gradient, we registered 34, 15, and 14 species for LS, MS, and HS 1 year after the fire (2016), respectively. The increase in species richness over time was 15% in LS, 93% in MS, and 70% in HS in the third year after the fire. Species richness in the UBF differed significantly from the richness resulting from HS and MS levels (p-values < 0.05). However, differences in species richness among these conditions tended to decrease over time, becoming more similar to that in the unburned forests (Table 2).
Table 2.
Plant species richness, mean plant abundance per hectare, and mean Shannon–Wiener index (H’) for vegetation evaluated after the fire. Different letters represent statistically significant differences (at α = 0.05) between the period of evaluation within each year. Significant differences compared to the unburned forest (UBF) are represented by *** for p < 0.001, ** for p < 0.01, and * for p < 0.05. LS = low severity, MS = moderate severity, and HS = high severity.
Regarding plant abundance, we found that fire severity, the time elapsed since the fire, and the interaction of both factors had a significant effect on plant abundance (F3,16 = 28.38, F2,24 = 233.2, F4,24 = 21.57, respectively; p < 0.001). Within the fire severity gradient, there were statistical differences in plant abundance for all severity levels compared to the UBF, where the mean plant abundance was 47,640 individuals/ha. In general, for the following years, the mean plant abundance for LS, MS, and HS showed an increasing trend with high variability (see Table 2). We noted that invasive exotic species were becoming more abundant after the fire, specially within areas of high severity.
4. Discussion
Forest fires can alter biogeochemical cycles of essential nutrients for plant growth, such as N, P, and K [54]. According to our study, N, P, and K availabilities are affected by fire severity and/or the time elapsed since the fire, while soil organic matter (SOM) depends on the time since the fire or the interaction between fire severity and the time since the fire. Fire severity does not seem to be a factor that by itself influences SOM availability.
Our study revealed that N availability increased noticeably during the first year after the fire (i.e., 2016), being higher than in the unburned forest. This is due to the fact that moderate- to high-severity forest fires convert organic N to its inorganic forms, increasing the ammoniacal fraction and nitrates, therefore increasing N availability [6,55]. Nitrogen reaches its highest availability in moderately severe sites during the first year, in contrast to the following years, where the change is probably due to losses. This coincides with the results obtained in the spatial interpolation analysis, which showed that from 2017 to 2018, there were only N losses, which were exerted more strongly in high fire severity. It has been shown that nitrate (NO3-) is highly mobile in soil and is easily leached, with the nitrification process being one of the main sources of N loss in forest soils [56]. After a forest fire, the soil tends to be bare, which favors processes such as wind or water erosion and leaching of nutrients [57,58]. This could explain the decrease in N concentration over time. After the first year, the decrease in N can also be explained by plant uptake. Our results showed that within all fire severity levels, there was an increase in species richness and abundance for each year compared to the previous one. This is also reported by Shenoy et al. [59], who showed higher N uptake at sites affected by high-severity fires, suggesting that this could be due to changes in the physical-chemical characteristics, such as decreasing diffusion distances between nutrient ions and root surfaces in severely burned sites versus areas lightly burned.
Verma and Jayakumar [60] found that other nutrients are less affected by fire than N, which is confirmed by the analysis conducted for the second and the third year in this study (i.e., 2017 and 2018), showing that N exhibited great losses across most of the fire severity gradient, unlike P and K. Moreover, a study carried out by Murphy et al. [61] indicates that the most significant fire effect in the short term is an increase in the concentration of N and P in the soil. However, the impacts of fire on N and P are not necessarily the same, since the loss of P by volatilization or leaching is generally minimal. Combustion of litter and vegetation causes great modification in the P cycle [6]. In our study, P showed the highest availability in moderate fire severity during the 3 years (i.e., 2016, 2017 and 2018), with the first year showing the highest availability compared to the following years. We also found that P was more available in burned than in unburned forests. This might be explained by the transformation of P from organic to inorganic forms and also by the P contribution from ashes, which is highly beneficial for plant recovery shortly after a fire [62]. As with N, fire caused an increase in the concentration of P in the soil. However, the P concentration did not increase as much as N, and unlike the latter, P maintained similar and even higher values in the first year after the fire compared with the following years. The soluble pool of P may be chemisorbed to the surface of iron (Fe), manganese (Mn), and aluminum (Al) oxides and precipitate as relatively insoluble phosphates, playing a key role in P retention and mobility in the soil [63]. So the P losses after fire, especially by leaching, would be less than those of N.
Potassium (K) availability was lower in low-fire-severity sites during the 3 years of the study. We found the highest K availability in moderate and high fire severity during the first year (2016), with some variation in the following years, but generally decreasing. According to Certini [6], K usually increases noticeably after a fire, but in an ephemeral way. Some studies indicate that the reduction in the cation-exchange capacity (CEC) is proportional to the reduction in the SOM [55], so K availability could be related to SOM availability. The nutrient balance from 2017 to 2018 showed that, in general, there are gains of K across the entire fire severity gradient, but with some localized losses. This may be related to site factors within the study area, such as the topography and the burning pattern during the forest fire. However, K has a geochemical origin as a consequence of weathering of mica and feldspar minerals. Only about 2% of the total K can be used by plants as most soil K is not available to plants [64]. Three years after a fire, it is expected that the regular biochemical processes that normally occur in the soil will be re-established; therefore, microbial activity (e.g., by fungi and bacteria) may explain the increase in K availability over time. It is generally accepted that one of the most important mechanisms of mineral K solubilization is the action of organic acids synthesized by microorganisms [65]. In general terms, the losses of N, P, and K depend on the net supply of these nutrients by the effect of fire, controlled by the mobilization and immobilization process (e.g., mineralization, plant uptake, and cation adsorption/desorption).
In our study, we found that the SOM content was higher during the third year across the entire fire severity gradient, unlike previous years. However, there are no significant differences with the unburned forest. The fire effect on the SOM is highly variable, as it can go from the total destruction of organic matter to partial charring, which can depend on fire severity, surface dryness, and forest fire patterns [60,66]. According to Mataix-Solera et al. [67], the SOM content usually decreases during high-severity forest fires if the fire has directly affected the upper superficial horizons, whereas in low-severity fires, it can increase by the contribution of the semi-pyrolyzed plant material, which has been expressed in the results of the first year of study (i.e., 2016).
According to Certini [6], the SOM content decreases immediately after a fire, but in the long term, it increases even further, exceeding its availability before the fire. The latter may be due to the decomposition of the vegetative material that remains in the soil after the fire and also the increase in microbial activity found in burned areas during the first year after a fire [31]. This reveals that nutrient cycling is also affected by the alteration in soil microorganisms following a fire [60,68].
Mataix-Solera and Guerrero [55] reported that after a forest fire, there can be an ephemeral but crucial increase in soil fertility caused by N, P, and K being returned into the soil in the form of ashes. This promotes early plant recovery in the forest. According to Escudey et al. [69], forest fire ash incorporation is mostly positive in soils since it reduces soil acidification, increases K availability, and increases the soil retention capacity for P. In this study, species richness 1 year after the fire decreased considerably within high- and moderate-severity areas compared to the unburned forest. This was due to the direct effect of fire, which eliminated much of the plant cover presented in the burned areas. Meanwhile, in the low-severity areas, we observed similar values of richness and even slightly higher than those in the UBF. An increased availability of nutrients, especially N, in the soil after a fire would have allowed a rapid recovery of vegetation [70], which is reflected in the increase of plant species richness and abundance in the second and third year of the study. Similarly, this could explain the decrease in N values in the second (2017) and the third year (2018), which would have been absorbed by the plants in the recovery process. This is consistent with results obtained by Arroyo-Vargas et al. [71], where they found that the first year after a fire, there is a rapid recovery of vegetation, which could also be related to the increase in the SOM over time. Santelices and Litton [14] also found a similar response of vegetation within recently burned areas, in which herbaceous species rapidly recovered due to the advantage of soil nutrients that were available in the short term after a fire. Another important result from this study is that the increase in the species richness after the fire was marked by the presence of exotic species, which is common in disturbed areas [72]. This may imply that changes in soil nutrient availability following a fire might further promote the establishment of exotic species [72]. This could cascade into potential negative impacts for native vegetation that will encounter higher levels of competition for soil resources that are scarce after forest fires.
5. Conclusions
We conclude that forest fires in Andean Araucaria-Nothofagus forests affect the availability and spatial distribution of soil nutrients by fire severity, by the time elapsed since the fire, or by the interaction of both variables. The SOM content and distribution are affected by the time elapsed since the fire, or by the interaction between fire severity and the time since the fire. N availability had a noticeable increase during the first year (2016). However, N availability decreased over time due to various processes, such as leaching and plant nutrient uptake. This decrease is greater in areas affected by high-severity fires. In general, P and K availability increased after the fire. Nevertheless, P availability varied depending on fire severity during the first year, while during the third year (2018), it increased as the fire severity increased. In the case of N, P, and K, nutrient availability in areas affected by moderate- and high-severity fires increased after the fire due to the contribution of nutrients produced by the combustion of plant material. The SOM content decreased slightly after the fire.
Only N availability decreases over the time, while P, K and SOM availability increases. The reason is that, unlike the rest, N is used quickly by the plants, so there is a considerable increase in plant growth the first year after a fire. More studies are needed to determine if processes such as leaching and nutrient uptake by plants are the main factors that regulate nutrient variations in the soil after a fire.
Supplementary Materials
The following supporting information can be downloaded at: https://www.mdpi.com/article/10.3390/f13030448/s1. Table S1: Summary statistics of soil data by year since the 2015 forest fire and across the fire severity gradient evaluated in the study.
Author Contributions
Conceptualization, A.F.-R. and N.M.-G.; methodology, A.F.-R., N.M.-G., and L.A.-M.; original draft preparation and writing, A.F.-R., N.M.-G., and L.A.-M.; review and editing, A.F.-R., L.A.-M., and K.A.M. All authors have read and agreed to the published version of the manuscript.
Funding
This research was funded by grants DIUFRO DI20-066 and DI21-1001 Apoyo a Postulantes FONDECYT, Dirección de Investigación Universidad de La Frontera.
Data Availability Statement
Data used in this study will be available upon request to corresponding author.
Acknowledgments
AFR thanks Centro ANID Basal FB210015. The authors are also grateful for grant ANID SCIA-Anillo ACT210052. Marcia Barrientos, Francisco Manquehual, Javier Ulloa, Paola Arroyo, and the park rangers from the National Reserve China Muerta helped with fieldwork. The reviewers made a number of comments and suggestions that greatly improved the manuscript.
Conflicts of Interest
The authors declare no conflict of interest. Funding agencies had no role in the design of the study, data collection, analyses, the writing of the manuscript, or the decision to publish the results.
References
- Sugihara, N.G.; van Wagtendonk, J.W.; Fites-Kaufman, J. Fire as an ecological process. In Fire in California’s Ecosystems; Sugihara, N.G., Wagtendonk, J.W., Fites-Kaufman, J., Shaffer, K.E., Thode, A.E., Eds.; University of California Press: Berkeley, CA, USA, 2006; pp. 58–74. [Google Scholar]
- Collins, S.L. Fire frecuency and community heterogeneity in tallgrass prairie vegetation. Ecology 1992, 73, 2001–2006. [Google Scholar] [CrossRef]
- Flannigan, M. Carbon cycle: Fire evolution split by continent. Nat. Geosci. 2015, 8, 167–168. [Google Scholar] [CrossRef]
- Pellegrini, A.F.; Hedin, L.O.; Staver, A.C.; Govender, N. Fire alters ecosystem carbon and nutrients but not plant nutrient stoichiometry or composition in tropical savanna. Ecology 2015, 96, 1275–1285. [Google Scholar] [CrossRef] [PubMed]
- Dennis, R.; Meijaard, E.; Applegate, G.; Nasi, R.; Moore, P. Impacts of human-caused fires on biodiversity and ecosystem functioning, and their causes in tropical, temperate and boreal forest biomes. In Convention on Biological Diversity (CBD) Technical Series; Open Research Library: Montreal, QC, Canada, 2001. [Google Scholar]
- Certini, G. Effects of fire on properties of forest soils: A review. Oecologia 2005, 143, 1–10. [Google Scholar] [CrossRef] [PubMed]
- Fuentes-Ramirez, A.; Salas-Eljatib, C.; González, M.E.; Urrutia-Estrada, J.; Arroyo-Vargas, P.; Santibañez, P. Initial response of understory vegetation and tree regeneration to a mixed-severity fire in old-growth Araucaria-Nothofagus forests. Appl. Veg. Sci. 2020, 23, 210–222. [Google Scholar] [CrossRef]
- Elliott, K.J.; Knoepp, J.D.; Vose, J.M.; Jackson, W.A. Interacting effects of wildfire severity and liming on nutrient cycling in a southern Appalachian wilderness area. Plant Soil 2013, 366, 165–183. [Google Scholar] [CrossRef]
- Bowman, D.M.J.S.; Balch, J.K.; Artaxo, P.; Bond, W.J.; Carlson, J.M.; Cochrane, M.A.; D’Antonio, C.M.; DeFries, R.S.; Doyle, J.C.; Harrison, S.P.; et al. Fire in the earth system. Science 2009, 324, 481–484. [Google Scholar] [CrossRef]
- Castillo, M.; Pedernera, P.; Peña, E. Incendios forestales y medio ambiente: Una síntesis global. Rev. Ambiente Desarro. 2003, 19, 44–53. [Google Scholar]
- Wittenberg, L. Post-fire soil ecology: Properties and erosion dynamics. Isr. J. Ecol. Evol. 2012, 58, 151–164. [Google Scholar] [CrossRef]
- Caon, L.; Vallejo, V.R.; Coen, R.J.; Geissen, V. Effects of wildfire on soil nutrients in Mediterranean ecosystems. Earth Sci. Rev. 2014, 139, 47–58. [Google Scholar] [CrossRef]
- Whitman, T.; Enders, A.; Lehmann, J. Pyrogenic carbon additions to soil counteract positive priming of soil carbon mineralization by plants. Soil Biol. Biochem. 2014, 73, 33–41. [Google Scholar] [CrossRef]
- Santelices, R.; Litton, C.M. Efecto del fuego sobre el bosque, la disponibilidad de nutrientes y la materia orgánica en el suelo. CIFOR 1996, 10, 205–215. [Google Scholar] [CrossRef]
- Urzúa, N.; Cáceres, F. Incendios forestales: Principales consecuencias económicas y ambientales en Chile. Interam. J. Environ. Tour. 2011, 7, 18–24. [Google Scholar] [CrossRef]
- Montanarella, L.; Scholes, R.; Brainich, A. (Eds.) Intergovernmental Science-Policy Platform on Biodiversity and Ecosystem Services IPBES. In The IPBES Assessment Report on Land Degradation and Restoration; IPBES: Bonn, Germany, 2018. [Google Scholar] [CrossRef]
- Peña, E.; Valenzuela, L. Incremento de los incendios forestales en bosques naturales y plantaciones forestales en Chile. In Memorias del Segundo Simposio Internacional sobre Políticas, Planificación y Economía de los Programas de Protección Contra Incendios Forestales, Una visión global; González, A., Ed.; USDA Forest Service: Washington, DC, USA, 2008; pp. 595–612. [Google Scholar]
- González, M.E.; Veblen, T.T. Incendios en bosques de Araucaria araucana y consideraciones ecológicas al madereo de aprovechamiento en áreas recientemente quemadas. Rev. Chil. Hist. Nat. 2007, 80, 59–72. [Google Scholar] [CrossRef]
- González, M.E.; Veblen, T.T.; Sibold, J.S. Influence of fire severity on stand development of Araucaria araucana-Nothofagus pumilio stands in the Andean cordillera of South-Central Chile. Austral Ecol. 2010, 35, 597–615. [Google Scholar] [CrossRef]
- González, M.E.; Amoroso, M.; Lara, A.; Veblen, T.T. Ecología de disturbios y su influencia en los bosques templados de Chile y Argentina. In Ecología Forestal: Bases para el Manejo Sustentable y la Conservación de los Bosques Nativos de Chile; Donoso, C., González, M.E., Lara, A., Eds.; Ediciones UACh: Valdivia, Chile, 2014; pp. 409–470. [Google Scholar]
- Fuentes-Ramirez, A.; Arroyo-Vargas, P.; Del Fierro, A.; Pérez, F. Post-fire response of Araucaria araucana (Mol.) K. Koch: Assessment of vegetative resprouting, seed production and germination. Gayana Bot. 2019, 76, 119–122. [Google Scholar] [CrossRef]
- Lara, A.; Solari, M.E.; Rutherford, P.; Thiers, O.; Trecaman, R. Technical Report. In Coverage of the Original Vegetation in Forests of the Valdivian Ecoregion around 1550; Universidad Austral de Chile and World Wildlife Foundation: Valdivia, Chile, 1999. [Google Scholar]
- Garreaud, R.; López, P.; Minvielle, M.; Rojas, M. Large-scale control on the Patagonian climate. J. Clim. 2013, 26, 215–230. [Google Scholar] [CrossRef]
- Aagesen, D. Indigenous resource rights and conservation of the monkey-puzzle tree (Araucaria araucana, Araucariaceae): A case study from southern Chile. Econ. Bot. 1998, 52, 146–160. [Google Scholar] [CrossRef]
- Reis, M.S.; Ladio, A.; Peroni, N. Landscapes with Araucaria in South America: Evidence for a cultural dimension. Ecol. Soc. 2014, 19, 43. [Google Scholar] [CrossRef]
- Zamorano-Elgueta, C.; Cayuela, L.; González-Espinosa, M.; Lara, A.; Parra-Vásquez, M.R. Impacts of cattle on the South American temperate forests: Challenges for the conservation of the endangered monkey puzzle tree (Araucaria araucana) in Chile. Biol. Conserv. 2012, 152, 110–118. [Google Scholar] [CrossRef]
- González, M.E.; Lara, A. Large fires in the Andean Araucaria forests: When a natural ecological process becomes a threat. Oryx 2015, 49, 394. [Google Scholar] [CrossRef]
- Assal, T.J.; González, M.E.; Sibold, J.S. Burn severity controls on postfire Araucaria-Nothofagus regeneration in the Andean Cordillera. J. Biogeogr. 2018, 45, 2483–2494. [Google Scholar] [CrossRef]
- Rivas, Y.; Canseco, M.I.; Knicker, H.; Etcheverría, P.; Godoy, R.; Matus, F.; Valenzuela, E.; Gallardo, R. Change in total glomalin content related to soil proteins after a wildfire in an Andisol of Araucaria araucana forests of south-central Chile. Bosque 2016, 37, 409–417. [Google Scholar] [CrossRef]
- Rivas, Y.; Huygens, D.; Knicker, H.; Godoy, R.; Matus, F.; Boeckx, P. Soil nitrogen dynamics three years after a severe Araucaria-Nothofagus forest fire. Austral Ecol. 2012, 37, 153–163. [Google Scholar] [CrossRef]
- Fuentes-Ramírez, A.; Barrientos, M.; Almonacid, L.; Arriagada-Escamilla, C.; Salas-Eljatib, C. Short-term response of soil microorganisms, nutrients and plant recovery in fire-affected Araucaria araucana forests. Appl. Soil Ecol. 2018, 131, 99–106. [Google Scholar] [CrossRef]
- Flores, J.P.; Espinosa, M.; Martínez, E.; Henriquez, G.; Avendaño, P.; Torres, P.; Ahumada, I. Determinación de la Erosión Actual y Potencial de los Suelos de Chile; Centro de Información de Recursos Naturales (CIREN): Santiago, Chile, 2010. [Google Scholar]
- Gajardo, R. La Vegetación Natural de Chile: Clasificación y Distribución Geográfica; Editorial Universitaria: Santiago, Chile, 1994. [Google Scholar]
- Urrutia-Estrada, J.; Fuentes-Ramírez, A.; Hauenstein, E. Diferencias en la composición florística en bosques de Araucaria-Nothofagus afectados por distintas severidades de fuego. Gayana Bot. 2018, 75, 12–25. [Google Scholar] [CrossRef]
- Garreaud, R.D.; Alvarez-Garreton, C.; Barichivich, J.; Boisier, J.P.; Christie, D.; Galleguillos, M.; LeQuesne, C.; McPhee, J.; Zambrano-Bigiarini, M. The 2010–2015 megadrought in central Chile: Impacts on regional hydroclimate and vegetation. Hydrol. Earth Syst. Sci. 2017, 21, 6307–6327. [Google Scholar] [CrossRef]
- Key, C.H.; Benson, N.C. Measuring and remote sensing of burn severity: The CBI and NBR. In Proceeding of the Joint Fire Science Conference, Boise, ID, USA, 15–17 June 1999; Neuenschwander, L.F., Ryan, K.C., Eds.; University of Idaho and International Association of Wildland Fire: Boise, ID, USA, 1999; p. 284. [Google Scholar]
- Mora, M.; Crisótomo, R. Incendios forestales: Bajo el ojo de la teledetección. In Revista Chile Forestal. Informe técnico N° 383; Corporación Nacional Forestal (CONAF): Santiago, Chile, 2013. [Google Scholar]
- Kjeldahl, J. New method for the determination of nitrogen in organic bodies. J. Anal. Chem. 1883, 22, 366–382. [Google Scholar] [CrossRef]
- Olsen, S.R.; Sommers, L.E. Phosphorus. In Methods of Soil Analysis; Page, A.L., Ed.; American Society of Agronomy: Madison, WI, USA, 1982; pp. 403–430. [Google Scholar]
- Mingorance, M.D. Focused microwave-assisted digestion of vegetal materials for the determination of essential mineral nutrients. Anal. Bioanal. Chem. 2002, 373, 153–158. [Google Scholar] [CrossRef] [PubMed]
- Walkley, A.; Black, I.A. An examination of the Degtjareff method for determining soil organic matter and a proposed modification of the chromic acid titration method. Soil Sci. 1934, 37, 29–38. [Google Scholar] [CrossRef]
- Matthei, O. Manual de las Malezas que Crecen en Chile; Universidad de Concepción: Santiago, Chile, 1995. [Google Scholar]
- Zuloaga, F.; Morrone, O.; Belgrano, M. Catálogo de las plantas vasculares del cono sur (Argentina, Sur de Brasil, Chile, Paraguay y Uruguay). In Monographs in Systematic Botany from the Missouri Botanical Garden; Missouri Botanical Garden Press: St. Louis, MO, USA, 2008. [Google Scholar]
- Teillier, S.; Marticorena, A.; Macaya, J.; Bonemaison, C.; Delaunoy, J. Flora de la Reserva Biológica Huilo. In Guía para la Identificación de las Especies; Ediciones Fundación Huilo-Huilo: Santiago, Chile, 2014; Volume 1–3. [Google Scholar]
- Kruskal, W.H.; Wallis, W.A. Use of ranks in one-criterion variance analysis. J. Am. Stat. Assoc. 1952, 48, 907–911. [Google Scholar] [CrossRef]
- Mann, H.B.; Whitney, D.R. On a test of whether one one of two random variables is stochastically larger than the other. Ann. Math. Statist. 1947, 18, 50–60. [Google Scholar] [CrossRef]
- R Core Team. R: A language and environment for statistical computing. In R Foundation for Statistical Computing; R Core Team: Vienna, Austria, 2021; Available online: http://www.R-project.org/ (accessed on 1 March 2022).
- Webster, R.; Oliver, M.A. Geostatistics for Environmental Scientists: Second Edition; Wiley: Chichester, UK, 2007. [Google Scholar]
- Gallardo, A. Geoestadística. Ecosistemas 2006, 15, 48–58. [Google Scholar] [CrossRef]
- Pebesma, E.J. Multivariable geostatistics in S: The gstat package. Comput. Geosci. 2004, 30, 683–691. [Google Scholar] [CrossRef]
- Gräler, B.; Pebesma, E.; Heuvelink, G. Spatio-Temporal Interpolation using gstat. R J. 2016, 8, 204–218. [Google Scholar] [CrossRef]
- Rossi, J.P. Rich: An R package to analyse species richness. Diversity 2011, 3, 112–120. [Google Scholar] [CrossRef]
- Oksanen, J.; Blanchet, F.G.; Friendly, M.; Kindt, R.; Legendre, P.; McGlinn, D.; Minchin, P.R.; O’Hara, R.B.; Simpson, G.L.; Solymos, P.; et al. Vegan: Community Ecology Package. R Package Version 2.4-6. 2018. Available online: https://cran.r-project.org/ (accessed on 1 March 2022).
- Smithwick, E.A.; Turner, M.G.; Mack, M.C.; Chapin, F.S. Postfire soil N cycling in northern conifer forests affected by severe, stand-replacing wildfires. Ecosystems 2005, 8, 163–181. [Google Scholar] [CrossRef]
- Mataix-Solera, J.; Guerrero, C. Efectos de los incendios forestales en las propiedades edáficas. In Incendios Forestales, Suelos y Erosión Hídrica; Mataix-Solera, J., Ed.; Caja Mediterráneo, CEMACAM Font Roja-Alcoi: Alicante, España, 2007; pp. 5–40. [Google Scholar]
- Gundersen, P.; Schmidt, I.K.; Raulund-Rasmussen, K. Leaching of nitrate from temperate forests- effects of air pollution and forest management. Environ. Rev. 2006, 14, 1–57. [Google Scholar] [CrossRef]
- Stevens, M.R. Analysis of Postfire Hydrology, Water Quality, and Sediment Transport for Selected Streams in Areas of the 2002 Hayman and Hinman Fires, Colorado; US Geological Survey: Reston, VI, USA, 2013. [CrossRef]
- Bodí, M.B.; Martin, D.A.; Balfour, V.N.; Santín, C.; Doerr, S.H.; Pereira, P.; Cerdà, A.; Mataix-Solera, J. Wildland fire ash: Production, composition and eco-hydro-geomorphic effects. Earth-Sci. Rev. 2014, 130, 103–127. [Google Scholar] [CrossRef]
- Shenoy, A.; Kielland, K.; Johnstone, J.F. Effects of fire severity on plant nutrient uptake reinforce alternate pathways of succession in boreal forests. Plant Ecol. 2013, 214, 587–596. [Google Scholar] [CrossRef]
- Verma, S.; Jayakumar, S. Impact of forest fire on physical, chemical and biological properties of soil: A review. Proc. Int. Acad. Ecol. Environ. Sci. 2012, 2, 168–176. [Google Scholar]
- Murphy, J.D.; Johnson, D.W.; Miller, W.W.; Walker, R.F.; Carroll, E.F.; Blank, R.R. Wildfire Effects on Soil Nutrients and Leaching in a Tahoe Basin Watershed. J. Environ. Qual. 2006, 35, 479–489. [Google Scholar] [CrossRef]
- Mataix-Solera, J.; Guerrero, C.; Arcenegui, V.; Bárcenas, G.; Zornoza, R.; Pérez-Bejarano, A.; Bodí, M.B.; Mataix-Beneyto, J.; Gómez, I.; García-Orenes, F.; et al. Los incendios forestales y el suelo: Un resumen de la investigación realizada por el Grupo de Edafología Ambiental de la UMH en colaboración con otros grupos. In Efectos de los Incendios Forestales Sobre los Suelos en España: El Estado de la Cuestión Visto por los Científicos Españoles; Cerdà, A., Mataix-Solera, J., Eds.; Universitat de València: Valencia, España, 2009; pp. 185–217. [Google Scholar]
- Riggle, J.; von Wandruszka, R. 31P NMR peak width in humate-phosphate complexes. Talanta 2007, 73, 953–958. [Google Scholar] [CrossRef] [PubMed]
- Zörb, C.; Senbayram, M.; Peiter, E. Potassium in agriculture: Status and perspectives. J. Plant. Physiol. 2014, 171, 656–669. [Google Scholar] [CrossRef]
- Meena, V.S.; Maurya, B.; Verma, J.P. Does a rhizospheric microorganism enhance K+ availability in agricultural soils? Microbiol. Res. 2014, 169, 337–347. [Google Scholar] [CrossRef] [PubMed]
- Neary, D.G.; Klopatek, C.C.; DeBano, L.F.; Ffolliott, P.F. Fire effects on belowground sustainability: A review and synthesis. For. Ecol. Manag. 1999, 122, 51–71. [Google Scholar] [CrossRef]
- Mataix-Solera, J.; Cerdà, A.; Arcenegui, V.; Jordán, A.; Zavala, L.M. Fire effects on soil aggregation: A review. Earth-Sci. Rev. 2011, 109, 44–60. [Google Scholar] [CrossRef]
- González-Pérez, J.A.; González-Villa, F.; Almendros, G.; Knicker, H. The effect of fire on soil organic matter—A review. Environ. Int. 2004, 30, 855–870. [Google Scholar] [CrossRef]
- Escudey, M.; Arancibia-Miranda, N.; Pizarro, C.; Antilén, M. Effect of ash from forest fires on leaching in volcanic soils. Catena 2015, 135, 383–392. [Google Scholar] [CrossRef]
- Kutiel, P.; Naveh, Z. The effect of fire on nutrients in a pine forest soil. Plant Soil 1987, 104, 269–274. [Google Scholar] [CrossRef]
- Arroyo-Vargas, P.; Fuentes-Ramirez, A.; Muys, B.; Pauchard, A. Impacts of fire severity and cattle grazing on early plant dynamics in old-growth Araucaria-Nothofagus forests. For. Ecosys. 2019, 6, 44. [Google Scholar] [CrossRef]
- Fuentes, N.; Pauchard, A.; Sánchez, P.; Esquivel, J.; Marticorena, A. A new cpomprehensive database of alien plant species in Chile based on herbarium records. Biol. Invasions 2013, 15, 847–858. [Google Scholar] [CrossRef]


Publisher’s Note: MDPI stays neutral with regard to jurisdictional claims in published maps and institutional affiliations. |
© 2022 by the authors. Licensee MDPI, Basel, Switzerland. This article is an open access article distributed under the terms and conditions of the Creative Commons Attribution (CC BY) license (https://creativecommons.org/licenses/by/4.0/).