Abstract
Ecosystem services are directly related to human well-being. Previous studies showed that management policies and human activities alter the trade-offs and synergies of ecosystem services. Taking effective measures to manage the trade-offs and synergies of ecosystem services is essential to sustain ecological security and achieve a “win-win” situation between society and ecosystems. This study investigated the spatiotemporal changes of water yield, soil conservation, and carbon sequestration in the Jiulianshan National Nature Reserve from 2000 to 2020 based on the InVEST model. We distinguished spatial patterns of trade-offs and synergies between ecosystem services using the correlation relationship analysis. Then we analyzed the response of ecosystem services relationships among different vegetation types and elevation bands. The results showed that water yield and carbon sequestration presented an overall upward trend, while soil conservation remained a marginal degradation. Rising ecosystem services were mainly in the central, western, and southeastern regions, and declining areas were mainly distributed in the midwestern and northeastern fringes. Synergies spatially dominated the interactions among water yield, soil conservation, and carbon sequestration, and the trade-offs were primarily concentrated in the northern, southern, and southwestern fringes. Among the different vegetation types, synergies dominated ecosystem services in broad-leaved forests, coniferous forests, mixed forests, and Moso bamboo forests and in grass. The trade-offs were gradually reduced with elevation. This study highlighted that trade-off of ecosystem services should be incorporated into ecological management policies, strengthening the effectiveness of nature reserves in protecting and improving China’s ecosystem services.
1. Introduction
Ecosystem services are defined as benefits derived from ecosystems and which are the basis for human survival and sustainable socioeconomic development [1]. However, the supply capacity of ecosystem services has decreased with global change and rapid socioeconomic development [2,3]. According to a report of the Millennium Ecosystem Assessment (MEA), approximately 60% of the world’s ecosystem services are in degradation, which could threaten global ecological security [4]. Therefore, policymakers should better understand the spatiotemporal dynamics and relationships of ecosystem services for designing sustainable ecological management policies [5,6].
The contradiction between human demands and ecosystem diversity leads to the complex relationships of ecosystem services. Synergies and trade-offs are typical relationships of ecosystem services [7]. Synergies are situations in which the combined effect of both services is greater than the sum of their separate effects [8]. Trade-offs are situations in which one ecosystem service increases due to a decline in another ecosystem service [9]. In trade-off situations, management decisions need to be made between options for enhancing ecological benefits that cannot be satisfied simultaneously, leading to changes in ecosystem service interactions [10]. Reducing the impacts of trade-offs and enhancing synergies should be a key consideration in making ecosystem management policies [11]. Therefore, clarifying the trade-offs and synergies among multiple ecosystem services is necessary to design ecological protection and sustainable development policies [12].
Statistical analysis methods have been widely used to identify trade-offs and synergy relationships between ecosystem services in previous studies [13,14]. For example, Bai et al. applied correlation analysis to compare the relationships among ecosystem services in the Baiyangdian watershed [15]. Turner et al. used cluster analysis to identify ecosystem service bundle types, then analyzed the multiple interactions of ecosystem services in Denmark [16]. However, the relationships of ecosystem services are not always linear and vary over time and space [17]. Existing methods for ecosystem services trade-offs cannot reflect the non-linear relationships and spatial heterogeneity of ecosystem services. Moreover, most previous studies focused on quantifying ecosystem service relationships through the snapshot approach or static analysis [18,19]. Research for long-time series based on spatially explicit methods is needed to improve the efficiency of regional ecological management [20].
Conservation areas were designated to protect the environment and maintain ecological security [21]. Nature reserves are the main protected areas and effective measures for conserving ecosystem services [22]. Nature reserves have a higher supply capacity of ecosystem services than other regions [23]. However, the ecological environment in China has undergone tremendous pressure due to rapid socioeconomic transformations [24]. Nature reserves will face an unprecedented challenge for maintaining long-term sustainable development within this context. This requires policymakers to formulate policies that minimize trade-offs of ecosystem services and maximize win-win relationships between society and ecosystems in nature reserves [25]. Therefore, it is necessary to identify the dynamics and relationships of ecosystem services in nature reserves to provide valid ecological management proposals [26]. This will promote the effectiveness of nature reserves in protecting the ecological environment and implementing sustainable development goals.
Nature reserves could benefit from the balance between strict protection and sustainable use of natural resources, contributing significantly to the ecological security of human society [27]. Although nature reserves are generally believed to be the cornerstones of ecosystem conservation and the safest strongholds of wildlife, the problems of biodiversity degradation, mismanagement, and human encroachments are still widespread [28,29,30]. Jiulianshan National Nature Reserve is a typical forest reserve located at a transitional belt between middle and south subtropical evergreen forests in China [31]. This reserve is an important ecological barrier area in southeastern China [32]. It is necessary to identify relationships of ecosystem services in nature reserves to assess the existing ecological management strategies. This study aims to provide a theoretical basis for evaluating the effectiveness of nature reserves on sustainable development and effective policy support on the ecological management of nature reserves. We investigated their spatial and temporal changes in water yield, soil conservation, and carbon sequestration from 2000 to 2020 based on InVEST model. We identified the trade-offs and synergies of three ecosystem services through correlation analysis. Then we analyzed the differences in trade-offs and synergies of ecosystem services among different vegetation types and elevation bands. Specifically, we (1) examined the spatiotemporal patterns of ecosystem services under the existing ecological management policies, (2) analyzed the spatial characteristics of trade-offs and synergies of ecosystem services, and (3) quantified the differences in trade-offs and synergies of ecosystem services among different vegetation types and elevation bands.
2. Materials and Methods
2.1. Study Area
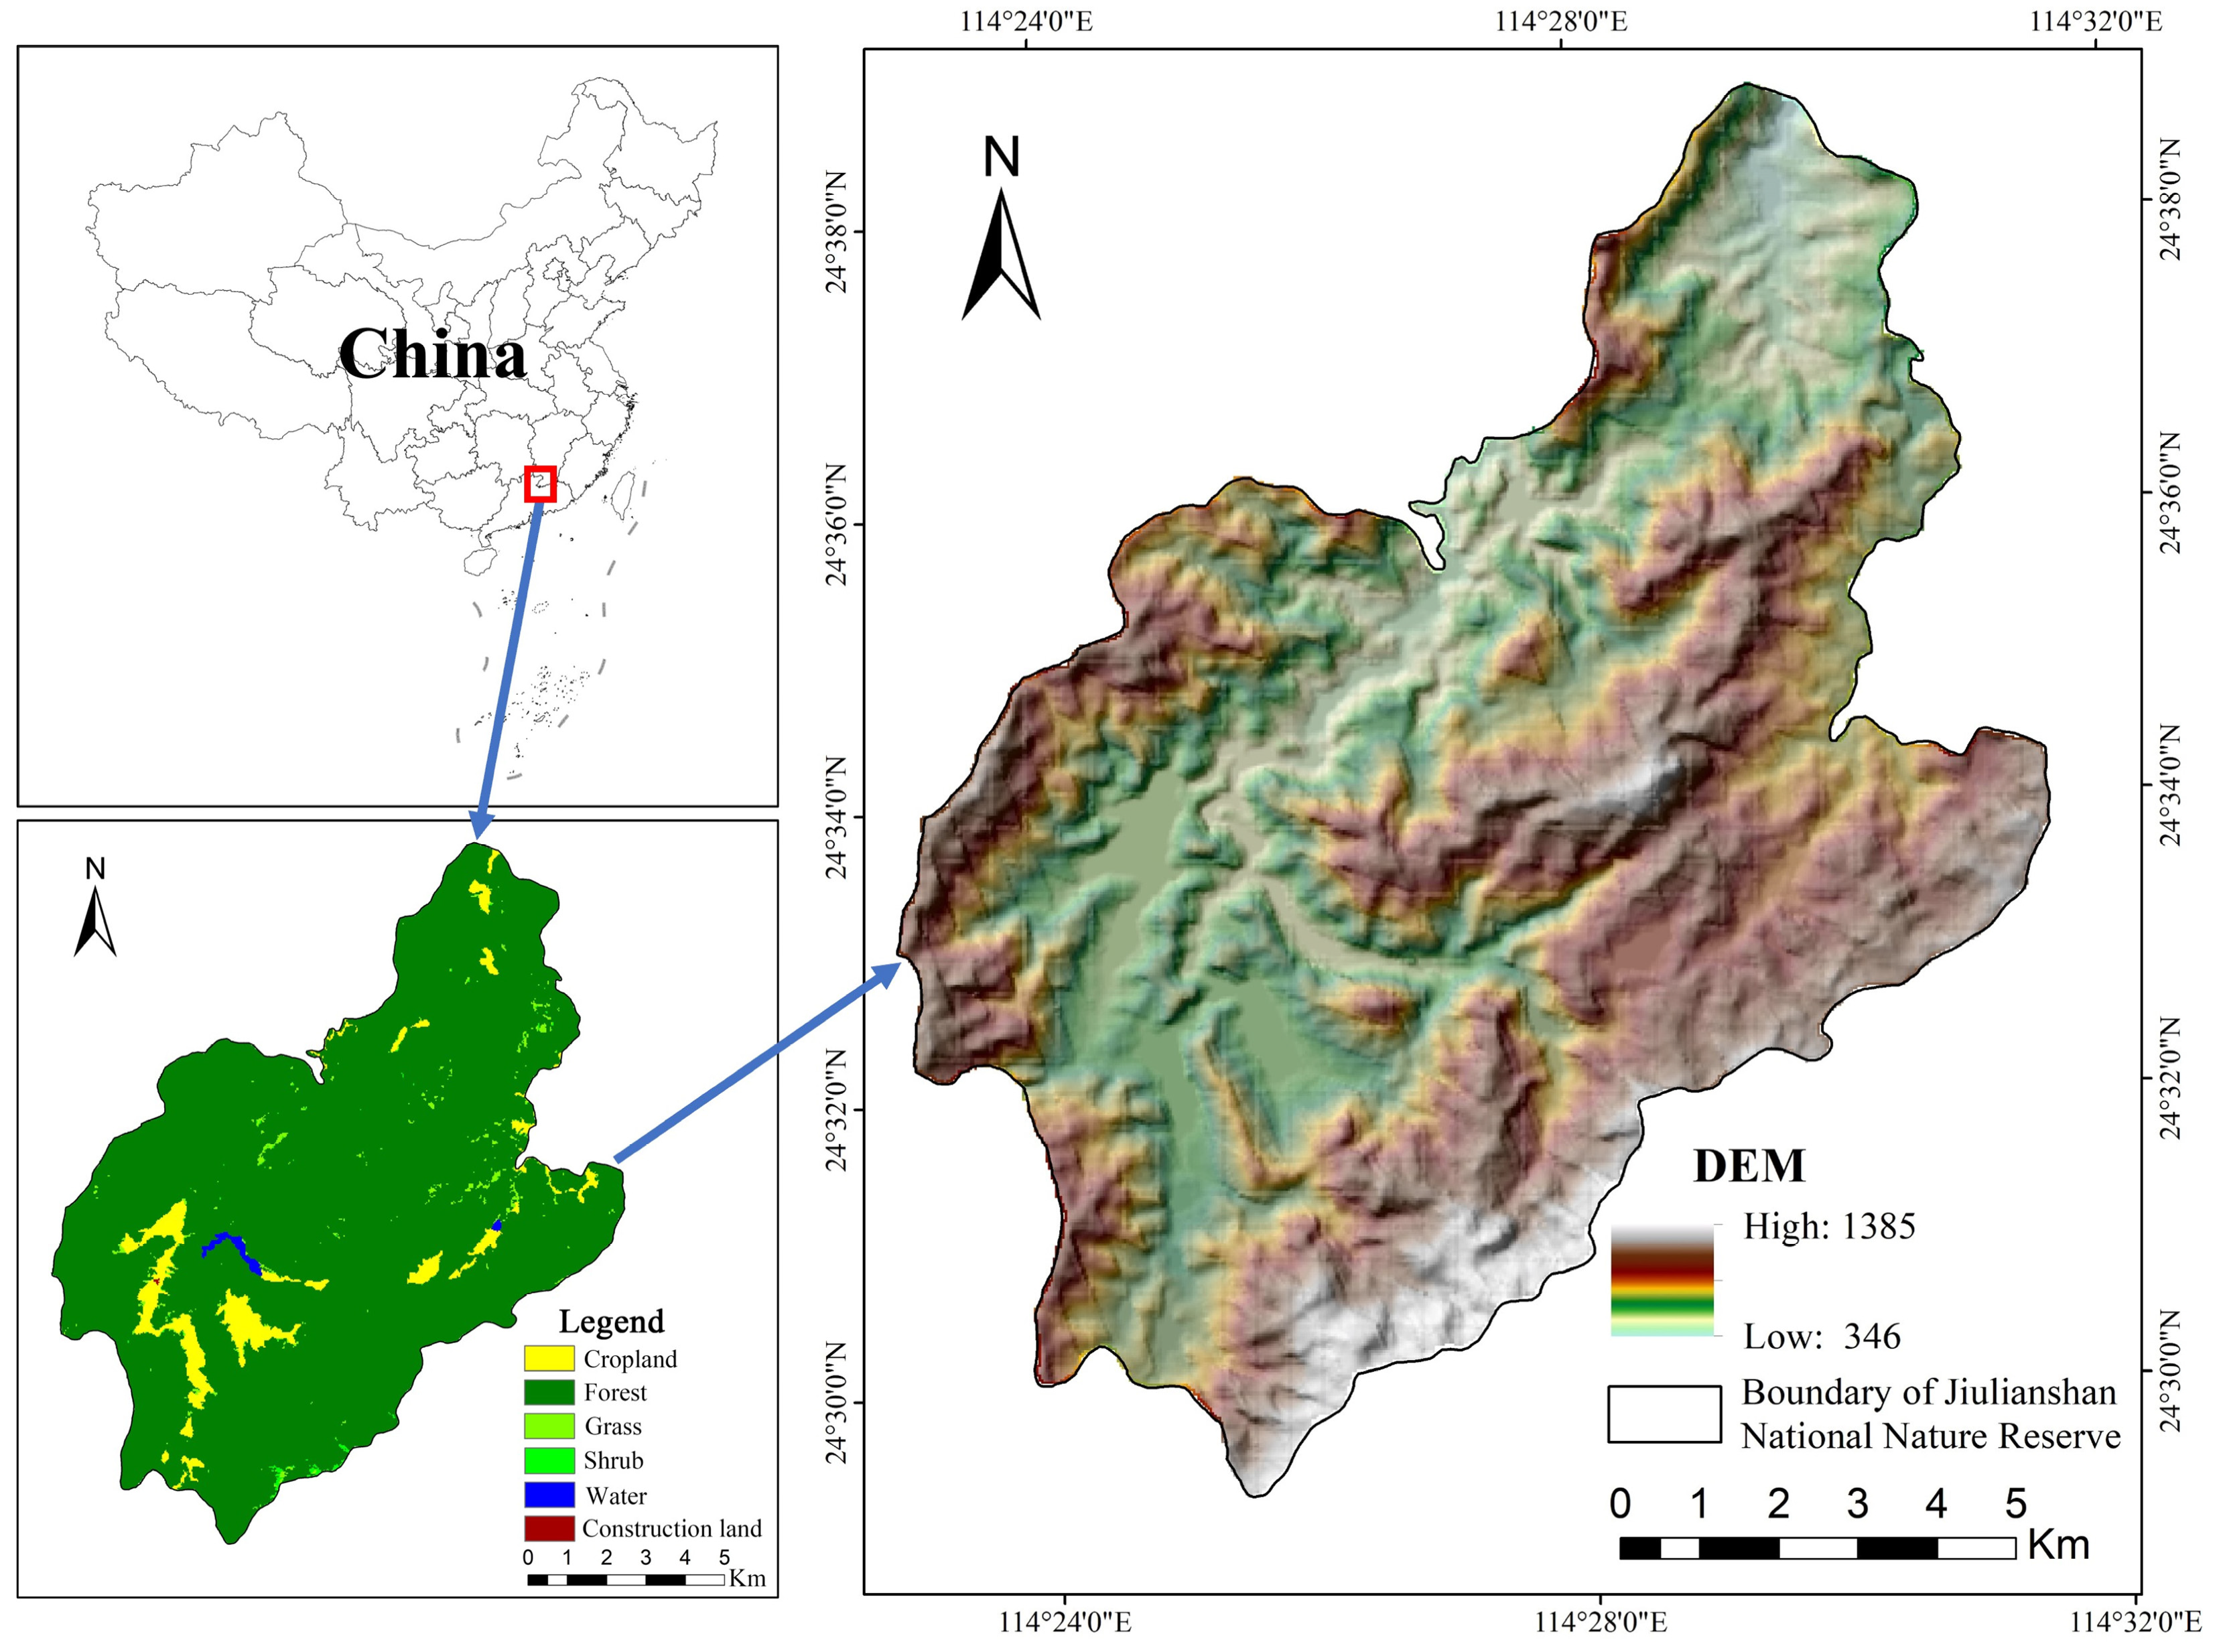
Jiulianshan National Nature Reserve (24°29′18″–24°38′55″ N, 114°22′50″–114°31′32″ E) is located in southern Jiangxi Province, China (Figure 1). The total area of this reserve is 13,411.6 ha, spanning almost 15.7 km north-south and 15 km east-west. The elevation ranged from 280 to 1434 m, and the terrain is low in the north and high in the south. Jiulianshan National Nature Reserve belongs to the East Asian monsoon climate zone, with a warm and humid climate and distinct dry and wet seasons. The average annual precipitation is 2155.6 mm, the average annual temperature is 16.4 °C, and the annual evaporation is 790.2 mm. Jiulianshan National Nature Reserve is highly valuable in biodiversity and has a typical, large-scale and well-preserved subtropical forest ecosystem. The main type of vegetation in this area is the broad-leaved evergreen forest, including Castanopsis carlesii (Hemsl., Hayata.), Schima superba (Gardn. et Champ.), and Litsea elongata (Wall. ex Nees Benth. et Hook. F). Coniferous forests are also widespread, such as Pinus massoniana (Lamb.), Cunninghamia lanceolata (Lamb., Hook)., and Taxus wallichiana var. mairei (Lemee & H. Léveillé, L. K. Fu & Nan Li). Moso bamboo forests are mainly composed of Phyllostachys edulis (Carriere, J. Houzeau) (Supplementary Material Figure S1). In addition to vegetation resources there are abundant animal resources, such as 384 wild vertebrates and 1404 insect species. Moreover, there are 9 rural settlements in reserve, and most of the residents are engaged in agriculture and forestry production.

Figure 1.
The geographic location, elevation, and land use/land cover types of the study area.
2.2. Methods
2.2.1. Model Parameterization
The land use/land cover map for 2000, 2010, and 2020 was obtained from the 30 m resolution Global Land Cover Dataset (GlobeLand30, http://www.globallandcover.com/, accessed on 15 January 2022). The 30 m Digital Elevation Model (DEM) data were provided by the Chinese Academy of Sciences (http://www.gscloud.cn, accessed on 15 January 2022). Soil data were provided by the Harmonized World Soil Database (Harmonized World Soil Database, HWSD). Meteorological data, including precipitation, temperature, and radiation, were obtained from the Jiulianshan National Nature Reserve Administration and the National Meteorological Administration of China (http://data.cma.cn, accessed on accessed on 15 January). The soil erodibility factor (K) was provided by the Center for Geodata and Analysis, Faculty of Geographical Science, Beijing Normal University (https://gda.bnu.edu.cn/, accessed on 15 January 2022) [33]. For model parameterization, all data were resampled to a 30 m grid.
The potential evapotranspiration (ET0) was calculated based on the Modified-Hargreaves model [34]. Wischmeier’s monthly scale formula was used to calculate the rainfall erosivity factor (R) [35]. The input raster maps (temperature, precipitation, ET0, and R) were interpolated to a 30 m resolution by the Machine Learning Ensemble & Thin-Plate-Spline Interpolation model (MACHISPLIN). Aboveground carbon stocks and soil carbon stocks were collected from forest inventory data and previous studies in our study area (Supplementary Material Table S1) [36,37,38]. The root depth data and other parameters in the biophysical table were set according to the recommendations of the InVEST 3.8.9 model user’s guide and published research articles (Supplementary Material Tables S2 and S3) [39,40,41].
2.2.2. Ecosystem Services Assessment
The Integrated Valuation of Ecosystem Service and Tradeoffs (InVEST) was used to evaluate ecosystem services from 2000 to 2020. InVEST model is a spatially explicit model for assessing ecosystem services under different land use/land cover types or different socioeconomic scenarios. This model explores how changes in ecosystems benefit people [42]. It has been widely used in ecosystem service research due to its advantages of low model parameters, low data requirements, and global applicability [43]. Water yield, soil conservation, and carbon sequestration were simulated using InVEST 3.8.9 at a 30 m spatial resolution.
- (1)
- Water yield
The water yield model of the InVEST model was mainly based on the Budyko curve and the annual average precipitation. Water yield is calculated by subtracting the actual evaporation from the precipitation of each grid cell [44]. Water yield is calculated as follows:
where Yxj is the water yield of land use/land cover type j in pixel x (mm/year), Exj is the annual actual evapotranspiration of land use/land cover type j in pixel x (mm/year), and Px is the average annual precipitation in pixel x (mm/year).
- (2)
- Soil conservation
The sediment delivery ratio sub-model of the InVEST model can be used to calculate the potential soil erosion (RKLS), actual soil erosion (USLE), and soil conservation (SD) for each cell as follows:
where RKLS, USLE, and SD represent potential soil erosion [t/(ha·year)], actual soil erosion [t/(ha·year)], and soil conservation [t/(ha·year)], respectively. R is the rainfall erosivity index [MJ·mm/(ha·h·year)]. K is the soil erodibility index [t·ha·h/(MJ·ha·mm)]. LS is the length-gradient factor. C is the cover-management factor for the USLE, and P is the supporting practice factor for the USLE.
RKLS = R × K × LS,
USLE = R × K × LS × P × C,
SD = RKLS − USLE,
- (3)
- Carbon sequestration
The carbon storage and sequestration model of the InVEST model takes the different land use/land cover types as the evaluation unit, then estimates the biomass of each carbon pool by multiplying the average carbon density of the different land use/land cover types by the area of each evaluation unit. The total carbon sequestration of terrestrial ecosystems is the sum of four fundamental carbon pools, including the carbon sequestration of aboveground biomass, belowground biomass, soil organic matter, and dead organic matter. The total carbon sequestration is calculated as follows:
where Ctotal is the total carbon stocks (t/ha), Cabove is aboveground carbon stocks (t/ha), Cbelow is belowground carbon stocks (t/ha), Csoil is soil organic carbon stocks (t/ha), and Cdead is dead organic matter carbon stocks (t/ha).
Ctotal = Cabove + Cbelow + Csoil + Cdead,
2.2.3. Model Calibration and Validation
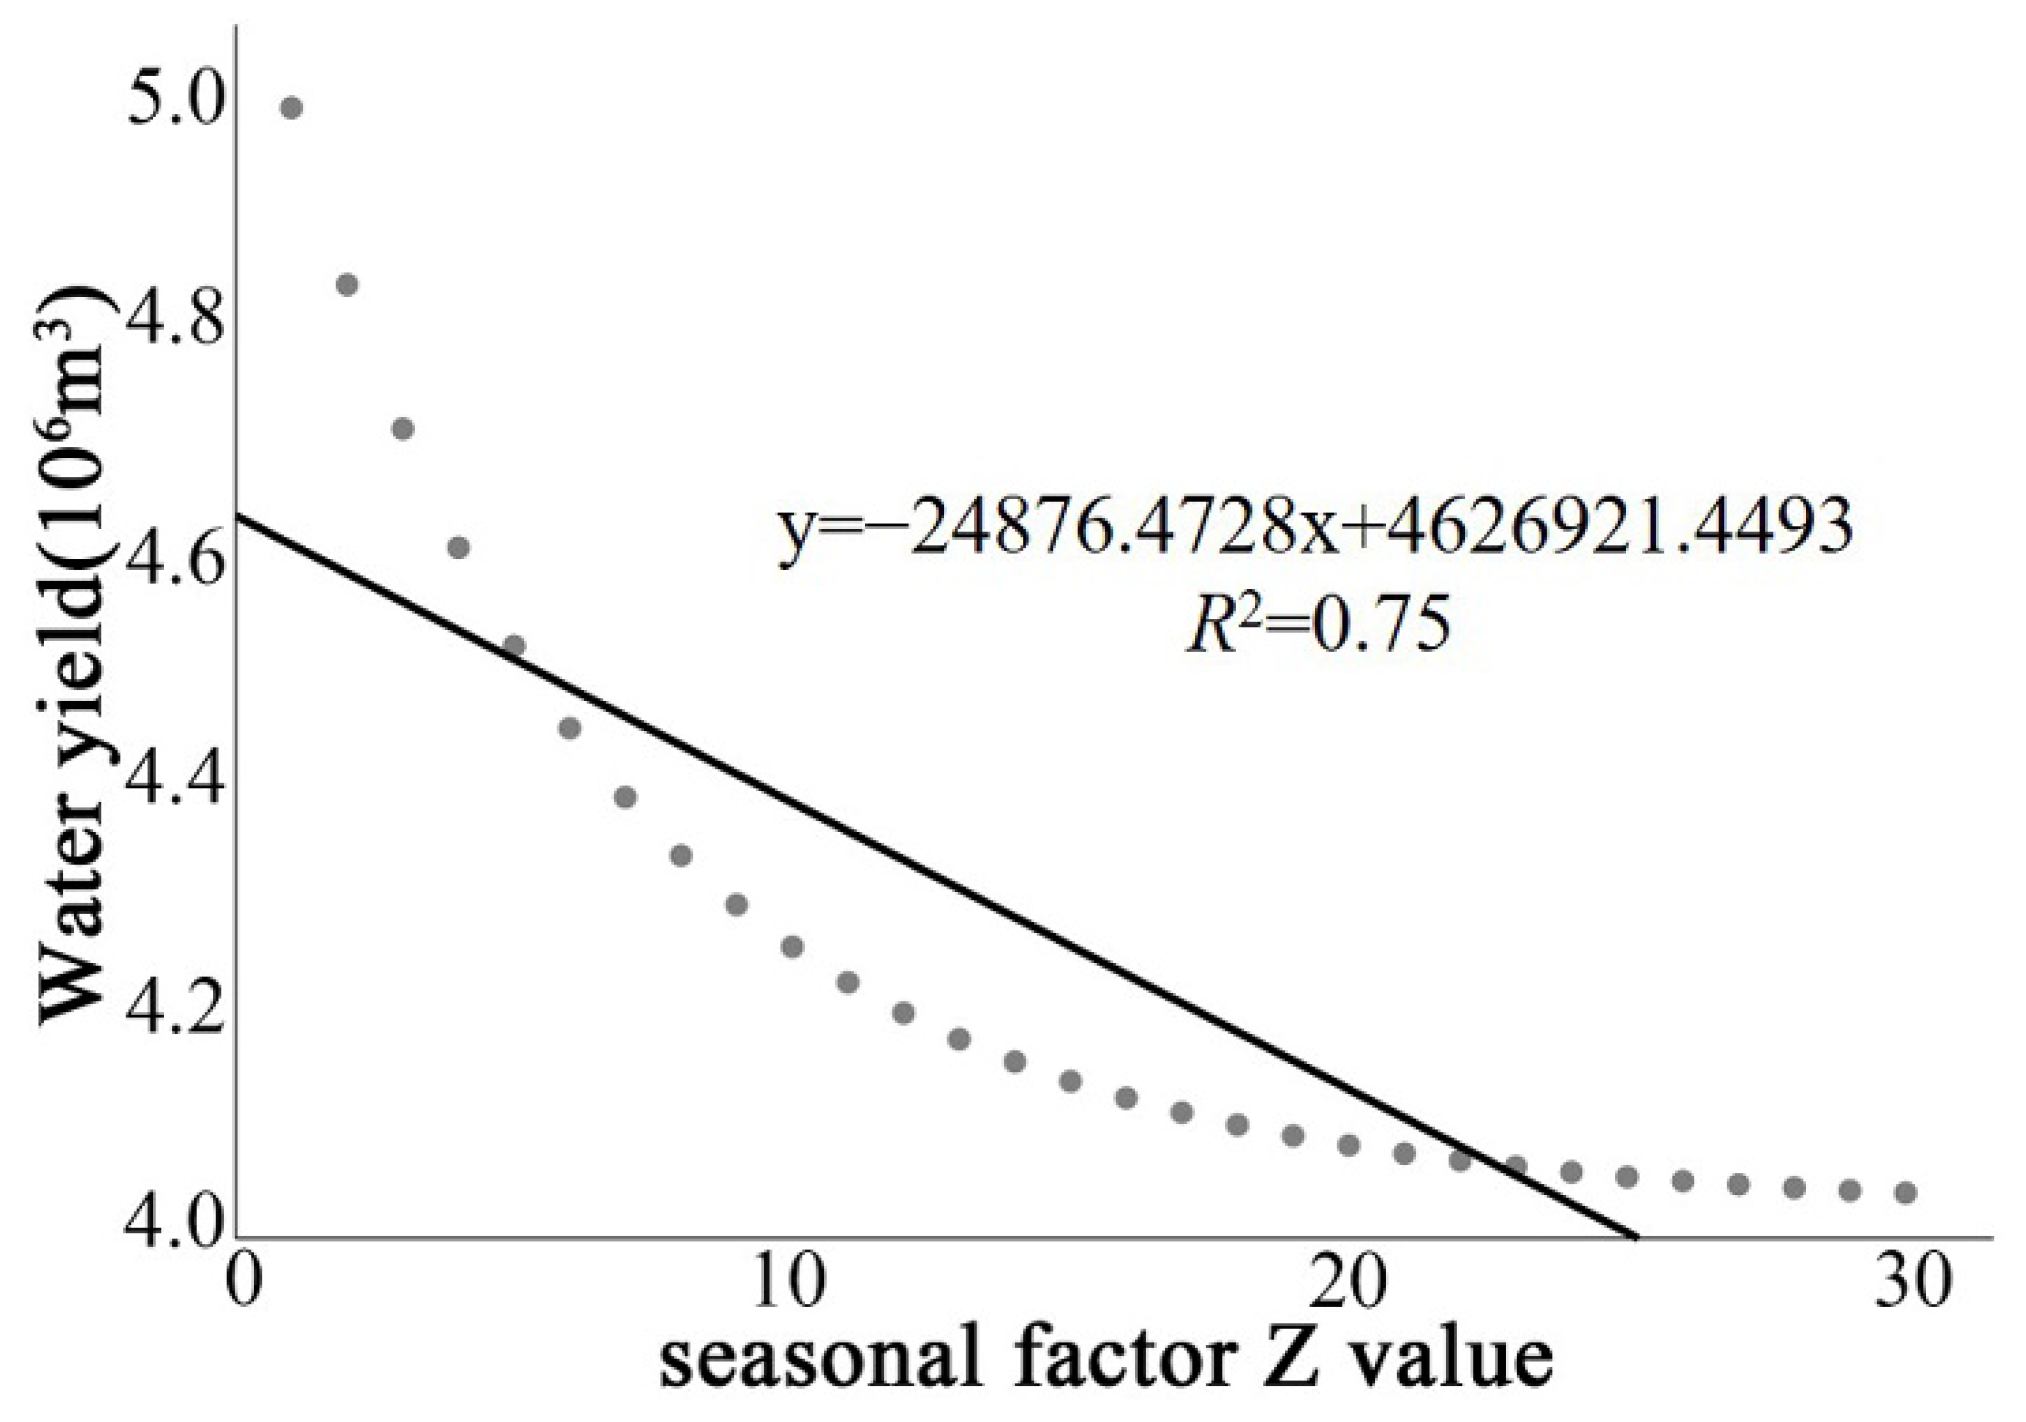
The seasonal parameter Z-value is an empirical constant that indicates the regional precipitation distribution and geohydrological characteristics [45]. Correlation between simulated data and field survey data can ensure the accuracy of the water yield model. In this study, the average runoff volume (4.55 × 10⁶ m3) of the Jiulianshan National Nature Reserve No.4 measuring weir (24°31′45″ N, 114°27′36″ E) in 2010 was used as a reference to calibrate the accuracy of the simulation results. The results of the correlation analysis indicated that the water yield was negatively correlated with the Z-value (R2 = 0.75, p < 0.01), and the fitted equation showed that the simulated water yield matches best with the natural runoff in 2010 when Z = 3.33 (Figure 2).
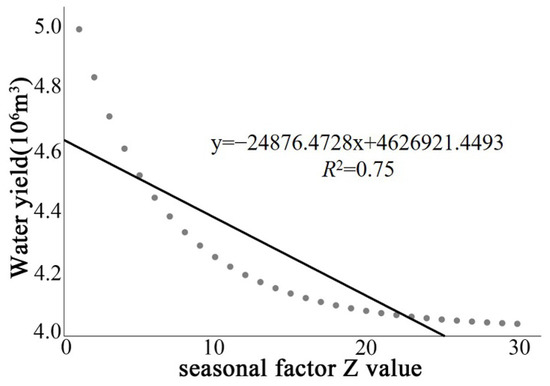
Figure 2.
The correlation between water source content and seasonal factor Z value.
We selected 100 forest survey plots (20 m × 20 m) to validate the carbon storage and sequestration model of the InVEST model. At each plot we identified species and measured the diameter at breast height of trees over 1 cm. Three randomly placed sample squares (5 m × 5 m) within each sample plot were used for soil sampling. The results showed that the simulation results were close to the forest survey data and that the correlation coefficient between the two is 0.78, which means a high correlation (R2 = 0.78, p < 0.01, Figure 3).

Figure 3.
Comparison of observed and simulated carbon storage from the InVEST model. The observed carbon storage was estimated by forest inventory data conducted in 2020.
2.2.4. Analysis of Trade-Offs and Synergies of Ecosystem Services
Correlation relationship analysis was applied to analyze trade-offs and synergies of ecosystem services. When the correlation coefficient between two ecosystem services is positive, they are considered synergistic, and when the correlation coefficient is negative, it is a trade-off relationship [46]. The correlation coefficients were calculated as follows:
where ES1 and ES2 are two ecosystem services; r is the correlation coefficient between ES1 and ES2; i and j are the number of rows and columns of raster image elements; n is the time series of raster data; and r12(ij) is the correlation coefficient between ES1 and ES2 on image element ij when other ecosystem services change at n years. r12(ij) > 0 indicates a synergistic relationship between ES1 and ES2; r12(ij) = 0 indicates no correlation between ES1 and ES2; r12(ij) < 0 indicates trade-off relationship between ES1 and ES2; and the larger value of r12(ij) indicates a stronger correlation between ES1 and ES2.
We classified the correlation coefficients into seven levels: no relationship (r = 0); synergy** (r > 0, 0.01 < p < 0.05); synergy* (r > 0, 0.05 < p < 0.1); synergy (r > 0, 0.1 < p); trade-off (r < 0, 0.01 < p); trade-off* (r < 0, 0.05 < p < 0.1); and trade-off** (r < 0, 0.01 < p < 0.05, Table 1).

Table 1.
The relevance classification level of trade-off and synergy relationships between ecosystem services.
3. Results
3.1. Changes in Ecosystem Services from 2000 to 2020
3.1.1. The Spatial Pattern of Ecosystem Services
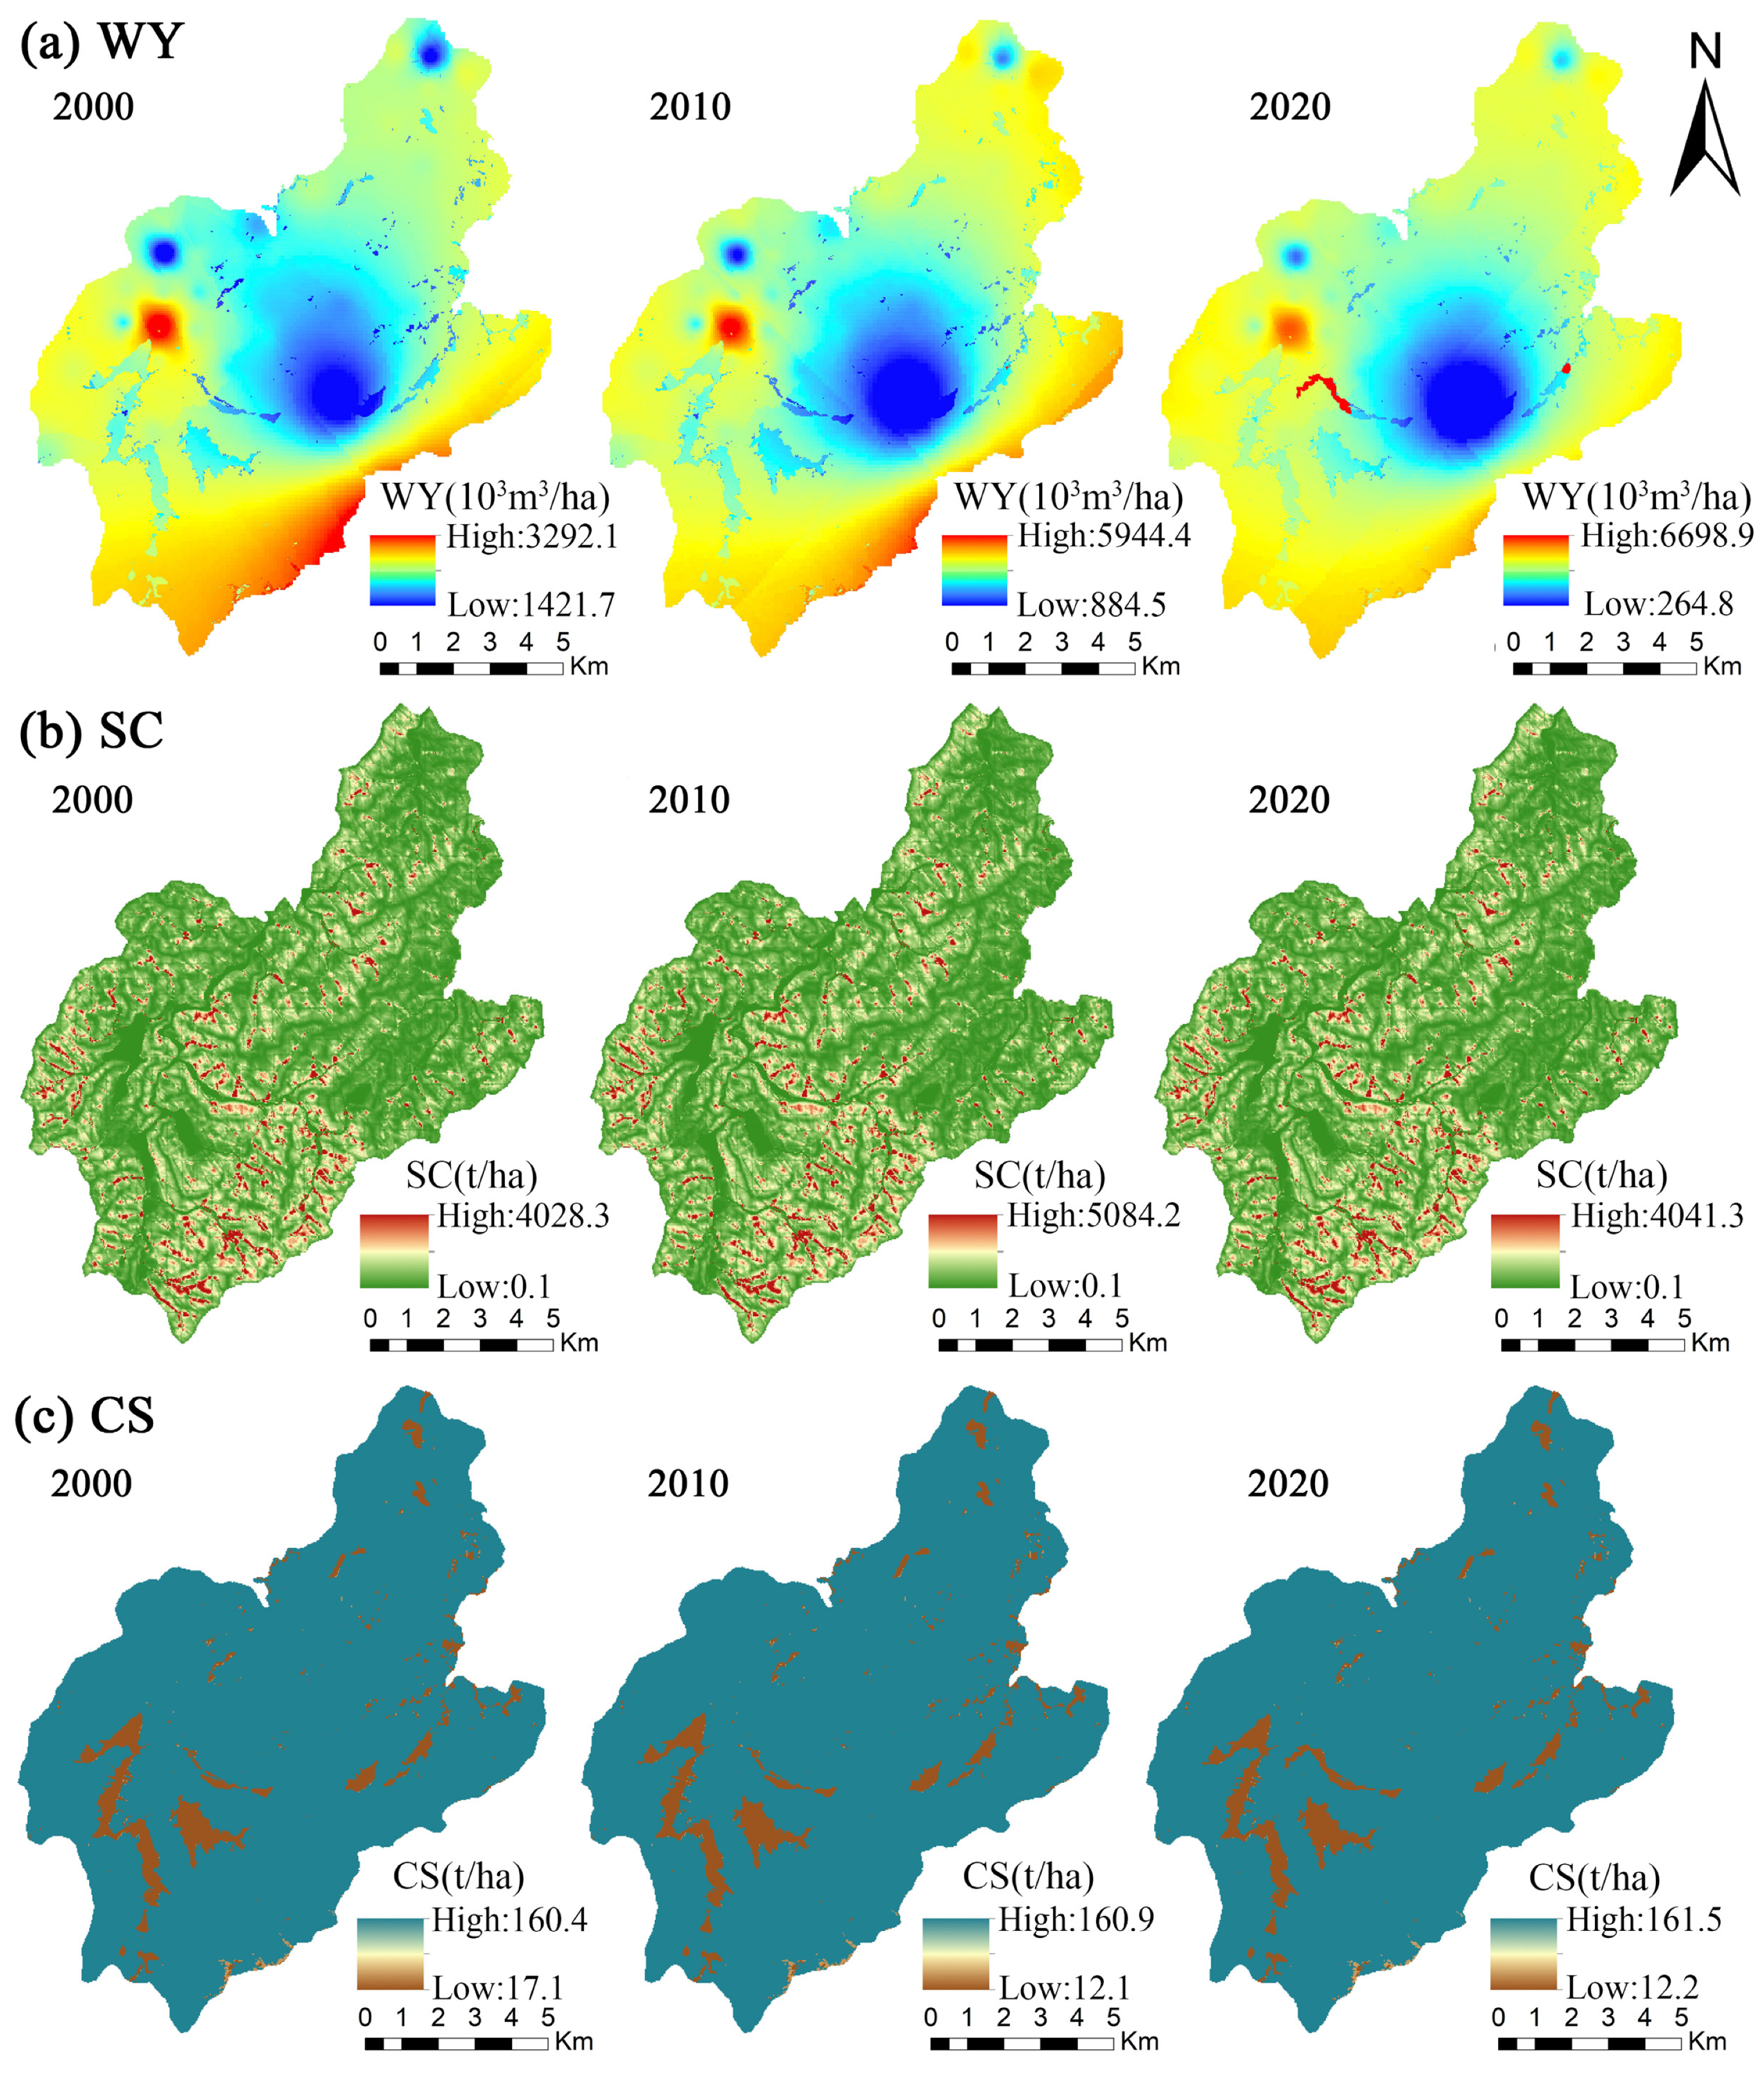
Water yield, soil conservation, and carbon sequestration maintained a stable spatial pattern in 2000–2020. Three ecosystem services exhibited their spatial distribution characteristics (Figure 4). The higher value of the water yield was clumped within the central, northern, and northwestern areas (Figure 4a), where there were high forest cover and precipitation. In contrast, the lower value of water yield was mainly concentrated in the central-western and southeastern areas. The areas with a lower value of water yield in 2020 decreased in the southeast compared to 2000 and 2010. The higher-value areas of soil conservation were scattered; they were mainly distributed in the study area’s central, western, and southeastern areas (Figure 4b). The spatial pattern of carbon sequestration has not changed substantially because of the stable land use/land cover structure. The areas with a higher value of carbon sequestration are mainly concentrated in forests, while the areas with a lower value were in cropland, in water, and on construction land (Figure 4c).
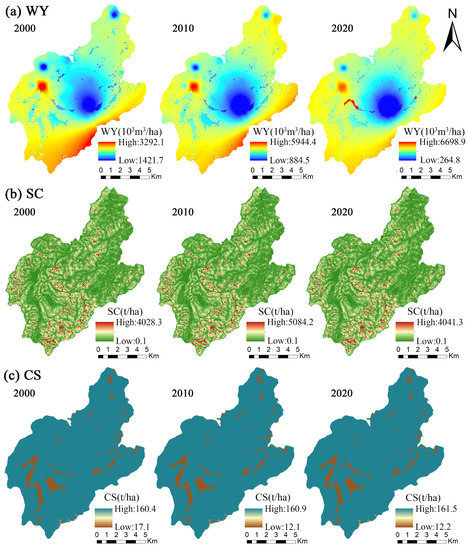
Figure 4.
The spatial pattern of ecosystem services in the study area in 2000, 2010, and 2020; (a) water yield; (b) soil conservation; (c) carbon sequestration.
3.1.2. Temporal and Spatial Changes in Ecosystem Services from 2000 to 2020
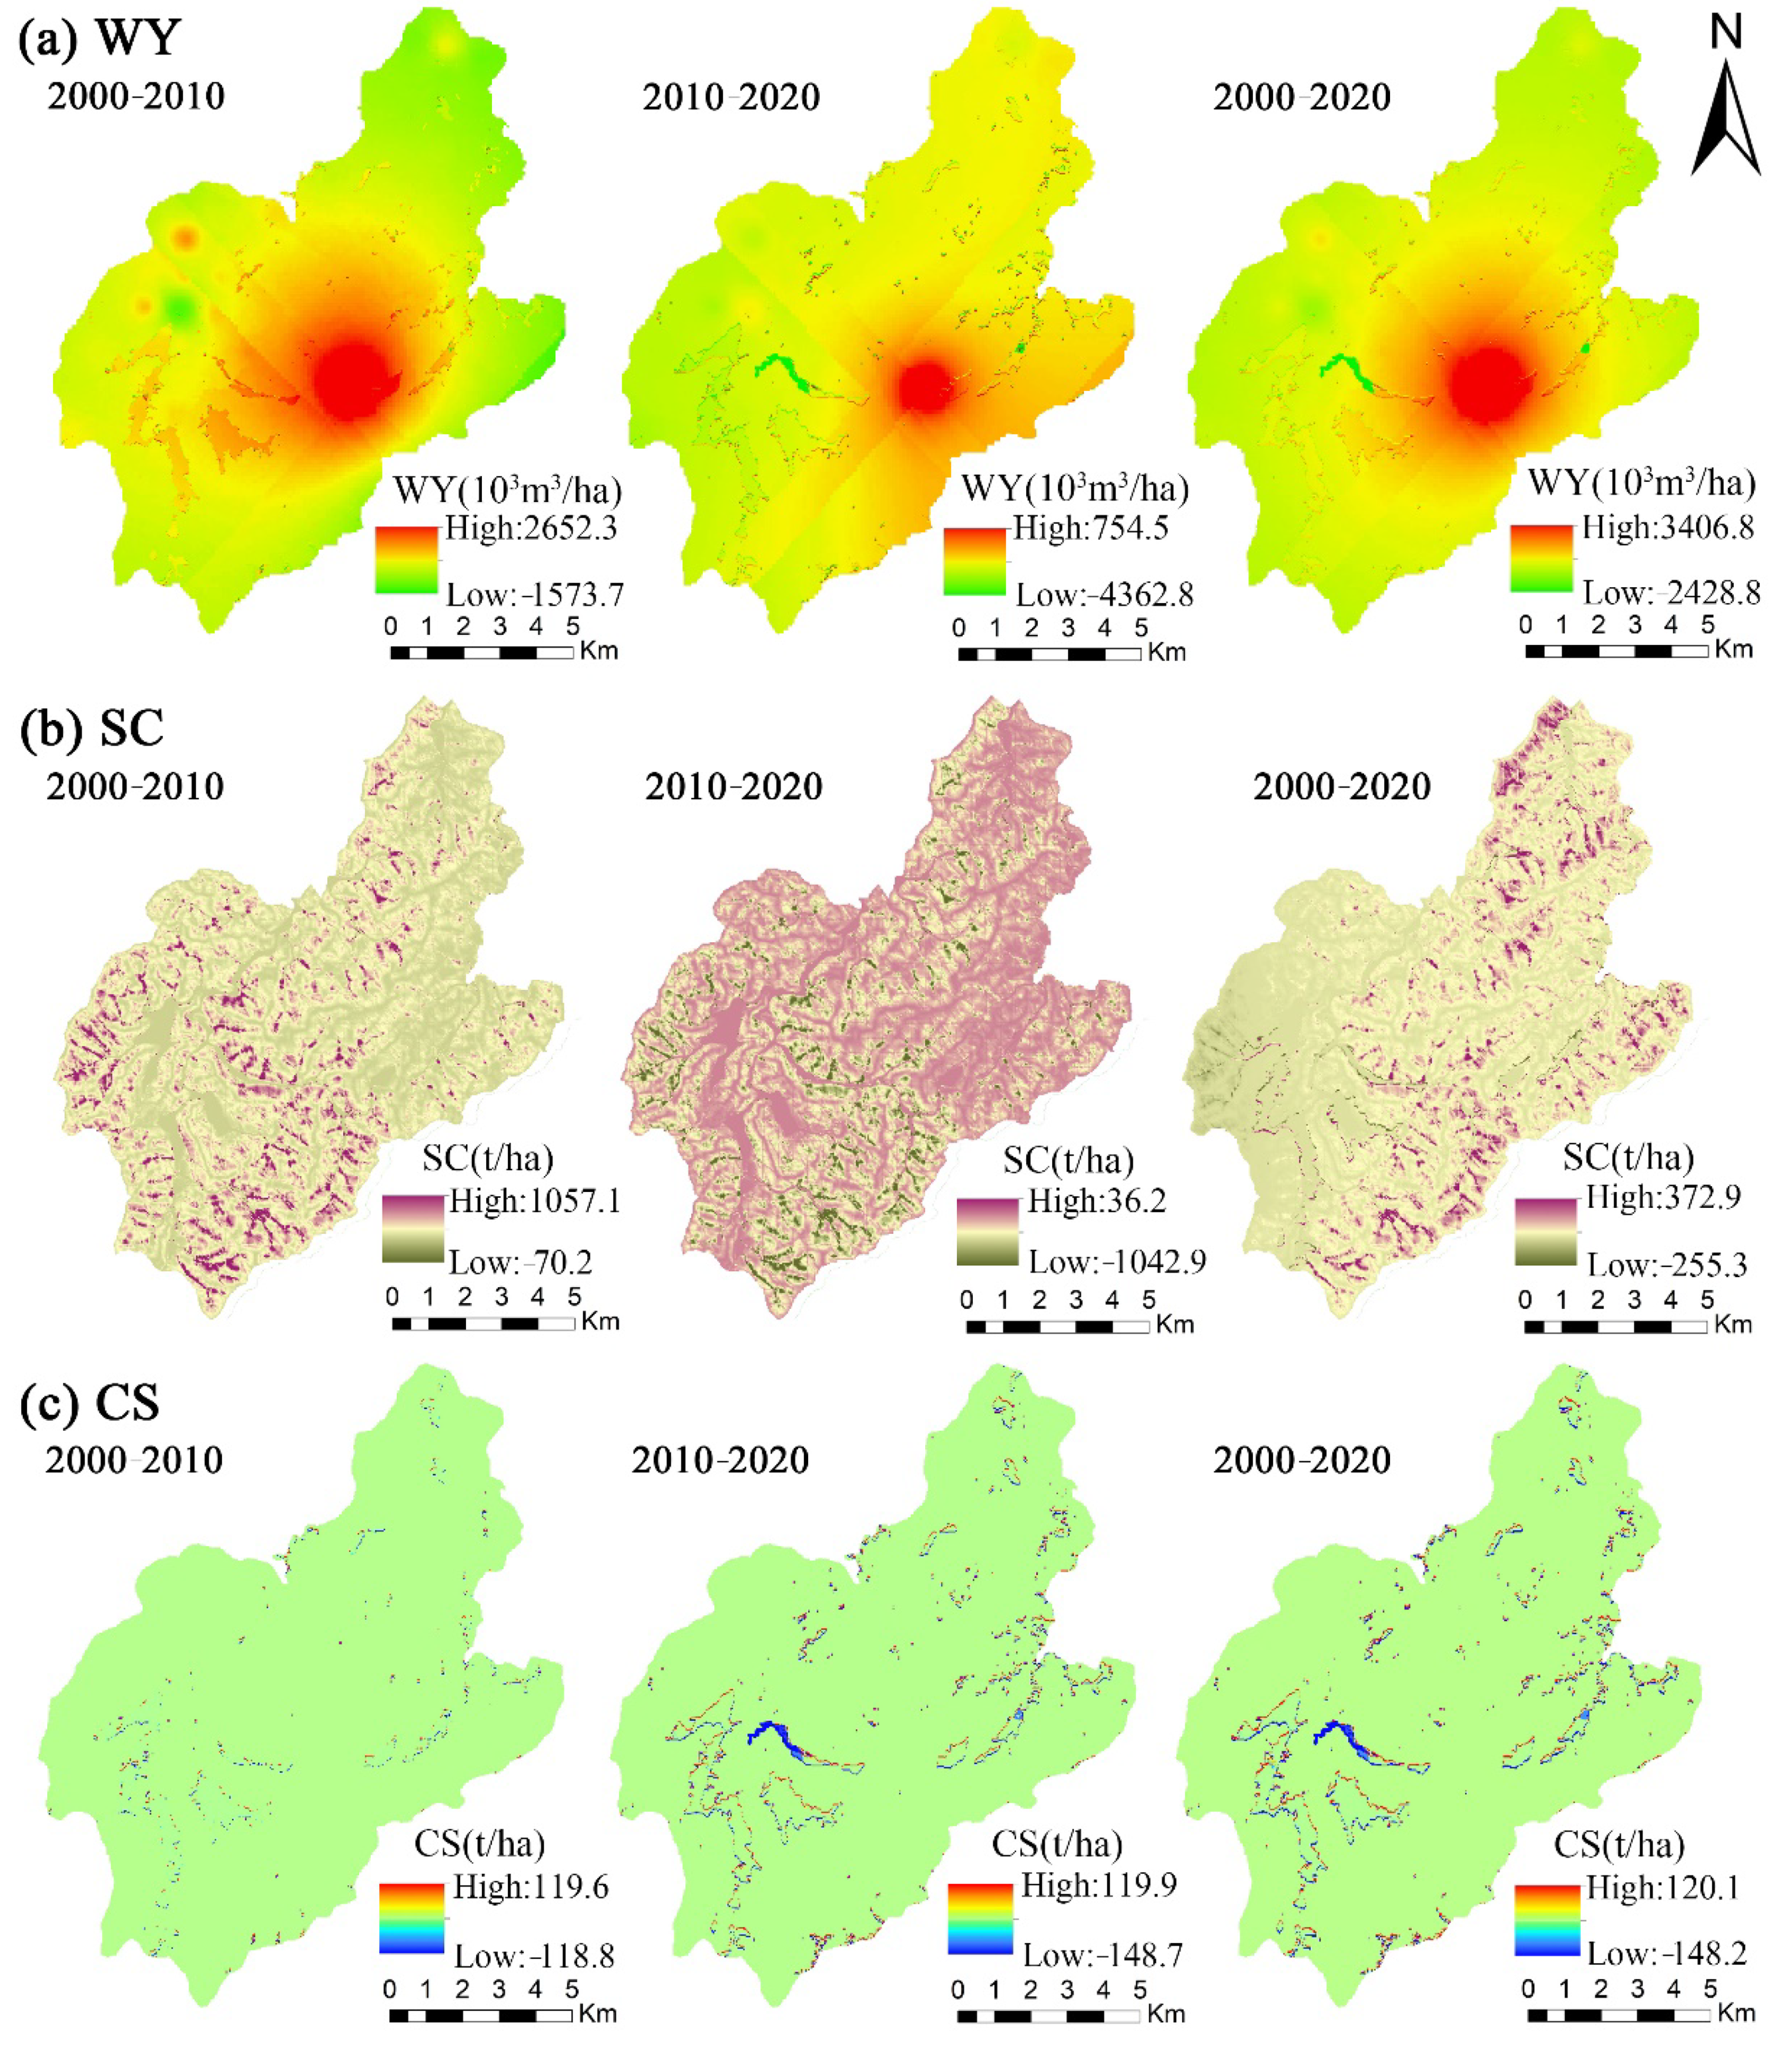
The changes in water yield and carbon sequestration exhibited an upward trend from 2000 to 2020, while soil conservation remained a marginal degradation. Water yield increased by 13.4% and carbon sequestration increased by 0.4% in 2000–2020. Soil conservation declined marginally from 14.85 × 10⁶ t in 2000 to 14.55 × 10⁶ t in 2020. The areas where the water yield increased were mainly concentrated in the central areas (Figure 5a). The spatial distribution of the soil conservation rising areas was different. From 2000 to 2010, the rising soil conservation areas were mainly concentrated in the central, western, and southern areas, while from 2010 to 2020 they were mainly clumped within the eastern, northeastern, and southwestern regions (Figure 5b). The supply capacity of carbon sequestration was slightly enhanced in the central, northeastern, and southwestern areas (Figure 5c).

Figure 5.
Spatial and temporal variation in ecosystem services in the study area from 2000 to 2010, 2010 to 2020, and 2000 to 2020; (a) water yield; (b) soil conservation; (c) carbon sequestration.
3.2. Trade-Offs and Synergies of Ecosystem Services
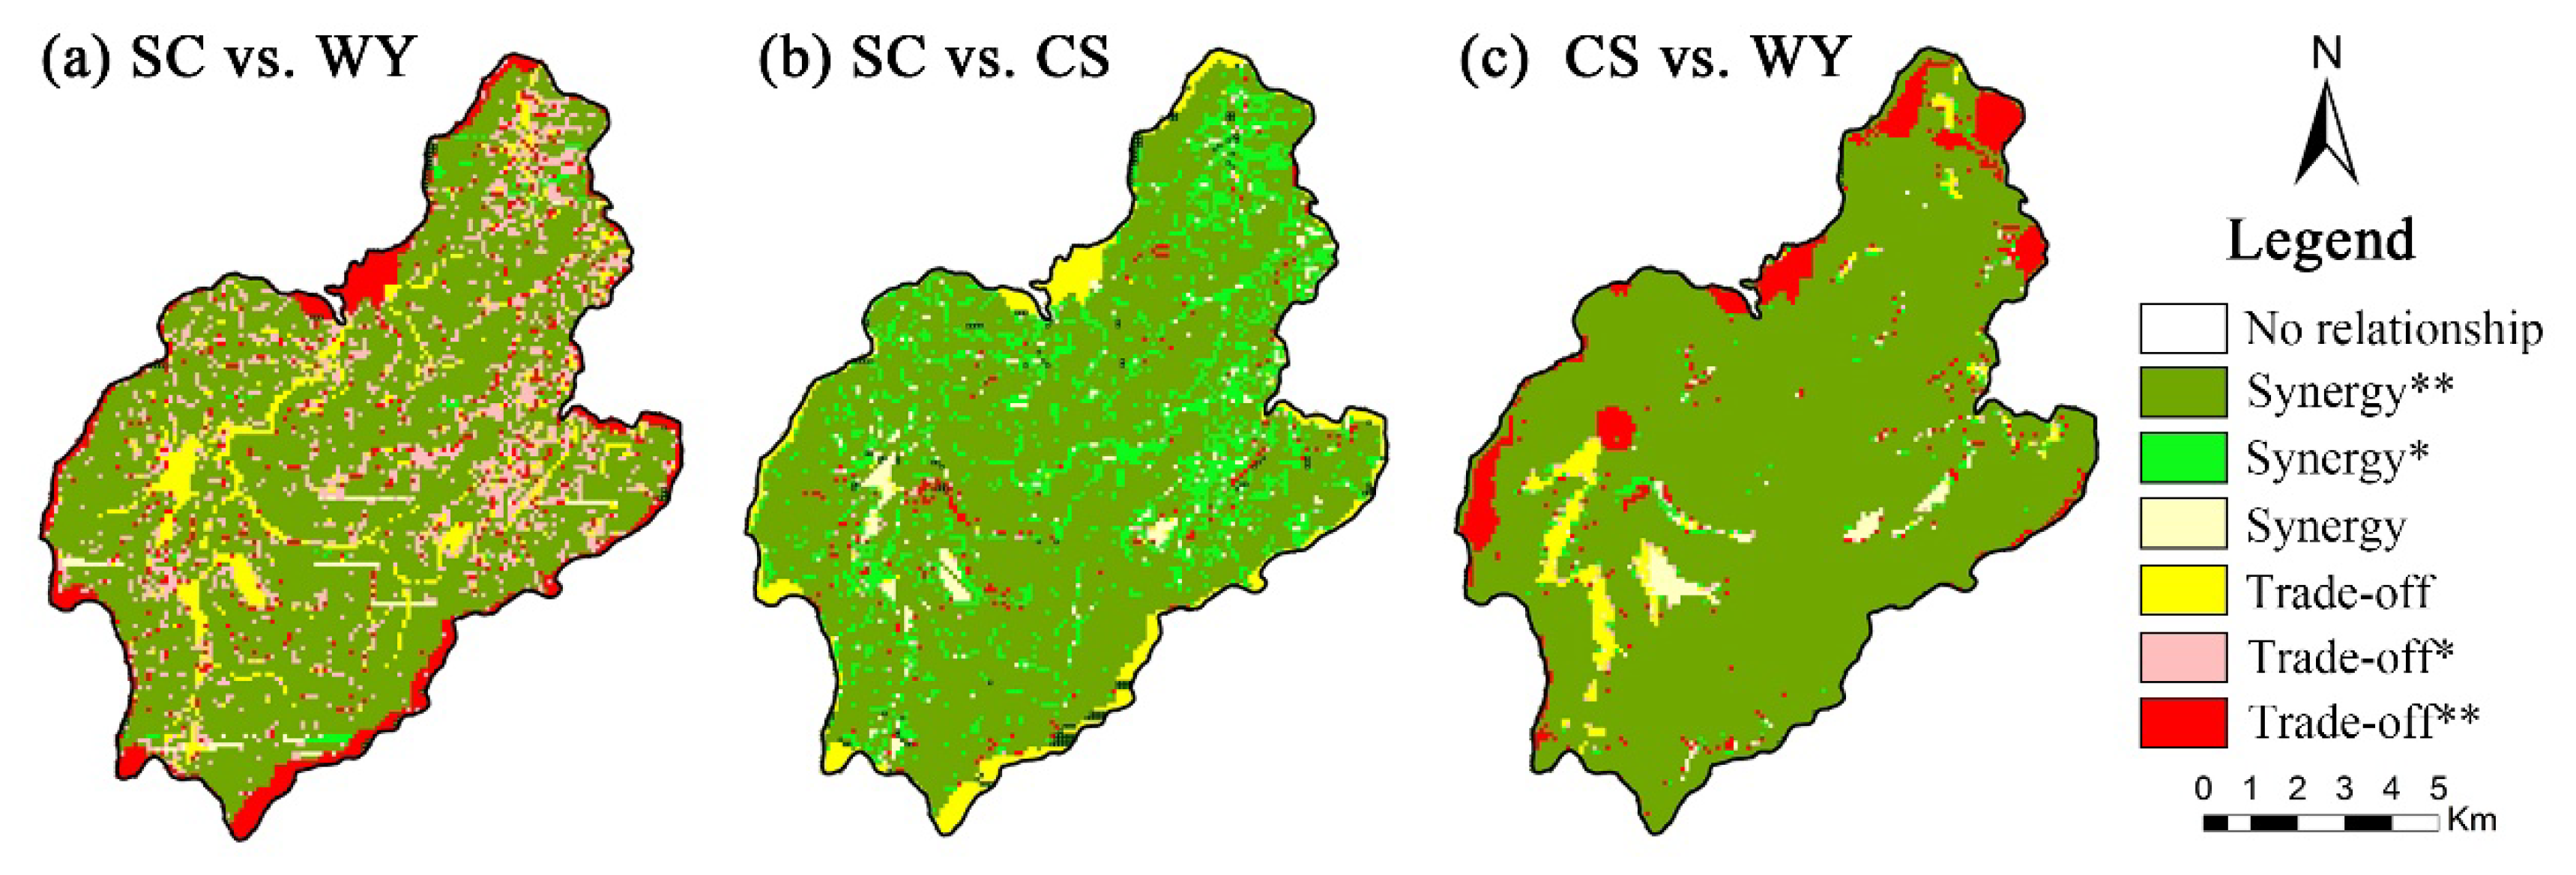
We calculated the pixel-scale spatial correlation coefficients to explore the trade-offs and synergies between each ecosystem service (Figure 6). The result showed that synergies were spatially dominated in water yield, soil conservation, and carbon sequestration interactions. The synergies areas accounted for 67.90% of soil conservation and water yield and were spatially aggregated in the central and southern regions. The weak trade-offs were mainly concentrated in the eastern, northern, and western areas, while strong trade-offs were concentrated in the northern, southern, and southwestern marginal regions (Figure 6a). For soil conservation and carbon sequestration, the synergistic relationships were mainly distributed in the study areas’ central, southern, and western parts, which accounted for 90.35%. The trade-off areas were small and dispersed and were spatially aggregated in the northern, southern, and southwestern fringes (Figure 6b). For carbon sequestration and water yield, the synergistic relationships were mainly clumped within the eastern, central, and southern areas, which accounted for 89.14%. The trade-off areas were spatially aggregated in the northern and western regions (Figure 6c).
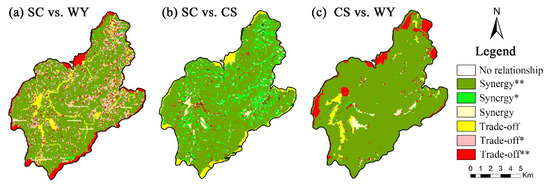
Figure 6.
The spatial pattern of trade-off and synergy among three ecosystem services; (a) soil conservation and water yield; (b) soil conservation and carbon sequestration; (c) carbon sequestration and water yield. *: 0.05 < p < 0.10; **: 0.01 < p < 0.05.
The distribution of trade-offs and synergies among ecosystem services in various vegetation types is shown in Figure 7. Synergistic relationships between soil conservation and carbon sequestration were dominant in cropland, grass, and shrub, and occupied 84.89%, 77.45%, and 51.29%, respectively (Figure 7a). The trade-off relationships were most significantly concentrated in broad-leaved, coniferous, mixed, and Moso bamboo forests. The trade-offs between soil conservation and water yield were mostly concentrated in cropland and shrub, which accounted for 70.25% and 69.24% (Figure 7b). The synergistic relationships were mostly in broad-leaved forests, coniferous forests, mixed forests, and Moso bamboo forests and in grass. For carbon sequestration and water yield, the synergies were significantly concentrated in various vegetation types, which all accounted for more than 50% (Figure 7c).
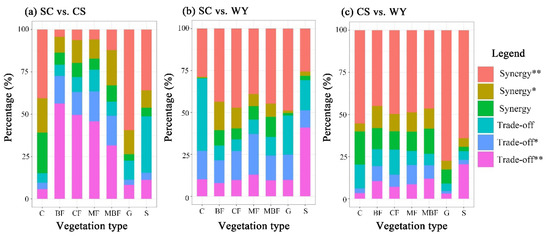
Figure 7.
Trade-offs and synergistic of ecosystem services among different vegetation types. C, cropland; BF, broad-leaved forests; CF, coniferous forests; MF, mixed forests; MBF, Moso bamboo forests; G, grass; S, shrub; (a) soil conservation and water yield; (b) soil conservation and carbon sequestration; (c) carbon sequestration and water yield. *: 0.05 < p < 0.10; **: 0.01 < p < 0.05.
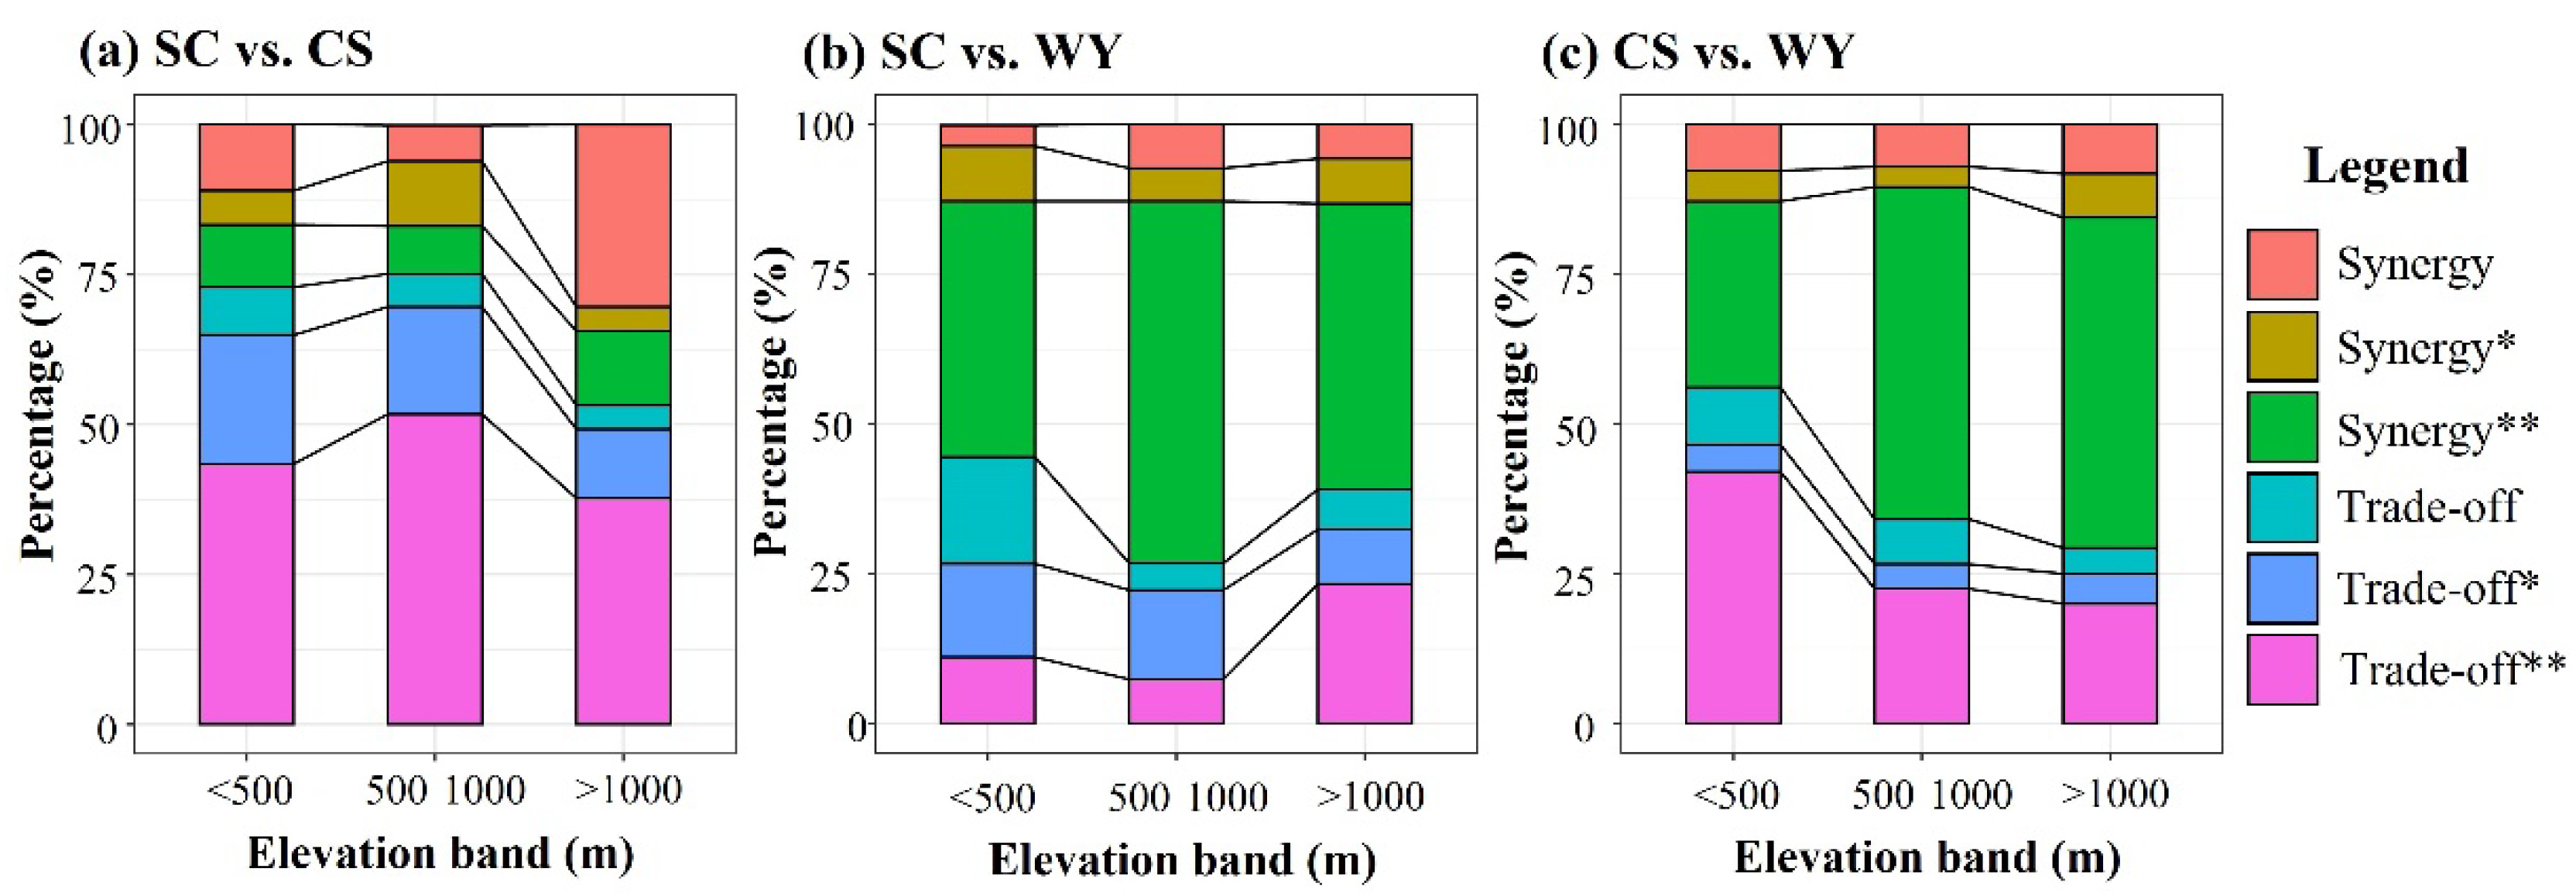
Figure 8 shows the distribution of ecosystem services of trade-off and synergies situations at different elevation bands. For soil conservation and carbon sequestration the trade-offs were concentrated in all elevation bands, and they all accounted for more than 50% (Figure 8a). The trade-offs of areas below 1000 m were significantly stronger than that above 1000 m. Synergies were mostly concentrated in all elevation bands (Figure 8b). Among them, strong synergies were dominant. For soil conservation and water yield the synergistic relationships were concentrated in areas above 500 m, and the trade-offs were mainly in areas below 500 m (Figure 8c). The proportion of trade-offs increased with elevation.

Figure 8.
Trade-offs and synergistic of ecosystem services at different elevation bands; (a) soil conservation and water yield; (b) soil conservation and carbon sequestration; (c) carbon sequestration and water yield. *: 0.05 < p < 0.10; **: 0.01 < p < 0.05.
4. Discussion
4.1. Spatial and Temporal Variation in Ecosystem Services
In this study we found that the supply capacity of water yield and carbon sequestration exhibited an overall upward trend from 2000 to 2020, while soil conservation remained a marginal degradation. This result indicates that ecosystem services in Jiulianshan National Nature Reserve presented improvements over the 20 years. However, there were significant differences in the spatial distribution of variation in ecosystem services (Figure 5). The spatial and temporal changes of ecosystem services could be associated with climate [47]. Previous research has shown that elevated temperature and precipitation within a certain range are conducive to ecosystem services [48,49]. The warm and humid climate in the conservation area could favor vegetation improvement. Compared with low vegetation cover areas, high vegetation cover areas have a stronger ability to enhance water yield and control soil erosion by intercepting rainfall, increasing infiltration, and stabilizing the soil [50]. In addition, implementing ecological restoration projects positively impacts ecosystem services, which could protect the ecological environment by restoring and protecting forests [51]. However, human activities, such as excessive land utilization, could decrease supply to multiple ecosystem services in partial areas [52]. In the conservation area, the low-altitude and gentle terrain of the midwestern and northeastern regions could facilitate agricultural production activities by the residents. Without appropriate compensatory measures, agricultural activities may cause a reduction in soil fertility and change the structure of the soil [53]. To better harmonize the relationship between human activities and the natural environment, the midwestern and northeastern areas of the conservation area should receive increased attention.
The results suggest that the existing protection policies of the Jiulianshan National Nature Reserve effectively curbed deforestation and land reclamation, but more detailed management measures are still needed. The reserve should also further increase financial investment and cooperate with social welfare organizations to obtain more operating funds. The financial investment in protected areas indirectly reflects ecosystem management policy and positively relates to ecosystem service conservation effectiveness [54]. Meanwhile, realizing the diversification of residents’ income sources is essential to reducing the destruction of natural resources and improving ecosystem services’ supply capacity [55]. Therefore, decision-makers should also consider the spatial heterogeneity of ecosystem services and their natural and environmental drivers.
4.2. Quantifying Trade-Offs and Synergistic Relationships of Ecosystem Services
Our research showed the dominant synergies between water yield, soil conservation, and carbon sequestration in the Jiulianshan National Nature Reserve. The results are generally consistent with those of previous studies [56,57,58]. Nearly 95% of the conservation area consists of forests, grasslands, and shrub. The high vegetation cover may explain the strong synergies of ecosystem services, as it enhances carbon sequestration by photosynthesis and mitigates soil erosion [59]. The supply capacity of the water yield could be enhanced, because vegetation intercepts, absorbs, and stores precipitation from the canopy of dead leaf vegetation and the subsoil [51,60]. The distribution of trade-offs in the study area was dispersed and concentrated in the north, midwestern, and southeastern areas, especially in peripheral areas. This may be interpreted as the consequence of the effects of human activities. Uncontrolled development of resources could cause artificial surface expansion, and land cover/land use types or vegetation types may change accordingly [61]. The central areas of the conservation area are densely vegetated, and land-use conflicts were weak there. Under strict ecological policies, the major areas were relatively less affected by external drivers, which may explain why there were strong synergies between ecosystem services in these areas. When making management policies, more consideration should be given to the spatial heterogeneity of ecosystem services, which will benefit the refinement of ecological management measures.
This reserve has a typical and well-preserved subtropical forest system. In the broad-leaved, coniferous, mixed, and Moso bamboo forests, synergies among water yield and other services were dominant. Forests are the main ecological construction and restoration means, by providing several intangible benefits such as regulating air humidity, protecting watersheds, and absorbing carbon and nutrient cycling [62]. However, forests cannot simultaneously produce multiple ecosystem services due to the trade-offs among competing functions. Forests could absorb carbon by photosynthesis and enhance the supply capacity of carbon sequestration, but excessive rainfall intensity could lead to soil erosion. These may result in trade-offs between soil conservation and carbon sequestration. Therefore, the construction of soil and water conservation engineering measures should be strengthened in forestlands with high precipitation and rainfall intensity. Trade-offs between soil conservation and water yield were primarily concentrated in cropland and shrub. Water-saving and pollution reduction measures should be implemented in cropland, such as drip irrigation and water and fertilizer integration [50]. Moreover, the reserve should take some comprehensive protection measures in the shrub, such as increasing vegetation density and improving vegetation structure to strengthen the plant root system and upgrade water retention [63]. In addition, we found that trade-offs among ecosystem services decreased with increasing elevation bands. In the low elevation zone, policymakers should pay more attention to trade-offs between soil conservation and carbon sequestration. Commercial plants could be incorporated into mixed farming, to protect vegetation diversity and the livelihood flexibility of farmers in reserve [64]. In the areas above 1000 m, the forests are primeval and well-preserved. Enhancing patrolling efforts is efficient to reduce human interference and prevent further damage [65]. Moreover, the Jiulianshan National Nature Reserve should be managed more scientifically and constructed with corresponding engineering measures [66]. Consider establishing coordination mechanisms with multiple stakeholders when implementing ecological restoration measures. In addition to these macro-protection principles, we should also consider the suitability of various vegetation types for different environments and elevations [67].
4.3. Limitations
The InVEST model was used to quantitatively evaluate water yield, soil conservation, and carbon sequestration from 2000 to 2020. This model has been recognized as an appropriate tool because it achieves the expected results with fewer data and simplified computational steps [43]. Our study improved the accuracy and reliability of the evaluation results through model validation. The validation results showed that the study results were in good agreement with the actual value. However, the modeling and data limitations of the InVEST model should be recognized. This model cannot address daily or monthly climate data, so our study ignored daily or monthly extreme climatic events [68]. Moreover, the carbon-storage-and-sequestration model uses a simplified carbon cycle that quantifies the amount of static carbon storage, which lacks consideration of the transformation between various carbon pools. Therefore, extreme climate effects on ecosystem services and the optimization of the accuracy of simulation models need more attention in future research to reduce the uncertainty of model assessment results.
5. Conclusions
This study investigated spatial and temporal changes in water yield, soil conservation, and carbon sequestration from 2000 to 2020 in the Jiulianshan Nation Nature Reserve by applying the InVEST model. Spatial patterns of trade-offs and synergies were distinguished by correlation analysis. Then we analyzed the response of ecosystem services relationships among different vegetation types and elevation bands. Our results showed that water yield and carbon sequestration exhibited an overall upward trend from 2000 to 2020, while soil conservation remained a marginal degradation. Ecosystem services increased, in aggregate, in the central, western, and southeastern areas, and decreased in the midwestern areas and northeastern fringes. The synergies among water yield, soil conservation, and carbon sequestration were spatially dominant, while the trade-offs were mainly concentrated in the northern, southern, and southwestern areas. Among the different vegetation types, synergies dominated ecosystem services in broad-leaved forests, coniferous forests, mixed forests, and Moso bamboo forests and in grass. Moreover, with the increase in elevation, the trade-offs were gradually reduced. Therefore, to maximize the benefits of ecosystem services, policymakers should focus on the trade-off areas and strengthen the implementation of ecological projects based on the balance of ecosystem services. This study could provide a theoretical basis for implementing management strategies and the sustainable development of society, economy, and ecology in China’s nature reserves.
Supplementary Materials
The following supporting information can be downloaded at: https://www.mdpi.com/article/10.3390/f13030416/s1, Figure S1: The vegetation and land use/land cover type of the study area; Table S1: Input data on carbon stored in each of the four fundamental pools for each LULC class in the InVEST 3.8.9 model (t/ha); Table S2: Input data for each LULC class in the InVEST 3.8.0 water yield model; Table S3: Input data for each LULC class in the InVEST 3.8.9 sediment delivery ratio model.
Author Contributions
Conceptualization, J.F., F.C., F.T. and C.H.; Methodology, J.F., F.T., K.L., L.H., F.W. and C.H.; Validation, J.F., F.T., K.L., F.W. and C.H.; Data curation and analysis, J.F., F.C., F.T., F.W. and C.H.; Writing-Review & Editing, J.F., F.C., F.T., K.L., L.H., F.W. and C.H. All authors have read and agreed to the published version of the manuscript.
Funding
This research was funded by the National Natural Science Foundation of China (32160292 and 31800408), the National Key R&D Program of China (2017YFA0604403), and the Double Thousand Plan of Jiangxi Province (jxsq2020101080).
Institutional Review Board Statement
Not applicable.
Informed Consent Statement
Not applicable.
Data Availability Statement
Land use/land cover data used in this study is available at http://www.globallandcover.com (accessed on 15 January 2022). The 30 m Digital Elevation Model (DEM) data is available in http://www.gscloud.cn (accessed on 15 January 2022). The soil erodibility factor (K) is available in https://gda.bnu.edu.cn/(accessed on 15 January 2022).
Acknowledgments
We would like to thank the high-performance computing support from the Center for Geodata and Analysis, Faculty of Geographical Science, Beijing Normal University (https://gda.bnu.edu.cn/, accessed on 15 January 2022).
Conflicts of Interest
The authors declare no conflict of interest.
References
- Costanza, R.; d’Arge, R.; De Groot, R.; Farber, S.; Grasso, M.; Hannon, B.; Limburg, K.; Naeem, S.; O’Neill, R.V.; Paruelo, J.; et al. The value of the world’s ecosystem services and natural capital. Nature 1997, 25, 3–15. [Google Scholar] [CrossRef]
- Ouyang, Z.; Zheng, H.; Xiao, Y.; Polasky, S.; Liu, J.; Xu, W.; Wang, Q.; Zhang, L.; Xiao, Y.; Rao, E.; et al. Improvements in ecosystem services from investments in natural capital. Science 2016, 352, 1455–1459. [Google Scholar] [CrossRef] [PubMed]
- Balkanlou, K.R.; Müller, B.; Cord, A.F.; Panahi, F.; Malekian, A.; Jafari, M.; Egli, L. Spatiotemporal dynamics of ecosystem services provision in a degraded ecosystem: A systematic assessment in the Lake Urmia basin, Iran. Sci. Total Environ. 2020, 716, 137100. [Google Scholar] [CrossRef] [PubMed]
- Scholes, R.J.; Ash, N.; Hassan, R.M. Ecosystems and Human Well-Being; Island Press: Washington, DC, USA, 2005. [Google Scholar]
- Luty, L.; Musiał, K.; Zioło, M. The Role of Selected Ecosystem Services in Different Farming Systems in Poland Regarding the Differentiation of Agricultural Land Structure. Sustainability 2021, 13, 6673. [Google Scholar] [CrossRef]
- Assumma, V.; Bottero, M.; Caprioli, C.; Datola, G.; Mondini, G. Evaluation of Ecosystem Services in Mining Basins: An Application in the Piedmont Region (Italy). Sustainability 2022, 14, 872. [Google Scholar] [CrossRef]
- Cord, A.F.; Bartkowski, B.; Beckmann, M.; Dittrich, A.; Hermans-Neumann, K.; Kaim, A.; Lienhoop, N.; Locher-Krause, K.; Priess, J.; Schröter-Schlaack, C.; et al. Towards systematic analyses of ecosystem service trade-offs and synergies: Main concepts, methods and the road ahead. Ecosyst. Serv. 2017, 28, 264–272. [Google Scholar] [CrossRef]
- Haase, D.; Schwarz, N.; Strohbach, M.; Kroll, F.; Seppelt, R. Synergies, Trade-offs, and Losses of Ecosystem Services in Urban Regions: An Integrated Multiscale Framework Applied to the Leipzig-Halle Region, Germany. Ecol. Soc. 2012, 17, 22. [Google Scholar] [CrossRef]
- Tomscha, S.A.; Gergel, S.E. Ecosystem service trade-offs and synergies misunderstood without landscape history. Ecol. Soc. 2016, 21, 43. [Google Scholar] [CrossRef] [Green Version]
- Deng, X.; Li, Z.; Gibson, J. A review on trade-off analysis of ecosystem services for sustainable land-use management. J. Geogr. Sci. 2016, 26, 953–968. [Google Scholar] [CrossRef] [Green Version]
- Felipe-Lucia, M.R.; Comín, F.A.; Bennett, E.M. Interactions Among Ecosystem Services Across Land Uses in a Floodplain Agroecosystem. Ecol. Soc. 2014, 19, 20. [Google Scholar] [CrossRef] [Green Version]
- Yang, Y.; Zheng, H.; Kong, L.; Huang, B.; Xu, W.; Ouyang, Z. Mapping ecosystem services bundles to detect high- and low-value ecosystem services areas for land use management. J. Clean. Prod. 2019, 225, 11–17. [Google Scholar] [CrossRef]
- Howe, C.; Suich, H.; Vira, B.; Mace, G.M. Creating win-wins from trade-offs? Ecosystem services for human well-being: A meta-analysis of ecosystem service trade-offs and synergies in the real world. Glob. Environ. Change 2014, 28, 263–275. [Google Scholar] [CrossRef] [Green Version]
- Han, Z.; Song, W.; Deng, X.; Xu, X. Trade-Offs and Synergies in Ecosystem Service within the Three-Rivers Headwater Region, China. Water 2017, 9, 588. [Google Scholar] [CrossRef] [Green Version]
- Bai, Y.; Zhuang, C.; Ouyang, Z.; Zheng, H.; Jiang, B. Spatial characteristics between biodiversity and ecosystem services in a human-dominated watershed. Ecol. Complex. 2011, 8, 177–183. [Google Scholar] [CrossRef]
- Turner, K.G.; Odgaard, M.V.; Bøcher, P.K.; Dalgaard, T.; Svenning, J. Bundling ecosystem services in Denmark: Trade-offs and synergies in a cultural landscape. Landsc. Urban Plan. 2014, 125, 89–104. [Google Scholar] [CrossRef]
- Ndong, G.O.; Therond, O.; Cousin, I. Analysis of relationships between ecosystem services: A generic classification and review of the literature. Ecosyst. Serv. 2020, 43, 101120. [Google Scholar] [CrossRef]
- Yang, S.; Zhao, W.; Liu, Y.; Wang, S.; Wang, J.; Zhai, R. Influence of land use change on the ecosystem service trade-offs in the ecological restoration area: Dynamics and scenarios in the Yanhe watershed, China. Sci. Total Environ. 2018, 644, 556–566. [Google Scholar] [CrossRef]
- Fu, B.J.; Yu, D.D. Trade-off analyses and synthetic integrated method of multiple ecosystem services. Resour. Sci. 2016, 38, 1–9. [Google Scholar]
- Jopke, C.; Kreyling, J.; Maes, J.; Koellner, T. Interactions among ecosystem services across Europe: Bagplots and cumulative correlation coefficients reveal synergies, trade-offs, and regional patterns. Ecol. Indic. 2015, 49, 46–52. [Google Scholar] [CrossRef]
- Huang, Y.; Fu, J.; Wang, W.; Li, J. Development of China’s nature reserves over the past 60 years: An overview. Land Use Policy 2019, 80, 224–232. [Google Scholar] [CrossRef]
- Xua, X.; Jiang, B.; Chen, M.; Bai, Y.; Yang, G. Strengthening the effectiveness of nature reserves in representing ecosystem services: The Yangtze River Economic Belt in China. Land Use Policy 2020, 96, 104717. [Google Scholar] [CrossRef]
- Scolozzi, R.; Schirpke, U.; Morri, E.; D’Amato, D.; Santolini, R. Ecosystem services-based SWOT analysis of protected areas for conservation strategies. J. Environ. Manag. 2014, 146, 543–551. [Google Scholar] [CrossRef] [PubMed]
- Liu, Y.L.J.; Yang, Y. Strategic adjustment of land use policy under the economic transformation. Land Use Policy 2018, 74, 5–14. [Google Scholar] [CrossRef]
- Figgis, P.; Mackey, B.; Fitzsimons, J.; Irving, J.; Clarke, P. Valuing Nature: Protected Areas and Ecosystem Services; Australian Committee for IUCN: Sydney, Australia, 2015. [Google Scholar]
- Schirpke, U.; Marino, D.; Marucci, A.; Palmieri, M.; Scolozzi, R. Operationalising ecosystem services for effective management of protected areas: Experiences and challenges. Ecosyst. Serv. 2017, 28, 105–114. [Google Scholar] [CrossRef]
- Xu, W.; Xiao, Y.; Zhang, J.; Yang, W.; Zhang, L.; Hull, V.; Wang, Z.; Zheng, H.; Liu, J.; Polasky, S.; et al. Strengthening protected areas for biodiversity and ecosystem services in China. Proc. Natl. Acad. Sci. USA 2017, 114, 1601–1606. [Google Scholar] [CrossRef] [Green Version]
- Liu, J.; Linderman, M.; Ouyang, Z.; An, L.; Yang, J.; Zhang, H. Ecological degradation in protected areas: The case of Wolong Nature Reserve for giant pandas. Science 2001, 292, 98–101. [Google Scholar] [CrossRef] [Green Version]
- Pouzols, F.M.; Toivonen, T.; Di Minin, E.; Kukkala, A.S.; Kullberg, P.; Kuusterä, J.; Lehtomäki, J.; Tenkanen, H.; Verburg, P.H.; Moilanen, A. Global protected area expansion is compromised by projected land-use and parochialism. Nature 2014, 516, 383–386. [Google Scholar] [CrossRef] [Green Version]
- Wu, J.; Yang, J.; Nakagoshi, N.; Lu, X.; Xu, H. Proposal for Developing Carbon Sequestration Economy in Ecological Conservation Area of Beijing. Adv. Mater. Res. 2012, 524, 3424–3427. [Google Scholar]
- Jian, M.-F.; Liu, Q.-J.; Zhu, D.; You, H. Inter-specific correlations among dominant populations of tree layer species in evergreen broad-leaved forest in Jiulianshan Mountain of subtropical China. Chin. J. Plant Ecol. 2009, 33, 672–680. [Google Scholar]
- Li, H. Valuation of the Ecosystem Service Functions of Jiangxi Jiulianshan National Nature Reserve. For. Resour. Manag. 2006, 4, 70–73. [Google Scholar]
- Yue, T.; Yin, S.; Xie, Y.; Yu, B.; Liu, B. Rainfall erosivity mapping over mainland China based on high density hourly rainfall records. Earth Syst. Sci. Data Discuss. 2022, 14, 665–682. [Google Scholar] [CrossRef]
- Allen, R.G.; Pereira, L.S.; Raes, D.; Smith, M. Crop evapotranspiration-Guidelines for computing crop water requirements-FAO Irrigation and drainage paper 56. Fao Rome 1998, 300, D05109. [Google Scholar]
- Smith, D.D.; Wischmeier, W.H. Predicting Rainfall Erosion Losses: A Guide to Conservation Planning. Department of Agriculture, Science and Education Administration. 1978. Available online: https://naldc.nal.usda.gov/catalog/CAT79706928 (accessed on 15 January 2022).
- Cancan, Z.; Xiaogang, W.; Bin, L.; Xuewen, S.; Fusheng, C.; Lihong, Q.; Wensheng, B. Variations in soil organic carbon along an altitudinal gradient of Jiulian Mountain in Jiangxi Province of eastern China. J. Beijing For. Univ. 2019, 41, 19–28. [Google Scholar]
- Liu, Z.; Dong, X.; Liu, Z. Organic Carbon Storage and Spatial Distribution of Forest Soil in Jiangxi. Adv. Mater. Res. 2014, 1010, 1194–1197. [Google Scholar]
- Li, H.; Wang, S.; Gao, L.; Yu, G. The carbon storage of the subtropical forest vegetation in central Jiangxi Province. Acta Ecol. Sin. 2007, 27, 693–702. [Google Scholar]
- Liu, J.; Fu, B.; Zhang, C.H.; Peng, Z.H.; Wang, Y.K. Assessment of Ecosystem Water Retention and Its Value in the Upper Reaches of Minjiang River Based on InVEST Model. Resour. Environ. Yangtze Basin 2019, 28, 578–585. [Google Scholar]
- Redhead, J.W.; Stratford, C.; Sharps, K.; Jones, L.; Ziv, G.; Clarke, D.; Oliver, T.H.; Bullock, J.M. Empirical validation of the InVEST water yield ecosystem service model at a national scale. Sci. Total Environ. 2016, 569, 1418–1426. [Google Scholar] [CrossRef] [Green Version]
- Pan, T.; Wu, S.-H.; Dai, E.; Liu, Y.-J. Spatiotemporal variation of water source supply service in Three Rivers Source Area of China based on InVEST model. Chin. J. Appl. Ecol. 2013, 24, 183–189. [Google Scholar]
- Sharp, R.; Douglass, J.; Wolny, S. InVEST User’s Guide; The Natural Capital Project: Stanford, CA, USA, 2014. [Google Scholar]
- Yang, D.; Liu, W.; Tang, L.; Chen, L.; Li, X.; Xu, X. Estimation of water provision service for monsoon catchments of South China: Applicability of the InVEST model. Landsc. Urban Plan. 2019, 182, 133–143. [Google Scholar] [CrossRef]
- Feng, X.M.; Sun, G.; Fu, B.J.; Su, C.H.; Liu, Y.; Lamparski, H. Regional effects of vegetation restoration on water yield across the Loess Plateau, China. Hydrol. Earth Syst. Sci. 2012, 16, 2617–2628. [Google Scholar] [CrossRef] [Green Version]
- Zhang, L.; Dawes, W.R.; Walker, G.R. Response of mean annual evapotranspiration to vegetation changes at catchment scale. Water Resour. Res. 2001, 37, 701–708. [Google Scholar] [CrossRef]
- Li, T.; Lü, Y.; Fu, B.; Hu, W.; Comber, A.J. Bundling ecosystem services for detecting their interactions driven by large-scale vegetation restoration: Enhanced services while depressed synergies. Ecol. Indic. 2019, 99, 332–342. [Google Scholar] [CrossRef] [Green Version]
- Li, Z.; Cheng, X.; Han, H. Future Impacts of Land Use Change on Ecosystem Services under Different Scenarios in the Ecological Conservation Area, Beijing, China. Forests 2020, 11, 584. [Google Scholar] [CrossRef]
- Lang, Y.; Song, W.; Zhang, Y. Responses of the water-yield ecosystem service to climate and land use change in Sancha River Basin, China. Phys. Chem. Earth Parts A/B/C 2017, 101, 102–111. [Google Scholar] [CrossRef]
- Wang, X.; Chu, B.; Feng, X.; Li, Y.; Fu, B.; Liu, S.; Jin, J. Spatiotemporal variation research on the driving factors of water yield services on the Qingzang Plateau. Geogr. Sustain. 2021, 2, 31–39. [Google Scholar]
- Sun, X.; Lu, Z.; Li, F.; Crittenden, J.C. Analyzing spatio-temporal changes and trade-offs to support the supply of multiple ecosystem services in Beijing, China. Ecol. Indic. 2018, 94, 117–129. [Google Scholar] [CrossRef]
- Huang, L.; Wang, B.; Niu, X.; Gao, P.; Song, Q. Changes in ecosystem services and an analysis of driving factors for China’s Natural Forest Conservation Program. Ecol. Evol. 2019, 9, 3700–3716. [Google Scholar] [CrossRef]
- Zhang, P.; He, L.; Fan, X.; Huo, P.; Liu, Y.; Zhang, T.; Pan, Y.; Yu, Z. Ecosystem Service Value Assessment and Contribution Factor Analysis of Land Use Change in Miyun County, China. Sustainability 2015, 7, 7333–7356. [Google Scholar] [CrossRef] [Green Version]
- Power, A.G. Ecosystem services and agriculture: Tradeoffs and synergies. Philos. Trans. R. Soc. B Biol. Sci. 2010, 365, 2959–2971. [Google Scholar] [CrossRef]
- Machado, M.; Young, C.E.F.; Clauzet, M. Environmental funds to support protected areas: Lessons from Brazilian experiences. Parks 2020, 26, 47. [Google Scholar] [CrossRef]
- Qian, D.; Cao, G.; Du, Y.; Li, Q.; Guo, X. Impacts of climate change and human factors on land cover change in inland mountain protected areas: A case study of the Qilian Mountain National Nature Reserve in China. Environ. Monit. Assess. 2019, 191, 486. [Google Scholar] [CrossRef] [PubMed]
- Crouzat, E.; Mouchet, M.; Turkelboom, F.; Byczek, C.; Meersmans, J.; Berger, F.; Verkerk, P.J.; Lavorel, S. Assessing bundles of ecosystem services from regional to landscape scale: Insights from the French Alps. J. Appl. Ecol. 2015, 52, 1145–1155. [Google Scholar] [CrossRef] [Green Version]
- Zhang, X.; Xie, H.; Shi, J.; Lv, T.; Zhou, C.; Liu, W. Assessing Changes in Ecosystem Service Values in Response to Land Cover Dynamics in Jiangxi Province, China. Int. J. Environ. Res. Public Health 2020, 17, 3018. [Google Scholar] [CrossRef] [PubMed]
- Yin, L.; Wang, X.; Zhang, K.; Xiao, F.; Cheng, C.; Zhang, X. Trade-offs and synergy between ecosystem services in National Barrier Zone. Geogr. Res. 2019, 38, 2162–2172. [Google Scholar]
- Braun, D.; Damm, A.; Hein, L.; Petchey, O.L.; Schaepman, M.E. Spatio-temporal trends and trade-offs in ecosystem services: An Earth observation based assessment for Switzerland between 2004 and 2014. Ecol. Indic. 2018, 89, 828–839. [Google Scholar] [CrossRef]
- Dai, E.-F.; Wang, X.-L.; Zhu, J.-J.; Xi, W.-M. Quantifying ecosystem service trade-offs for plantation forest management to benefit provisioning and regulating services. Ecol. Evol. 2017, 7, 7807–7821. [Google Scholar] [CrossRef]
- Ran, C.; Wang, S.; Bai, X.; Tan, Q.; Zhao, C.; Luo, X.; Chen, H.; Xi, H. Trade-Offs and Synergies of Ecosystem Services in Southwestern China. Environ. Eng. Sci. 2020, 37, 669–678. [Google Scholar] [CrossRef]
- Palomo, I. Climate Change Impacts on Ecosystem Services in High Mountain Areas: A Literature Review. Mt. Res. Dev. 2017, 37, 179–187. [Google Scholar] [CrossRef] [Green Version]
- Keesstra, S.; Nunes, J.; Novara, A.; Finger, D.; Avelar, D.; Kalantari, Z.; Cerdà, A. The superior effect of nature based solutions in land management for enhancing ecosystem services. Sci. Total Environ. 2018, 610, 997–1009. [Google Scholar] [CrossRef] [Green Version]
- Xu, J. China’s new forests aren’t as green as they seem. Nature 2011, 477, 371. [Google Scholar] [CrossRef] [Green Version]
- Muttaqin, M.Z.; Alviya, I.; Lugina, M.; Hamdani, F.A.U. Indartik Developing community-based forest ecosystem service management to reduce emissions from deforestation and forest degradation. For. Policy Econ. 2019, 108, 101938. [Google Scholar] [CrossRef]
- Wang, Y.; Li, X.; Zhang, Q.; Li, J.; Zhou, X. Projections of future land use changes: Multiple scenarios-based impacts analysis on ecosystem services for Wuhan city, China. Ecol. Indic. 2018, 94, 430–445. [Google Scholar] [CrossRef]
- Miao, N.; Xu, H.; Moermond, T.C.; Li, Y.; Liu, S. Density-dependent and distance-dependent effects in a 60-ha tropical mountain rain forest in the Jianfengling Mountains, Hainan Island, China: Spatial pattern analysis. For. Ecol. Manag. 2018, 429, 226–232. [Google Scholar] [CrossRef]
- Hamel, P.; Guswa, A.J. Uncertainty analysis of a spatially explicit annual water-balance model: Case study of the Cape Fear basin, North Carolina. Hydrol. Earth Syst. Sci. 2015, 19, 839–853. [Google Scholar] [CrossRef] [Green Version]


Publisher’s Note: MDPI stays neutral with regard to jurisdictional claims in published maps and institutional affiliations. |
© 2022 by the authors. Licensee MDPI, Basel, Switzerland. This article is an open access article distributed under the terms and conditions of the Creative Commons Attribution (CC BY) license (https://creativecommons.org/licenses/by/4.0/).