Article

Deforestation as a Systemic Risk: The Case of Brazilian Bovine Leather †

1
TESAF Department, University of Padova, 35020 Legnaro, Italy
2
Forest and Nature Conservation Policy Group, Wageningen University and Research, 6700 AA Wageningen, The Netherlands
*
Author to whom correspondence should be addressed.
This work was part of the Doctoral thesis of the correspondence author Aynur Mammadova, in University of Padova, Padua, Italy.
Forests 2022, 13(2), 233; https://doi.org/10.3390/f13020233
Submission received: 21 December 2021 / Revised: 26 January 2022 / Accepted: 28 January 2022 / Published: 3 February 2022
(This article belongs to the Section Forest Economics, Policy, and Social Science)

Abstract

:
Tropical deforestation and forest degradation driven by agricultural commodity production remains one of the important sustainability challenges of our times. The responses to tropical deforestation so far have not managed to reverse global trends of forest loss, reigniting the discussion about more robust and systemic measures. The concept of deforestation risk is highly relevant for current debates about policy and trade, and likely to increase in importance in the context of the proposed EU Regulation on Deforestation-free Products and EU-Mercosur Trade Agreement. We argue that deforestation is a systemic risk that permeates through different economic sectors, including production, manufacturing, service and control sectors. International trade, investment and economic policies thus act as a systemic trap that cause the production sector to continue with nature’s destruction. This article seeks to more clearly define deforestation risk and uses the case of bovine leather from Brazil to illustrate how pressures for deforestation accumulate across economic sectors towards production, while deforestation risk is dispersed in an opposite trajectory. The article draws on multiple datasets and an extensive literature review. Included are quantitative data sources on annual slaughter, bovine hide/leather registry and annual deforestation, slaughterhouse and tannery locations. We argue that the EU banning unsustainable products from entry and putting incentives for more sustainable agricultural production in the tropics addresses deforestation risks that are currently visible and relatively easy to identify. These response mechanisms are conditioned upon traceability of deforestation risk across supply chains, which is prone to falsifications, leakage and laundry. Although proven to be essential, the proposed EU responses still miss out deeper leverage points to address the systemic drivers of deforestation coming from the manufacturing, service and control sectors that make production through deforestation profitable in the first place.

1. Introduction

Tropical deforestation and forest degradation are important sustainability challenges of our times. Large scale agricultural production is widely known as the single most important driver of deforestation in the tropics [1,2,3,4]. The production of a few globally traded commodities such as beef, palm oil, soybean, timber, coffee, and cacao is estimated to be responsible for the majority of tropical deforestation [5,6,7]. Gibbs et al. [8] assess that between 1980 and 2000, more than 55% of new agricultural land came at the expense of intact forests. Curtis et al. [1] argue that agricultural commodity production was the single most important driver of deforestation, with an associated 27% of permanent land use change within the period 2001–2015. In addition, commercial agriculture is linked to surges in forest fires in tropical countries [9,10].
When considering economic sectors, the production sector is where direct (material) deforestation happens and where it is relatively easier to trace, despite the varying deforestation, impacts of agricultural production based on commodity, region and period of time [11,12]. When moving away from the production places, the geographical distance between the deforested lands and consumer markets makes establishment of a firm link between commodity consumption and deforestation more difficult. Besides, indirect drivers of deforestation such as trade and consumption have overlapping (or back-to-back) and interplaying factors that make it difficult to assign specific and unique responsibilities, in terms of deforestation and forest degradation, to single units of commodities. These uncertainties are captured through the term deforestation risk and traced across commodity supply chains. Given that there is always uncertainty to attribute deforestation directly to an individual commodity, we therefore speak of deforestation risk rather than material deforestation when tracing deforestation through supply chains.
As products gain additional value in a supply chain and move through processing, manufacturing, packaging and so on within different economic sectors, the complexity of tracing deforestation risk increases [13,14,15]. Global trade adds a further geographical layer of complexity, making full traceability a challenge in practice and obscuring deforestation risk despite growing technological solutions and methodologies for traceability and transparency. First, intermediaries, traders, importers and secondary exporters located in different countries complicate trade relations and add black spots to traceability. For example, the existence of unidentified steps in a supply chain and its level of complexity are taken as proxies for elevated risk, also according to EU Timber Regulation requirements (Regulation (EU) 995/2010, art. 6) [13]. Second, global trade data focus on more aggregated numbers and statistics, dispersing the direct deforestation impact of a given commodity set. Third, as global trade relations also implicate asset management, shareholding and investments (e.g., exchange-traded funds, index funds, etc.) the direct links to deforestation found in production activities disperses further away while reaching the actors in these sectors.
Most, if not all, responses to agriculture-driven deforestation focus either on production areas in tropical countries (e.g., landscape or jurisdictional approaches, conservation of forest areas through REDD+, etc.) or on the sustainability of individual commodity supply chains [16]. Although these approaches have brought certain success, the overall effectiveness of these approaches on the ground are largely debated based on four main challenges: (a) an attempt to focus on sustainable production in a given jurisdictional unit leads to displacing unsustainable production to somewhere else [17]; (b) a focus on individual supply chain sustainability can lead to leakage or laundering across legal and illegal production systems [18,19,20]; (c) bans on imports of unsustainable products can lead to black markets and make those production processes even more profitable [21,22]; and (d) as most of the illegal deforestation in the tropics is driven by land speculation due to systemic drivers (e.g., governance and land rights) rather than by need for food production, the initiatives that focus on market instruments targeting producers also have not brought large-scale positive impacts [23,24,25].
Attempts to overcome the above challenges are multiple, also at the European level. For example, in 2013, the EC published a report on the impact of EU consumption on deforestation. This report first coined the concept of embedded deforestation, which is defined as “…the deforestation embodied (as an externality) in a produced, traded, or consumed product, good, commodity or service during their production phase” [26] (p.14). The concept focuses on tracing the deforestation risk at any point of commodity supply chains, and contributes to debates about shifting the responsibility for tropical deforestation towards imports by global North. The currently proposed Regulation on Deforestation-free Products by the European Commission (EC) also aims to bring a more concerted effort to addressing deforestation by extending due diligence requirements adopted by EU Timber Regulation to other commodities.
In this context, supply chains remain central to design and implementation of government actions and private initiatives aiming for a deforestation-free economy. However, the large geographic scope of production and consumption of commodities and the complex web of actors involved, invite us to think more broadly through the economic systems with regards to deforestation. Specifically, expanding the supply chain perspective to include actors and processes in other economic sectors than production and trade, may help us understand why current approaches to address deforestation and forest degradation have thus far failed to make a global impact.
This article explores deforestation risk in two ways. First, it traces how drivers for deforestation accumulate in the economic system moving from one sector to another, increasing pressure on the production sector to engage in deforestation. Second, it describes how traceability of that pressure is quickly dispersed in our current economic system when moving away from the commodity production sector to others. As such, this article addresses the challenges that current international policy responses face by exploring how we can identify drivers of deforestation and trace deforestation risk. We take deforestation risk as embedded in the whole economic system instead of commodity supply chains only and explore the visibility of deforestation risk across the system. Inevitably, that visibility has an impact on how responsibility and accountability is constructed through self-regulatory voluntary standards, legal measures and policy responses to tropical deforestation.
Below, we focus on the case of Brazilian leather and deforestation in Brazilian Legal Amazon (BLA) to demonstrate how systemic drivers cause deforestation pressure that mounts towards the production sector. The administrative unit of BLA was established by Federal Law No. 5.173 (Art. 2) and surrounds the states of Acre, Amapá, Amazonas, Pará, Rondônia, Roraima, Tocantins, Mato Grosso and part of Maranhão. Covering more than 5 million km2 (two-thirds of Brazil), Legal Amazon encompasses all the Amazon Biome, 37% of the Cerrado and 40% of the Pantanal Biome. While the role of cattle in deforestation in Brazil is subject to increasing public scrutiny, the leather commodity chain has remained in the shadows up until recently, presenting an interesting case to study the dispersal of deforestation risk. Moreover, leather production and trade are more complex compared to beef and involve many national and international players, including intermediary sellers, tanneries and fashion houses among others. This creates traceability gaps and complicates identifying deforestation risk along the supply chain, especially for downstream market actors. In the next section we present our materials and methods. In Section 3 we discuss the accumulation of pressure for deforestation towards the production sector. In Section 4 we analyze the case of Brazilian bovine leather to demonstrate the dispersal of deforestation risk. Section 5 presents the discussion and Section 6, the conclusion together with policy implications.

2. Conceptual Approach. Materials and Methods

This article uses economic analysis and deforestation risk analysis to provide insights into how different economic sectors cause deforestation pressure and how deforestation risk disperses when moving from one economic sector to other. For our economic analysis, we build on literature that discusses how the economy is divided into different sectors. This informs the first part of our results section where we draw on recent contributions from academic and grey literature to offer insight into how each economic sector drives deforestation in specific ways. The different combination of keywords “deforestation”, “Amazonia”, “commodity”, “cattle”, “trade”, “investment”, “policy” was used to search for publications on Scopus. The evaluation in terms of relevance, of the title and abstracts of the found articles resulted in the list of 13 publications. Additional search on Google Scholar revealed three publications by Balogh and Jámbor [27], Heyl et.al [28] and Balogh and Mizik [29] that conduct systematic reviews of the research on environmental impacts of agricultural trade, including deforestation. Using the reference list of these publications, snowballing was applied to identify additional publications relevant for the topic. The same keywords were also used to search for grey literature on Google Search. The review of the identified peer-reviewed articles and the grey literature is discussed in the Section 3. For our deforestation risk analysis, we analyzed the supply chain of Brazilian bovine leather, using several data sets. The outcome of this analysis informs the second part of our results, where we situate the deforestation risk of the leather within the different economic sectors.

2.1. Economic Analysis of Drivers of Deforestation

The economic activities involved in agriculture (cattle raising, industrial crop production, etc.), extraction (mining, logging, etc.), and infrastructure development (along with urbanization) are widely identified as the most important direct drivers of deforestation in the tropics [11,16,30,31]. In addition to these direct drivers of deforestation, there are also indirect (underlying) drivers [31,32]. Indirect drivers are described as complex interactions of social, economic, political, cultural and technological processes such as trade, governance, policies, population growth, urbanization, among others that take place on international, national and local scales. They affect the direct drivers of deforestation by creating locked systems in which deforestation becomes a default practice. Among the indirect drivers of deforestation, agricultural exports and trade in tropical countries have been identified as the most relevant since early 2000s [11,33,34].
To better understand the dynamics of deforestation drivers, we refer to theories on the sectorial division of economy. The classic theory of “three-sector economy” [35,36]. Describes the structure of the economy as consisting of primary (agriculture, extraction, etc.), secondary (manufacturing) and tertiary (service) sectors. Mostly inspired by Schafran et al. [37], for our analysis we consider the economy as consisting of not three, but four different overarching sectors based on their different functions. First, the production sector is the one focused on raw material extraction as well as agricultural practices. Manufacturing follows next and focuses on processing of raw materials and producing more sophisticated products. The service sector captures transportation, trade, investments, finance, retail and distribution. Finally, the control sector exerts power over others and it is where the rules of the game in terms of policies, regulations, institutions, standards, norms and knowledge are being made. This sectorial division provides an overall structure for discussing the dynamics of how deforestation pressures and deforestation risk travel in opposite trajectories (see Figure 1 below).
The four economic sectors act as a whole system with its internal dynamics and reinforcing feedbacks. Indirect drivers of deforestation mentioned in the literature are those concentrating in the sectors other than production, creating a systemic “trap” for the production sector to continue to directly drive deforestation and forest degradation. It is where most of the pressure for deforestation is concentrated. The production sector is operating and reacting within the system and paradigm that favors deforestation. This, however, should not be understood as deflecting the responsibility away from the actors in the production sector, or reducing their agency in driving deforestation through their actions. If the whole economy is taken as a system and the iceberg model of systems’ thinking is applied, it helps to demonstrate that the clear visibility of the deforestation events in the production sector is simply the tip of the iceberg. The iceberg model helps to demonstrate patterns of behavior, supporting structures and underlying mental models of a particular event [38]. The service and control sectors are where institutions and structures are designed, and the rules and knowledge are created, and where deep leverage or intervention points can be found [39,40,41]. Along with focusing on the production sector, reframing and redesigning manufacturing, service and control sectors (i.e., structures and mental models) based on new paradigms can offer more proactive, transformative and long-lasting solutions.

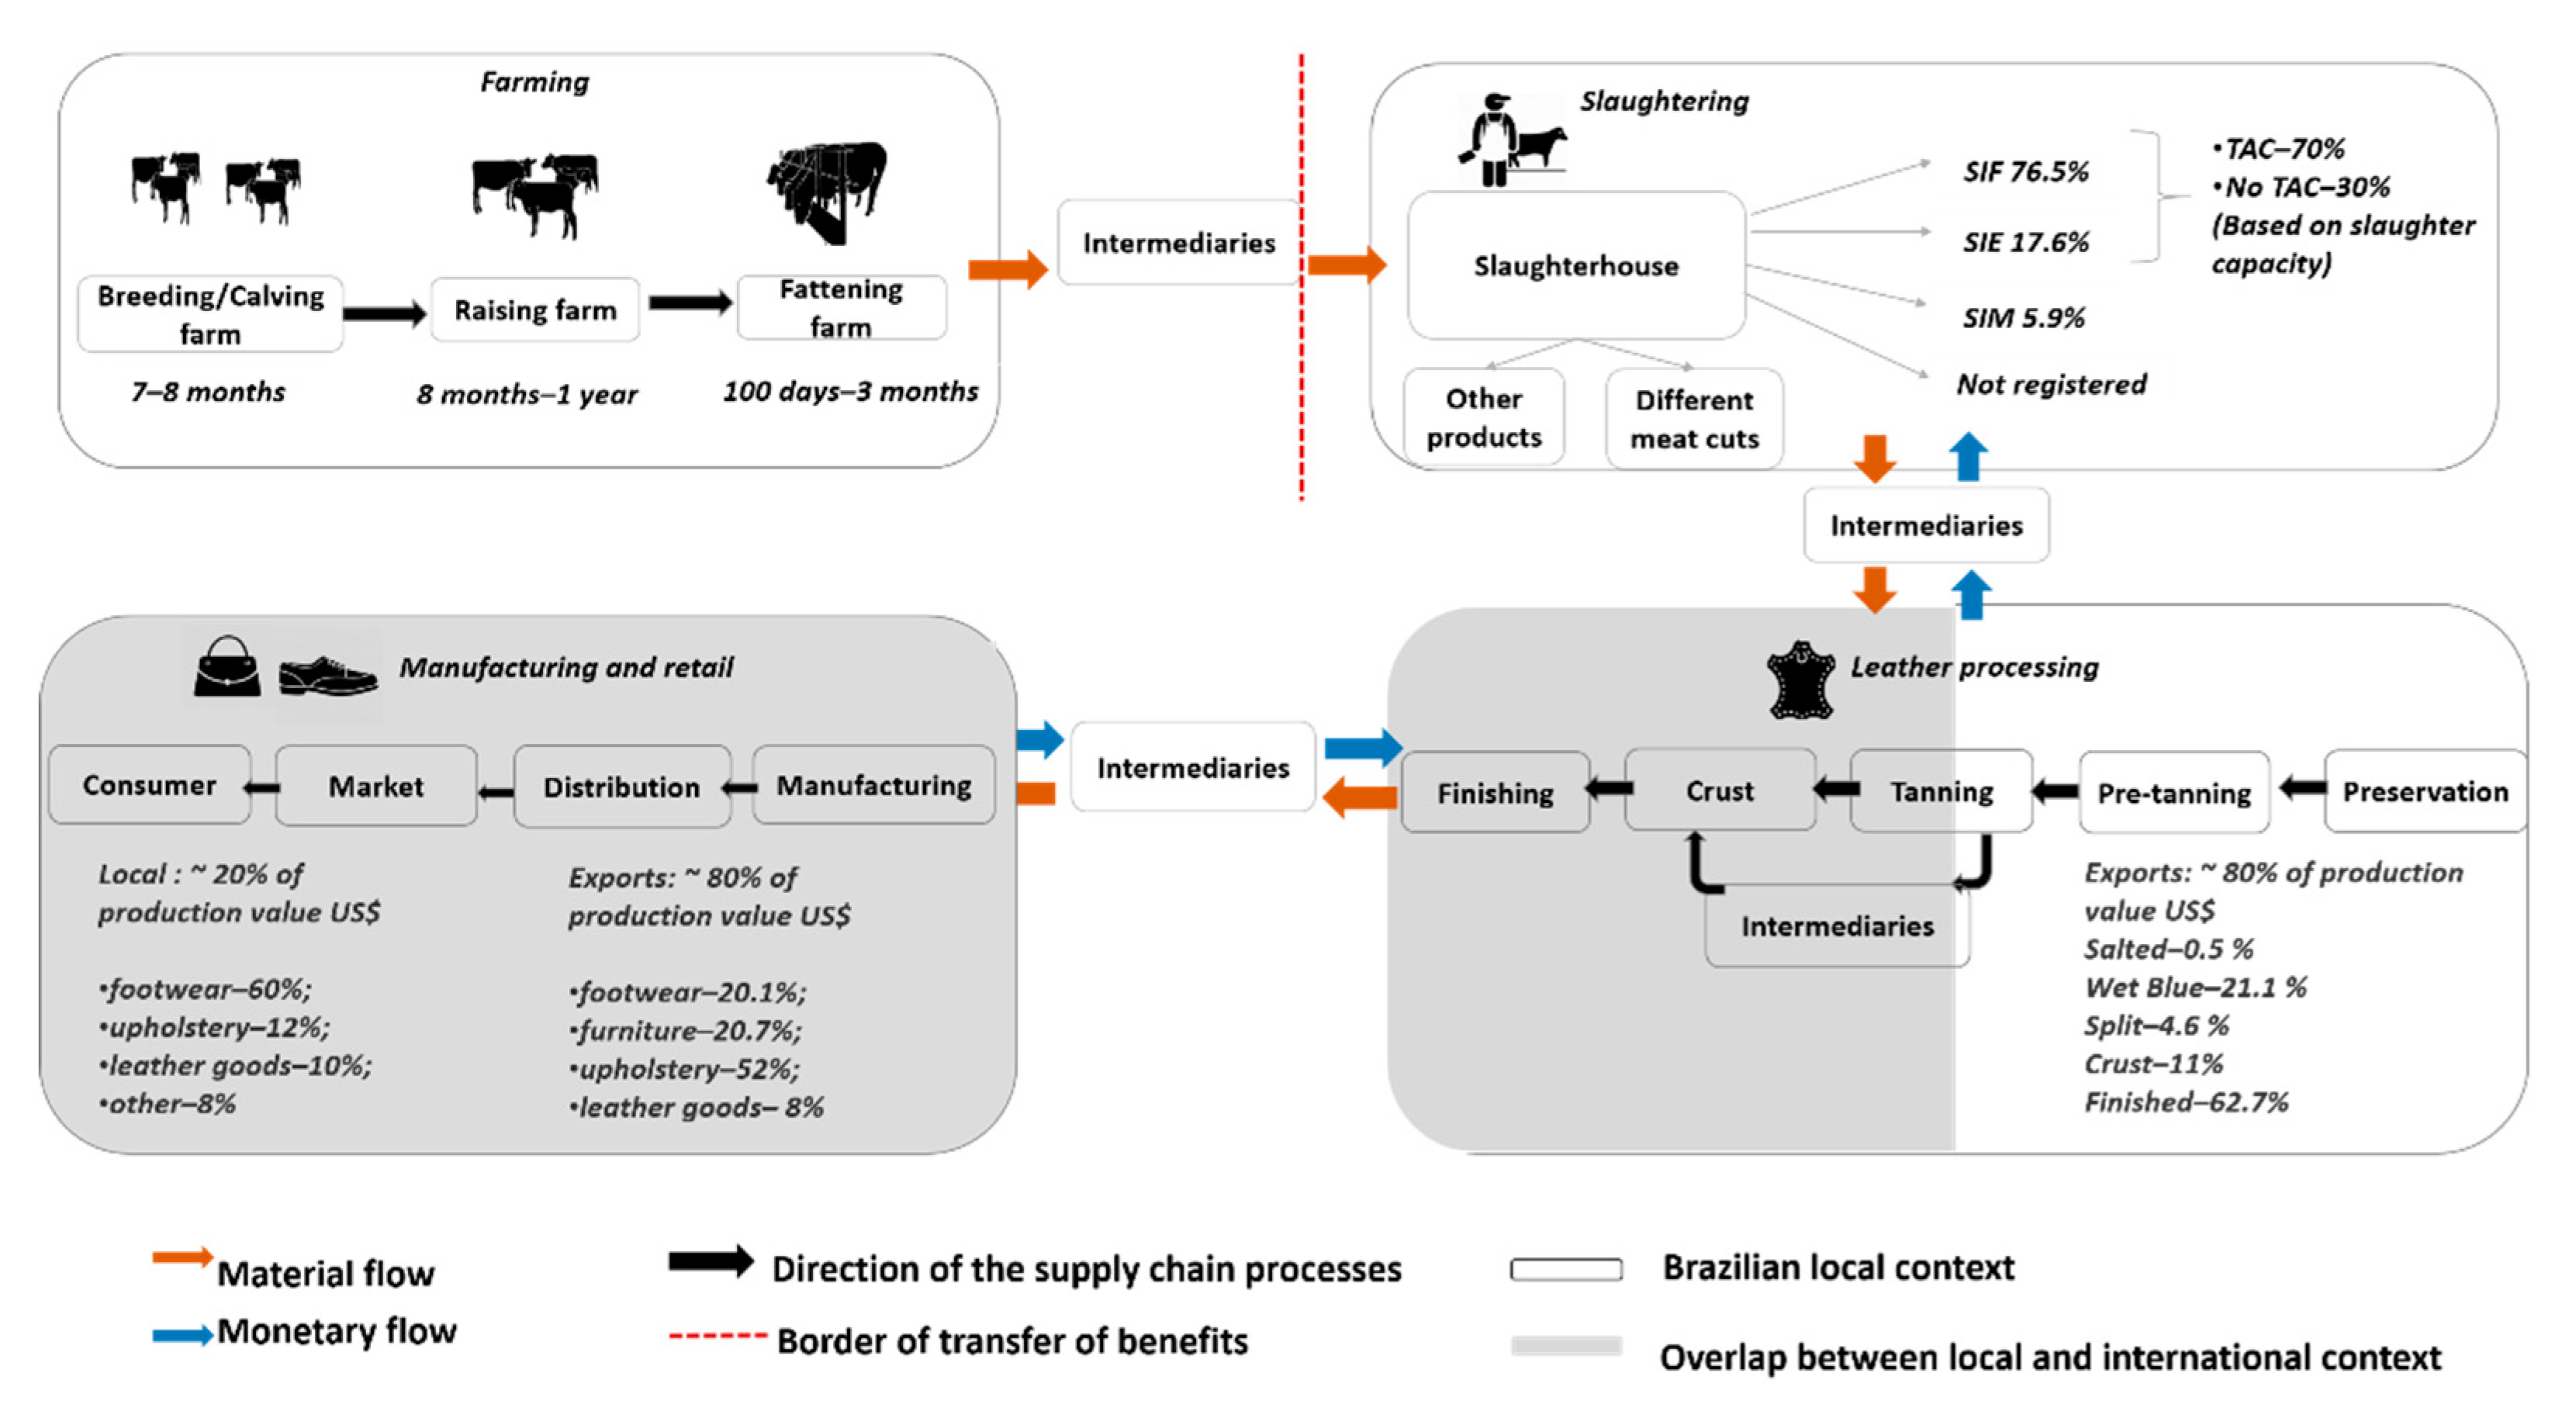
2.2. Supply Chains and Deforestation Risk

Deforestation risk is traced across global supply chains [42,43]. A supply chain is described as a system “encompassing all activities associated with the flow and transformation of goods from raw materials stage (extraction), through to the end user, as well as the associated information flows” [44] (p. 2). Although supply chains differ across industry, commodity, and regions, they are usually comprised of production, processing, manufacturing, distribution, retail and consumption stages. Thus, supply chains typically involve actors such as producers, intermediaries, processors, manufacturers, retailers, importers/exporters and consumers [45,46,47]. The actors directly involved in the production and commercialization are also referred as direct or market actors [47]. Those who are not directly involved and do not run financial risks, and yet can influence the process, both positively and negatively, are referred as indirect actors (i.e., government, policy-makers, civil society, etc.) [47,48].
In debates on supply chain management, deforestation risk emerged as a type of supply chain risk, and is increasingly added to concerns such as human rights violations and health and sanitation issues [48,49]. In the context of agricultural commodity production and trade, deforestation risk is understood as “the exposure of an actor (company or country) to the risk that the commodity it is sourcing is directly associated with recent deforestation in the region where it was produced” [50] (p.2). The concept captures uncertainties and challenges of one-to-one connection between a commodity unit and a deforestation event. It calls for robust and verifiable monitoring systems to demonstrate non-involvement in the deforestation.
Leather supply chains have a complex structure and traceability gaps which make them susceptible to deforestation risk as well. For the sake of simplicity, in this research we have divided the supply chain of leather into farming, slaughtering, leather tanning/processing, leather product manufacturing and retail segments to discuss its deforestation risk. We situate the leather supply chain within the structure of economic sectors discussed above. As supply chain structure follows physical movement of materials, it covers only production, manufacturing and some parts of service sector (i.e., commodity trade and distribution). This excludes actors and processes in finance and investments as part of service sector, and also those in the control sector, the actors and processes that can influence the supply chains indirectly. The deforestation risk of leather is very visible in the production sector as the tip of the iceberg, and disperses further moving from production to control sector, as our analysis will show below. Despite deforestation risk being only traceable across supply chains, it remains embedded in all economic sectors. Meanwhile pressure for deforestation accumulates from the control sector towards the production sector (Figure 1).

2.3. Materials

In order to conduct analysis for explaining deforestation risk in Brazilian bovine leather we draw on several datasets. Statistical data on annual slaughter were obtained from SIDRA, the publicly available database of the Brazilian Institute of Geography and Statistics (IBGE). The main source for leather production data was the Trimestral Research on Leather (Pesquisa Trimestral do Couro) by SIDRA. These data relate to the units of bovine hide received and reported directly by tanneries. Data on leather production were further enriched by information provided by the Centre for the Brazilian Tanning Industry (CICB). Data on deforestation were collected from the National Institute for Space Research (INPE), which since 1988 monitors the rate of deforestation within the Brazilian Legal Amazon (BLA) through its Legal Amazon Deforestation Monitoring Project (PRODES). Data within the period 2005–2016 were used for geospatial analysis for identifying deforestation risk surrounding slaughterhouses and tanneries. Additional data are extracted from MapBiomas on Area (hectares) coverage and land use data by biome, state and municipality from 1985 to 2017. Daily market prices of cattle were provided by the Centre for Advanced Studies in Applied Economics (Centro de Estudos Avançados em Economia Aplicada, CEPEA). Appendix B and Appendix C provide more details on the methodology used.
Additionally, primary data in the form of face-to-face interviews and observation notes were also drawn upon. These data were collected during an extended field visit of the first author in the Brazilian states of São Paulo, Pará, Mato Grosso, Mato Grosso do Sul and Rio Grande do Sul in May–July 2018. The interviewee selection followed snowball sampling and was based on a broad set of criteria, belonging to diverse stakeholder groups and formalized networks making sure to also include diverse and critical voices from civil society. Given the vast territory of Brazil, as well as the diversity and extensive number of stakeholders involved, we used a nonprobability sampling approach that allow covering those with important information power [51]. In total the field trip resulted in thirty-one face-to-face and eight videocall interviews that are analyzed and discussed extensively in Mammadova et al. [14]. Here these data are recalled for interpretative and contextual purposes and for filling gaps found in publicly available information and mostly representing the voices of the civil society. Due to privacy reasons the names of the respondents are kept anonymous and are reported in the references of this research as per citation in the text.

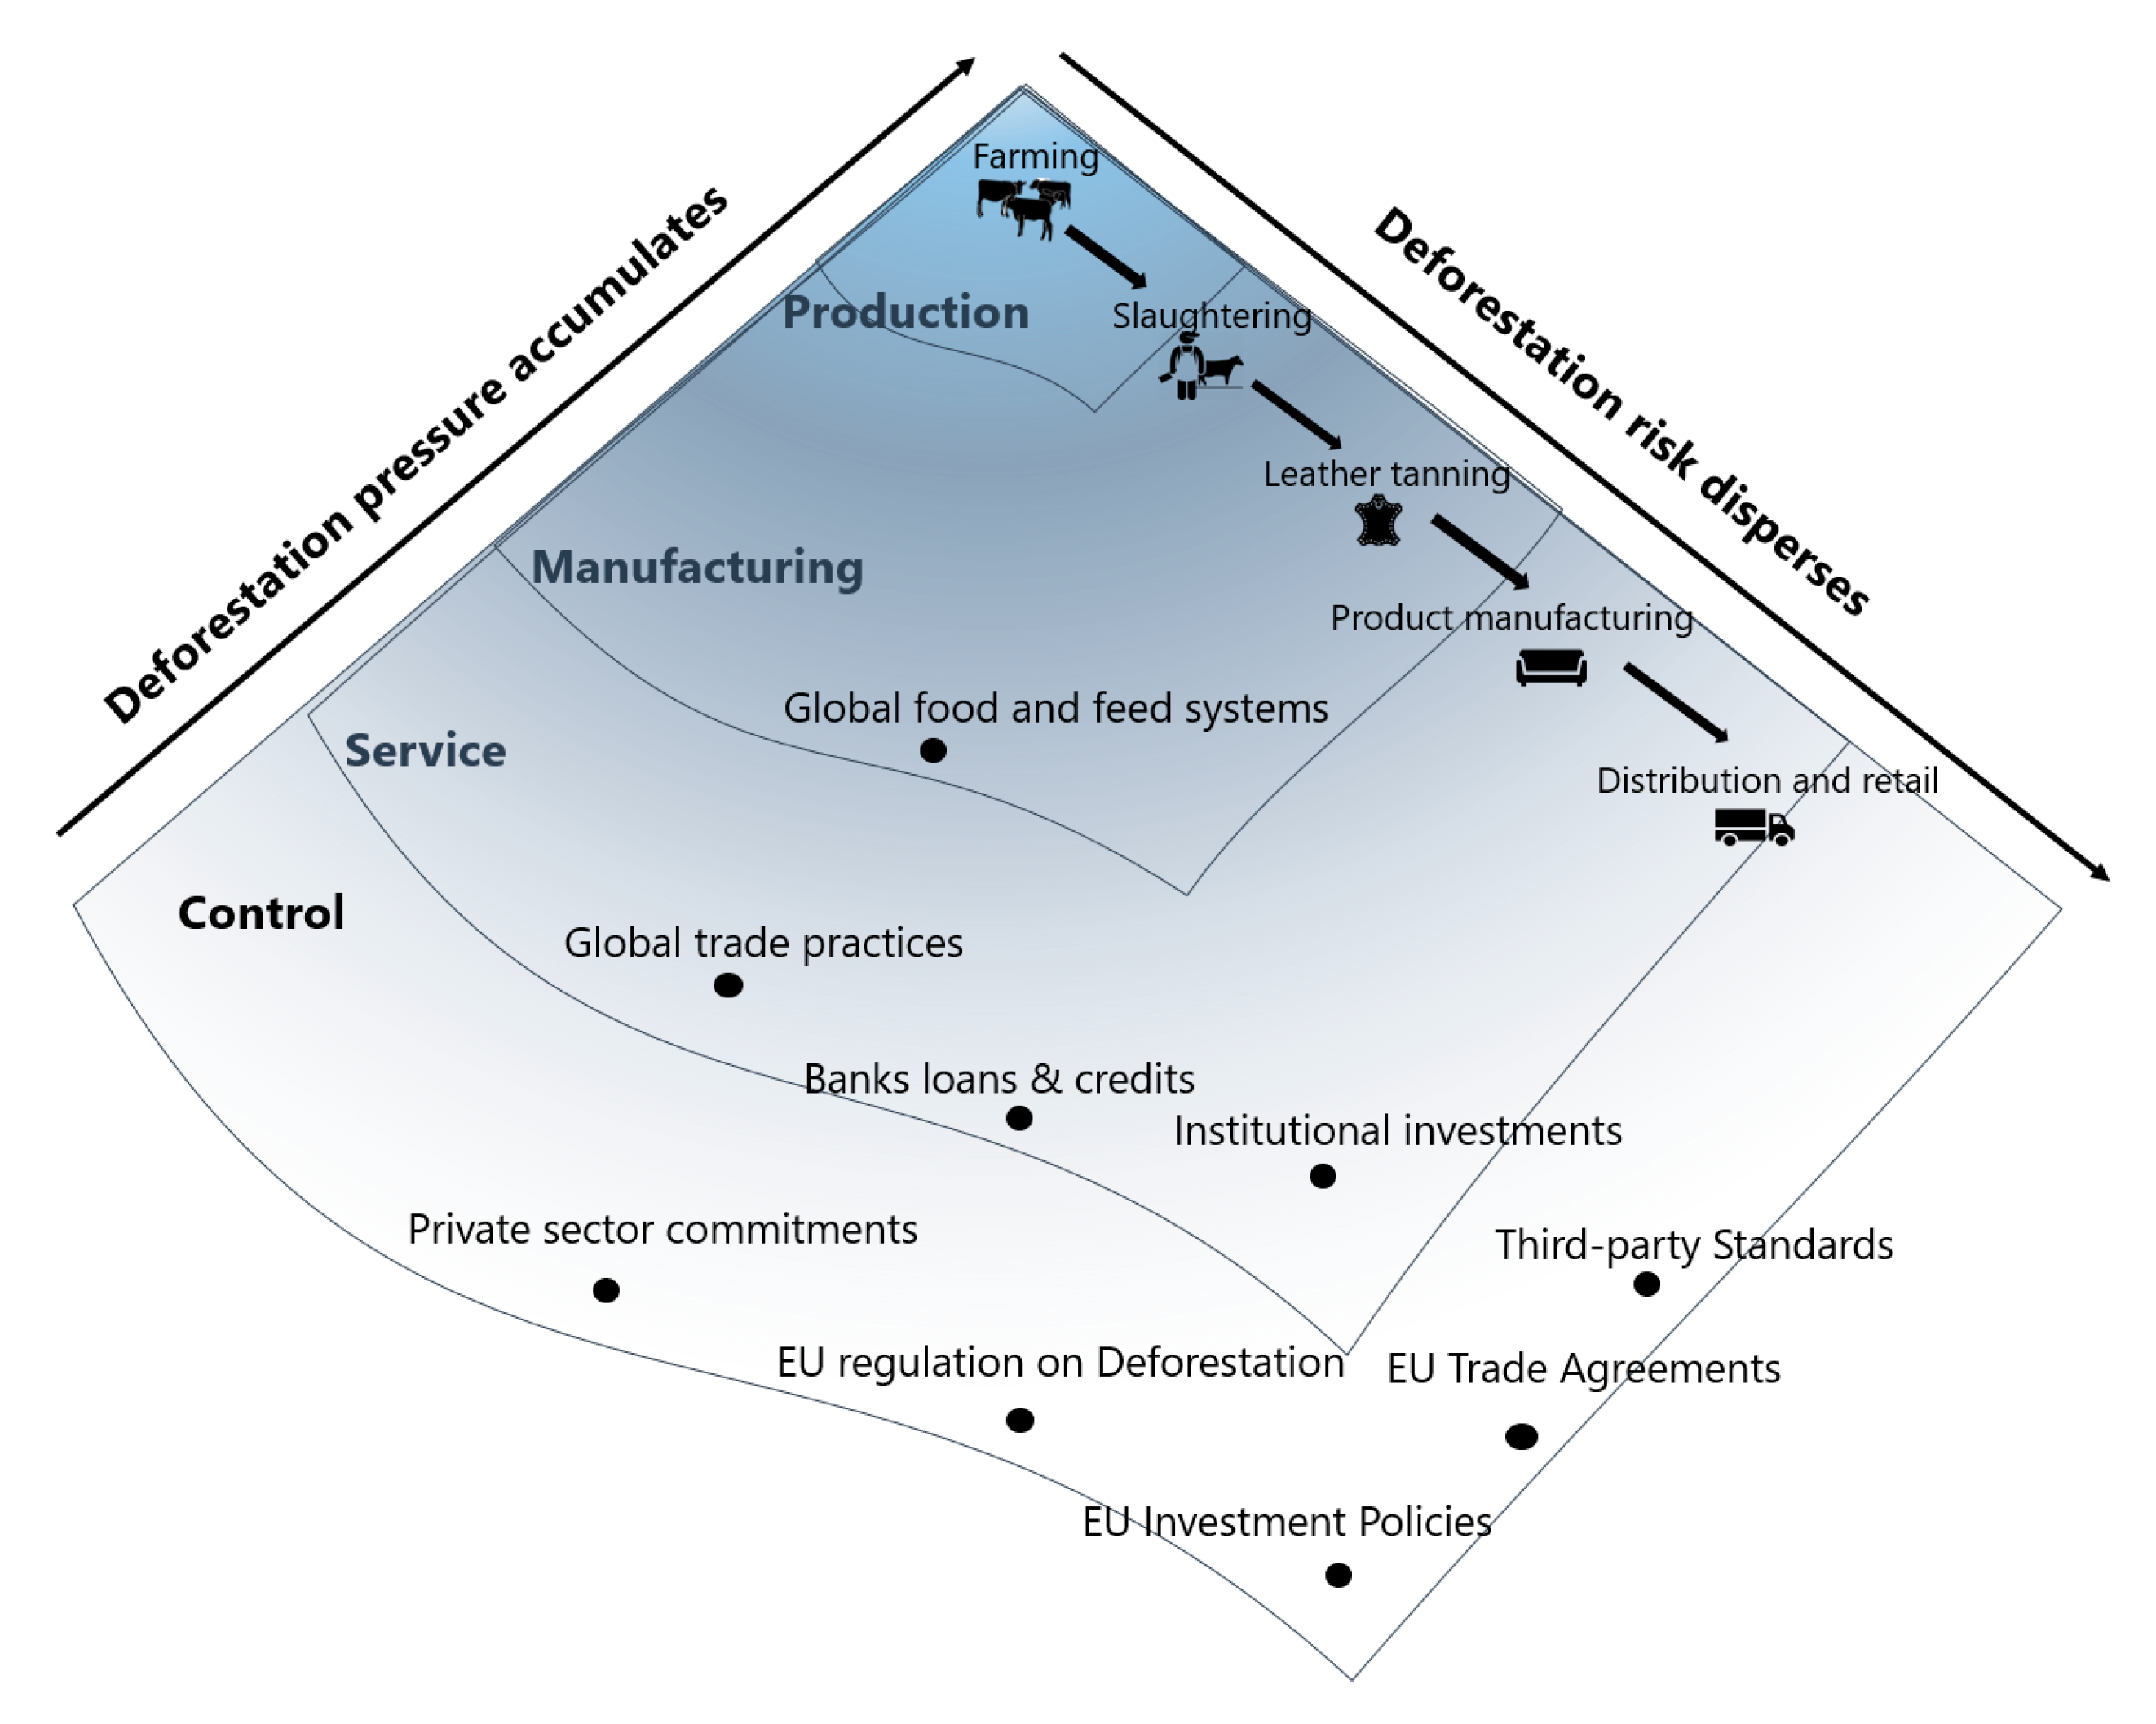
3. How Pressure for Deforestation Accumulates across Economic Sectors

Indirect pressures towards deforestation accumulate from the control sector towards the production sector. They are systemic and come from (a) paradigms, policies, regulations, regimes on agriculture, forest, trade and finance as part of the control sector; (b) global trade practices, institutional investments and shareholding, bank loans, etc. as part of the service sector; and (c) demand for raw materials as part of the manufacturing sector. Below we offer a description of the pressures in more detail, specified for leather.

3.1. Deforestation Pressures Coming from the Control Sector

As representatives of the control sector, global trade and investment policies and regulatory frameworks create “rules of the game” for how the rest of the economic sectors should function. They impact deforestation through two main pathways, either by putting forward the policies that are detrimental to forests, or by failure to adopt the policies and standards that protect forests. A good example is the EU trade and investment policy regime that focuses on creating “a level playing field so that EU investors abroad are not discriminated or mistreated” [52]. In practice, creating a level playing field often also means that strict environmental rules are neither included nor possible [28]. As a result, trade policies such as openness to trade have been studied by many as one of the conditions leading to negative environmental impacts such as deforestation. Ferreira [53] demonstrates that openness to trade impacts deforestation through many different channels: the quality of property rights, limited rule of law and bureaucratic quality in a producer country are among the most important channels that trade liberalization acts through and increase deforestation in a given country. Using data for 732 municipalities within the Brazilian Amazon from 2000 to 2010, Faria and Almeida [54] demonstrate how an increase in openness to trade in the Amazon also increased deforestation. Schmitz et al. [55] apply a spatially explicit economic land-use model to argue that by 2050 trade liberalization would lead to an expansion of deforestation in Amazonia due to comparative advantages of agriculture. In this context, the impacts of the Regional Trade Agreement (RTA) and Free Trade Agreements (FTA) are especially important. By focusing on RTAs on a panel of 189 countries from 2001 to 2012, Abman and Lundberg [56] found that a reduction of trade barriers led to significant increases in net deforestation especially in tropical countries, with cumulative effects of 19%–26% above the annual average three years after enactment.
Currently, additional pressures might be brought on Latin-American forests by the EU-Mercosur Trade Agreement (EMTA), which is being heavily discussed [28,57,58,59,60,61]. The European Commission and the Mercosur region agreed on a trade-agreement (EMTA) in June 2019, that focuses on removing trade barriers between the two regions. It aims to remove 93% of tariffs for Mercosur products in the EU markets benefiting largely the export of agricultural commodities. By using an advanced version of a Computable General Equilibrium model (GTAP-BIO), researchers based in IMAZON [59] estimated that the agreement could increase deforestation up to between 122–260 thousand ha in the Mercosur countries, according to six alternative scenarios. Around half of that deforestation (ranging from 45% to 66%) would happen in Brazil, affecting largely indigenous lands and conservation units in the states that already have high deforestation alerts. They estimate the future deforestation to take place mostly in Pará (39.9%), Rondônia (32.6%) and Mato Grosso (25.2%) in the Amazon biome and Maranhão (31.6%), Piauí (21.3%), and Bahia (20.4%) in Cerrado. The authors also argue that the current Trade and Sustainable Development Chapter (TSDC) of the treaty remains inadequate to address the environmental challenges and deforestation drivers faced in these countries, thus it will create a large systemic drive for increased deforestation [28,60].
Besides general trade and agriculture policies, we also discuss pressure coming from the control sector more specific to the case of leather. In 2018, the Brazilian government removed the protectionist 9% export duty levied on exports of raw hides and skins to Europe via Resolution no 65/2018 [62]. The EU tanning industry is heavily dependent on imported raw material and removal of the export duty creates more demand for Brazilian bovine hides by European manufacturers [62]. Brazil currently represents 17% of total EU imports of bovine raw hides and skins and wet blue and it is estimated to increase. As EMTA is argued to support further growth and specialization in agricultural production in MERCOSUR countries (as opposed to increase in industrial manufacturing in European countries), in the current context more agricultural expansion would translate into more land use change and deforestation.
International investment policies (specifically with relation to commodity production and trade) are causing deforestation pressure as well, often without receiving much attention. Global Canopy [63] shows that 63% of the 150 assessed financial companies do not have any deforestation policies and 81% (122/150) have not published a deforestation policy covering all four high-risk commodity groups. Baldock et al. [64] demonstrates that up until now Exchange-traded fund (ETF) sponsors have not structured instruments explicitly to exclude equities linked to deforestation, and that a link to deforestation is not one of the rules-based factors considered when including a company’s stock in an index. NYDF Assessment partners also report about a lack of transparency in how and whether financial institutions and international donors avoid investments with high forest risks [65]. Recently, more than 30 financial institutions representing more than $8.7 trillion in assets under management have made a commitment to tackle deforestation during UNFCC COP26 [66]. However, these commitments still need to be translated into concrete policies and actions by those institutions.

3.2. The Deforestation Pressures Coming from Service Sector

After the control sector, the service sector puts further pressure to deforest. Global trade and investment practices (that operate within the framework of set policies and strategies discussed above) to supply the world markets tend to support deforestation being “displaced” from one region to another, thus allowing us to infer a causal relation between increased trade and increased deforestation on a global level. Using satellite-based estimates of forest loss from 2000 to 2005, DeFries et al. [30] show that forest loss is positively correlated with exports of agricultural products (and urban population growth). Cuypers et al. [26] estimate that, within the period 1990–2008, the EU has contributed to 10% of global deforestation as it imported and consumed 36% of crops and livestock products associated with deforestation in the countries of origin. Leblois et al. [67] estimate that the international agricultural trade has driven more deforestation in the developing countries with large forest cover. Pendrill et al. [7] estimate that around 29%–39% of deforestation-related emissions in 2010–2014, as part of the carbon footprint of forest-risk commodities, such as beef and oilseeds, are driven by international trade. In another study, Pendrill et al. [68] show that the countries that were either slowing deforestation rates or even increasing forest cover on their territories in 2005–2013 are also the ones that import most of the products with embedded deforestation from somewhere else. According to their estimates a large (26%) share of deforestation was attributed to international demand, 87% of which was exported to countries in Europe and Asia (China, India and Russia). Thus, global trade of main agricultural commodities is an important driver, despite the relatively higher role played by domestic consumption of some of these commodities (e.g., 70%–80% of Brazilian beef is consumed in the domestic market) [15,55,68].
Besides the direct deforestation impact of increased commodity exports, the way global trade and demand act as complex deforestation pressures in producing countries can be explained via two specific channels as well. First, there is indirect pressure for deforestation by displacement of that pressure from one commodity to another. For example, Brazilian soybeans, besides being a major forest-risk commodity due to direct conversion of forest area to soy production, can also be identified as a commodity with indirect deforestation risk towards other commodities: studies suggest that growing demand for soy products in importing countries makes soy production relatively more profitable compared to cattle ranching in Brazil [69,70]. This helps consolidation of croplands in the hands of large-scale industrial producers and leads to high opportunity cost of soy production and rent-seeking behavior of actors in the Cerrado biome who gradually replace the pasturelands in the area with soy fields. This process has continued to push the deforestation frontier for cattle production towards the Amazon biome [69,71,72,73,74,75,76,77]. In this case, although cattle raising is an immediate economic activity right after logging activities or clear-cut deforestation, the underlying cause of the land use change is soy demand by importing countries. This indirect pressure for deforestation creates specific challenges, for example how to measure the success of the Soy Moratorium in Brazil since 2006 [77,78].
A second channel of deforestation pressure is through global feed systems. For example, the European poultry and livestock production sector largely relies on plant-based feed, mostly derived from soybeans. Widespread foot and mouth disease (FMD) in Europe in the beginning of 2001 led to this high demand for soybeans from Latin America as a cheaper and safer source of animal feed. Among Latin American countries, Brazil supplies around 15% of the production volume of soybean to the world markets and provided around 36% of EU soybean imports in 2017 [79]. Increased soybean production has led to significant deforestation and land conversion in the Maranhão, Tocantins, Piauí and Bahia (MATOPIBA), Mato Grosso and Pará states of Brazil, as well as in the Gran Chaco region of Paraguay and Argentina [80,81]. Thus, although European livestock and poultry production does not directly require conversion of large forest areas, a significant share of deforestation can be attributed to their supply chains through feed systems.
Investment practices of international banks and asset managers also drive deforestation, as they invest in the companies that engage in environmentally destructive activities in sensitive ecosystems. The companies involved in deforestation to produce commodities are able to secure financing at commercially attractive rates from banks in the United States of America (USA), European Union (EU) and Asia and this financing keeps the production through deforestation as an attractive and profitable business. Global Witness [82] calculates that between 2013 and 2019, producer companies implicated in deforestation were backed with $44 billion by over 300 investment firms, banks and pension funds across the globe. In another analysis, the researchers from Planet Tracker show how exchange traded funds (ETF), equity investors, mutual funds, and index investors all indirectly enable deforestation as their investment supports the capital stock of companies linked to land use change. They identify USD 9.3 billion held by ETFs in the companies linked to agriculture-driven deforestation (e.g., JBS, Minerva, Marfrig, etc.). The top 10 investors in these ETFs include names such as Bank of Montreal, Bank of America, Morgan Stanley, BlackRock, Goldman Sachs, etc. [64].
Foreign direct investments (FDI) are another indirect financial driver of deforestation and forest degradation. In terms of FDI by EU, Brazil has the largest share among all Latin American countries (48.5% of total European FDI for Latin America and 81% for Mercosur in 2015) and was the first one (4.3%) in EU-28′s offshore outward stocks of FDI at the end of 2017 [83,84,85]. In terms of net revenue by sector, in Brazil the leading sectors with companies holding EU capital are “Retail trade” and “Food and beverages” [83]. “Food and tobacco” is also the sector that created the most jobs in the EU through Brazilian FDI in 2006–2015. For example, more than 86.7% of these jobs are related to eight expansion projects of the company Marfrig in France and the UK between 2008 and 2015 [83]. Marfrig is one of the companies whose name has been repeatedly implicated in deforestation related scandals in Brazil previously and is estimated to source from recently deforested areas as well [86].

3.3. Deforestation Pressures Coming from the Manufacturing Sector

Pressures for deforestation become ever more salient when moving from the control and service to the manufacturing sector. This sector uses the raw materials that result from extraction/production to produce value-added and processed products. The constant growing demand for raw materials by the manufacturing sector puts pressure on the production sector to produce and extract increasingly more. It is estimated that in this decade (2020–2029) the increase in global demand for agricultural products will further pressure the agricultural sector to increase production. Most of that production growth is expected to happen in Asia-Pacific (17%) and Latin America (15%) to maintain the processing for human use, animal feed and biofuels [87].
Leather manufacturing is a multi-billion global sector. Around 65% of global leather manufacturing is sourced from bovine (cattle). Within the EU, the leather and related goods sector comprises about 36,000 enterprises and generates a turnover of €48 billion annually [88]. It is estimated that in Europe the leather exported from Brazil is used mainly in the automotive, upholstery and in the footwear sectors. A recent investigation by Rainforest Investigations Network also shows how car manufacturers around the world, and particularly in the USA such as General Motors, Ford, and Volkswagen, are dependent on the leather originating from Brazil [89]. Within Brazil itself, the main sector that demands bovine leather is footwear. All of these sectors still heavily depend on animal leather and create constant demand for raw materials, thus more cattle raising. However, the direct deforestation footprint of demand for raw Brazilian bovine hides still needs to be estimated.

3.4. Accumulated Pressure in the Production Sector: An Anchor Point?

The systemic pressure that indirect drivers from manufacturing, service and control sectors exerts towards the production sector keep this sector in a system that rewards environmentally destructive behavior and deforestation. It is this and other systemic pressures that makes land without trees more profitable than land with standing trees, in other words these sectors pressure towards deforestation. As long as markets respond to profit-making with disregard to the impacts they generate, the production sector will continue directly driving deforestation. However, the opposite also holds true–as long as the production sector continues producing cheap and unsustainable materials available in large quantities, there would be very little incentive by the users of these materials to look for alternatives. This demonstrates how economic sectors operate in constant feedback loops with each other within as system that favors environmental destruction. To complicate matters further, the following section will illustrate that traceability of deforestation risk quickly disperses when moving from one sector to another and that current methodologies to trace it, even while having improved enormously in the last decade, still appear to be insufficient in practice for certain production systems to address the drivers of deforestation.

4. How Traceability of Deforestation Risk Disperses across Supply Chains and Economic Sectors

By presenting the Brazilian leather supply chain below we point out different dimensions where deforestation risk is identified and how it concretely disperses when we move away from the production sector. A typical Brazilian bovine leather supply chain consists of cattle farming, slaughtering, leather tanning, leather product manufacturing, distribution, retail and consumer use stages (For more detailed discussion on the supply chain of the Brazilian bovine leather see Appendix A). We present different sections of the supply chain by situating them within economic sectors.

4.1. Dispersal of Deforestation Risk at Production Level. Farms and Slaughterhouses

Cropland and cattle-pasture-driven deforestation in Brazil has been addressed in various research since the 1990s [8,11,19,30,42,76,90,91,92,93]. More recently, Zu Ermgassen et al. [15] identified 480,000 to 520,000 ha/year of cattle-associated deforestation risk between 2015 and 2017 across all Brazilian biomes, with 73,000 to 74,700 ha/year deforestation risk linked to cattle exports. In addition to peer-reviewed research, geospatial mapping and other types of data analysis conducted by Brazil-based institutions provide a plethora of evidence for the direct correlation between commodity production and land use conversion. For example, recent data by Mapbiomas [94] suggest that 40.8 Mha of net native vegetation has been lost between 1985 and 2017 in the Amazon biome, which equals around the same area of net gain in pastureland in the same period. Government and private interventions have reduced deforestation in the Legal Amazon during 2004–2015. Eliminating the remaining 500–600,000 ha average annual deforestation in the following years became much more challenging [42,95]. Since 2016, deforestation estimates are again on the rise, reaching around 1200,000 ha in 2021 [96]. The majority of the accumulated annual deforestation has happened in the current deforestation frontier states of Pará (PA) (34.46%), Mato Grosso (MT) (32.34%) and Rondônia (RO) (13.76%), accounting for around 80% of the deforestation within Legal Amazon in general [96].
While deforestation of 20% of a privately-owned property in the Amazon is legal under the Brazilian Forest Code, illegal deforestation is commonplace for cattle rearing or other agricultural activities [4]. Most of the illegal deforestation in the frontiers happen on public lands through land speculation, with the hands of small or medium producers controlled by powerful actors located further away and dispersing their own involvement in the deforestation [23,24,95]. These producers are usually characterized by unofficial engagement in a system–they are indirect farms suppling cattle to first-tier farms that are directly controlled by slaughterhouse traceability systems. In 2009 the Term for Commitment to Adjustment of Conduct (TAC) that were signed among big meatpackers (JBS, Marfrig, and Minerva) and Public Prosecution Service (Ministério Público Federal, MPF) as well as private traceability systems of slaughterhouses to stop purchasing from properties with illegal deforestation cover only the transactions with direct supplying (fattening) farms.
In the majority of cases, slaughterhouses have access to the Animal Transport Guide (GTA) (electronic guide for the movement of animals for interstate transportation and federally inspected establishments) of the farms that they directly engage in the transaction. The GTAs do not track individual heads of animals and many states still use paper-based systems. Thus, in the beginning of the supply chain where informal transactions still prevail, GTA falsification is a well-known phenomenon [19,97]. Mobility of cattle that makes farm-to-farm transactions easy also increases deforestation risk. This attribute of mobility allows the risk of laundering animals from illegal farms to legal ones, moving cattle away from a farm during audits by authorities and benefiting from informal transactions among farms, especially in the frontier states where the government control is very weak [98]. The leakage and laundering of illegal cattle to legal supply chains is well documented in Gibbs et al. [18] and Barreto et al. [19].
Besides farm level risks, deforestation risks associated with slaughterhouses and their suppliers has been quantified by using spatial analyses based on slaughterhouse locations. A detailed analysis of the past and future deforestation risk linked to cattle farming and location of slaughterhouses in the state of Pará can be found in Barreto et al. [19]. The authors have produced maps matching buying zones of slaughterhouses with areas both already deforested and with the risk of further deforestation. They found that the potential buying zones for the 99 major meat-packing plants in Pará overlap with about 90% of the areas at greater risk for deforestation from 2016–2018 (of a total of 1.68 Mha of forests). According to Barreto et al. [99], up until 2017, 79 slaughterhouses possessing 70% of slaughter capacity of the region have signed TACs. Although TACs contributed to the reduction of the deforestation in the region for a while, weak law enforcement soon compromised their effects [100]. The 2018 audits by the Federal Public Prosecution Service (Ministério Público Federal, MPF) of Pará show that the slaughterhouses with TACs continue sourcing from illegal farms embargoed by IBAMA [101,102]. Besides, according to Barreto et al. [96], 30% of slaughter capacity in the region is still with the meatpackers without TAC. These slaughterhouses create a significant risk of leakage as meat and leather produced in these slaughterhouses are transferred to supply chains of slaughterhouses who signed zero deforestation commitments [18,99]. In March and April 2018 MPF asked IBAMA to inspect 56 slaughterhouses without TACs that were suspected in illegalities and buying from embargoed zones (excepting one slaughterhouse with a TAC in the state of Pará) [101,103]. Around 80% of embargoed farms by IBAMA fall into potential buying zones of 56 slaughterhouses without TACs [99].

4.2. Dispersal of Deforestation Risk at Manufacturing Level: Leather Tanneries and Product Manufacturers

Slaughterhouses in Brazil are categorized based on Federal Inspection Service (Serviço de Inspeção Federal (SIF)), State Inspection Service (Serviço de Inspeção Estadual (SIE)) and Municipal Inspection Service (Serviço de Inspeção Municipal (SIM)). Only slaughterhouse under SIF are able to export internationally. While beef supply chains are checked for legality based on SIF, SIE and SIM inspection systems and TAC agreements, the same does not apply for animal hides. Thus, as a general rule, animal hides either from SIF, SIE and SIM slaughterhouses and those with and without TACs can be transported to tanneries where this type of classification is not required for leather to be destined for internal market or exports. The vertical integration—a strategy when a company owns or controls its suppliers, distributors or/and retailers-between tanneries and SIF slaughterhouses under a same private entity (e.g., in the cases of business groups like JBS or Marfrig)-helps with internal traceability to a certain extent, but this traceability information is not necessarily shared with general public [104]. For instance, in 2017, pooling registered information from a number of sources [105,106,107,108] we found 22 tanneries within the BLA, from which at least seven appeared to be direct JBS subsidiaries (Appendix C). In 2018 around 72% of all raw hides processed in Brazilian tanneries and around 81% of all the raw hides processed in BLA are sourced directly from federal slaughterhouses [108]. While not conclusive, such data suggest a high degree of vertical integration between tanneries and slaughterhouses in BLA.
We carried out an analysis for tannery locations, comparable to the analysis by Barreto et al. [19,109], discussed above, on slaughterhouse proximity to deforested land, which helps us exemplify how deforestation risk rapidly disperses at the tannery level of the supply chain when using this kind of analysis (for more details, check Appendix B). The geospatial analysis (Figure 2) showed that from 2005 to 2016, 44.8% of deforestation occurred within a 100 km radius from slaughterhouses (n83 SIF facilities), compared to only 10.8% within the same radius from tanneries (n22). The lower percentage of deforestation associated with tannery locations can be explained with the fact that it is easier to carry animal hides after slaughter (compared to live cattle) and that the tanneries in the BLA region are not located in direct proximity from where cattle is raised/slaughtered. This analysis shows that the methodologies used for estimating deforestation risk associated with farm and slaughterhouse locations (production sector) might not work well for tannery locations (leather manufacturing). While proximity to slaughterhouses is known to influence pasture formation [19,91], such a relationship for tanneries is not established. The discrepancy would be even higher if SIE and SIM facilities were considered. While questions remain regarding to what extent such a limited number of tanneries process volumes coming from multiple slaughterhouses, the comparison between slaughterhouses and tanneries already make clear that the deforestation risk disperses even within the BLA when using such simplified spatial analysis. Further details of the data sources and methodology used for the risk analysis can be found in the Appendix B and Appendix C [109].
While deforestation risk is harder to trace for tanneries than for slaughterhouses at a geographic scale, tanneries have a close connection to slaughterhouses and the tanneries operating in the BLA region also receive leather from slaughterhouses under SIE and SIM registration without public traceability agreements. They are, thus, at higher risk of receiving raw materials from bovines raised on deforested land. Accordingly, unless geographic methodologies used for the assessment of deforestation risk based on tannery locations are employed in combination with other methodologies, this kind of analysis can give only a very limited clue about deforestation risk at the tanning stage, dispersing the risk further and distancing from responsibility.
Geographical analysis can be supplemented with supply chain traceability information to understand the deforestation risk traveling towards leather processing. However, traceability of leather carries certain challenges. Although animals can be traced throughout the farming process (either through fire branding or ear tag systems) that level of traceability is lost once the animals enter the slaughterhouse. The traceability at the slaughterhouse level, in the best-case scenario, is based on daily purchase information indicating the name of a supplying farm, number of purchased cattle, and so on. This information is transmitted through Animal Transport Guide (GTA) by a farmer to a slaughterhouse. Once an animal is slaughtered, the physical traceability of an animal hide (if in place) only starts at a first instance receiving tannery. This traceability is usually based on a branded code (laser marking or physical stamping) on the corner of a hide indicating date of purchase, slaughterhouse ID and the number of a batch [110]. Depending on leather manufacturing and splitting processes the code bears the risk of loss or fading away along the way. Tracing the origin of leather in manufactured products (i.e., shoes) that are not made of leather entirely but use it as part of their assembly is much more complicated, dispersing further the traceability of the deforestation risk. The inconsistency of traceability tools and the passed-on information from farm to manufacturing (e.g., ear tags, fire marks, bar code stamps) make the whole chain fragmented and hard to keep track of, also for associated deforestation.

4.3. Dispersal of Deforestation Risk at Trade Level: Distribution and Retail

Data on interstate trade of animal hides and leather within Brazil is another relevant focus point for deforestation risk. Observations and information shared during personal communications with the stakeholders during field visits in 2018, indicate intense trade on leather between deforestation frontier states and the rest of the country [111,112]. The tanneries located in the frontier states (that are usually near slaughterhouses) are specialized in the initial stages of leather treatment from raw hides till semi-processed (e.g., wet blue) [111,112,113,114,115,116]. Long distance transportation of leather in salted and semi-processed (e.g., wet blue) stages is also more convenient due to diverse technical and logistical reasons [117]. If not directly exported to foreign countries, semi-processed leather originating from BLA states is transported to southern and south-eastern states of Brazil where leather tanning and manufacturing has historically been an important economic activity and where know-how and tannery associations also concentrate. Leather of BLA origin gains value-added through processing in the finishing tanneries in other states.
It could be possible to understand the extent of interstate trade by following tax declarations collected electronically by the State secretaries and the Ministry of Economy (Ministério da Fazenda). However, tax information is considered strictly confidential and not available to public access. Instead, analysis of publicly available data by IBGE can help to make inferences about the extent of the interstate transactions. For example, the comparison of total slaughter per state and the quantity of tanned (wet blue stage) leather received by tanneries in the states for the year 2018 shows major differences between the two, especially in southern states such as Parana (133%), Rio Grande do Sul (59%), Mato Grosso do Sul (36%) and São Paulo (34%) (Figure 3). We interpret these differences as potential volume of semi-processed leather transported from the frontier BLA states for further processing and finishing in southern states where the leather industry is more specialized. Although it does not provide quantified evidence for transactions, we can infer that leather that is being processed further in non-BLA states carry substantial deforestation risk which is not considered in industry standards.
According to The Centre for the Brazilian Tanning Industry (CICB) [118] around 80% of the production value of Brazilian bovine hides and leather are exported while 20% is manufactured within the country. Assessment of deforestation risk in trade and global markets beyond the national borders of Brazil necessitates looking closely at the individual transactions between trading partners classified according to the Harmonized System (HS) codes of manufactured commodity groups that use leather. Semi-processed leather (HS 4104) is either exported directly from BLA states to other countries or sent southwards to the other Brazilian states where most of the infrastructure for further processing is located. Due to the above-mentioned interstate trade and difficulty in accessing data on these types of transactions, the extent of the deforestation risk in the Brazilian exports of bovine leather is difficult to quantify. The exports to other countries originating from southern states such as Rio Grande do Sul or Santa Catarina have deforestation risk embedded in the supply chain but difficult to trace. Depending on the granularity of the analysis, i.e., whether the national, state, municipality or importer-exporter level data are analyzed, the visibility of deforestation risk can differ. An elaborate discussion on deforestation risk traced in exported bovine leather from Brazil to Italy can be found Mammadova et al. [119].

4.4. Dispersal of Deforestation Risk in Control Sector

As global trade and consumption disperses the deforestation risk associated with leather further, it becomes almost invisible in investments, trade and related policies and standards. In terms of policies and standards, in European policy documents the discussion on deforestation risk has mostly focused on beef or cattle as a unit of analysis [26]. Bovine leather in most of the cases is not even acknowledged as a product of cattle that is exposed to the same level of deforestation risk as beef or other meat cuts. For example, the draft version of the otherwise progressive EU Regulation on Deforestation-free Products also focused on beef supply chains (along with six other commodities) and leather was included in the second draft only after public backlash.
Besides EU regulations, the risk is dispersed even further in industry policies and standards. For example, the origin of the leather and its traceability can get lost once it reaches other countries in a semi-processed form such as at wet blue stage (HS 4104), which according to the industry standards can be declared as leather made in that particular country (e.g., leather made in Italy) after certain final processing (ICEC, 2019) [120]. This is similar to how Bresaola della Valtellina (the Italian air-dried, salted beef) carries Protected Geographical Indication (PGI) label indicating Italian origin from Sondrio Province in the Lombardy Region but is prepared mainly from Brazilian and Argentinian beef. This is because the PGI label can be obtained if at least one of the production steps takes place in a defined geographical area [121].
Furthermore, as part of the initiative Single Market for Green Products, in 2018 the European Commission finalized the Product Environmental Footprint Category Rules (PEFCRs) for leather with the aim to provide a reference framework to be used by the industries to assess and declare the environmental footprint of finished leather. PEFCR relies on life cycle analysis approach and are used for preparing Environmental Product Declarations (EPD) or Type III environmental labels [122]. PEFCR uses 16 different environmental impact categories and their indicators applicable to the farm level, ranging from freshwater eutrophication to ozone depletion. The guide allocates 88% of farm level upstream impacts to dairy production and 12% to meat production, while leather production is assigned only less than 0.4% of the upstream impacts [122]. Land use, an impact category that is most relevant for the purpose of this study, is one out of 16 impact categories, meaning its share within 0.4% is quite insignificant. This shows that different methodologies, such as Life Cycle Assessment that is the basis for PEFCR analysis and serves as reference for industries, can also act as a tool for further dispersing the deforestation risk away from the actors in downstream leather markets.
It is argued that neither the top five European car manufacturers nor the five most important Italian leather manufacturers supplying the European automotive industry have adequate policies and systems in place to address deforestation in the supply chain [123]. Partly responsible for this are industry-led studies that tend to argue that animal hides are waste product of dairy and meat producing processes [122,124]. Such studies refer to treated hides and leather as recovered waste (or by-product). The long-lasting efforts of the leather industry to define leather as waste and to codify it as such in important policy documents is essential for reputation management, avoidance of important upstream sustainability risks, and having the regulatory justification for doing so. Qualifying leather as a waste product moreover implies starting system boundaries for life cycle analysis (which is the basis for industry-led standards) at the slaughterhouse as a point where animal hide is “produced” for the first time. This means shifting the responsibility for all upstream environmental impacts to dairy and meat production (thus, zero allocation for leather production).

5. Discussion

The above analyses of deforestation pressures and deforestation risk make visible how production, processing, trade, investment practices and policies across the globe contribute to deforestation elsewhere. There are certain limitations to our arguments, as in this research we do not directly account for country and local level indirect drivers of deforestation (e.g., urbanization, land-speculation, weak governance, etc.). Besides, studies show that more than half of deforestation emissions attributed to agricultural and forestry production can be destined for domestic consumption, putting the role of international markets into perspective [7]. Thus, the demand side measures put in place in importing countries should complement supply side measures in producing countries.

5.1. Deforestation As Embedded in All Economic Sectors

The research methodologies for understanding deforestation drivers are diverse, yet most maintain a narrow focus by employing primarily data on production areas or commodity supply chains. The most common methodology to focus on production areas is the utilization of spatial data on forest cover and subsequent land use change by weighing in different variables such as accessibility and vulnerability [125,126,127]. Examples include Global Forest Watch Pro that matches geospatial data over forest change, land cover and land use to estimate the deforestation driven by major commodity productions [128]. The Atlas of Deforestation by CIFOR helps to track deforestation based on land use change linked to palm-oil plantations [129].
Many advances have been made over recent years to understand deforestation drivers beyond the production sector. The TRASE initiative, based on the Spatially Explicit Information on Production to Consumption Systems (SEI-PCS) approach first suggested by Godar et al. [130] connects the sub-national location of production (municipality level) to consumption (domestic and international) patterns. Pendrill et al. [68] suggest a land-balance model quantifying deforestation linked to the production of major deforestation risk commodities at a country level and tracing it to the countries of consumption using physical country-to-country trade estimates. A challenge that remains is that the majority of existing research methodologies fall short in demonstrating that land was deforested because of any one crop or cattle, but only that they were planted or raised in an area that was deforested [3]. The methodology suggested by Zu Ermgassen et al. [15] partly addresses this challenge by differentiating deforestation motivated by cattle production from the one driven by land speculation, through identifying the direct economic activities in the territory within the immediate five years after the forest clearance.
The studies that focus on trade-driven deforestation help demonstrate that deforestation is not only an act of producers in tropical countries, but also those actors implicated in international trade [6,33,68]. The similar methodologies can be developed to allocate a certain share of deforestation to actors and processes in finance and in policy-making, to make the hidden deforestation pressures more visible and quantifiable. If developed, these methodologies can increase the share of responsibility of international markets and actors going beyond current estimations.

5.2. Dispersal of Deforestation Risk As a Systemic Quality

In current literature deforestation is very rarely defined as a systemic risk embedded in the whole economic system. Most of the studies rely on supply chain and trade analysis and take deforestation as traceable risk across nodes of the supply chain, usually with a strong focus on those nodes situated in the production sector of the economy. Our analysis nonetheless shows that deforestation risk is systemic, it is embedded in all economic sectors even if not traceable, as traceability ends with the flow of physical materials. Being a term only used more recently, embedded deforestation lacks proper conceptualization and assessment methodologies agreed upon by the scientific community.
By presenting the case of Brazilian bovine leather we described how deforestation risk that is very visible in the production stage of a commodity can disperse when moving across different stages of the supply chains and the economic sectors these are part of those supply chains. Purchasing a cow in the state of Pará of Brazil or a leather bag in the streets of Milan has different levels of perception and traceability of the risk, despite the possibility of being controlled by the same actors, connected through the same supply chain and possible deforestation. Bovine leather is emblematic for how deforestation risk disperses, as the dispersal already starts at the production stage. The interstate leather trade within Brazil adds a significant layer of complexity and dispersal of the risk and makes the leather exports originating from the Southern states to be susceptible to the risk of Amazonian deforestation. The dispersal of deforestation risk, as we see so clearly in the leather supply chain, disincentivizes action to address deforestation and make invisible the deforestation embedded in products. Instead, we argue for considering a perspective of that considered deforestation risk as embedded in all part of the supply chain (and the economic sectors it is situated in). Doing so will require not only producers, but also traders, manufacturers and investors to take responsibility for upstream impacts such as land use change for cattle ranching, or animal welfare issues. Making deforestation risk visible as embedded in all economic activities is nonetheless a challenge, as major sustainability standards and due-diligence requirements (also as part of the new legislation) all take deforestation risk as only relevant to traders and operators and as a result create distance between farm level impacts and the leather supply chain. For the deforestation risk of leather to be taken as embedded in all economic sectors and commodity supply chains, the waste product narrative moreover needs to be abandoned.
There are ongoing attempts to advance traceability of deforestation risk across supply chains but they still face many challenges [46,49,50]. These challenges are either linked to (a) availability of supply chain data, the technological applications and non-comparable data units across supply chains, (b) the number and motives of the actors involved in the system (involvement of intermediaries, corruption, etc.); (c) or unfair distribution of costs and benefits of sustainability [14]. In this research we argue that traceability of deforestation risk across supply chains is problematic also because dispersal of deforestation risk has become a structural quality of our economic system and it is unavoidable. Despite the advances in traceability solutions the risk of laundry and leakage across supply chains remains as a systemic problem, making policy approaches that rely only on supply chain data and traceability ineffective in the long run. This dispersal of the risk increases even more when moving away from direct supply chain actors to non-market ones (i.e., financiers, policy-makers, etc.), as supply chains are situated within economic sectors. Thus, the attempts to maximize technologies, traceability systems and data on environmental risks along supply chains should not serve as an end goal, but remain complementary to those that remove systemic pressures to deforest and destroy nature, creating the case for ’strong sustainability’ [131]. We argue that by acknowledging deforestation as an embedded systemic risk that travels and disperses along economic sectors more broadly, we could identify important leverage points and policy gaps, and better inform understanding of responsibilities by governments and industries.

6. Conclusions

The EU’s Forest Law Enforcement, Governance and Trade (FLEGT) Action plan (2003), EU Timber Regulation, the Roadmap to step up EU action to combat deforestation and forest degradation, and the proposed EU Regulation on Deforestation-free Products are all necessary policy tools to address commodity-driven deforestation. They show the gradual acknowledgement of the role of consumer-country commodity demands in tropical deforestation, thus an acknowledgement of complexity. The attention in public debates on major deforestation risk commodities and agricultural production processes has been very helpful to identify major “culprits” of deforestation, to mobilize international efforts providing necessary guidance for policy makers, and to hold private businesses accountable for their impacts. The research and follow-up policy actions on major forest-risk commodities can be argued to be an important step on the road to achieve large-scale impact.
However, the suggested tools within these policy documents focus too strongly on a handful of individual supply chain solutions (including due diligence mechanisms for avoidance of entry of unsustainable commodities into EU markets) and on agricultural production through assistance and compensation (e.g., REDD+) [16,132,133,134]. Now is the time for more attention to the systemic (or indirect) drivers of deforestation that we identified in this research as embedded in all economic sectors. Similar to how the simplification and reduction of the value of the forests to carbon capturing sinks under REDD+ and other mechanisms received significant criticism [135,136,137], reducing the deforestation issue to the role of certain commodities is simplifying the issue too far, making zero deforestation commitments continue to struggle to make large-scale impact. The focus on a handful of commodities is limiting an international response, act as “fixes that fail” on symptoms of the problem, by creating the misleading assumption that private supply chain or production sector sustainability solutions are able to bring transformational change on their own [38,39,40,43,136,137,138,139,140,141,142]. This narrow focus also helps certain commodities escape the responsibility or remain in the shadow far too long, such as bovine leather that has been regarded as waste product despite the multi-billion-dollar value of the leather industry.
Indeed, previous experience in Brazil starting from 2009 shows that market interventions such as bans and restrictions on illegally produced products can serve as important leverage points [19,42]. Recent bans on Brazilian leather by famous brands such as Timberland, Vans and others also acted as an important market signal indicating intolerance of illegality and deforestation [143]. However, the success of these interventions to bring systemic and meaningful change on the ground is conditioned upon traceability of deforestation risk. As discussed in this paper, traceability systems are far from being perfect and dispersal of the risk is unavoidable in current economic system, in practice making it nearly impossible to guarantee global deforestation free supply chains due to launder and leakage. When the EU bans unsustainable products from entry to its market, this can be read as a response to what is (relatively) visible, feasible to trace, and readily manageable. The instruments that focus only on the production sector and supply chains see only the “tip of the iceberg” and may become what Abson et al. [40] call “shallow leverage points” to intervene in the system. In addition to “running after the culprits” once deforestation events happen, or restricting their access to EU markets, the EU countries should focus on preventive approaches such as reducing the pressures on the forests in the first place. Focusing on deforestation impacts brought by decisions and actions in finance, investments, trade and control sectors could become the starting point, as commodity-driven deforestation cannot be tackled alone without addressing these systemic drivers on the EU side. Thus, there is a need for a legislation, accountability checks and data transparency that cover those sectors too, besides the ones that focus on traceability of forest-risk commodities. Addressing these indirect drivers that make unsustainable production profitable could offer more impactful solutions that are transformative of our economic system in general [39,40,142].

Author Contributions

Conceptualization, A.M.; Formal analysis, A.M.; Methodology, A.M.; Supervision, J.B., M.M. and D.P.; Writing—original draft, A.M. and J.B.; Writing—review & editing, A.M., J.B., M.M. and D.P. All authors have read and agreed to the published version of the manuscript.

Funding

This research received no external funding.

Institutional Review Board Statement

Not applicable.

Informed Consent Statement

Not applicable.

Data Availability Statement

The data on personal correspondence presented in this study are not publicly available due to privacy and ethical reasons. Quantitative data are taken from publicly available databases and cited accordingly.

Acknowledgments

We thank Caroline Sartorato Silva França, a PhD candidate at Chalmers University for the review and contribution to this research, more specifically for conducting spatial analysis based on tannery and slaughterhouse locations discussed in Section 4.2. The original analysis is published as part of her master thesis submitted to TESAF department, University of Padova [109]. We would also like to thank respondents of personal communications during the first author’s visit to Brazil in 2018, for their interest in the topic and for the support in navigating through complexities of the frontiers.

Conflicts of Interest

The authors declare no conflict of interest.

Appendix A

Brief overview of leather production processes and supply chain.
A leather supply chain in Brazil theoretically starts at a farm level that includes direct sourcing and indirect farms. As a rule, cattle rearing goes through three main stages: breeding/calving, raising, and fattening (Portuguese cria, recria, engorda), until they are sold to a slaughterhouse (Figure A1). Nowadays an average slaughter age ranges between 24–36 months depending on the state of production and the sex of an animal. On average calves stay at the breeding farm for 7–8 months and then are sold at an average price of 402.29 US$ and a weight of 195.42 kg per calf (Nelore breed, reference year of 2020, São Paulo state) [144]. Cattle remain in raising farms for 8–12 months and are then sold to fattening farms. Depending on the feeding system, cattle can stay in fattening farms from 100 days (feed lots) up to six months (semi-feed lots and pasture) until reaching a weight of around 17 arrobas (roughly 250 kg). Raising and fattening operations in the Amazon region can be undertaken in the same farms (i.e., vertically integrated farms) [145,146]. Once fattened, the cattle are sold for an average price of 43.94 US$/arroba to a slaughterhouse (CEPEA/B3 Indicator, São Paulo state) [144].
Slaughterhouses represent the next level of the supply chain flow of leather. In 2016 the slaughter survey covered an average of 1191 slaughterhouses per trimester [147,148]. Of these, 198 were under the SIF (federal inspection system), 391 under the SIE (state inspection system) and 601 under the SIM (municipal inspection system), corresponding, respectively, to 78.0%, 16.7% and 5.3% of the accumulated weight of carcasses produced. Thus, despite the relatively low number of slaughterhouses under the SIF, most production happens within these facilities that can also export to international markets [15]. When considering the BLA, the proportion rate for SIF raises to 88.0%, while rates for SIE and SIM decrease accordingly to 9.3% and 2.7%, respectively [147]: this supports the previous analysis on the concentration of production and beef supply chains in SIF facilities in the BLA [15,146]. The bovine hides that result as a by-product of daily animal slaughter are piled together in a slaughterhouse. Depending on the proximity of the processing tanneries, the piles of hides can be pre-processed or salted already at the slaughterhouse for sanitary reasons and for allowing long-distance travel. This stage of treatment is generally referred to as a preservation process. [117].
Tanneries represent the next segment of supply chain flow of leather. Tannery level operations are complex and resource intensive and can be generally categorized as preservation (raw hide), pre-tanning (salted), tanning (mostly wet blue), post-tanning (crust) and finishing (finished leather) processes. As of 2017, there were approximately 153 registered tanneries operating in Brazil [148], despite the inherently dynamic nature of the figure. Our analysis found 22 tanneries that were located in BLA as of 2017 [105,108], and 15 of them were registered as exporting tanneries in 2018 [116]. Although the data on export share of individual tanneries are not being made public anymore, the registry information shows that majority of the tanneries located in BLA are specialized in the wet blue tanning process allowing the assumption that the further processing is being implemented in other states of Brazil [111,116].
Leather manufacturing and market distribution is the last segment of supply chain flow before a finished leather product reaches a final consumer. According to CICB [118] around 80% of production value of Brazilian bovine hides and leather are exported while 20% is manufactured within the country. The major final destination sectors of the exported Brazilian leather are upholstery (51%), followed by footwear (20.3%), furniture (20.7%) and leather goods (8%). Internal leather manufacturing is dominated by footwear (60%) [118].
Figure A1. Leather supply chain in Brazil and its different segments. Source: author’s own elaboration based on data taken from IBGE and CICB [113,118].
Forests 13 00233 g0a1

Appendix B

Data sources and collection methods for geospatial analysis, based on Sartorato [109].
Slaughterhouses. Only slaughterhouses under the SIF within the BLA were considered for the geospatial analysis. Data on the location of slaughterhouses were based on LAPIG data extracted in 2017 (Laboratório de Processamento de Imagens e Geoprocessamento) database [115]. The information available through LAPIG was cross-checked with the MAPA (Ministry of Livestock and Supply) database [107,149] where all information on operating slaughterhouses under SIF are available, including address, company name and processing capacity. An up-to-date data layer on the location of slaughterhouses was produced by locating new slaughterhouses (not yet available through LAPIG data) with Google Earth. All edits made were accurate to the municipal level. Please refer to Barreto et al. [19], zu Ermgassen et al. [15] and TRASE [150] for more up-to-date and complete databases across SIF, SIE and SIM systems for the entire Brazil.
Tanneries. Unlike slaughterhouses, tanneries do not have high sanitary requirements and are not closely monitored by the inspection system [49]. No readily available data including coordinates on the location of tanneries could be found. Thus, tanneries were located with Google Earth, using their addresses as retrieved from multiple sources, including the Brazilian Leather Guide [105], the Centre for the Brazilian Tanning Industry [106], the SIF database [107] and the Leather Working Group [108]. Addresses were checked across databases to ensure consistency in terms of municipality or the postal code zone. The same geospatial analysis applied to slaughterhouses was used for tanneries in order to allow comparisons despite the fact that transportation of hides are not under the same distance constraints when compared to live cattle.
Deforestation. Data on deforestation were gathered from PRODES project for the period from 2005 to 2016. This period was chosen due to data availability and cross-validation concerns. Data on deforestation were primarily collected directly from the PRODES database [96] but were also cross-checked with PRODES data made available via LAPIG [115] and Global Forest Watch [114]. The methodology used by PRODES has changed over the years and so did the consistency of data made available. Thus, careful consideration was needed when compiling deforestation statistics for the period. Most importantly, the deforestation polygons do not equal the deforestation rates published every year because the latter also incorporates estimates of the deforestation occurring under cloud covered scenes [96]. Aside from data availability and cross-validation concerns, 2005 is also used as a milestone in the literature [42]. 2005 marked the start of the “Plan for the Protection and Control of Deforestation in the Amazon” (PPCDAm), established in 2004, the year Brazil experienced the second highest rate of deforestation in its history (27,772 km2) [96]. It also marks the start of the 72% decline between 2004 and 2016 (84% decline from 2004 to 2012) in BLA deforestation rates [96]. The geospatial analysis was carried out in August 2017, thus 2016 was the latest year of consolidated data available.
Potential buying zones. Based on studies discussing animal transport to slaughterhouses and pre-slaughter management, a few parameters were extracted for the geospatial analysis [151,152,153]. Cattle transportation time can vary from 30 min to 15 h [153]. A transport above 15 h is considered unacceptable for animal welfare [152,154]. Long transport on inadequate roads is, in fact, increasingly avoided, as reflected in lower animal mortality [152]. A combination of losses due to mortality, lesions (which occur often in the prime cuts and need to be discarded) and the decreased quality due to stress and tiredness makes short distances preferable [151,152,153,154]. da Silva Frasão et al. [151] and Bertoloni et al. [152] use distances between 50 km and 250 km to evaluate different transport effects on cattle, suggesting these distances are the most common. Barreto [19], however, discuss their analysis based on average 360 km for SIF and 153 km for SIE registered slaughterhouses in the state of Pará. Personal interview with the representatives of a slaughterhouse in Marabá municipality in Pará in May 2018 revealed potential buying zones to range between 300–700 km depending on the municipality and market demand for beef. Based on this observation, a conservative radius of 100 km around slaughterhouses was used for the whole BLA when assessing deforestation in the proximity of these facilities.
The deforestation within 100 km of each slaughterhouse was computed for each year and further aggregated to provide a view of the whole decade. A geospatial risk was assigned for each slaughterhouse depending on the total deforestation within the 100 km radius. Quartiles were computed based on each slaughterhouse’s associated deforestation and slaughterhouses were classified as follows:
-
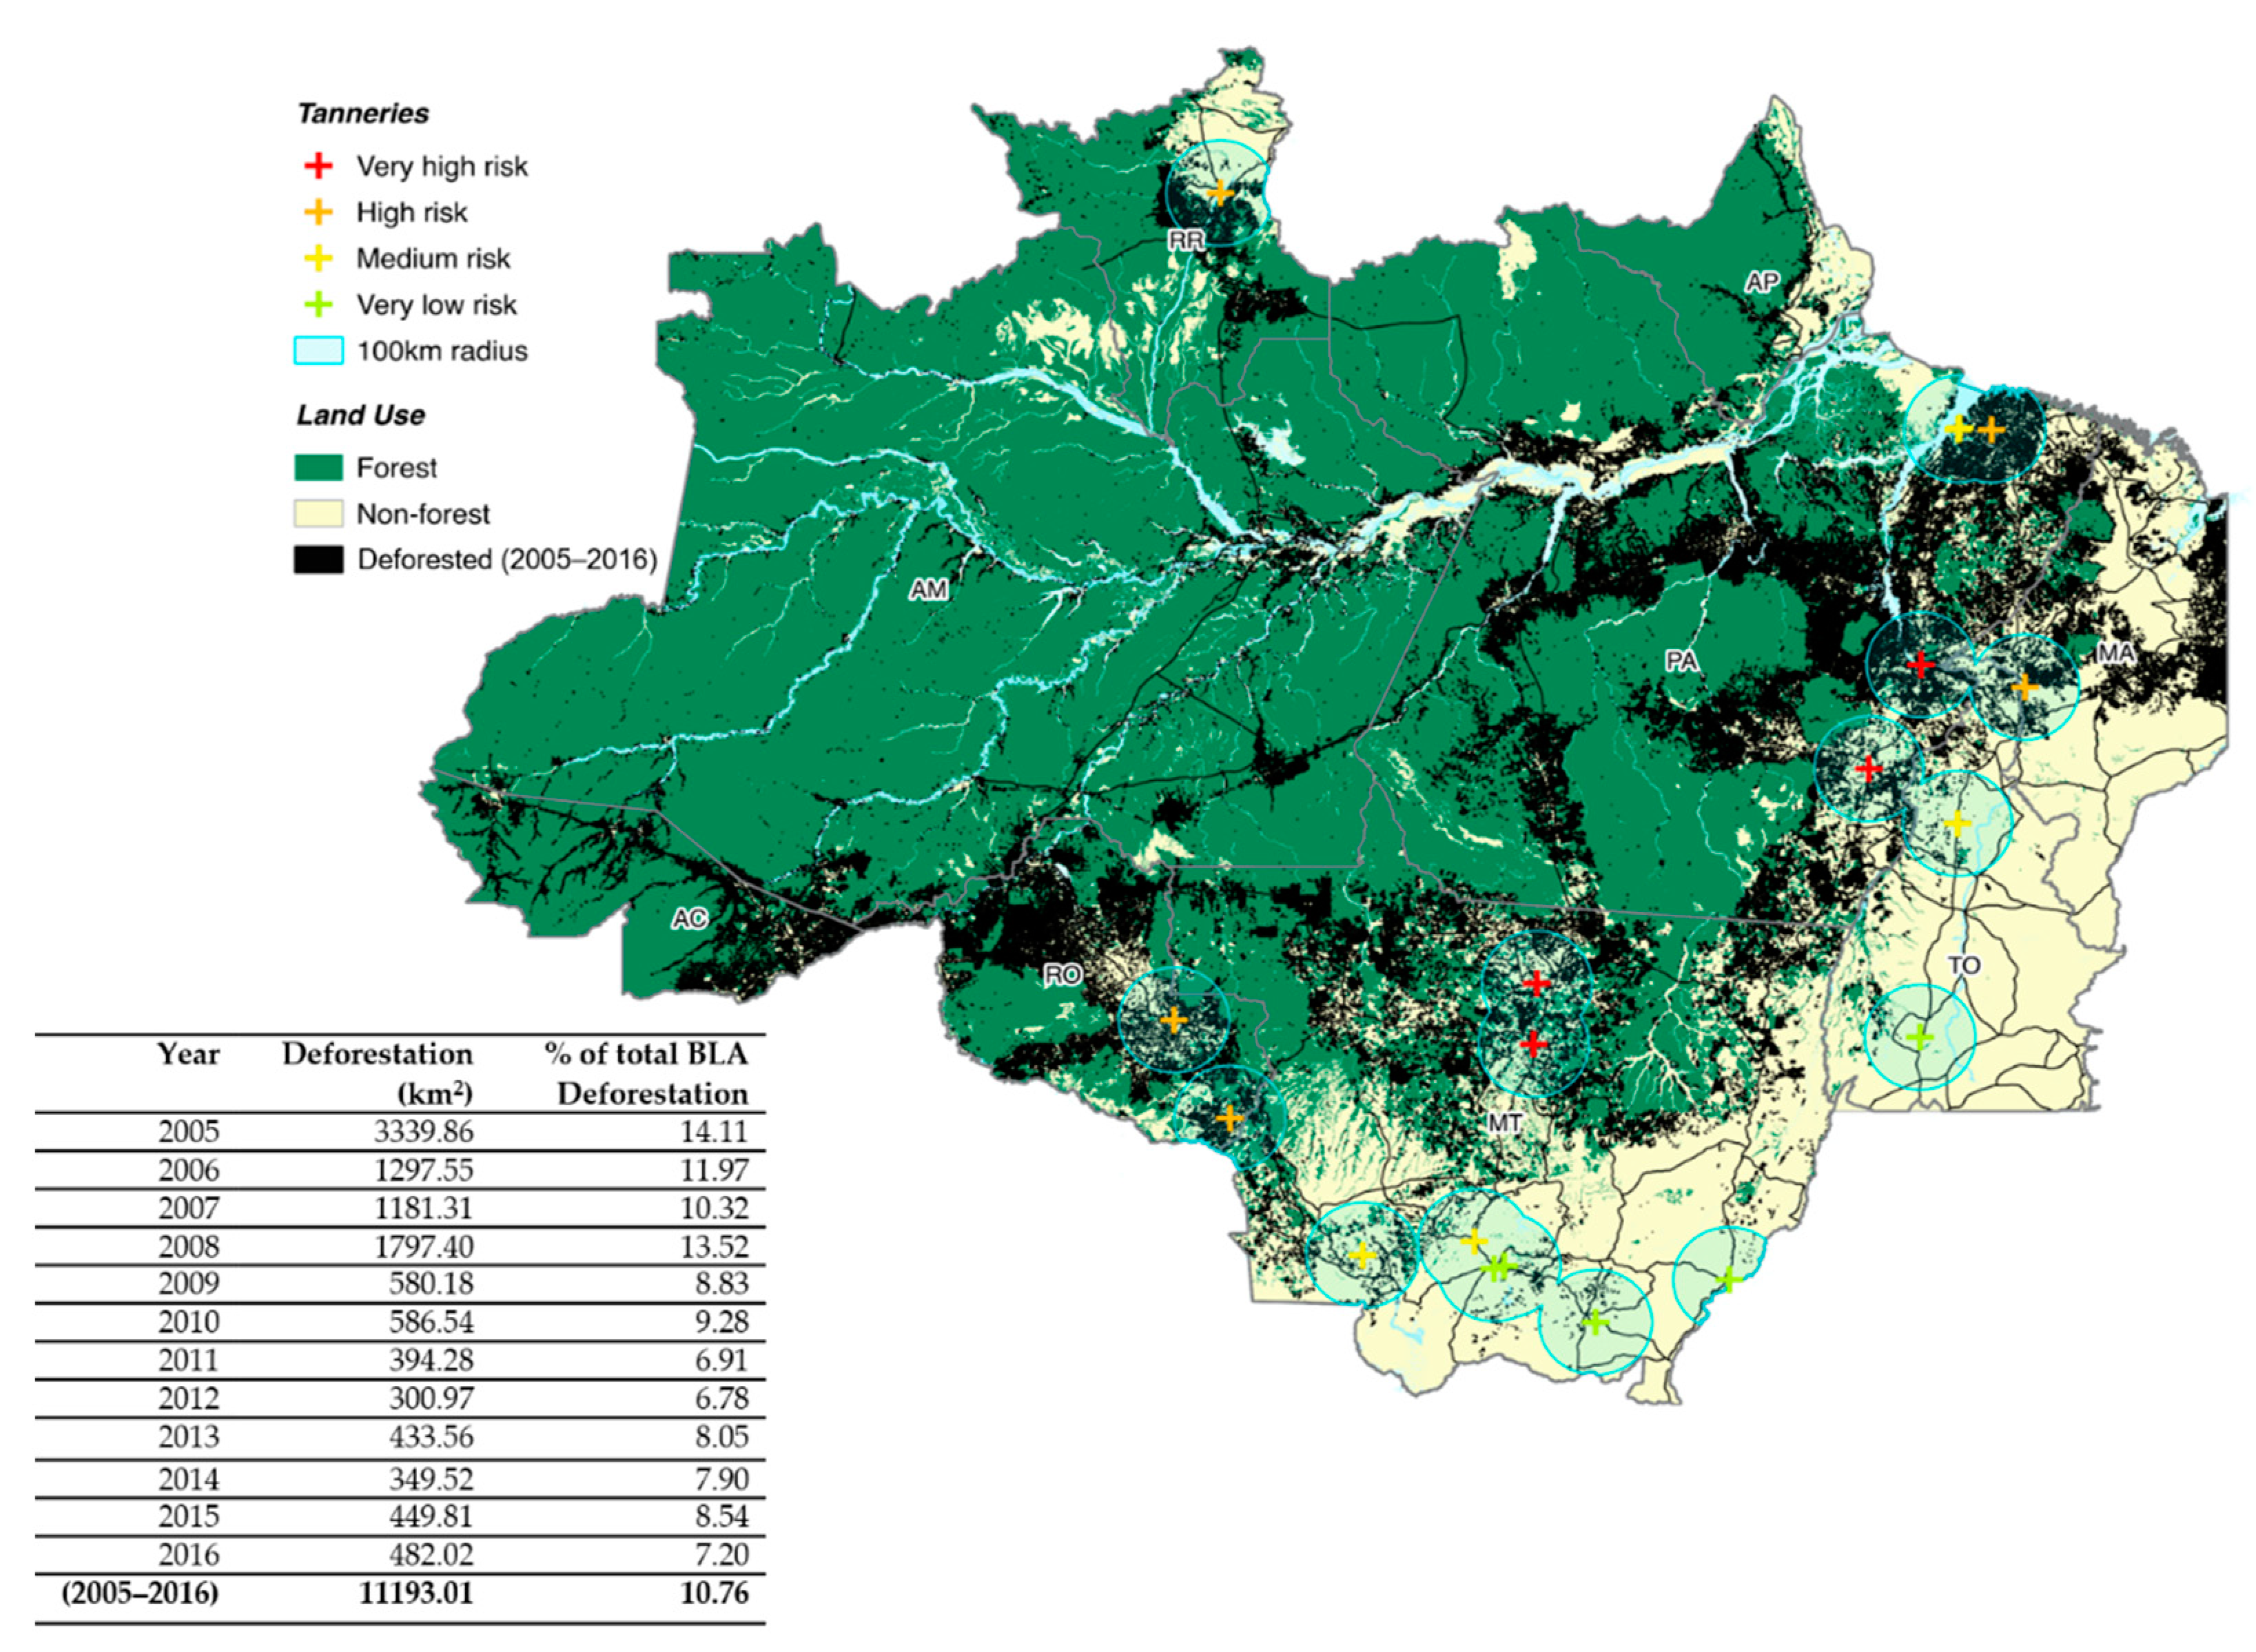
“Very high risk”: if Q3 ≤ DefArea ≤ Max
-
“High risk”: if Q2 ≤ DefArea < Q3
-
“Medium risk”: if Q1 ≤ DefArea < Q2
-
“Low risk”: if Min ≤ DefArea < Q1
where, “DefArea” is the deforested area within the 100 km2 radius, “Min” is the Minimum value for deforestation within 100 km2 radius found, “Max” is the Maximum for deforestation within 100 km2 radius value found, “Q1”, “Q2” and “Q3” represent the first, second and third quartile, respectively. The majority of the geospatial analysis as well as all the elaboration of figures presented in this research was carried out in QGIS.

Appendix C

Table A1. List of slaughterhouses in Brazilian Legal Amazon, the assigned deforestation risk and associated information [109].
CompanySIF CodeDeforestation 2005–2016 (km2)Rank StateCity
Frigorfico Nosso Ltd.a3864324.984ROPorto Velho
T. M. Da Silva De Carvalho Frigorifico-Epp46863283.184PANovo Progresso
Frigol S. A. L41503124.024PASão Félix do Xingu
Jbs S/A20112889.434MTJuruena
Jbs S/A43932504.954MTVila Rica
Frigoari-Frigorifico Ariquemes S/A5112297.574ROAriquemes
Jbs S/A11102207.894PASantana do Araguaia
Unibrax Alimentos E Participacoes S/A Ull30382073.914PAJacunda
Jbs S/A41491980.774ROPorto Velho
Jbs S/A4571976.364PAMarabá
Frigorifico Fortefrigo Ltd.a3721915.684PAParagominas
Jbs S/A34701837.844MTConfresa
Jbs S/A32971723.314ACRio Branco
Frigorifico Redentor S/A.4111716.934MTGuarantã do Norte
Jbs S/A43231702.934MTMatupá
Vale Grande Industria E Comercio De Alimentos S/A44901654.564MTMatupá
Frigorifico Nosso Ltd.a40861537.984ACSenador Guiomard
Jbs S/A42681489.894MTColíder
Jbs S/A43021475.954MTAlta Floresta
Abatedouro De Bovinos Sampaio Ltd.a-Me22581412.574PARedenção
Agropam-Agricultura E Pecuaria Amazonas S/A28031388.684AMBoca do Acre
Vale Grande Industria E Comercio De Alimentos S/A29371379.713MTNova Canaã Norte
Jbs S/A2001332.413MTJuara
Jbs S/A23501317.393PATucumã
Mfb Marfrig Frigorficos Brasil S. A.14971304.803PATucumã
Jbs S/A8071280.553PARedenção
Masterboi Ltd.a24371247.853PASão Geraldo do Araguaia
Frigorifico Rio Maria Ltd.a1121245.373PARio Maria
Mafripar Matadouro Frigorifico Paraense Ltd.a44131217.283PAXinguara
Xinguara Indstria E Comrcio S/A43981209.033PAXinguara
Frigorfico Vale Do Tocantins S/A24311194.133MAImperatriz
Mfb Marfrig Frigorficos Brasil S. A.32501118.223ROChupinguaia
Jbs S/A29421092.083MTJuína
Frigomil Frigorfico Mil Ltd.a45101023.713ROPimenta Bueno
Jbs S. A.28801009.053ROPimenta Bueno
Vpr Brasil–Importações E Exportações Ltd.a3801994.003MTSão José do Rio Claro
Matadouro Frigorifico Do Norte Ltd.a-Mafrinorte2801986.393PACastanhal
Minerva Indstria E Comrcio De Alimentos S/A791950.313RORolim de Moura
Frigol S. A.2583922.883PAÁgua Azul do Norte
Companhia De Desenvolvimento De Roraima2040921.743RRBoa Vista
Industria De Carnes E Derivados Bonutt Ltd.a2852906.523TOAraguaína
Distriboi-Industria Comércio E Transporte De Carne Bovina Ltd.a4334904.273RORolim de Moura
Irmos Gonalves, Comrcio E Indstria Ltd.a2443896.442ROJaru
Jbs S/A175868.792ROSão Miguel do Guaporé
Matadouro E Frigorifico Extemo Norte Ltd.a4554750.072PACastanhal
Distriboi-Ind, Com E Transporte De Carne Bovina4488722.752ROCacoal
Frigoserve Cacoal Ltd.a1594713.762ROCacoal
Jbs S/A4333698.282ROVilhena
R. E. Ribeiro Soares-Me1367682.172PASantarém
Frigorifico Tangar Ltd.a4267503.792ROJi-Paraná
Distriboi-Industria, Comercio E Transporte De Carne Bovina Ltd.a4695497.622ROJi-Paraná
Jbs S/A51414.722MTPontes e Lacerda
L K J-Frigorifico Ltd.a723406.872TOAraguaína
Naturafrig Alimentos Ltd.a1811406.252MTBarra do Bugres
Minerva S. A.1940397.502TOAraguaína
Jbs S/A4001389.312TOAraguaína
Jbs S/A3000378.822MTDiamantino
Frigorifico Redentor S/A3826370.822MTBarra do Bugres
Comcarne Comercial De Carne Ltd.a1339366.112MAIgarapé do Meio
Marfrig Alimentos S/A1751360.182MTTangará da Serra
Jbs S/A2979336.022MTAraputanga
Jbs S/A3031319.932MTSão José dos Quatro Marcos
Brf-Brasil Foods S. A.2911313.491MTMirassol d’Oeste
Masterboi Ltd.a860263.491TONova Olinda
Frigorifico 3m Ltd.a-Epp1777213.971MTCáceres
Jbs S/A412188.391MTÁgua Boa
Ifc International Food Company Ind De Alimentos S*234570.221MTNova Xavantina
Jbs S/A82657.011MTCuiabá
Brf-Brasil Foods S. A.201556.321MTVárzea Grande
Carnes Boi Branco Ltd.a286255.181MTVárzea Grande
Frigovrzea Frigoriffico De Vrzea Grande Eireli465653.871MTVárzea Grande
Pantaneira Ind. E Com De Carnes E Derivados Ltd.a120652.531MTVárzea Grande
Agra Agroindustrial De Alimentos S/A394141.661MTRondonópolis
Mataboi Alimentos S. A.188640.591MTRondonópolis
Leandro Santos Carneiro Ltd.a-Epp397040.441MTRondonópolis
Jbs S/A201934.591MTPedra Preta
Marfrig Alimentos S/A250029.321MTParanatinga
Coop Dos Produtores De Carne E Derivados De Gurupi9327.871TOGurupi
Jbs S/A426.011MTBarra do Garças
Ind E Comer De Carnes E Derivados Boi Brasil17235.111TOAlvorada
Hbc Ind E Com De Alimentos Imp E Exp Ltd.a14414.471TOAraguaçu
Cesilio Agroindustrial Ltd.a46253.371TOParaíso do Tocantins
Plena Alimentos Ltd.a32152.301TOParaíso do Tocantins
Note: Rank column refers to degree of risk assigned to the slaughterhouse, 4 = Very high risk; 3 = High risk; 2 = Medium risk; 1 = Low risk. Refer to Appendix B for more details.
Table A2. List of tanneries in Brazilian Legal Amazon, the assigned deforestation risk and associated information [109].
CompanyDeforestation 2005–2016 (km2)RankStateCityLWG Certification
Jbs S/A Maraba2039.044PAMarabáYes
Curtume Blubras1820.814MTSinopYes
Jbs Colider1522.884MTColíderYes
Durlicouros Indústria Comércio De Couros Exportação E Importação Ltd.a1223.114PAXinguaráYes
Curtidora Ribeirãozinho Ltd.a1057.254MAGovernador Edison LobãoNo
Curtume Santa Maria Ltd.a1054.574MAGovernador Edison LobãoYes
Maranhão Indústria De Couro Ltd.a.1051.883MAGovernador Edison LobãoYes
Couros Boa Vista Ltd.a.976.973RRBoa VistaYes
Mastercouros Comércio Importação E Exportação De Couros Ltd.a.961.143PACastanhalYes
Jbs S/A Colorado Do Oeste753.113ROColorado do OesteYes
Jbs S/A Cacoal725.943ROCocalYes
Couro Do Norte Ltd.a601.072PABelémNo
Mj Novaes De Lima E Cia Ltd.a589.672PABelémNo
Curtume Araputangas S/A349.962MTAraputangaYes
Curtidora Tocantins Ltd.a169.862TOColinas do TocantinsYes
Curtume Jangadas S/A65.552MTJangadaYes
Viposa S/A61.801MTVárzea GrandeYes
Durlicourous Cuiba60.421MTCuiabáYes
Durlicouros Ind Com De Couros Ltd.a60.351MTCuiabáYes
Jbs Pedra Preta/Brazservice Wet Leather S/A36.631MTPedra PretaYes
Jbs S/A Gurupi36.081TOGurupiNo
Jbs S/A Barra Do Garcas6.011MTBarra dos GarçasYes
Note: Rank column refers to degree of risk assigned to the tannery, 4 = Very high risk; 3 = High risk; 2 = Medium risk; 1 = Low risk. Refer to Appendix B for more details.

References

  1. Curtis, P.G.; Slay, C.M.; Harris, N.L.; Tyukavina, A.; Hansen, M.C. Classifying drivers of global forest loss. Science 2018, 361, 1108–1111. [Google Scholar] [CrossRef] [PubMed]
  2. Arneth, A.; Barbosa, H.; Benton, T.; Intergovernmental Panel for Climate Change (IPCC). Summary for Policymakers. Climate Change and Land. An IPCC Special Report on Climate Change, Desertification, Land Degradation, Sustainable Land Management, Food Security, and Greenhouse Gas Fluxes in Terrestrial Ecosystems. 2019. Available online: https://www.ipcc.ch/site/assets/uploads/2019/08/Edited-SPM_Approved_Microsite_FINAL.pdf (accessed on 29 January 2022).
  3. Weisse, M.; Goldman, D.E. Just 7 Commodities Replaced an Area of Forest Twice the Size of Germany between 2001 and 2015. World Resour. Inst. Rev. 2021. Available online: https://www.wri.org/blog/2021/02/global-deforestation-agricultural-commodities?utm_medium=worldresources&utm_source=linkedin&utm_campaign=globalforestreview (accessed on 29 January 2022).
  4. Dummett, C.; Blundell, A.; Canby, K.; Wolosin, M.; Bodnar, E. Illicit Harvest, Complicit Goods. The State of Illegal Deforestation for Agriculture. Report Forest Trends. 2021. Available online: https://www.forest-trends.org/wp-content/uploads/2021/05/Illicit-Harvest-Complicit-Goods_rev.pdf (accessed on 29 January 2022).
  5. Lawson, S. Stolen Goods. In The EU’s Complicity in Illegal Tropical Deforestation; FERN: Gloucestershire, UK, 2015; ISBN 978-1-906607-40-1. Available online: https://www.fern.org/fileadmin/uploads/fern/Documents/Stolen%20Goods_EN_0.pdf (accessed on 29 January 2022).
  6. Henders, S.; Persson, U.M.; Kastner, T. Trading Forests: Land-Use Change and Carbon Emissions Embodied in Production and Exports of Forest-Risk Commodities. Environ. Res. Lett. 2015, 10, 125012. [Google Scholar] [CrossRef]
  7. Pendrill, F.; Persson, U.M.; Godar, J.; Kastner, T.; Moran, D.; Schmidt, S.; Wood, R. Agricultural and Forestry Trade Drives Large Share of Tropical Deforestation Emissions. Glob. Environ. Chang. 2019, 56, 1–10. [Google Scholar] [CrossRef]
  8. Gibbs, H.K.; Ruesch, A.S.; Achard, F.; Clayton, M.K.; Holmgren, P.; Ramankutty, N.; Foley, J.A. Tropical Forests Were the Primary Sources of New Agricultural Land in the 1980s and 1990s. Proc. Natl. Acad. Sci. USA 2010, 107, 16732–16737. [Google Scholar] [CrossRef] [Green Version]
  9. Mammadova, A.; Vasconcelos, A. Retailers Wake up to Deforestation Risk—Will Italy’s Leather Trade Raise Its Game? Global Canopy. 2019. Available online: https://medium.com/global-canopy/retailers-wake-up-to-deforestation-risk-will-italys-leather-trade-raise-its-game-4c8a8293175f (accessed on 29 January 2022).
  10. Garcia, T.M.; Rijk, G.; Piotrowski, M. Deforestation for Agricultural Commodities a Driver of Fires in Brazil, Indonesia in 2019. Chain Reaction Research, May. 2020. Available online: https://chainreactionresearch.com/wp-content/uploads/2020/05/Deforestation-driven20fires.pdf (accessed on 29 January 2022).
  11. Rudel, T.K.; Defries, R.; Asner, G.P.; Laurance, W.F. Changing Drivers of Deforestation and New Opportunities for Conservation. Conserv. Biol. 2009, 23, 1396–1405. [Google Scholar] [CrossRef]
  12. Boucher, D.; Elias, P.; Lininger, K.; May-Tobin, C.; Roquemore, S.; Saxon, E. The Root of the Problem: What’s Driving Tropical Deforestation Today? Union of Concerned Scientists: Cambridge, MA, USA, 2011. [Google Scholar]
  13. European Commission (EC). Guidance Document for the EU Timer Regulation. Brussels. 2016. Available online: https://ec.europa.eu/environment/forests/pdf/C_2016_755_F1_ACT_EN_V6_P1_831439.PDF (accessed on 29 January 2022).
  14. Mammadova, A.; Behagel, J.; Masiero, M. Making Deforestation Risk Visible. Discourses on Bovine Leather Supply Chain in Brazil. Geoforum 2020, 112, 85–95. [Google Scholar] [CrossRef]
  15. Zu Ermgassen, E.K.; Godar, J.; Lathuillière, M.J.; Löfgren, P.; Gardner, T.; Vasconcelos, A.; Meyfroidt, P. The Origin, Supply Chain, and Deforestation Risk of Brazil’s Beef Exports. Proc. Natl. Acad. Sci. USA 2020, 117, 31770–31779. [Google Scholar] [CrossRef]
  16. Pacheco, P.; Mo, K.; Dudley, N.; Shapiro, A.; Aguilar-Amuchastegui, N.; Ling, P.Y.; Anderson, C.; Marx, A. Deforestation Fronts: Drivers and Responses in a Changing World. WWF, Gland, Switzerland. 2021. Available online: https://wwfint.awsassets.panda.org/downloads/deforestation_fronts___drivers_and_responses_in_a_changing_world___full_report_1.pdf (accessed on 29 January 2022).
  17. Umunay, P.; Lujan, B.; Meyer, C.; Cobián, J. Trifecta of Success for Reducing Commodity-Driven Deforestation: Assessing the Intersection of REDD+ Programs, Jurisdictional Approaches, and Private Sector Commitments. Forests 2018, 9, 609. [Google Scholar] [CrossRef] [Green Version]
  18. Gibbs, H.K.; Munger, J.; L’Roe, J.; Barreto, P.; Pereira, R.; Christie, M.; Amaral, T.; Walker, N.F. Did Ranchers and Slaughterhouses Respond to Zero-Deforestation Agreements in the Brazilian Amazon? Conserv. Lett. 2016, 9, 32–42. [Google Scholar] [CrossRef]
  19. Barreto, P.; Marianno, B.; Valdiones, A.P.; Barreto, G. Os Frigoríficos vão Ajudar a Zerar o Desmatamento na Amazônia? Imazon and Instituto Centro da Vida. 2017. Available online: http://www.imazon.org.br/PDFimazon/Portugues/livros/Frigorificos%20e%20o%20desmatamento%20da%20Amaz%C3%B4nia.pdf (accessed on 29 January 2022).
  20. Greenpeace International. Destruction Certified. Report. 2021. Available online: https://www.greenpeace.org/international/publication/46812/destruction-certified/ (accessed on 29 January 2022).
  21. Brack, D. Illegal Logging and the Illegal Trade in Forest and Timber Products. Int. For. Rev. 2003, 5, 195–198. [Google Scholar] [CrossRef]
  22. Schloenhardt, A. The Illegal Trade in Timber and Timber Products in the Asia–Pacific Region. Australian Institute of Criminology. 2008. Available online: https://core.ac.uk/download/pdf/30687625.pdf (accessed on 29 January 2022).
  23. Miranda, J.; Börner, J.; Kalkuhl, M.; Soares-Filho, B. Land Speculation and Conservation Policy Leakage in Brazil. Environ. Res. Lett. 2019, 14, 045006. [Google Scholar] [CrossRef]
  24. Prager, A. Brazil’s Key Deforestation Drivers: Pasture, Cropland, Land Speculation. 2019. Mongabay, 19 March 2019. Available online: https://news.mongabay.com/2019/03/brazils-key-deforestation-drivers-pasture-cropland-land-speculation/ (accessed on 29 January 2022).
  25. Stabile, M.C.; Guimarães, A.L.; Silva, D.S.; Ribeiro, V.; Macedo, M.N.; Coe, M.T.; Pinto, E.; Moutinho, P.; Alencar, A. Solving Brazil’s Land Use Puzzle: Increasing Production and Slowing Amazon Deforestation. Land Use Policy 2019, 91, 104362. [Google Scholar] [CrossRef]
  26. Cuypers, D.; Geerken, T.; Gorissen, L.; Lust, A.; Peters, G.; Karstensen, J.; Prieler, S.; Fisher, G.; Hizsnyik, E.; Van Velthuizen, H. The Impact of EU Consumption on Deforestation: Comprehensive Analysis of the Impact of EU Consumption on Deforestation, Brussels: European Union (Technical Report—2013—063). 2013. Available online: http://ec.europa.eu/environment/forests/pdf/1.%20Report%20analysis%2of%20impact.pdf (accessed on 29 January 2022).
  27. Balogh, J.M.; Jámbor, A. The Environmental Impacts of Agricultural Trade: A Systematic Literature Review. Sustainability 2020, 12, 1152. [Google Scholar] [CrossRef] [Green Version]
  28. Heyl, K.; Ekardt, F.; Roos, P.; Stubenrauch, J.; Garske, B. Free Trade, Environment, Agriculture, and Plurilateral Treaties: The Ambivalent Example of Mercosur, CETA, and the EU–Vietnam Free Trade Agreement. Sustainability 2021, 13, 3153. [Google Scholar] [CrossRef]
  29. Balogh, J.M.; Mizik, T. Trade–Climate Nexus: A Systematic Review of the Literature. Economies 2021, 9, 99. [Google Scholar] [CrossRef]
  30. DeFries, R.S.; Rudel, T.; Uriarte, M.; Hansen, M. Deforestation Driven by Urban Population Growth and Agricultural Trade in the Twenty-First Century. Nat. Geosci. 2010, 3, 178–181. [Google Scholar] [CrossRef]
  31. Kissinger, G.M.; Herold, M.; De Sy, V. Drivers of Deforestation and Forest Degradation: A Synthesis Report for REDD+ Policymakers; Lexeme Consulting: Vancouver, Canada, 2012. [Google Scholar]
  32. Geist, H.J.; Lambin, E.F. Proximate Causes and Underlying Driving Forces of Tropical Deforestation Tropical Forests Are Disappearing as the Result of Many Pressures, Both Local and Regional, Acting in Various Combinations in Different Geographical Locations. BioScience 2002, 52, 143–150. [Google Scholar] [CrossRef]
  33. DeFries, R.; Herold, M.; Verchot, L.; Macedo, M.N.; Shimabukuro, Y. Export-Oriented Deforestation in Mato Grosso: Harbinger or Exception for Other Tropical Forests? Philos. Trans. R. Soc. B Biol. Sci. 2013, 368, 20120173. [Google Scholar] [CrossRef]
  34. Chang, J.; Symes, W.S.; Lim, F.; Carrasco, L.R. International Trade Causes Large Net Economic Losses in Tropical Countries via the Destruction of Ecosystem Services. Ambio 2016, 45, 387–397. [Google Scholar] [CrossRef] [Green Version]
  35. Clark, C. The Conditions of Economic Progress; MacMillan & Co.: London, UK, 1940. [Google Scholar]
  36. Kuznets, S. Toward a Theory of Economic Growth, with Reflections on the Economic Growth of Modern Nations; Norton Library: New York, NY, USA, 1968. [Google Scholar]
  37. Schafran, A.; McDonald, C.; Lopez Morales, E.; Akyelken, N.; Acuto, M. Replacing the Services Sector and Three-Sector Theory: Urbanization and Control as Economic Sectors. Reg. Studi. 2018, 52, 1708–1719. [Google Scholar] [CrossRef]
  38. Kim, H.D. Systems Thinking Tools: A User’s Reference Guide; Pegasus Communications, Inc.: Arcadia, CA, USA, 2000; ISBN 1-883823-02-1. Available online: https://thesystemsthinker.com/wp-content/uploads/2016/03/Systems-Archetypes-I-TRSA01_pk.pdf (accessed on 29 January 2022).
  39. Meadows, D. Leverage Points: Places to Intervene in a System; The Sustainability Institute: Hartland, WI, USA, 1999. [Google Scholar]
  40. Abson, D.J.; Fischer, J.; Leventon, J.; Newig, J.; Schomerus, T.; Vilsmaier, U.; Von Wehrden, H.; Abernethy, P.; Ives, C.D.; Jager, N.W.; et al. Leverage Points for Sustainability Transformation. Ambio 2017, 46, 30–39. [Google Scholar] [CrossRef] [PubMed] [Green Version]
  41. Blokland, P.; Reniers, G. Safety Science, a Systems Thinking Perspective: From Events to Mental Models and Sustainable Safety. Sustainability 2020, 12, 5164. [Google Scholar] [CrossRef]
  42. Nepstad, D.; McGrath, D.; Stickler, C.; Alencar, A.; Azevedo, A. Slowing Amazon Deforestation through Public Policy and Interventions in Beef and Soy Supply Chains. Science 2014, 344, 1118–1123. [Google Scholar] [CrossRef] [PubMed]
  43. Weber, A.K.; Partzsch, L. Barking up the Right Tree? NGOs and Corporate Power for Deforestation-Free Supply Chains. Sustainability 2018, 10, 3869. [Google Scholar] [CrossRef] [Green Version]
  44. Seuring, S.; Müller, M. From a Literature Review to a Conceptual Framework for Sustainable Supply Chain Management. J. Clean. Prod. 2008, 16, 1699–1710. [Google Scholar] [CrossRef]
  45. Håkansson, H.; Persson, G. Supply Chain Management: The Logic of Supply Chains and Networks. Int. J. Logist. Manag. 2004, 15, 11–26. [Google Scholar] [CrossRef]
  46. Meijer, K.S. A Comparative Analysis of the Effectiveness of Four Supply Chain Initiatives to Reduce Deforestation. Trop. Conserv. Sci. 2015, 8, 583–597. [Google Scholar] [CrossRef]
  47. Lundy, M.; Amrein, A.; Hurtado, J.J.; Becx, G.; Zamierowski, N.; Rodriguez, F.; Mosquera, E.E. LINK Methodology: A Participatory Guide to Business Models That Link Smallholders to Markets. Version 2.0. Cali, Colombia: International Center for Tropical Agriculture. 2014. Available online: http://hdl.handle.net/10568/49606 (accessed on 29 January 2022).
  48. Newton, P.; Benzeev, R. The Role of Zero-Deforestation Commitments in Protecting and Enhancing Rural Livelihoods. Curr. Opin. Environ. Sustain. 2018, 32, 126–133. [Google Scholar] [CrossRef]
  49. Walker, N.; Patel, S.; Kalif, K. From Amazon Pasture to the High Street: Deforestation and the Brazilian Cattle Product Supply Chain. Trop. Conserv. Sci. 2013, 6, 446–467. [Google Scholar] [CrossRef] [Green Version]
  50. TRASE. How Trase Assesses ‘Commodity Deforestation’ and ‘Commodity Deforestation Risk’. Resources. 2020. Available online: http://resources.trase.earth/documents/data_methods/Trase_deforestation_risk_method_final%20Sept%202020.pdf (accessed on 29 January 2022).
  51. Malterud, K.; Siersma, V.D.; Guassora, A.D. Sample Size in Qualitative Interview Studies: Guided by Information Power. Qual. Health Res. 2016, 26, 1753–1760. [Google Scholar] [CrossRef]
  52. European Commission (EC). Policy. Accessing Markets. Investments. 2021. Available online: https://ec.europa.eu/trade/policy/accessing-markets/investment/ (accessed on 29 January 2022).
  53. Ferreira, S. Deforestation, Property Rights, and International Trade. Land Econ. 2004, 80, 174–193. [Google Scholar] [CrossRef]
  54. Faria, W.R.; Almeida, A.N. Relationship between Openness to Trade and Deforestation: Empirical Evidence from the Brazilian Amazon. Ecol. Econ. 2016, 121, 85–97. [Google Scholar] [CrossRef]
  55. Schmitz, C.; Kreidenweis, U.; Lotze-Campen, H.; Popp, A.; Krause, M.; Dietrich, J.P.; Müller, C. Agricultural Trade and Tropical Deforestation: Interactions and Related Policy Options. Region. Environ. Chang. 2015, 15, 1757–1772. [Google Scholar] [CrossRef]
  56. Abman, R.; Lundberg, C. Does Free Trade Increase Deforestation? The Effects of Regional Trade Agreements. J. Assoc. Environ. Resour. Econ. 2020, 7, 35–72. [Google Scholar] [CrossRef]
  57. FERN. Eu-Mercosur Deal Sacrifices Forests and Rights on the Altar of Trade. 2019. Available online: https://www.fern.org/news-resources/eu-mercosur-deal-sacrifices-forests-and-rights-on-the-altar-of-trade-1986/ (accessed on 29 January 2022).
  58. Kehoe, L.; Reis, T.; Virah-Sawmy, M.; Balmford, A.; Kuemmerle, T. Make EU Trade with Brazil Sustainable. Science 2019, 364, 341–342. Available online: https://www.researchgate.net/publication/332665154_Make_EU_trade_with_Brazil_sustainable (accessed on 29 January 2022). [CrossRef] [Green Version]
  59. Amazon Institute of People and the Environment (IMAZON). Is the EU-MERCOSUR trade agreement deforestation-proof?/Instituto do Homem e Meio Ambiente da Amazônia—Belém, PA. 2020. Available online: https://imazon.org.br/wp-content/uploads/2020/11/mercosulue_en_imazon.pdf (accessed on 29 January 2022).
  60. Arima, E.; Barreto, P.; Taheripour, F.; Aguiar, A. Dynamic Amazonia: The EU–Mercosur Trade Agreement and Deforestation. Land 2021, 10, 1243. [Google Scholar] [CrossRef]
  61. Follador, M.; Soares-Filho, B.S.; Philippidis, G.; Davis, J.L.; de Oliveira, A.R.; Rajão, R. Brazil’s Sugarcane Embitters the EU-Mercosur Trade Talks. Sci. Rep. 2021, 11, 1–10. [Google Scholar]
  62. European Commission (EC). Eu Market Access Flash Note. Brazil Removes Export Duties on Hides and Skins. 2018. Available online: https://trade.ec.europa.eu/doclib/docs/2018/october/tradoc_157430.pdf (accessed on 29 January 2022).
  63. Global Canopy. Time for Change: Delivering Deforestation-Free Supply Chains. Forests 500. 2021. Available online: https://forest500.org/sites/default/files/forest500_2021report.pdf (accessed on 29 January 2022).
  64. Baldock, C.; McLuckie, M.; Mosnier, F.; Willis, J. Exchange-Traded Deforestation. 2020. Available online: https://planet-tracker.org/tracker-programmes/food-and-land-use/food-and-agriculture/ (accessed on 29 January 2022).
  65. NYDF Assessment Partners. Balancing Forests and Development: Addressing Infrastructure and Extractive Industries, Promoting Sustainable Livelihoods. Climate Focus (Coordinator and Editor). 2020. Available online: www.forestdeclaration.org (accessed on 29 January 2022).
  66. United Nations Framework Convention on Climate Change (UNFCC). Glasgow Leaders’ Declaration on Forests and Land Use. 2021. Available online: https://ukcop26.org/glasgow-leaders-declaration-on-forests-and-land-use/ (accessed on 29 January 2022).
  67. Leblois, A.; Damette, O.; Wolfersberger, J. What Has Driven Deforestation in Developing Countries Since the 2000s? Evidence from New Remote-Sensing Data. World Dev. 2017, 92, 82–102. [Google Scholar] [CrossRef]
  68. Pendrill, F.; Persson, U.M.; Godar, J.; Kastner, T. Deforestation Displaced: Trade in Forest-Risk Commodities and the Prospects for a Global Forest Transition. Environ. Res. Lett. 2019, 14, 055003. [Google Scholar] [CrossRef]
  69. Richards, P.D.; Walker, R.T.; Arima, E.Y. Spatially Complex Land Change: The Indirect Effect of Brazil’s Agricultural Sector on Land Use in Amazonia. Glob. Environ. Chang. 2014, 29, 1–9. [Google Scholar] [CrossRef] [PubMed] [Green Version]
  70. dos Reis, T.N.; Meyfroidt, P.; zu Ermgassen, E.K.; West, C.; Gardner, T.; Bager, S.; Croft, S.; Lathuilliere, M.J.; Godar, J. Understanding the Stickiness of Commodity Supply Chains Is Key to Improving Their Sustainability. One Earth 2020, 3, 100–115. [Google Scholar] [CrossRef]
  71. Fearnside, P.M. Soybean Cultivation as a Threat to the Environment in Brazil. Environ. Conserv. 2001, 28, 23–38. [Google Scholar] [CrossRef] [Green Version]
  72. Fearnside, P.M. Deforestation in Amazonia. In Encyclopedia of Earth; Cleveland, C.J., Ed.; Environmental Information Coalition, National Council of Science and the Environment: Washington, DC, USA, 2007. [Google Scholar]
  73. Morton, D.C.; DeFries, R.S.; Shimabukuro, Y.E.; Anderson, L.O.; Arai, E.; del Bon Espirito-Santo, F.; Freitas, R.; Morisette, J. Cropland Expansion Changes Deforestation Dynamics in the Southern Brazilian Amazon. Proc. Natl. Acad. Sci. USA 2006, 103, 14637–14641. [Google Scholar] [CrossRef] [PubMed] [Green Version]
  74. Greenpeace International. Eating up the Amazon. 2006. Available online: https://www.greenpeace.org/usa/wp-content/uploads/legacy/Global/usa/report/2010/2/eating-up-the-amazon.pdf (accessed on 29 January 2022).
  75. Walker, R.; Defries, R.; Vera-Diaz, M.D.C.; Shimabukuro, Y.; Venturieri, A. The Expansion of Intensive Agriculture and Ranching in Brazilian Amazonia. Amazonia and Global Change. 2009, pp. 61–81. Available online: https://ui.adsabs.harvard.edu/abs/2009GMS...186...61W/abstract (accessed on 29 January 2022).
  76. Gibbs, H.K.; Rausch, L.; Munger, J.; Schelly, I.; Morton, D.C. Brazil’s Soy Moratorium. Science 2015, 347, 377–378. [Google Scholar] [CrossRef]
  77. Godar, J.; Suavet, C.; Gardner, T.A.; Dawkins, E.; Meyfroidt, P. Balancing Detail and Scale in Assessing Transparency to Improve the Governance of Agricultural Commodity Supply Chains. Environ. Res. Lett. 2016, 11, 35015. [Google Scholar] [CrossRef] [Green Version]
  78. Junior, C.S.; Lima, M. Soy Moratorium in Mato Grosso: Deforestation Undermines the Agreement. Land Use Policy 2018, 71, 540–542. [Google Scholar]
  79. UN Comtrade Database. Available online: https://comtrade.un.org/ (accessed on 29 January 2022).
  80. TRASE. Trase Yearbook 2018. Assessing Deforestation Risk in Brazilian Soy Exports. 2018. Available online: https://yearbook2018.trase.earth/chapter5/ (accessed on 29 January 2022).
  81. Kröger, M. Extractivisms, Existences and Extinctions: Monoculture Plantations and Amazon Deforestation; Taylor & Francis: Abingdon, UK, 2022; p. 176. [Google Scholar]
  82. Global Witness. Money to Burn. More than 300 Banks and Investors Back Six of the World’s Most Harmful Agribusinesses to the Tune of $44bn; Global Witness: Washington, DC, USA, 2019; Available online: https://www.globalwitness.org/en/campaigns/forests/money-to-burn-how-iconic-banks-and-investors-fund-the-destruction-of-the-worlds-largest-rainforests/ (accessed on 29 January 2022).
  83. Orth, C.F.; Rios dos Santos, C.C.; Celeste, I.I.; de Melo, R.G.; Gusman, T.P. Bilateral Investment Map. Brazil-European Union. 2017. Available online: https://eeas.europa.eu/sites/default/files/mapa_de_investimentos_brasil-ue_eng_final_0.pdf (accessed on 29 January 2022).
  84. Central Bank of Brazil. Foreign Direct Investment Report. 2018. Available online: https://www.bcb.gov.br/Rex/CensoCE/ingl/FDIReport2016.pdf (accessed on 29 January 2022).
  85. European Commission (EC). Trade. Policy. Countries and Regions. Brazil. 2019. Available online: https://ec.europa.eu/trade/policy/countries-and-regions/countries/brazil/ (accessed on 29 January 2022).
  86. Slob, B.; Rijk, G.; Piotrowski, M. JBS, Marfrig, and Minerva: Material Financial Risk from Deforestation in Beef Supply Chains. Chain Reaction Research. 2020. Available online: https://chainreactionresearch.com/wp-content/uploads/2020/12/JBS-Marfrig-and-Minerva-Material-financial-risk-from-deforestation-in-beef-supply-chains-4.pdf (accessed on 29 January 2022).
  87. OECD/FAO. OECD-FAO Agricultural Outlook 2020–2029. 2020. Available online: https://www.oecd-ilibrary.org/ (accessed on 29 January 2022).
  88. European Commission. The EU Leather Industry. 2021. Available online: https://ec.europa.eu/growth/sectors/fashion/leather-industry/eu-leather-industry_en (accessed on 29 January 2022).
  89. Andreoni, M.; Tabuchi, H.; Sun, A. How Americans’ Appetite for Leather in Luxury SUVs Worsens Amazon Deforestation. New York Times. 17 November 2021. Available online: https://www.nytimes.com/2021/11/17/climate/leather-seats-cars-rainforest.html (accessed on 29 January 2022).
  90. Faminow, M.D. Cattle, Deforestation and Development in the Amazon: An Economic, Agronomic and Environmental Perspective; Cab International: New York, NY, USA, 1998; Volume 253. [Google Scholar]
  91. Kaimowitz, D.; Mertens, B.; Wunder, S.; Pacheco, P. Hamburger Connection Fuels Amazon Destruction; Center for International Forest Research: Bangor, Indonesia, 2004; pp. 1–10. [Google Scholar]
  92. Pereira, R.; Simmons, C.S.; Walker, R. Smallholders, Agrarian Reform, and Globalization in the Brazilian Amazon: Cattle versus the Environment. Land 2016, 5, 24. [Google Scholar] [CrossRef]
  93. Zu Ermgassen, E.K.; Ayre, B.; Godar, J.; Lima, M.G.B.; Bauch, S.; Garrett, R.; Green, J.; Lathuillière, M.J.; Löfgren, P.; MacFarquhar, C.; et al. Using Supply Chain Data to Monitor Zero Deforestation Commitments: An Assessment of Progress in the Brazilian Soy Sector. Environ. Res. Lett. 2020, 15, 035003. [Google Scholar] [CrossRef]
  94. MapBiomas. Map and Data, Land Use Change 1985–2017. 2018. Available online: http://mapbiomas.org/map#coverage (accessed on 29 January 2022).
  95. Moutinho, P.; Guerra, R.; Azevedo-Ramos, C. Achieving Zero Deforestation in the Brazilian Amazon: What Is Missing? Elem. Sci. Anthr. 2016, 4, 000125. [Google Scholar] [CrossRef] [Green Version]
  96. INPE/PRODES. Available online: http://www.obt.inpe.br/OBT/assuntos/programas/amazonia/prodes (accessed on 29 January 2022).
  97. Locatelli, P.; Aranha, A. JBS Compra Gado de Áreas Desmatadas Ilegalmente e Leva Multa de R$24 Milhões. Reporter Brasil. 2017. Available online: https://reporterbrasil.org.br/2017/03/jbs-compra-gado-de-areas-desmatadas-ilegalmente-e-leva-multa-de-r24-milhoes/ (accessed on 29 January 2022).
  98. Anonymous; Belém, Para, Brazil. Personal Communication, 24 May 2018.
  99. Barreto, P.; Pereira, R.; Baima, S. Os Potenciais Impactos de Fiscalizar Frigoríficos sem Compromissos contra o Desmatamento. Imazon: Belém, Brazil, 2018. [Google Scholar]
  100. Alix-Garcia, J.; Gibbs, H.K. Forest Conservation Effects of Brazil’s Zero Deforestation Cattle Agreements Undermined by Leakage. Glob. Environ. Chang. 2017, 47, 201–217. [Google Scholar] [CrossRef]
  101. Ministério Público Federal (MPF) do Brazil. Procuradoria da República no Pará. Auditorias Confirmam e Aprimoram Avanços no Controle da Origem da Carne no Pará. 2018. Available online: http://www.mpf.mp.br/pa/sala-de-imprensa/noticias-pa/auditorias-confirmam-e-aprimoram-avancos-no-controle-da-origem-da-carne-no-para (accessed on 29 January 2022).
  102. Mengardo, B. TACs da Carne no Pará Expõem Limitações do MP na Área Ambiental, Notícia de 10/05/2018. Jota/((o)) Eco. 2018. Available online: https://www.jota.info/especiais/tacs-da-carne-no-para-expoem-limitacoes-do-mp-na-area-ambiental-10052018 (accessed on 29 January 2022).
  103. Ministério Público Federal (MPF) do Brasil. Ações Penais—Operação Arquimedes. 2019. Available online: http://www.mpf.mp.br/grandes-casos/operacao-arquimedes/atuacao-do-mpf/acoes-penais (accessed on 29 January 2022).
  104. Investopedia. What Is Vertical Integration? 2021. Available online: https://www.investopedia.com/terms/v/verticalintegration.asp (accessed on 29 January 2022).
  105. Brazilian Leather Guide (BLG). Available online: http://www.guiabrasileirodocouro.com.br/ (accessed on 29 January 2022).
  106. The Centre for the Brazilian Tanning Industry (CICB). Available online: http://www.cicb.org.br/cicb (accessed on 29 January 2022).
  107. The Ministry of Agriculture, Cattle and Supply (MAPA). SIF Database. Available online: http://sigsif.agricultura.gov.br/sigsif_cons/%21ap_estabelec_nacional_rep (accessed on 29 January 2022).
  108. Leather Working Group (LWG). Available online: https://www.leatherworkinggroup.com/leather-manufacturers-and-traders/leather-manufacturers/our-rated-members?country=Brazil (accessed on 29 January 2022).
  109. Sartorato, S.F.C. Is Leather a Forest-Risky Commodity? Exploring Embodied Deforestation in the Brazilian Leather. Master Thesis, University of Padova, Padova, Italy, 2017. [Google Scholar]
  110. Textile Exchange. Leather Supply Chain Mapping and Traceability Guidelines. 2021. Available online: https://textileexchange.org/wp-content/uploads/2021/02/LIA-261-V0.1-Leather-Supply-Chain-Mapping-and-Traceability-Guidelines.pdf (accessed on 29 January 2022).
  111. Anonymous; Maraba, Para, Brazil. Personal Communication, 23 May 2018.
  112. Anonymous; Cuiaba, Mato Grosso. Personal Communication, 7 June 2018.
  113. Instituto Brasileiro de Geografia e Estatística (IBGE) (Brazilian Institute of Geography and Statistics). Sistema IBGE de Recuperação Automática—SIDRA. Pesquisa do Couro e Abate de Animais. 2018. Available online: https://sidra.ibge.gov.br/home/abate/brasil (accessed on 29 January 2022).
  114. Global Forest Watch (GFW). Available online: http://data.globalforestwatch.org/ (accessed on 29 January 2022).
  115. UFG—Image Processing Laboratory and Geo-LAPIG. Available online: http://maps.lapig.iesa.ufg.br/lapig.html (accessed on 29 January 2022).
  116. SECEX/MDIC. Available online: http://comexstat.mdic.gov.br/en/geral (accessed on 29 January 2022).
  117. Buljan, J.; Kráľ, I. The Framework for Sustainable Leather Manufacture, 2nd ed.; United Nations Industrial Development Organization (UNIDO), 2019; Available online: https://leatherpanel.org/sites/default/files/publications-attachments/the_framework_for_sustainable_leather_manufacturing_2nd_edition_2019_f.pdf#page=156 (accessed on 29 January 2022).
  118. Centro das Indústrias de Curtumes do Brasil (CICB). Sobre o Couro. 2021. Available online: http://www.cicb.org.br/cicb/sobre-couro (accessed on 29 January 2022).
  119. Mammadova, A.; Masiero, M.; Pettenella, D. Embedded Deforestation: The Case Study of the Brazilian–Italian Bovine Leather Trade. Forests 2020, 11, 472. [Google Scholar] [CrossRef] [Green Version]
  120. Institute of Quality Certification for the Leather Sector (ICEC). Certifications. Made in Italy of Leather Production. 2019. Available online: http://www.icec.it/en/certifications/product-economic-sustainability/made-in-italy-of-leather-production (accessed on 11 February 2020).
  121. Anonymous. Bresaola Della Valtellina. Raw Material. 2021. Available online: https://www.bresaolavaltellina.it/en/raw-material/ (accessed on 29 January 2022).
  122. De Rosa-Giglio, P.; Fontanella, A.; Gonzalez-Quijano, G.; Ioannidis, I.; Nucci, B.; Brugnoli, F. Product Environmental Footprint Category Rules (PEFCR). Leather. Final Version. 2018. Available online: https://ec.europa.eu/environment/eussd/smgp/pdf/PEFCR_leather.pdf (accessed on 29 January 2022).
  123. Faggin, J.; Drost, S.; Garcia, M. Driving Deforestation: The European Automotive Industry’s Contribution to Deforestation in Brazil. Report Commissioned by Rainforest Foundation Norway. Aidenvironment. 2021. Available online: https://www.regnskog.no/uploads/documents/Driving-Deforestation-A7.pdf (accessed on 29 January 2022).
  124. Italian Tanners Association (UNIC). Tales of Italian Leather. Sustainability Report 2017. 2017. Available online: http://s.unic.it/5/report-en.html#20-21 (accessed on 29 July 2019).
  125. Lin, L.; Sills, E.; Cheshire, H. Targeting Areas for Reducing Emissions from Deforestation and Forest Degradation (REDD+) Projects in Tanzania. Glob. Environ. Chang. 2014, 24, 277–286. [Google Scholar] [CrossRef]
  126. Di Lallo, G.; Mundhenk, P.; Zamora López, S.; Marchetti, M.; Köhl, M. REDD+: Quick Assessment of Deforestation Risk Based on Available Data. Forests 2017, 8, 29. [Google Scholar] [CrossRef]
  127. Ordway, E.M.; Asner, G.P.; Lambin, E.F. Deforestation Risk Due to Commodity Crop Expansion in Sub-Saharan Africa. Environ. Res. Lett. 2017, 12, 044015. [Google Scholar] [CrossRef]
  128. Global Forest Watch (GFW). Global Forest Watch Pro Online Management Tool. 2021. Available online: https://pro.globalforestwatch.org/about (accessed on 29 January 2022).
  129. Gaveau, D.L.; Locatelli, B.; Salim, M.A.; Yaen, H.; Pacheco, P.; Sheil, D. Rise and Fall of Forest Loss and Industrial Plantations in Borneo (2000–2017). Conserv. Lett. 2019, 12, e12622. [Google Scholar] [CrossRef]
  130. Godar, J.; Persson, U.M.; Tizado, E.J.; Meyfroidt, P. Towards more Accurate and Policy Relevant Footprint Analyses: Tracing Fine-Scale Socio-Environmental Impacts of Production to Consumption. Ecol. Econ. 2015, 112, 25–35. [Google Scholar] [CrossRef]
  131. Pelenc, J.; Ballet, J. Strong Sustainability, Critical Natural Capital and the Capability Approach. Ecol. Econ. 2015, 112, 36–44. [Google Scholar] [CrossRef] [Green Version]
  132. Institute for European Environmental Policy (IEEP). IEEP’s Response to the Public Consultation ‘Deforestation and Forest Degradation: Reducing the Impact of Products Placed on the EU Market’. IEEP, December. 2020. Available online: https://ieep.eu/uploads/articles/attachments/9a45e14a-e483-43c1-9be3-79fc3da940d9/IEEP's%20response%20to%20deforestation%20and%20forest%20degradation%20public%20consultation%20(Dec%202020).pdf?v=63774841886 (accessed on 29 January 2022).
  133. European Commission (EC). Proposal for a Regulation on Deforestation-Free Products. European Commission, November. 2021. Available online: https://ec.europa.eu/environment/publications/proposal-regulation-deforestation-free-products_en (accessed on 29 January 2022).
  134. Ingram, V.; Behagel, J.; Mammadova, A.; Verschuur, X. The Outcomes of Deforestation-Free Commodity Value Chain Approaches; Summary Discussion Paper; Wageningen University & Research: Wageningen, The Netherlands, 2020. [Google Scholar]
  135. Gupta, A.; Lövbrand, E.; Turnhout, E.; Vijge, M.J. In Pursuit of Carbon Accountability: The Politics of REDD+ Measuring, Reporting and Verification Systems. Curr. Opin. Environ. Sustain. 2012, 4, 726–731. [Google Scholar] [CrossRef]
  136. McDermott, C.L. REDDuced: From sustainability to legality to units of carbon—The search for common interests in international forest governance. Environ. Sci. Policy 2014, 35, 12–19. [Google Scholar] [CrossRef]
  137. Humphreys, D. Logjam—Deforestation and the Crisis of Global Governance; Earthscan: London, UK, 2006. [Google Scholar]
  138. Susanti, A.; Maryudi, A. Development Narratives, Notions of Forest Crisis, and Boom of Oil Palm Plantations in Indonesia. For. Policy Econ. 2016, 73, 130–139. [Google Scholar] [CrossRef]
  139. Weatherley-Singh, J.; Gupta, A. “Embodied Deforestation” as a New EU Policy Debate to Tackle Tropical Forest Loss: Assessing Implications for REDD+ Performance. Forests 2018, 9, 751. [Google Scholar] [CrossRef] [Green Version]
  140. Derous, M.; Verhaeghe, E. When P Stands for Politics. The Role of the EU in the VPAs: A Research Agenda. For. Policy Econ. 2019, 101, 81–87. [Google Scholar] [CrossRef]
  141. Lima, M.G.B.; Harring, N.; Jagers, S.C.; Löfgren, Å.; Persson, M.; Sjöstedt, M.; Brülde, B.; Langlet, D.; Steffen, W.; Alpízar, F. Large-Scale Collective Action to Avoid an Amazon Tipping Point-Key Actors and Interventions. Curr. Res. Environ. Sustain. 2021, 3, 100048. [Google Scholar] [CrossRef]
  142. Fischer, J.; Riechers, M. A leverage points perspective on sustainability. People Nat. 2019, 1, 115–120. [Google Scholar] [CrossRef] [Green Version]
  143. Picheta, R. Timberland, Vans and the North Face Will Stop Using Brazilian Leather in Amazon Protest. CNN Business. 30 August 2019. Available online: https://edition.cnn.com/2019/08/30/business/vf-corp-brazilian-leather-amazon-scli-intl/index.html (accessed on 29 January 2022).
  144. CEPEA. Available online: http://www.cepea.esalq.usp.br/br (accessed on 29 January 2022).
  145. Anonymous; Sao Paulo, Brazil. Personal communication, 11 May 2018.
  146. Goddard, L. Brazilian Beef: Inside the Supply Chain. Global Witness. 2020. Available online: https://www.globalwitness.org/en/blog/brazilian-beef-supply-chain/ (accessed on 29 January 2022).
  147. SIDRA. Available online: https://sidra.ibge.gov.br/home/pnadcm (accessed on 29 January 2022).
  148. IBGE. Available online: https://www.ibge.gov.br/estatisticas/economicas/agricultura-e-pecuaria.html (accessed on 29 January 2022).
  149. The Ministry of Agriculture, Cattle and Supply (MAPA). Dados de Rebanho Bovino e Bubalino no Brasil—2017. Obtained 08/08/2018. 2018. Available online: http://www.agricultura.gov.br/assuntos/sanidade-animal-e-vegetal/saude-animal/programas-de-saude-animal/febre-aftosa/documentos-febre-aftosa/DadosderebanhobovinoebubalinodoBrasil_2017.pdf (accessed on 29 January 2022).
  150. TRASE. Available online: https://www.trase.earth/ (accessed on 29 January 2022).
  151. da Silva Frasão, B.; de Mattos Nascimento MR, B.; de Oliveira Costa, H.C.; Morais, H.R.; de Fátima Carrijo, K.; Biase, N.G. Quantity, Location, and Description of Bruises in Beef Cattle Slaughtered under Sanitary Inspection. Acta Sci. Vet. 2014, 42, 1192. [Google Scholar]
  152. Bertoloni, W.; Silva, J.L.; de Abreu, J.S.; Andreolla, D.L. Bem-Estar e Taxa de Hematomas de Bovinos Transportados em Diferentes Distâncias e Modelos de Carroceria no Estado do Mato Grosso—Brasil. Rev. Bras. Saúde Produção Anim. 2012, 13, 850–859. [Google Scholar] [CrossRef]
  153. Neto, A.P.; Zanco, N.; Lolatto, D.C.J.; Moreira, P.S.A.; Dromboski, T. Perdas Econômicas Ocasionadas por Lesões em Carcaças de Bovinos Abatidos em Matadouro-Frigorífico do Norte de Mato Grosso. Pesquisa Vet. Bras. 2015, 35, 324–328. [Google Scholar] [CrossRef]
  154. Warris, P.D.; Brown, S.N.; Knowles, T.G.; Kestin, S.C.; Edwards, J.E.; Dolan, S.K.; Philips, A.J. Effects on Cattle of Transport by Road for up 15 Hours. Vet. Rec. 1995, 136, 319–323. [Google Scholar] [CrossRef]
Figure 1. Leather supply chain situated within the economic system model and the opposite trajectories of the dispersal of deforestation risk and accumulation of pressure for deforestation.
Forests 13 00233 g001
Figure 2. Tannery locations within the BLA and the risk associated with their proximity to deforestation between 2005 and 2016. The insert table summarizes the BLA deforestation (km2) within 100 km radius from tannery location and incidence of total BLA deforestation for the period. Source: reproduced from Sartorato [109] with permission from Sartorato S.F. C., 2022. (see Appendix B for further methodological details).
Forests 13 00233 g002
Figure 3. Total slaughter and acquisition of tanned (wet blue) leather by tanneries and their difference per state in 2018. Source: Authors’ own elaboration based on IBGE data [113].
Forests 13 00233 g003
Publisher’s Note: MDPI stays neutral with regard to jurisdictional claims in published maps and institutional affiliations.

