Abstract
Sediment is an important part of heavy metal cycling in the coastal ecosystem, acting as a potential sink and source of inorganic and organic contaminants as environmental conditions change. The productivity of mangroves is utterly dependent on sediment enrichment. Moreover, mangrove sediment can trap pollutants discharged by households, industries, and agriculture activities. In this regard, it is essential to assess sediment quality in the presence–absence of heavy metals that are toxic to most living organisms. Thus, the question of how sediment quality is used as an index in the mangrove domain has arisen. Due to the many complex characteristics such as seasonal zones, tidal patterns, flora and fauna, and water, no specific method is used in Malaysia for assessing and monitoring mangrove sediment quality. Thus, the current study intended to develop a mangrove sediment quality index (MSQi) in the Matang mangrove forest in Perak, Malaysia. An area was selected based on the distinct level of mangrove disturbances. At 1.5 m depth, sediments were sampled in five segments (0–15, 15–30, 30–50, 50–100, and 100–150 cm). All the sediment physicochemical properties were then analysed. Fourteen variables were chosen and included in MSQi. This index categorises mangrove sediment levels as I = Very Bad, II = Bad, III = Moderate, IV = Good, and V = Excellent. MSQi will be used as a guideline in monitoring mangrove sediment pollution. In conclusion, the data analysis showed that the Sepetang River (SR) was highly disturbed, followed by the Tinggi River (TR) (moderately disturbed), and the Tiram Laut River (TLR) (least disturbed).
1. Introduction
Mangroves are one of the most productive wetlands globally [1] and can be found in the intertidal zones along tropical and subtropical coastlines [2,3]. Mangroves are vital in providing breeding and nursery grounds [4] for commercially and recreationally important fish [5]. Mangroves also help to protect coastlines from erosion, storm damage, wave action [6], and tsunamis [7]. The mangrove ecosystem consists of several significant components, including forest, soil, and the marine ecosystem [8]. Mangrove sediments are complex and highly variable, composed of the river and marine alluvium, transported as sediment and deposited in rivers and seas [9].
Mangrove sediment is an abiotic matrix made up of residues, inorganic, and organic particles that is relatively heterogeneous in terms of physicochemical and biological characteristics [10]. Sediment is also vital in the heavy metals cycling in the coastal ecosystem [11,12]. It acts as a potential sink and source of inorganic and organic contaminants [3,13,14] during changes in environmental conditions [15,16,17,18].
Sediment quality has been assessed and monitored in few sites around the world [2,19,20,21,22]. There were significant differences amongst the studies regarding locations, variables, sampling methods, and parameters. It has been reported that heavy metal pollution has an impact on the quality of mangrove sediment. Analyses of sediment quality showed that metals were deposited on the sediment surface once transported by the water body and cannot be degraded, either biologically or chemically [18]. However, these metals can only be transported from the source location or accumulate in the ecosystem [21]. The increased toxicity of heavy metals in the mangrove ecosystem has become one of the most severe environmental issues [2], causing a decline in the mangrove area [18]. High metal concentrations are derived from anthropogenic sources around mangrove estuaries, such as disturbance areas, industrial activities, agriculture activities, wastewater disposal, and discarded automobiles [2,23,24].
MSQi is an assessment of mangrove forests sediment quality and monitoring standards. The MSQi is measured using two factors: sediment contaminant concentrations and toxicity. It is also helpful in making decisions and conserving resources. MSQi supports the development and revision of the mangrove quality index (MQI). MSQi is based on standard parameters that can be used and measured, allowing for more accurate data comparison between monitoring stations at the regional, national, and global levels. These comparisons enhance the option of engaging further analyses on mangrove quality at broader geographical scales. Developing a practical sediment quality index (SQi) in mangroves is a way toward quickly identifying the extent of disturbances, impacts, and effective mitigation measures to protect resource sustainability [2].
Since there are many complex environmental factors such as seasonal zones, tidal patterns, flora and fauna, and water, there is no specific method used in Malaysia for assessing and monitoring mangrove sediment quality [2]. For example, the season plays a vital role in mangrove ecology by changing the chemical composition of sediment through harmful chemical removal and nutrient transportation. Due to the complex interactions of factors in determining the quality of mangrove sediment, a comprehensive assessment of all integrating factors at the ecosystem level is needed to select appropriate indicators that could adequately reflect its real-time health status [1]. However, not all aspects can be included when establishing the MSQi. Thus, this study was carried out to develop an MSQi for the mangrove ecosystem in Peninsular Malaysia.
2. Materials and Methods
2.1. Information on the Study Areas
This study was conducted at the Matang Mangrove Forest Reserve (MMFR) in Perak, Malaysia. MMFR is located at the borders of Malacca Strait and is shaped like a crescent moon (Figure 1). The MMFR stretches over a distance of 10.00 km from Kuala Sepetang to Taiping town. The main townships in MMFR are Kuala Sepetang, Kuala Trong, and Kerang River. Meanwhile, fishing villages are Bagan Kuala Gula, Bagan Sangga Besar, Bagan Pasir Hitam, and Bagan Panchor. The climate in MMFR is mainly equatorial, with a mean annual temperature of 23–30 °C. The average rainfall ranges from 2000—3000 mm. Moreover, the reserve experiences semidiurnal tides ranging from 1.6–2.9 m. MMFR is dominated by Rhizophora apiculata and Rhizophora mucronata species.
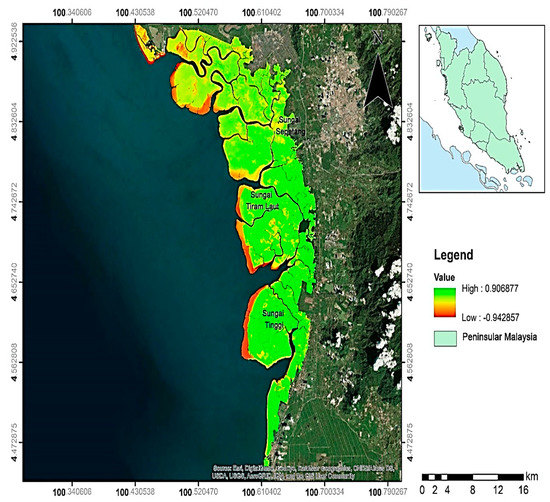
Figure 1.
The Location of the Study Area at TLR, TR, and SR in MMFR, Perak (green = least disturbed, yellow = moderately disturbed, and red = highly disturbed). Note: TLR = Sungai Tiram Laut, TR = Sungai Tinggi and SR = Sungai Sepetang.
In MMFR, working plans or management have been revised and implemented. The ten-year program provides detailed resources and schedules for harvesting, yield regulation, silvicultural operations, protection, and conservation. MMFR has been managed sustainably based on five work plans since Malaysia’s Independence Day in 1957 [17]. However, the MMFR, with its large expanse of sheltered waters, is home to 7666 floating fish cages, and cockle culture covers an area of 4726 ha, both within and outside the estuaries [25]. Mangrove forest ecosystems provide productive and complex marine habitats for diversified marine life. There are 163 species of fish, 37 species of shrimps and prawns, and 45 species of crabs that have been identified and recorded in the Sixth Revision of the Working Plan. The following are the rivers’ specific characteristics:
TLR is located near the sea mouth at 4°52′30.30″ N and 100°38′8.04″ E (Figure 2). The river’s length is approximately 8.98 km. TLR is classified as least disturbed since most of this area was converted to open water, dryland forest, and waterways for fishing boats [17].
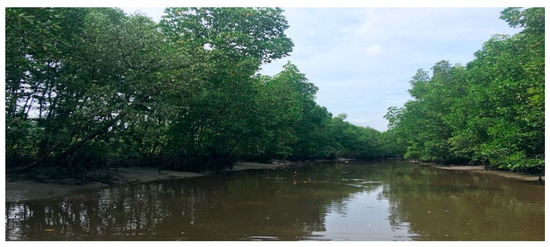
Figure 2.
TLR at MMFR, Perak.
TR is located near Kampung Pasir Hitam between 4°52′30.30″ N and 100°38′8.04″ E (Figure 3). The river’s length is ~8.1 km. Despite being closest to human development, this river is moderately disturbed due to minimal changes in mangrove land to water bodies, dryland forests, human development, agriculture, and aquaculture activities [17].
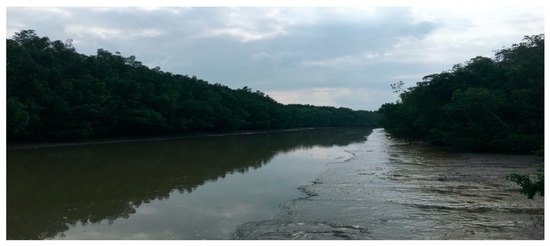
Figure 3.
TR at MMFR, Perak.
SR is near the Kuala Sepetang town, at latitude 4°52′30.30″ N and longitude 100°38′8.04″ E (Figure 4). The river’s length is ~20.4 km. As observed during sampling activities, this river is highly disturbed due to its proximity to human settlements, agriculture, aquaculture, industrial operations, and a jetty. The land had been converted into oil palm plantations, horticulture, paddy fields, aquaculture, urban settlements, and dryland forests [17].
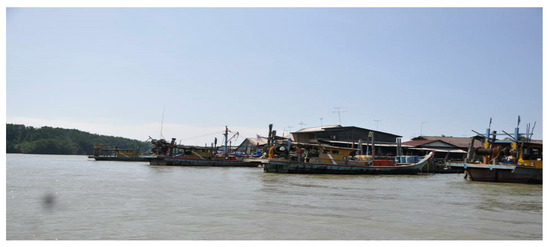
Figure 4.
SR at MMFR, Perak.
2.2. Experimental Design
The soil sampling was conducted in three rivers using the normalised difference vegetation index (NDVI) at different levels of mangrove disturbance (green = least disturbed, yellow = moderately disturbed, and red = highly disturbed) (Figure 1). A systematic sampling [26] was applied in this study, with three main plots of 450 m × 25 m established as the primary study plot from the landward, central, and seaward zones of each river. Each main plot contained five 5 m × 5 m subplots, with a distance of 100 m between each subplot. Five 1 m × 1 m mini subplots were established for sediment sampling (Figure 5). GPSMAP® 60CSx Garmin was used to record the sampling points.
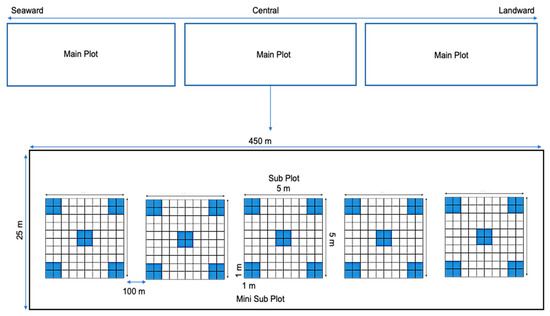
Figure 5.
Sampling plot design from landward to seaward.
2.3. Sediment Sampling and Laboratory Analysis
Seven hundred and fifty sediment samples were collected from five mini subplots along the same transect. The sediment samples were taken using a peat auger [27,28] in two seasons: November and December 2017 (wet season) and March and April 2018 (dry season). This study obtained a total of 2250 sediment samples at five depths, i.e., 0–15, 15–30, 30–50, 50–100, and 100–150 cm, because sediment depths can also influence pollution [2,28]. The sediment samples were placed into a labelled plastic bag before being transported to the soil laboratory for analysis.
Sediment samples were characterised for physical and chemical properties. Sediment texture was determined using the hydrometer method [29,30]. Sediment pH was measured in a 1:2.5 ratio (sediment: distilled water) using an electrode pH meter (Model MW 100, Milwaukee, Italy) [31,32]. Total Nitrogen was analysed using the Kjeldahl method [26,33]. Phosphorus was determined using the blue method and a double acid method [26,32,34]. Subsequently, samples were examined using an ultraviolet-visible (UV/Vis) spectrophotometer with a specific wavelength (Model Cary 50 Scan UV/V Spectrophotometer) [35]. Aqua regia method was used to extract and digest the sediments [32,36]. Finally, samples were analysed for heavy metals and base cations using an atomic absorption spectrophotometer (AAS, Model Shimadzu AA-6800) with specific flame and wavelength settings.
2.4. Statistical Analysis
The data were analysed using a statistical analysis system (SAS) software version 9.4 for descriptive analysis. The statistical package for the social sciences (SPSS) version 25 was used for principal component analysis (PCA) to reduce the covariance and correlation matrix [37] and identify important MSQi parameters. Microsoft Excel 2020 was used to create the mangrove sediment degree of pollution table (MSDPT) and MSQi formulation model.
PCA was performed on all measured sediment variables to determine variables with the highest score, more significant than 0.75. PCA, when combined with a coefficient of linear correlation, provides a multi-dimensional statistical test of the studied variables [38]. PCA is widely used in various sediment fields, including sediment assessment [2,21,39]. The most significant variables were determined using PCA and are characterised by the highest score component of each principal component (PC). Each PC is derived from a linear combination of the p metrics. The first component has been extracted and accounts for the second-largest amount of variance that remains after associated with the first extracted component. The second extracted accounts for the second-largest amount of variance.
2.5. Development of MSQi
PCA was conducted on all measured sediment parameters to develop the index using the steps outlined below:
- STEP 1:
- Fourteen of the nineteen parameters were chosen for PCA analysis because they were grouped in one unit (mg/kg) to reduce bias in PCA analysis. The fourteen parameters are Nitrogen (N), Phosphorus (P), Potassium (K), Cal-cium (Ca), Magnesium (Mg), Sodium (Na), Manganese (Mn), Iron (Fe), Lead (Pb), Zinc (Zn), Copper (Cu), Cadmium (Cd), Chromium (Cr), and Nickel (Ni).
- STEP 2:
- Kaiser-Meyer-Olkin (KMO) measure of sampling adequacy with KMO value >0.600 was tested to ensure that the relationship between the data in the observation is adequate. If the KMO value < 0.600, the data are insufficient to run the PCA [40].
- STEP 3:
- Essential parameters in the component were identified, where the highest score of the PC grouped these parameters.
- STEP 4:
- In PCA, two results were obtained: component matrix and rotated component matrix. The proportion of the variability explained by each important component was identified. For example, four crucial parameter factors (PFs) were selected: P(Xi), P(Xii), P(Xiii), and P(Xiv).
- STEP 5:
- Each suggested critical PF concentration in the sediment was rated as 0 (low), 1 (medium), and 2 (high), based on the permissible limit range for soil and plant [41], as presented in Table A1 (Appendix A).
- STEP 6:
- The PFs ratings were referred to the MSDPT (see Figure A1, Appendix A).
- STEP 7:
- These MSDPT was developed by summation of these parameters. Σ MSDPT = P(Xi) + P(Xii) + P(Xiii) + P(Xiv).
- STEP 8:
- MSQi was developed by classifying MSDPT as I (very bad), II (bad), III (moderate), IV (good), and V (excellent) (see Table A2, Appendix A).
- STEP 9:
- A simplified format has been developed to facilitate MSQi modelling (see Table A3, Appendix A).
3. Results
3.1. Development of MSQi
Since PCA was used to analyse fourteen parameters, only the highest four were extracted to strengthen MSQi development. The KMO test was performed; the results that were significant at <0.001 with adequacy of 0.747 (Table 1) were used in the PCA analysis [42].

Table 1.
KMO measure of sampling adequacy.
MSQi development involved PCA to interpret sediment chemical composition and calculate the pollution score. PCA’s primary function is to reduce the complexity of the loading factors [37]. PCA also works as an indicator of anthropogenic sediment pollution. Component loading greater than 0.750 indicates “strong”, values between 0.500 to 0.750 indicate “moderate”, and values between 0.500 to 0.000 indicate “weak”. Only the “strong” values were taken in MSQi modelling. In this study, at least 200 data points were selected to run the PCA [37]. Other missing chemical parameters should be included to improve the PCA loading value in the MSQi formulation. Table 2 and Table 3 presents the PCA results.
Table 2.
Component matrix.
Table 3.
Rotated component matrix.
Table 3 shows the rotated component matrixa, where six PCs were obtained, and shows the contribution of each parameter in the group. As a result, for PC1: Pb and Zn received the highest score values of 0.841 and 0.883, respectively. PC2: Cr and Ni had the highest score values of 0.912 and 0.913, respectively. PC3: N received the highest score value of 0.876. PC4: K had the highest score value of 0.887. PC5: Mg obtained the highest score value of 0.887. Finally, PC6: Ca had the highest score value of 0.796. Only the two most vital PCs, PC1 and PC2, were included in MSQi modelling, with Pb, Zn, Cr, and Ni were the four MSQi parameters. Figure 6 shows the component plot in rotated space. The red circle represents a strong correlation between all parameters.
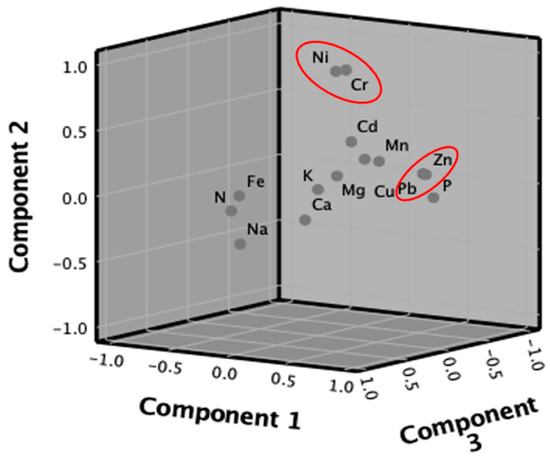
Figure 6.
Component plot in rotated space.
Table 4 shows the PF. The World Health Organisation (WHO) guidelines for soil and plants were used to calculate the PF values [38]. Permissible limit PF values were divided into three categories: low, medium, and high concentrations using ratings 0, 1, and 2.
Table 4.
Permissible limit for PF from WHO guidelines for soil and plants [41].
Table 5 shows an example simulation using a random MSDPT table (Figure A1) (Appendix A). The obtained code of MSDPT was 1 2 0 2. This score value was used in Table 5 to calculate the MSQi class. When the MSDPT was obtained, the value was then referred to the rating of MSQi Index at Table 6. Our result showed that the MSDPT score is 5 (Table 6) and falls into Class II (Table 6), indicating that the description of the areas is highly polluted.
Table 5.
Example simulation using random value of MSDPT range code.
Table 6.
Rating of MSQi.
3.2. MSQi of TLR during Dry and Wet Seasons
The MSQi of TLR during the dry season is illustrated in Table A4 (Appendix A). The result showed that the MSQi of the landward zone at a sediment depth of 0–15 cm was in Class III, followed by a moderate rating, indicating that the sediment was moderately polluted. However, MSQi of sediment depths of 15–30, 30–50, 50–100, and 100–150 cm was obtained under Class IV, indicating a good rating. In central and seaward zones of the TLR, MSQi in all sediment depths was obtained under MSQi Class IV with a good rating, indicating that the sediment in this area was less polluted. During the wet season, MSQi at landward, central, and seaward zones changed to Class IV: less polluted (Table A5 Appendix A) due to heavy metal (HMs) content dilution [43] with flooded river water [39,44]. In TLR, all the heavy metal content (Pb, Zn, Cr, and Ni) during the wet season at all mangrove zones and sediment depths were below the permissible limit of WHO guidelines for soil and plants [41]. Therefore, mangrove sediment pollution in this river was at lower risk than in the surrounding area.
3.3. MSQi of TR during Dry and Wet Seasons
The MSQi of TR during the dry season is illustrated in Table A6 (Appendix A). The results showed that MSQi in landward and central zones in all sediment depths were obtained with Class III and a moderate rating. However, MSQi at seaward in sediment depths of 30–50 and 50–100 cm was obtained under MSQi Class IV with less pollution. Meanwhile, Table A7 (Appendix A) depicts MSQi during the wet season. The results revealed that MSQi in a landward zone at all sediment depths was obtained with a III score, indicating that the area was moderately polluted. In contrast, sediment depths of 30–50 cm were discovered in Class IV with less polluted conditions. The same result was obtained in the central and seaward of TR, where sediment in-depths of 0–15 and 15–30 cm were obtained under MSQi Class III, and the rating was moderate. However, under MSQi Class IV, sediment depths of 30–50, 50–100, and 100–150 cm were obtained, and the rating was good.
3.4. MSQi of SR during Dry and Wet Seasons
The MSQi of SR during the dry season is illustrated in Table A8 (Appendix A). The results showed that MSQi of SR during the dry season was obtained under MSQi Class III, with a moderate rating, at landward, central, and seaward zones. Meanwhile, the MSQi of SR during the wet season is shown in Table A9 (Appendix A). MSQi results in the central zone of SR revealed that all sediment depths ranging from 0–15, 15–30, and 100–150 cm were classified as MSQi Class III (moderate).
4. Discussion
TLR has been classified as least disturbed because most of this area has been converted to open waterand dryland forest [17]. This river also serves as a waterway for fishing boats from Kuala Sepetang Jetty, Kuala Trong Jetty, and Kg. Pasir Hitam Jetty. As this area was categorised as low polluted, the source of heavy metals from landward and seaward during the dry and wet seasons was runoff [39]. The top layer of sediment contained high metal concentrations due to pollutant migration from the landward zone [45]. This pollution migration is influenced by many factors, such as rainfall, tidal, sediment type, the porosity of sediment, type of vegetation cover, and others [43]. Moreover, sediment contaminations with Pb, Zn, Cr, and Ni are common in many environments. For example, lead came from the historical use of leaded fuels, zinc from galvanised steel, and increasing copper content from the passive leaching of antifouling paints [15,35].
From this study, the findings showed that pollution indeed had an impact on TR. Due to land changes into the water body, dryland forest, human settlement, agriculture, and aquaculture practices, this river is classified as moderately disturbed [14]. Furthermore, as a waterway, this river is opened to fishermen’s boats. Overall, the Pb, Cu, Zn, and Ni content of TR during the dry season in all mangrove zones and sediment depths were below the WHO guidelines for soil and plants [41]. Therefore, mangrove sediment pollution in TR is at low risk than in the surrounding communities.
Meanwhile, SR is highly disturbed due to its proximity to human settlements, agriculture, aquaculture, industrial operations, and a jetty. SR had been converted to oil palm, horticulture, paddy field, aquaculture, urban settlement, and dryland [17]. Hence, the tidal process increased most of these metals content during dry seasons. During high tide, river water flows from seaward to landward and vice versa during low tide [43]. Under these circumstances, pollution remains suspended in sediment in both directions (seaward and landward).
5. Conclusions
During the dry season, TLR was moderately polluted (Class III). However, the MSQi became less polluted during the wet season (Class IV). On the other hand, TR was classified as Class III (moderately polluted) during the dry season, except at seaward at sediment depths of 30–50 and 50–100 cm (Class IV: less polluted). During the wet season, the TR was moderately polluted to less polluted. Lastly, during the dry season, the SR was classified as Class III with moderate pollution, while less polluted during the wet season. Therefore, based on the findings of this study, it can be concluded that sediment depths have an impact on pollution. The MSQi development will serve as an essential benchmark and guideline for assessing sediment pollution in Malaysia’s mangrove ecosystem. The application of MSQi will reduce time and cost in monitoring the mangrove sediment quality compared with current practices.
Author Contributions
Conceptualisation, A.M.M.P., S.G., A.A.N. and M.B.A.; methodology, A.M.M.P. and M.B.A.; formal analysis, A.M.M.P. and W.R.K.; writing—original draft preparation, A.M.M.P.; writing—review and editing, S.G., M.B.A. and W.R.K.; visualisation, A.M.M.P., S.G. and M.B.A.; supervision S.G., A.A.N. and M.B.A.; project administration, A.M.M.P.; funding acquisition, A.M.M.P. and S.G. All authors have read and agreed to the published version of the manuscript.
Funding
This work was supported by IPS Grant: Vot No. 9609900 and FRGS Grant Vot No. 5540232, Universiti Putra Malaysia.
Institutional Review Board Statement
Not applicable.
Informed Consent Statement
Not applicable.
Data Availability Statement
The data presented in this study are available within the article.
Acknowledgments
The authors would like to extend their special thanks to Universiti Putra Malaysia for funding this project. The contribution and assistance from the Perak Forestry Department and all staff from the Faculty of Forestry and Environment, Universiti Putra Malaysia, are greatly appreciated. Our research team really appreciate the contribution of (Late) Mohd Bakri Adam (20 August 2021). No one can replace you.
Conflicts of Interest
The authors declare no conflict of interest.
Appendix A
Table A1.
Simulation in determination of PF for low, medium, and high.
Table A1.
Simulation in determination of PF for low, medium, and high.
| MSQi Parameter | Low (Unit) Rating 0 | Medium (Unit) Rating 1 | High (Unit) Rating 2 |
|---|---|---|---|
| P(Xi) | X ≤ P(Xi) * | P(Xi) * < X < P(Xi) ** | X ≥ P(Xi) ** |
| P(Xii) | X ≤ P(Xii) * | P(Xii) * < X < P(Xii) ** | X ≥ P(Xii) ** |
| P(Xiii) | X ≤ P(Xiii) * | P(Xiii) * < X < P(Xiii) ** | X ≥ P(Xiii) ** |
| P(Xiv) | X ≤ P(Xiv) * | P(Xiv) * < X < P(Xiv) ** | X ≥ P(Xiv) ** |
* and ** = Value of MSQi parameters.
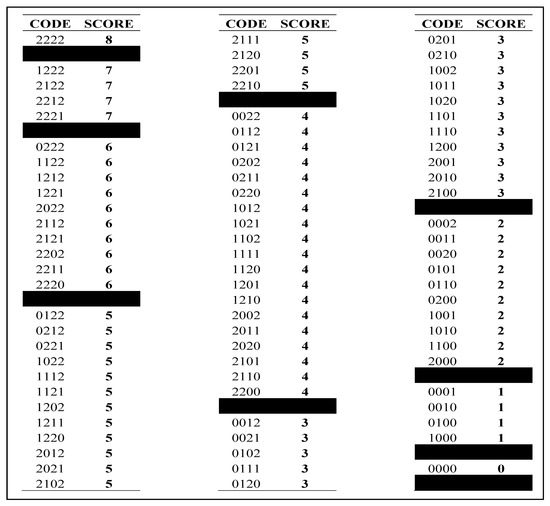
Figure A1.
Simulation of MSDPT.
Table A2.
Simulation MSQi.
Table A2.
Simulation MSQi.
| MSDPT Range | MSQi Class | Description |
|---|---|---|
| If 7.00 ≥ X ≥ 8.00 | I | Highly Polluted |
| If 5.00 ≥ X ≥ 6.99 | II | High Polluted |
| If 4.00 ≥ X ≥ 4.99 | III | Moderately Polluted |
| If 2.00 ≥ X ≥ 3.99 | IV | Low Polluted |
| If 0.0 ≥ X ≥ 1.99 | V | Not Polluted |
Table A3.
Example Simulation of MSQi.
Table A3.
Example Simulation of MSQi.
| MANGROVE SEDIMENT QUALITY INDEX (MSQi). | |||||||||
|---|---|---|---|---|---|---|---|---|---|
| River | Zone | Depth (cm) | MSQi Parameter | Median | MSDPT | ∑ MSDPT SCORE | MSQi CLASS | Rating | Description |
| Tiram Laut River | Landward | 0–15 | x | x | x | x | x | x | x |
| x | x | x | |||||||
| x | x | x | |||||||
| x | x | x | |||||||
| 15–30 | x | x | x | x | x | x | x | ||
| x | x | x | |||||||
| x | x | x | |||||||
| x | x | x | |||||||
| 30–50 | x | x | x | x | x | x | x | ||
| x | x | x | |||||||
| x | x | x | |||||||
| x | x | x | |||||||
| 50–100 | x | x | x | x | x | x | x | ||
| x | x | x | |||||||
| x | x | x | |||||||
| x | x | x | |||||||
| 100–150 | x | x | x | x | x | x | x | ||
| x | x | x | |||||||
| x | x | x | |||||||
| x | x | x | |||||||
| Central | 0–15 | x | x | x | x | x | x | x | |
| x | x | x | |||||||
| x | x | x | |||||||
| x | x | x | |||||||
| 15–30 | x | x | x | x | x | x | x | ||
| x | x | x | |||||||
| x | x | x | |||||||
| x | x | x | |||||||
| 30–50 | x | x | x | x | x | x | x | ||
| x | x | x | |||||||
| x | x | x | |||||||
| x | x | x | |||||||
| 50–100 | x | x | x | x | x | x | x | ||
| x | x | x | |||||||
| x | x | x | |||||||
| x | x | x | |||||||
| 100–150 | x | x | x | x | x | x | x | ||
| x | x | x | |||||||
| x | x | x | |||||||
| x | x | x | |||||||
| Seaward | 0–15 | x | x | x | x | x | x | x | |
| x | x | x | |||||||
| x | x | x | |||||||
| x | x | x | |||||||
| 15–30 | x | x | x | x | x | x | x | ||
| x | x | x | |||||||
| x | x | x | |||||||
| x | x | x | |||||||
| 30–50 | x | x | x | x | x | x | x | ||
| x | x | x | |||||||
| x | x | x | |||||||
| x | x | x | |||||||
| 50–100 | x | x | x | x | x | x | x | ||
| x | x | x | |||||||
| x | x | x | |||||||
| x | x | x | |||||||
| 100–150 | x | x | x | x | x | x | x | ||
| x | x | x | |||||||
| x | x | x | |||||||
| x | x | x | |||||||
Table A4.
MSQi in TLR of MMFR, Perak during dry season.
Table A4.
MSQi in TLR of MMFR, Perak during dry season.
| MANGROVE SEDIMENT QUALITY INDEX (MSQi) | |||||||||
|---|---|---|---|---|---|---|---|---|---|
| River | Zone | Depth (cm) | MSQi Parameter | Median | MSDPT | ∑ MSDPT SCORE | MSQi CLASS | Rating | Description |
| Tiram Laut River | Landward | 0–15 | Pb | 3.836 | 1 | 3 | III | Moderate | Moderately Polluted |
| Zn | 25.310 | 1 | |||||||
| Cr | 1.915 | 1 | |||||||
| Ni | 0.982 | 0 | |||||||
| 15–30 | Pb | 1.368 | 0 | 2 | IV | Good | Low Polluted | ||
| Zn | 16.926 | 1 | |||||||
| Cr | 1.755 | 1 | |||||||
| Ni | 0.900 | 0 | |||||||
| 30–50 | Pb | 5.014 | 1 | 2 | IV | Good | Low Polluted | ||
| Zn | 22.370 | 1 | |||||||
| Cr | 0.445 | 0 | |||||||
| Ni | 2.280 | 0 | |||||||
| 50–100 | Pb | 3.418 | 1 | 2 | IV | Good | Low Polluted | ||
| Zn | 22.730 | 1 | |||||||
| Cr | 0.507 | 0 | |||||||
| Ni | 2.600 | 0 | |||||||
| 100–150 | Pb | 1.368 | 0 | 1 | IV | Good | Low Polluted | ||
| Zn | 18.984 | 1 | |||||||
| Cr | 0.577 | 0 | |||||||
| Ni | 2.960 | 0 | |||||||
| Central | 0–15 | Pb | 5.242 | 1 | 2 | IV | Good | Low Polluted | |
| Zn | 23.202 | 1 | |||||||
| Cr | 1.277 | 0 | |||||||
| Ni | 3.547 | 0 | |||||||
| 15–30 | Pb | 2.596 | 1 | 2 | IV | Good | Low Polluted | ||
| Zn | 16.406 | 1 | |||||||
| Cr | 1.170 | 0 | |||||||
| Ni | 3.000 | 0 | |||||||
| 30–50 | Pb | 2.190 | 1 | 2 | IV | Good | Low Polluted | ||
| Zn | 17.336 | 1 | |||||||
| Cr | 0.296 | 0 | |||||||
| Ni | 1.520 | 0 | |||||||
| 50–100 | Pb | 4.786 | 1 | 2 | IV | Good | Low Polluted | ||
| Zn | 25.620 | 1 | |||||||
| Cr | 0.338 | 0 | |||||||
| Ni | 1.733 | 0 | |||||||
| 100–150 | Pb | 5.014 | 1 | 2 | IV | Good | Low Polluted | ||
| Zn | 26.970 | 1 | |||||||
| Cr | 0.385 | 0 | |||||||
| Ni | 1.973 | 0 | |||||||
| Seaward | 0–15 | Pb | 5.926 | 1 | 2 | IV | Good | Low Polluted | |
| Zn | 21.750 | 1 | |||||||
| Cr | 0.957 | 0 | |||||||
| Ni | 0.910 | 0 | |||||||
| 15–30 | Pb | 6.520 | 1 | 2 | IV | Good | Low Polluted | ||
| Zn | 19.542 | 1 | |||||||
| Cr | 0.878 | 0 | |||||||
| Ni | 0.680 | 0 | |||||||
| 30–50 | Pb | 3.506 | 1 | 2 | IV | Good | Low Polluted | ||
| Zn | 16.492 | 1 | |||||||
| Cr | 0.222 | 0 | |||||||
| Ni | 1.140 | 0 | |||||||
| 50–100 | Pb | 5.014 | 1 | 2 | IV | Good | Low Polluted | ||
| Zn | 19.158 | 1 | |||||||
| Cr | 0.254 | 0 | |||||||
| Ni | 1.300 | 0 | |||||||
| 100–150 | Pb | 4.558 | 1 | 2 | IV | Good | Low Polluted | ||
| Zn | 20.708 | 1 | |||||||
| Cr | 0.289 | 0 | |||||||
| Ni | 1.480 | 0 | |||||||
Table A5.
MSQi in TLR of MMFR, Perak during wet season.
Table A5.
MSQi in TLR of MMFR, Perak during wet season.
| MANGROVE SEDIMENT QUALITY INDEX (MSQi) | |||||||||
|---|---|---|---|---|---|---|---|---|---|
| River | Zone | Depth (cm) | MSQi Parameter | Median | MSDPT | ∑ MSDPT SCORE | MSQi CLASS | Rating | Description |
| Tiram Laut River | Landward | 0–15 | Pb | 9.800 | 1 | 2 | IV | Good | Low Polluted |
| Zn | 24.280 | 1 | |||||||
| Cr | 1.111 | 0 | |||||||
| Ni | 1.553 | 0 | |||||||
| 15–30 | Pb | 3.290 | 1 | 2 | IV | Good | Low Polluted | ||
| Zn | 15.426 | 1 | |||||||
| Cr | 1.018 | 0 | |||||||
| Ni | 0.220 | 0 | |||||||
| 30–50 | Pb | 4.102 | 1 | 2 | IV | Good | Low Polluted | ||
| Zn | 20.498 | 1 | |||||||
| Cr | 0.258 | 0 | |||||||
| Ni | 1.322 | 0 | |||||||
| 50–100 | Pb | 6.380 | 1 | 2 | IV | Good | Low Polluted | ||
| Zn | 20.882 | 1 | |||||||
| Cr | 0.294 | 0 | |||||||
| Ni | 1.508 | 0 | |||||||
| 100–150 | Pb | 6.380 | 1 | 2 | IV | Good | Low Polluted | ||
| Zn | 19.568 | 1 | |||||||
| Cr | 0.335 | 0 | |||||||
| Ni | 1.717 | 0 | |||||||
| Central | 0–15 | Pb | 2.734 | 1 | 2 | IV | Good | Low Polluted | |
| Zn | 14.720 | 1 | |||||||
| Cr | 0.740 | 0 | |||||||
| Ni | 3.797 | 0 | |||||||
| 15–30 | Pb | 3.874 | 1 | 2 | IV | Good | Low Polluted | ||
| Zn | 19.964 | 1 | |||||||
| Cr | 0.679 | 0 | |||||||
| Ni | 3.480 | 0 | |||||||
| 30–50 | Pb | 4.646 | 1 | 2 | IV | Good | Low Polluted | ||
| Zn | 18.378 | 1 | |||||||
| Cr | 0.172 | 0 | |||||||
| Ni | 0.882 | 0 | |||||||
| 50–100 | Pb | 4.102 | 1 | 2 | IV | Good | Low Polluted | ||
| Zn | 19.282 | 1 | |||||||
| Cr | 0.196 | 0 | |||||||
| Ni | 1.005 | 0 | |||||||
| 100–150 | Pb | 1.956 | 0 | 1 | IV | Good | Low Polluted | ||
| Zn | 14.744 | 1 | |||||||
| Cr | 0.223 | 0 | |||||||
| Ni | 1.145 | 0 | |||||||
| Seaward | 0–15 | Pb | 2.878 | 1 | 2 | IV | Good | Low Polluted | |
| Zn | 14.880 | 1 | |||||||
| Cr | 0.555 | 0 | |||||||
| Ni | 2.848 | 0 | |||||||
| 15–30 | Pb | 5.014 | 1 | 2 | IV | Good | Low Polluted | ||
| Zn | 17.646 | 1 | |||||||
| Cr | 0.509 | 0 | |||||||
| Ni | 2.610 | 0 | |||||||
| 30–50 | Pb | 2.734 | 1 | 2 | IV | Good | Low Polluted | ||
| Zn | 14.856 | 1 | |||||||
| Cr | 0.129 | 0 | |||||||
| Ni | 0.661 | 0 | |||||||
| 50–100 | Pb | 2.962 | 1 | 2 | IV | Good | Low Polluted | ||
| Zn | 16.170 | 1 | |||||||
| Cr | 0.147 | 0 | |||||||
| Ni | 0.754 | 0 | |||||||
| 100–150 | Pb | 3.874 | 1 | 2 | IV | Good | Low Polluted | ||
| Zn | 14.744 | 1 | |||||||
| Cr | 0.167 | 0 | |||||||
| Ni | 0.858 | 0 | |||||||
Table A6.
MSQi in TR of MMFR, Perak during dry season.
Table A6.
MSQi in TR of MMFR, Perak during dry season.
| MANGROVE SEDIMENT QUALITY INDEX (MSQi) | |||||||||
|---|---|---|---|---|---|---|---|---|---|
| River | Zone | Depth (cm) | MSQi Parameter | Median | MSDPT | ∑ MSDPT SCORE | MSQi CLASS | Rating | Description |
| Tinggi River | Landward | 0–15 | Pb | 4.330 | 1 | 3 | III | Moderate | Moderately Polluted |
| Zn | 16.418 | 1 | |||||||
| Cr | 9.575 | 1 | |||||||
| Ni | 6.425 | 0 | |||||||
| 15–30 | Pb | 5.926 | 1 | 3 | III | Moderate | Moderately Polluted | ||
| Zn | 19.134 | 1 | |||||||
| Cr | 8.775 | 1 | |||||||
| Ni | 4.700 | 0 | |||||||
| 30–50 | Pb | 7.492 | 1 | 3 | III | Moderate | Moderately Polluted | ||
| Zn | 23.958 | 1 | |||||||
| Cr | 2.223 | 1 | |||||||
| Ni | 2.850 | 0 | |||||||
| 50–100 | Pb | 7.064 | 1 | 3 | III | Moderate | Moderately Polluted | ||
| Zn | 25.656 | 1 | |||||||
| Cr | 2.535 | 1 | |||||||
| Ni | 3.250 | 0 | |||||||
| 100–150 | Pb | 7.292 | 1 | 3 | III | Moderate | Moderately Polluted | ||
| Zn | 22.644 | 1 | |||||||
| Cr | 2.886 | 1 | |||||||
| Ni | 3.700 | 0 | |||||||
| Central | 0–15 | Pb | 6.608 | 1 | 3 | III | Moderate | Moderately Polluted | |
| Zn | 21.478 | 1 | |||||||
| Cr | 6.383 | 1 | |||||||
| Ni | 8.183 | 0 | |||||||
| 15–30 | Pb | 8.888 | 1 | 3 | III | Moderate | Moderately Polluted | ||
| Zn | 24.540 | 1 | |||||||
| Cr | 5.850 | 1 | |||||||
| Ni | 7.500 | 0 | |||||||
| 30–50 | Pb | 6.154 | 1 | 3 | III | Moderate | Moderately Polluted | ||
| Zn | 28.148 | 1 | |||||||
| Cr | 1.482 | 1 | |||||||
| Ni | 1.900 | 0 | |||||||
| 50–100 | Pb | 4.102 | 1 | 3 | III | Moderate | Moderately Polluted | ||
| Zn | 19.422 | 1 | |||||||
| Cr | 1.690 | 1 | |||||||
| Ni | 2.167 | 0 | |||||||
| 100–150 | Pb | 6.836 | 1 | 3 | III | Moderate | Moderately Polluted | ||
| Zn | 23.474 | 1 | |||||||
| Cr | 1.924 | 1 | |||||||
| Ni | 2.467 | 0 | |||||||
| Seaward | 0–15 | Pb | 9.036 | 1 | 3 | III | Moderate | Moderately Polluted | |
| Zn | 24.330 | 1 | |||||||
| Cr | 4.787 | 1 | |||||||
| Ni | 6.138 | 0 | |||||||
| 15–30 | Pb | 4.102 | 1 | 3 | III | Moderate | Moderately Polluted | ||
| Zn | 15.910 | 1 | |||||||
| Cr | 3.563 | 1 | |||||||
| Ni | 5.625 | 0 | |||||||
| 30–50 | Pb | 7.976 | 1 | 2 | IV | Good | Low Polluted | ||
| Zn | 22.606 | 1 | |||||||
| Cr | 1.112 | 0 | |||||||
| Ni | 1.425 | 0 | |||||||
| 50–100 | Pb | 4.558 | 1 | 2 | IV | Good | Low Polluted | ||
| Zn | 16.716 | 1 | |||||||
| Cr | 1.268 | 0 | |||||||
| Ni | 1.625 | 0 | |||||||
| 100–150 | Pb | 6.608 | 1 | 3 | III | Moderate | Moderately Polluted | ||
| Zn | 23.140 | 1 | |||||||
| Cr | 1.443 | 1 | |||||||
| Ni | 1.850 | 0 | |||||||
Table A7.
MSQi in TR of MMFR, Perak during wet season.
Table A7.
MSQi in TR of MMFR, Perak during wet season.
| MANGROVE SEDIMENT QUALITY INDEX (MSQi) | |||||||||
|---|---|---|---|---|---|---|---|---|---|
| River | Zone | Depth (cm) | MSQi Parameter | Median | MSDPT | ∑ MSDPT SCORE | MSQi CLASS | Rating | Description |
| Tinggi River | Landward | 0–15 | Pb | 8.592 | 1 | 3 | III | Moderate | Moderately Polluted |
| Zn | 36.726 | 1 | |||||||
| Cr | 5.553 | 1 | |||||||
| Ni | 7.120 | 0 | |||||||
| 15–30 | Pb | 7.814 | 1 | 3 | III | Moderate | Moderately Polluted | ||
| Zn | 37.780 | 1 | |||||||
| Cr | 5.108 | 1 | |||||||
| Ni | 6.525 | 0 | |||||||
| 30–50 | Pb | 8.038 | 1 | 2 | IV | Good | Low Polluted | ||
| Zn | 38.836 | 1 | |||||||
| Cr | 1.289 | 0 | |||||||
| Ni | 1.653 | 0 | |||||||
| 50–100 | Pb | 7.592 | 1 | 3 | III | Moderate | Moderately Polluted | ||
| Zn | 38.902 | 1 | |||||||
| Cr | 1.470 | 1 | |||||||
| Ni | 1.885 | 0 | |||||||
| 100–150 | Pb | 8.484 | 1 | 3 | III | Moderate | Moderately Polluted | ||
| Zn | 46.110 | 1 | |||||||
| Cr | 1.674 | 1 | |||||||
| Ni | 2.146 | 0 | |||||||
| Central | 0–15 | Pb | 6.476 | 1 | 3 | III | Moderate | Moderately Polluted | |
| Zn | 37.252 | 1 | |||||||
| Cr | 3.702 | 1 | |||||||
| Ni | 4.746 | 0 | |||||||
| 15–30 | Pb | 5.358 | 1 | 3 | III | Moderate | Moderately Polluted | ||
| Zn | 34.000 | 1 | |||||||
| Cr | 3.393 | 1 | |||||||
| Ni | 4.350 | 0 | |||||||
| 30–50 | Pb | 6.922 | 1 | 2 | IV | Good | Low Polluted | ||
| Zn | 33.934 | 1 | |||||||
| Cr | 0.860 | 0 | |||||||
| Ni | 1.102 | 0 | |||||||
| 50–100 | Pb | 7.146 | 1 | 2 | IV | Good | Low Polluted | ||
| Zn | 36.180 | 1 | |||||||
| Cr | 1.018 | 0 | |||||||
| Ni | 1.257 | 0 | |||||||
| 100–150 | Pb | 7.368 | 1 | 2 | IV | Good | Low Polluted | ||
| Zn | 34.704 | 1 | |||||||
| Cr | 1.116 | 0 | |||||||
| Ni | 1.431 | 0 | |||||||
| Seaward | 0–15 | Pb | 6.698 | 1 | 3 | III | Moderate | Moderately Polluted | |
| Zn | 32.814 | 1 | |||||||
| Cr | 2.777 | 1 | |||||||
| Ni | 3.560 | 0 | |||||||
| 15–30 | Pb | 8.484 | 1 | 3 | III | Moderate | Moderately Polluted | ||
| Zn | 34.880 | 1 | |||||||
| Cr | 2.545 | 1 | |||||||
| Ni | 3.263 | 0 | |||||||
| 30–50 | Pb | 8.494 | 1 | 2 | IV | Good | Low Polluted | ||
| Zn | 40.176 | 1 | |||||||
| Cr | 0.645 | 0 | |||||||
| Ni | 0.827 | 0 | |||||||
| 50–100 | Pb | 8.262 | 1 | 2 | IV | Good | Low Polluted | ||
| Zn | 33.956 | 1 | |||||||
| Cr | 0.735 | 0 | |||||||
| Ni | 0.943 | 0 | |||||||
| 100–150 | Pb | 7.368 | 1 | 2 | IV | Good | Low Polluted | ||
| Zn | 37.252 | 1 | |||||||
| Cr | 0.837 | 0 | |||||||
| Ni | 1.109 | 0 | |||||||
Table A8.
MSQi in SR of MMFR, Perak during dry season.
Table A8.
MSQi in SR of MMFR, Perak during dry season.
| MANGROVE SEDIMENT QUALITY INDEX (MSQi) | |||||||||
|---|---|---|---|---|---|---|---|---|---|
| River | Zone | Depth (cm) | MSQi Parameter | Median | MSDPT | ∑ MSDPT SCORE | MSQi CLASS | Rating | Description |
| Sepetang River | Landward | 0–15 | Pb | 7.592 | 1 | 3 | III | Moderate | Moderately Polluted |
| Zn | 43.516 | 1 | |||||||
| Cr | 4.596 | 1 | |||||||
| Ni | 4.910 | 0 | |||||||
| 15–30 | Pb | 8.484 | 1 | 3 | III | Moderate | Moderately Polluted | ||
| Zn | 38.506 | 1 | |||||||
| Cr | 3.280 | 1 | |||||||
| Ni | 3.500 | 0 | |||||||
| 30–50 | Pb | 5.582 | 1 | 3 | III | Moderate | Moderately Polluted | ||
| Zn | 28.462 | 1 | |||||||
| Cr | 2.668 | 1 | |||||||
| Ni | 3.420 | 0 | |||||||
| 50–100 | Pb | 3.796 | 1 | 3 | III | Moderate | Moderately Polluted | ||
| Zn | 28.418 | 1 | |||||||
| Cr | 3.042 | 1 | |||||||
| Ni | 2.900 | 0 | |||||||
| 100–150 | Pb | 6.028 | 1 | 3 | III | Moderate | Moderately Polluted | ||
| Zn | 27.054 | 1 | |||||||
| Cr | 3.463 | 1 | |||||||
| Ni | 2.440 | 0 | |||||||
| Central | 0–15 | Pb | 7.592 | 1 | 3 | III | Moderate | Moderately Polluted | |
| Zn | 34.044 | 1 | |||||||
| Cr | 3.064 | 1 | |||||||
| Ni | 3.273 | 0 | |||||||
| 15–30 | Pb | 6.476 | 1 | 3 | III | Moderate | Moderately Polluted | ||
| Zn | 34.528 | 1 | |||||||
| Cr | 2.529 | 1 | |||||||
| Ni | 3.000 | 0 | |||||||
| 30–50 | Pb | 5.805 | 1 | 3 | III | Moderate | Moderately Polluted | ||
| Zn | 31.186 | 1 | |||||||
| Cr | 1.778 | 1 | |||||||
| Ni | 2.280 | 0 | |||||||
| 50–100 | Pb | 8.038 | 1 | 3 | III | Moderate | Moderately Polluted | ||
| Zn | 37.450 | 1 | |||||||
| Cr | 2.028 | 1 | |||||||
| Ni | 2.600 | 0 | |||||||
| 100–150 | Pb | 5.806 | 1 | 3 | III | Moderate | Moderately Polluted | ||
| Zn | 30.352 | 1 | |||||||
| Cr | 2.309 | 1 | |||||||
| Ni | 2.960 | 0 | |||||||
| Seaward | 0–15 | Pb | 6.252 | 1 | 3 | III | Moderate | Moderately Polluted | |
| Zn | 38.264 | 1 | |||||||
| Cr | 5.745 | 1 | |||||||
| Ni | 4.365 | 0 | |||||||
| 15–30 | Pb | 7.592 | 1 | 3 | III | Moderate | Moderately Polluted | ||
| Zn | 46.088 | 1 | |||||||
| Cr | 5.265 | 1 | |||||||
| Ni | 3.470 | 0 | |||||||
| 30–50 | Pb | 6.476 | 1 | 3 | III | Moderate | Moderately Polluted | ||
| Zn | 36.352 | 1 | |||||||
| Cr | 1.334 | 1 | |||||||
| Ni | 1.710 | 0 | |||||||
| 50–100 | Pb | 6.476 | 1 | 3 | III | Moderate | Moderately Polluted | ||
| Zn | 34.858 | 1 | |||||||
| Cr | 1.521 | 1 | |||||||
| Ni | 1.695 | 0 | |||||||
| 100–150 | Pb | 8.262 | 1 | 3 | III | Moderate | Moderately Polluted | ||
| Zn | 43.076 | 1 | |||||||
| Cr | 1.732 | 1 | |||||||
| Ni | 2.220 | 0 | |||||||
Table A9.
MSQi in SR of MMFR, Perak during wet season.
Table A9.
MSQi in SR of MMFR, Perak during wet season.
| MANGROVE SEDIMENT QUALITY INDEX (MSQi) | |||||||||
|---|---|---|---|---|---|---|---|---|---|
| River | Zone | Depth (cm) | MSQi Parameter | Median | MSDPT | ∑ MSDPT SCORE | MSQi CLASS | Rating | Description |
| Sepetang River | Landward | 0–15 | Pb | 11.610 | 1 | 4 | III | Moderate | Moderately Polluted |
| Zn | 70.308 | 2 | |||||||
| Cr | 6.664 | 1 | |||||||
| Ni | 4.543 | 0 | |||||||
| 15–30 | Pb | 11.610 | 1 | 4 | III | Moderate | Moderately Polluted | ||
| Zn | 65.802 | 2 | |||||||
| Cr | 3.330 | 1 | |||||||
| Ni | 3.705 | 0 | |||||||
| 30–50 | Pb | 10.378 | 1 | 4 | III | Moderate | Moderately Polluted | ||
| Zn | 61.098 | 2 | |||||||
| Cr | 1.547 | 1 | |||||||
| Ni | 2.810 | 0 | |||||||
| 50–100 | Pb | 8.262 | 1 | 4 | III | Moderate | Moderately Polluted | ||
| Zn | 54.418 | 2 | |||||||
| Cr | 1.764 | 1 | |||||||
| Ni | 2.262 | 0 | |||||||
| 100–150 | Pb | 8.932 | 1 | 3 | III | Moderate | Moderately Polluted | ||
| Zn | 43.230 | 1 | |||||||
| Cr | 2.009 | 1 | |||||||
| Ni | 2.575 | 0 | |||||||
| Central | 0–15 | Pb | 11.610 | 1 | 4 | III | Moderate | Moderately Polluted | |
| Zn | 62.572 | 2 | |||||||
| Cr | 4.443 | 1 | |||||||
| Ni | 5.696 | 0 | |||||||
| 15–30 | Pb | 8.484 | 1 | 4 | III | Moderate | Moderately Polluted | ||
| Zn | 56.132 | 2 | |||||||
| Cr | 4.072 | 1 | |||||||
| Ni | 5.220 | 0 | |||||||
| 30–50 | Pb | 8.708 | 1 | 2 | IV | Good | Low Polluted | ||
| Zn | 42.748 | 1 | |||||||
| Cr | 1.031 | 0 | |||||||
| Ni | 1.322 | 0 | |||||||
| 50–100 | Pb | 8.484 | 1 | 2 | IV | Good | Low Polluted | ||
| Zn | 32.044 | 1 | |||||||
| Cr | 1.176 | 0 | |||||||
| Ni | 1.508 | 0 | |||||||
| 100–150 | Pb | 8.262 | 1 | 3 | III | Moderate | Moderately Polluted | ||
| Zn | 27.274 | 1 | |||||||
| Cr | 1.339 | 1 | |||||||
| Ni | 1.717 | 0 | |||||||
| Seaward | 0–15 | Pb | 6.698 | 1 | 3 | III | Moderate | Moderately Polluted | |
| Zn | 46.220 | 1 | |||||||
| Cr | 3.332 | 1 | |||||||
| Ni | 4.272 | 0 | |||||||
| 15–30 | Pb | 7.368 | 1 | 3 | III | Moderate | Moderately Polluted | ||
| Zn | 43.890 | 1 | |||||||
| Cr | 3.176 | 1 | |||||||
| Ni | 3.853 | 0 | |||||||
| 30–50 | Pb | 5.136 | 1 | 2 | IV | Good | Low Polluted | ||
| Zn | 34.286 | 1 | |||||||
| Cr | 0.774 | 0 | |||||||
| Ni | 2.905 | 0 | |||||||
| 50–100 | Pb | 5.358 | 1 | 2 | IV | Good | Low Polluted | ||
| Zn | 28.044 | 1 | |||||||
| Cr | 0.882 | 0 | |||||||
| Ni | 1.175 | 0 | |||||||
| 100–150 | Pb | 6.028 | 1 | 2 | IV | Good | Low Polluted | ||
| Zn | 28.056 | 1 | |||||||
| Cr | 1.004 | 0 | |||||||
| Ni | 1.288 | 0 | |||||||
References
- Faridah-Hanum, I.; Yusoff, F.M.; Fitrianto, A.; Ainuddin, N.A.; Gandaseca, S.; Zaiton, S.; Norizah, K.; Nurhidayu, S.; Roslan, M.K.; Hakeem, K.R.; et al. Development of a comprehensive mangrove quality index (MQI) in Matang Mangrove: Assessing mangrove ecosystem health. Ecol. Indic. 2019, 102, 103–117. [Google Scholar] [CrossRef]
- Mustapha, A.; Gandaseca, S.; Hanafi, A.; Nurhidayu, S. Sediment quality index in Mangrove Forest. Pertanika J. Sch. Res. Rev. 2017, 3, 41–51. [Google Scholar]
- Janaki-Raman, D.; Jonathan, M.P.; Srinivasalu, S.; Armstrong-Altrin, J.S.; Mohan, S.P.; Ram-Mohan, V. Trace metal enrichments in core sediments in Muthupet mangroves, SE coast of India: Application of acid leachable technique. Environ. Pollut. 2007, 145, 245–257. [Google Scholar] [CrossRef] [PubMed]
- Ram, R.; Pavan-Kumar, A.; Jaiswar, A.K.; Gireesh-Babu, P.; Krishna, G.; Chaudhari, A. Identification of fish and shellfish larvae from mangroves using DNA barcodes. J. Coast. Res. 2020, 36, 1106–1110. [Google Scholar] [CrossRef]
- Norman, D. A world without Mangroves? Science 2007, 317, 41–42. [Google Scholar] [CrossRef] [Green Version]
- Yan, B.; Hong, K.; Yu, Z.N. Archaeal communities in mangrove soil characterized by 16S rRNA gene clones. J. Microbiol. 2006, 44, 566–571. [Google Scholar]
- Kathiresan, K. 3. Mangrove Ecosystems 3.1. Distribution of Mangroves. Adv. Mar. Biol. 2005, 92–101. [Google Scholar]
- Hossain, M.D.; Nuruddin, A.A. Soil and mangrove: A review. J. Environ. Sci. Technol. 2016, 9, 198–207. [Google Scholar] [CrossRef] [Green Version]
- Reserve, M.M.F. Development of a Hydrological Index for Mangrove in Matang Mangrove Forest Reserve, Peninsular Malaysia. Master’s Thesis, Universiti Putra Malaysa, Selangor, Malaysia, 2017. [Google Scholar]
- Sarkar, S.K. Trace Metals in a Tropical Mangrove Wetland; Springer: Berlin/Heidelberg, Germany, 2018; ISBN 978-9811027925. [Google Scholar]
- Ding, Z.H.; Liu, J.L.; Li, L.Q.; Lin, H.N.; Wu, H.; Hu, Z.Z. Distribution and speciation of mercury in surficial sediments from main mangrove wetlands in China. Mar. Pollut. Bull. 2009, 58, 1319–1325. [Google Scholar] [CrossRef] [PubMed]
- Dong, A.; Zhai, S.; Matthias, Z.; Yu, Z.; Zhang, H.; Liu, F. Heavy metals in Changjiang estuarine and offshore sediments: Responding to human activities. Acta Oceanol. Sin. 2012, 31, 88–101. [Google Scholar] [CrossRef]
- Maiti, S.; Chowdhury, A. Effects of anthropogenic pollution on Mangrove biodiversity: A Review. J. Environ. Prot. 2013, 2013, 1428–1434. [Google Scholar] [CrossRef] [Green Version]
- Eong, O. Mangroves-a carbon source and sink. Chemosphere 1993, 27, 1097–1107. [Google Scholar] [CrossRef]
- Ashraf, M.A.; Maah, M.J.; Yusoff, I. Heavy metals accumulation in plants growing in ex tin mining catchment. Int. J. Environ. Sci. Technol. 2011, 8, 401–416. [Google Scholar] [CrossRef] [Green Version]
- FAO. The world’s mangroves 1980–2005. FAO For. Pap. 2007, 153, 89. [Google Scholar]
- Ibharim, N.A.; Mustapha, M.A.; Lihan, T.; Mazlan, A.G. Mapping mangrove changes in the Matang Mangrove forest using multi temporal satellite imageries. Ocean. Coast. Manag. 2015, 114, 64–76. [Google Scholar] [CrossRef]
- Praveena, S.M.; Radojevic, M.; Abdullah, M. The assessment of mangrove sediment quality in Mengkabong lagoon: An index analysis approach. Int. J. Environ. Sci. Educ. 2007, 2, 60–68. [Google Scholar] [CrossRef]
- Shafie, N.A.; Aris, A.Z.; Zakaria, M.P.; Haris, H.; Lim, W.Y.; Isa, N.M. Application of geoaccumulation index and enrichment factors on the assessment of heavy metal pollution in the sediments. J. Environ. Sci. Health. A Tox. Hazard. Subst. Environ. Eng. 2013, 48, 182–190. [Google Scholar] [CrossRef] [PubMed]
- El-Said, G.F.; Youssef, D.H. Ecotoxicological impact assessment of some heavy metals and their distribution in some fractions of mangrove sediments from Red Sea, Egypt. Environ. Monit. Assess. 2013, 185, 393–404. [Google Scholar] [CrossRef] [PubMed]
- Aris, A.Z.; Ahmad Puad, N.H.; Shafie, N.A.; Juen, L.L.; Praveena, S.M.; Ramli, M.F.; Yusoff, M.K. The chemometric approach as a useful tool in the identification of metal pollution sources of Nagarajan Nagarani, Arumugam Kuppusamy Kumaraguru, Velmurugan Janaki. EnvironmentAsia 2014, 7, 104–111. [Google Scholar]
- Hossain, M.S. Biological aspects of the coastal and marine environment of Bangladesh. Ocean. Coast. Manag. 2001, 44, 261–282. [Google Scholar] [CrossRef]
- Gandaseca, S.; Wahab, N.L.A.; Pazi, A.M.M.; Rosli, N.; Zaki, P.H. Comparison of water quality status of disturbed and undisturbed mangrove forest at Awat-Awat Lawas Sarawak. Open J. For. 2016, 6, 14–18. [Google Scholar] [CrossRef] [Green Version]
- Yunus, K.; Yusuf, N.M.; Shazili, N.A.M.; Chuan, O.M.; Saad, S. Heavy metal concentration in the surface sediment of Tanjung Lumpur. Sains Malasiana 2011, 40, 89–92. [Google Scholar]
- Ghaderpour, A.; Nasori, K.N.M.; Chew, L.L.; Chong, V.C.; Thong, K.L.; Chai, L.C. Detection of multiple potentially pathogenic bacteria in Matang mangrove estuaries, Malaysia. Mar. Pollut. Bull. 2014, 83, 324–330. [Google Scholar] [CrossRef]
- Carter, M.R.; Gregorich, E.G.; Pennock, D.; Yates, T.; Braidek, J. Soil Sampling and Methods of Analysis, 2nd ed.; CRC Press: Boca Raton, FL, USA, 2007; Volume 44, ISBN 978-0849335860. [Google Scholar]
- Kauffman, J.B.; Donato, D.C. Protocols for the Measurement, Monitoring and Reporting of Structure, Biomass, and Carbon Stocks in Mangrove Forests; Citeseer: Princeton, NJ, USA, 2012. [Google Scholar]
- Mustapha, A.; Pazi, M.; Rosli, N.; Hanafi, A.; Tindit, A.E.; Mohamad Pazi, A.M.; Gandaseca, S.; Rosli, N.; Hamzah, A.H.; Tindit, A.E.; et al. Soil Ph and carbon at different depth in three zones of mangrove forest in Sarawak, Malaysia. MALAYS For. 2016, 79, 164–173. [Google Scholar]
- Beretta, A.N.; Silbermann, A.V.; Paladino, L.; Torres, D.; Bassahun, D.; Musselli, R.; García-Lamohte, A. Análisis de textura del suelo con hidrómetro: Modificaciones al método de Bouyoucus. Cienc. Investig. Agrar. 2014, 41, 263–271. [Google Scholar] [CrossRef] [Green Version]
- Bouyoucos, G.J. Hydrometer method improved for making particle size analyses of soils 1. Agron. J. 1962, 54, 464–465. [Google Scholar] [CrossRef]
- Peech, M. Hydrogen-ion activity. Methods Soil Anal. Part 2 Chem. Microbiol. Prop. 1965, 9, 914–926. [Google Scholar]
- Tan, K.H. Soil Sampling, Preparation, and Analysis; CRC Press: Boca Raton, FL, USA, 1995; ISBN 908-24796756. [Google Scholar]
- Bremner, J.M. Determination of nitrogen in soil by the Kjeldahl method. J. Agric. Sci. 1960, 55, 11–33. [Google Scholar] [CrossRef]
- Murphy, J.; Riley, J.P. A modified single solution method for the determination of phosphate in natural waters. Anal. Chim. Acta 1962, 27, 31–36. [Google Scholar] [CrossRef]
- Udechukwu, B.E.; Ismail, A.; Zulkifli, S.Z.; Omar, H. Distribution, mobility, and pollution assessment of Cd, Cu, Ni, Pb, Zn, and Fe in intertidal surface sediments of Sg. Puloh mangrove estuary, Malaysia. Environ. Sci. Pollut. Res. 2015, 22, 4242–4255. [Google Scholar] [CrossRef]
- Berg, M.G.; Gardner, E.H. Method Soil Analysis Used in the Soil Testing Laboratory at Oregon State University; Special Report; Agricultural Experiment Station: Corvallis, OR, USA, 1978. [Google Scholar]
- George, D.; Mallery, P. IBM SPSS Statistics 23 Step by Step; Routledge: New York, NY, USA, 2016. [Google Scholar] [CrossRef]
- El Nemr, A.; Khaled, A.; Sikaily, A. El distribution and statistical analysis of leachable and total heavy metals in the sediments of the suez gulf. Environ. Monit. Assess. 2006, 118, 89–112. [Google Scholar] [CrossRef] [PubMed]
- Baziene, K.; Tetsman, I.; Albrektiene, R. Level of pollution on surrounding environment from landfill aftercare. Int. J. Environ. Res. Public Health 2020, 17, 2007. [Google Scholar] [CrossRef] [Green Version]
- Kaiser, M.O. Kaiser-Meyer-Olkin measure for identity correlation matrix. J. R. Stat. Soc. 1974, 52, 296–298. [Google Scholar]
- W.H.O. Permissible Limits of Heavy Metals in Soil and Plants; WHO: Geneva, Switzerland, 1996. [Google Scholar]
- Praveena, S.M.; Ahmed, A.; Radojevic, M.; Abdullah, M.H.; Aris, A.Z. Multivariate and geoaccumulation index evaluation in mangrove surface sediment of Mengkabong Lagoon, Sabah. Bull. Environ. Contam. Toxicol. 2008, 81, 52–56. [Google Scholar] [CrossRef]
- Islam, M.S.; Ahmed, M.K.; Raknuzzaman, M.; Habibullah-Al-Mamun, M.; Islam, M.K. Heavy metal pollution in surface water and sediment: A preliminary assessment of an urban river in a developing country. Ecol. Indic. 2015, 48, 282–291. [Google Scholar] [CrossRef]
- Ahmad Adnan, N.; Loneragan, N.R.; Connolly, R.M. Variability of, and the influence of environmental factors on, the recruitment of postlarval and juvenile Penaeus merguiensis in the Matang mangroves of Malaysia. Mar. Biol. 2002, 141, 241–251. [Google Scholar] [CrossRef]
- Sim, V.X.Y.; Dafforn, K.A.; Simpson, S.L.; Kelaher, B.P.; Johnston, E.L. Sediment contaminants and infauna associated with recreational boating structures in a multi-use marine park. PLoS ONE 2015, 10, e0130537. [Google Scholar] [CrossRef] [PubMed]
Publisher’s Note: MDPI stays neutral with regard to jurisdictional claims in published maps and institutional affiliations. |
© 2021 by the authors. Licensee MDPI, Basel, Switzerland. This article is an open access article distributed under the terms and conditions of the Creative Commons Attribution (CC BY) license (https://creativecommons.org/licenses/by/4.0/).