Article

Carbon, Nutrients and Methylmercury in Water from Small Catchments Affected by Various Forest Management Operations

1
Latvian State Forest Research Institute ‘Silava’ (LSFRI Silava), Rigas Str. 111, LV-2169 Salaspils, Latvia
2
Department of Environmental Science, Faculty of Geography and Earth Sciences, University of Latvia, Jelgavas Str. 1, LV-1004 Riga, Latvia
3
Department of Aquatic Sciences and Assessment, Swedish University of Agricultural Sciences (SLU), SE-75007 Uppsala, Sweden
*
Author to whom correspondence should be addressed.
Forests 2021, 12(9), 1278; https://doi.org/10.3390/f12091278
Submission received: 19 August 2021 / Revised: 11 September 2021 / Accepted: 14 September 2021 / Published: 17 September 2021
(This article belongs to the Special Issue Forest Soil and Water Biogeochemistry)

Abstract

:
Forest management activities in boreal and hemiboreal environments have been found to increase the concentration of carbon, nutrients, and methylmercury (MeHg) in runoff water, thus contributing to environmental quality issues. We evaluated carbon, nutrient, and MeHg concentrations in water at eight small, forested catchments on organic soils in Latvia, subject to ditch cleaning and beaver dam removal. These management-induced disturbances were classified into a major, minor, or no disturbance classes. The concentrations of dissolved organic carbon and total nitrogen were elevated in disturbed catchments (both major and minor) compared to the catchments with no disturbance. The concentrations of MeHg in the water displayed a clear seasonal variation with higher concentrations in spring and summer, but there were no significant differences in MeHg concentrations between catchments with major, minor, and no disturbances. However, the higher concentrations of SO42− in the disturbed catchments compared to those undisturbed may promote MeHg formation if the conditions become more reduced further downstream. While most former studies of forest management effects on water quality have focused on forest harvest, our research contributes to the currently rather scarce pool of data on the impact of less-studied management operations, such as ditch cleaning and beaver dam removal, on carbon, nutrient, and MeHg concentrations in runoff water.

1. Introduction

The transformation towards a more circular, bio-based economy relying on renewable resources will increase the demand for bioenergy and likely cause alterations in land-use practices, including the intensification of forestry [1]. The forest area in Nordic and Baltic countries accounts for more than one third of the whole EU28 forest area, and Sweden, Finland, Estonia, and Latvia especially have major forest-based economic activities [2]. The importance of the forest sector, combined with the EU Green Deal and related environmental goals, one of them being water resource protection, calls for even stronger emphasis on environmental quality issues, including the identification and filling of the remaining knowledge gaps.
The main concerns connected to the impact of land management practices including forestry on water quality are related to the increase in concentrations and runoff of carbon (e.g., [3,4]), nutrients (e.g., [5,6,7,8,9,10]), and mercury (Hg) (e.g., [11,12,13,14,15]). Dissolved organic carbon (DOC) plays a key role in the biogeochemistry and ecology of surface waters, and its transport from terrestrial to aquatic ecosystems is primarily related to runoff and DOC mobilization from the upper layers of riparian soils [4,16]. Organic carbon (OC) concentrations and water colour have been reported to increase in surface waters in the boreal and nemoral zones of Europe and North America. This so-called “brownification” of water bodies can affect aquatic food web structures [17,18], have implications for drinking water treatment [19,20], and mobilize pollutants and metals attached to organic molecules [21,22]. Land use activities, such as forest harvest and peatland drainage, have been found to increase the concentrations and loads of DOC in surface waters (e.g., [4,23,24,25]). There is, therefore, a risk that land-use activities will further enhance brownification and its ecological and chemical consequences.
Nitrogen (N) and phosphorus (P) are the most important limiting nutrients in both terrestrial and aquatic environments, but their natural cycles are considerably altered by anthropogenic impacts, e.g., fertilizer application, fossil fuel emissions and land management (e.g., [7,26]). In contrast to the 1970s, when eutrophication was mainly caused by point-source pollution, currently the main drivers of this process are diffuse N and P losses (e.g., [27]). Forest management is known to contribute to nutrient loads in receiving waterbodies [23,28,29] due to decreased water and nutrient uptake and increased runoff [23,30,31], accelerated nitrification and mineralization of organic matter [32,33], and release of nutrients from logging residues [34]. The environmental quality problems in the region, specifically human-induced eutrophication, are highlighted by the poor ecological status of the Baltic Sea [35].
Hg is a global priority pollutant with significant implications for environmental quality, including human and wildlife health [36,37,38]. The concerns in the Baltic Sea region are highlighted by Hg concentrations exceeding the threshold level in fish muscle tissue in almost all monitored open Baltic Sea sub-basins, indicating not good status [39], and also in freshwater [40]. In Latvia, Hg concentrations exceeded the threshold level set by the national surface water environmental quality standard of 0.07 μg L−1 [41] in 32 of 132 freshwater monitoring stations [42]. From a water quality perspective, most concerns regard the more bioavailable organic form of Hg, methylmercury (MeHg), a highly potent neurotoxin [36,43] formed in suboxic or anoxic conditions by sulphate-reducing bacteria [44,45], iron-reducing bacteria [46], methanogenic archaea [47,48], and syntrophic and acetogenic bacteria [49], among others. Forest land is viewed as one of the main suppliers of MeHg and total Hg (THg) to the surrounding freshwater environment [21], and the legacy Hg from historical emissions can be mobilized from the forest soils [50]. The disturbance of forest soils from forest management activities can promote Hg methylation and mobilization [14]. An assessment of the effects of forest management on Hg in high-latitude landscapes revealed that 10%–25% of Hg in freshwater fish could be attributed to forest harvesting. Less transpiration when trees are removed causes the area to become wetter with a higher risk for Hg methylation in reduced environments. More superficial flow paths can also mobilize Hg from the upper soil horizons [12,13]. However, forest harvesting studies reveal a great variation in the effect on MeHg and THg in runoff water between sites [51,52].
Data on several other forest management activities, including those related to soil disturbance, e.g., ditch network maintenance (DNM), are scarce and often contradictory [53,54]. DNM includes the cleaning of existing ditches and digging of supplementary ditches to maintain forest growth. In Latvia, DNM in forest is a routine practice. It is typically carried out with an excavator within the boundaries of existing drainage systems, and repeated each 15–20 years, or even less frequently. While most studies of ditch network maintenance effects report decreased DOC concentrations [54], the trends in dissolved and particulate nutrient exports after DNM may vary considerably. While Joensuu et al. [55] and Nieminen et al. [29] reported minor impacts on total dissolved N, increased dissolved inorganic N, especially ammonia, has been observed as well [55,56]. The results for P are contradictory. In different studies, slight decreases [57], increases [29], or no significant changes [58] have been observed. Effects of ditch cleaning on total Hg (THg) and MeHg have, to the best of our knowledge, only been studied once before, and that study from Sweden revealed short-term increases in THg and MeHg concentrations immediately after the operations [59]. Those effects were most probably related to erosion that occurred during ditch cleaning operations [59]. More knowledge is therefore needed on whether ditch cleaning can cause more long-lasting changes in THg and MeHg concentrations.
Because of incomplete coverage and deviating results of studies performed so far, the magnitude of possible forest operation effects on Hg and MeHg contamination in freshwater and their variability among different types of forest landscapes remain unclear [12,13]. Most forestry effect studies have focused on forest harvesting, and there is a need for additional knowledge on how water quality, including the concentration of MeHg, is influenced by various kinds of forest management activities that aim to increase water drainage, such as ditch cleaning and beaver dam removal. Moreover, data on Hg and MeHg in water in the Baltic States are scarce, and a better understanding of the processes underlying catchment MeHg production is needed. To address some of these concerns, this study sought to characterize the spatial and temporal (seasonal) distribution of water chemistry, including MeHg in runoff water from small forest catchments with different forest management activities in organic soils in Latvia. We hypothesized that watercourses with major disturbance from drainage system maintenance and beaver dam removal will have increased concentrations of nutrients, DOC, and MeHg, although these activities generally lower the groundwater level.

2. Materials and Methods
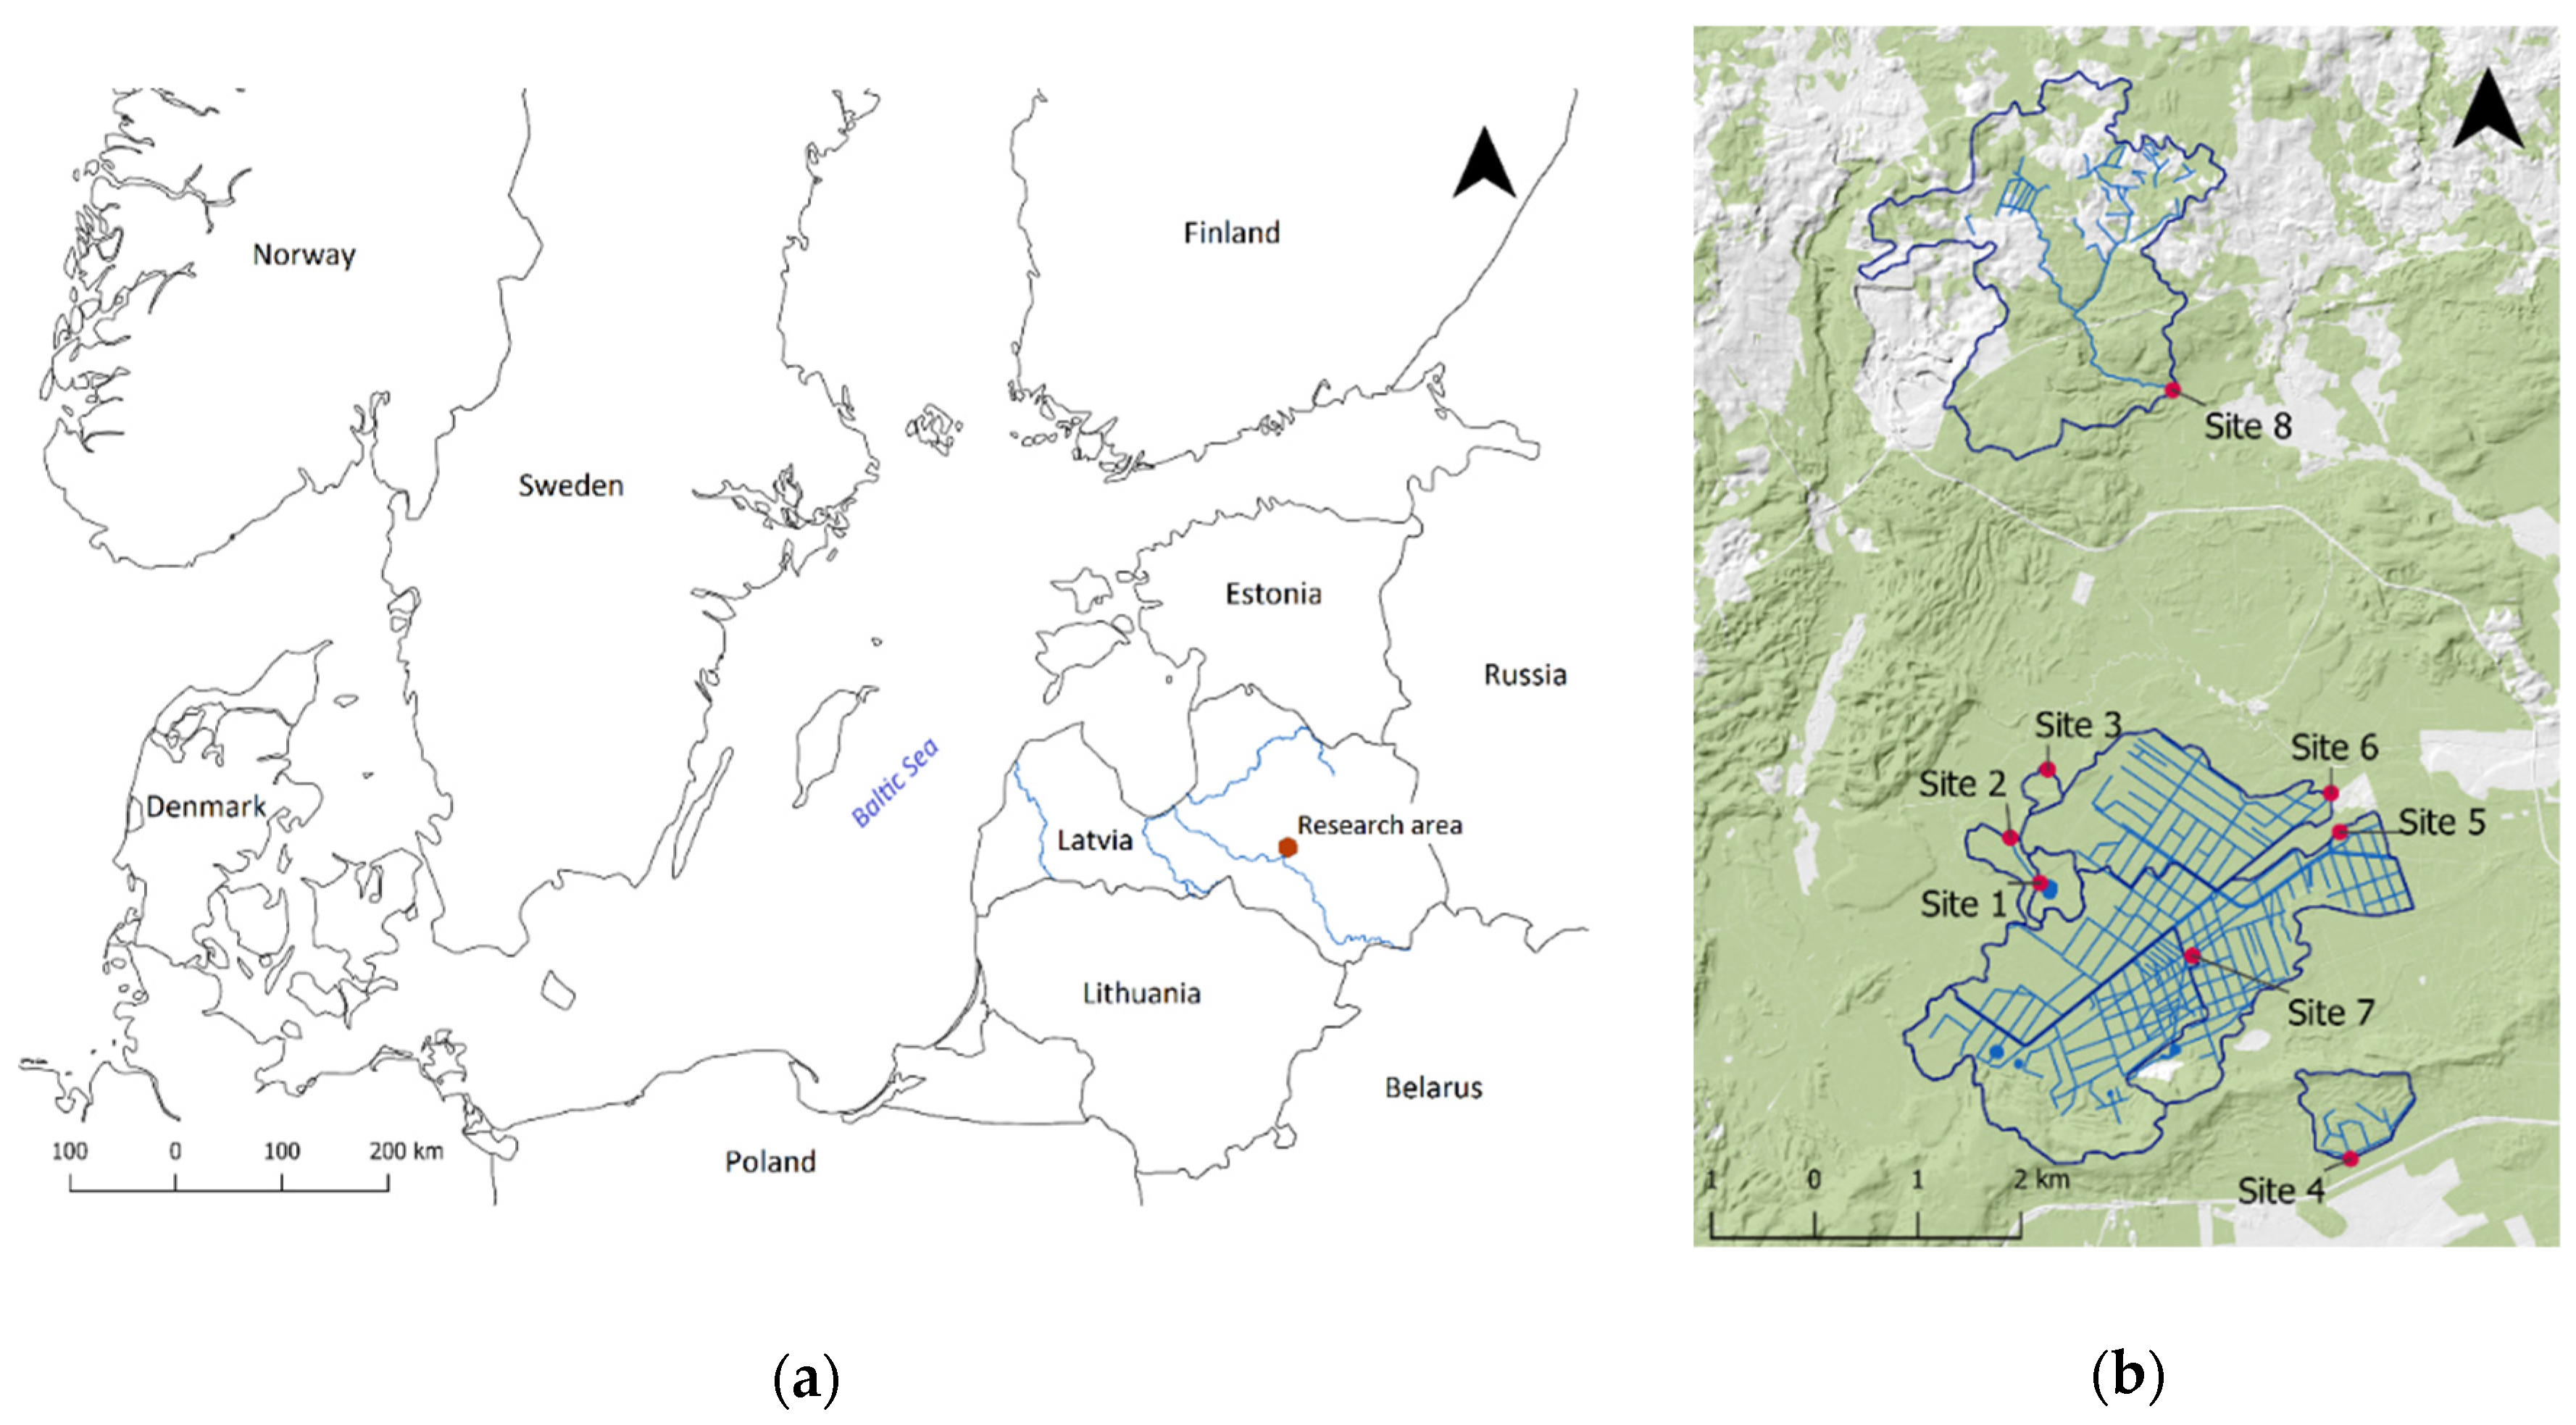
2.1. Sampling Sites

The study was conducted in the eastern part of Latvia (Figure 1), in experimental forests of the Kalsnava Forest district. In the area, for the period 2018−2019, the mean annual precipitation was 636 mm (monthly average rainfall pattern for longer period was calculated from 2007 to 2019, Figure S1). The mean annual air temperature was 6.6 °C, the minimum mean monthly temperature was −8.7 °C (February 2018), and the maximum mean monthly temperature was 19.2 °C (July 2018). Part of the area was drained for forestry purposes in the 1960s, with additional drainage carried out in the 1980s. There is a dense drainage ditch network in the area. The bedrock is sand of varying roughness, covered with peat. The botanic composition of peat is rather uniform, with 75%–80% sedge peat and 20%–25% woody peat [60]. At 1.5–2.0 m soil depth Phragmites peat was found. In 2008, mean density of peat in all layers was 0.15 kg L−1 [60]. The peat layer is thicker than 20 cm over 46.0% of the area of the studied catchments (total area 1601.5 ha). Despite the peat layer, due to the confined aquifer discharge, water in the area has higher pH values than might be expected. During the study, no soil flooding due to storm events was recorded. However, beavers are active in the area and beaver ponds have been found in the catchments of sites 3 and 8. The dominant tree species are Scots pine (Pinus sylvestris L.), Norway spruce (Picea abies L. Karst.), and birch (Betula sp.) (40.0%, 32.5% and 16.1% of the area of the studied catchments, respectively). The main forest management system is uniform regeneration felling. The share of clear-felled compartments currently varies from 0% to 6.2% of the catchment area. Part of the study area (including sampling site 3) is located in a protected area, a floodplain mire of the river Veseta. Characteristics of the drainage system catchments corresponding to each sampling site are summarized in Table A1 in the Appendix A.
In total, eight sampling points were selected in the watercourses, representing various management alternatives and severities of disturbance (Table 1). In the context of this study, disturbance was considered an intervention that caused alterations in the streambed of studied ditches or watercourses, e.g., drainage system maintenance and beaver dam removal. Sites with no disturbance had no documented management history for at least last 15 years. Sites with major disturbances had undergone either ditch cleaning or complete beaver dam removal within the last 3–5 years. Ditch cleaning was carried out once in 2016 using an excavator, by completely removing the layer of vegetation within the ditches and restoring their initial depth. The beaver dam at site 5 was completely removed manually in August 2017. In sites with minor disturbances, partial ditch cleaning or partial beaver dam removal had been carried out to ensure the water flow, but most of the sediment remained intact during the operation. All management actives in major and minor disturbed sites aimed to increase the drainage capacity.

2.2. Water Sampling and Chemical Analyses

Water samples for analysis of general chemistry were taken once a month during the period from November 2018 to December 2019. Water for MeHg analysis was sampled four times in four different seasons: on 21 November 2018 (autumn, AU), on 14 February 2019 (winter, WI), on 21 May 2019 (spring, SP), and on 1 August 2019 (summer, SU). Water samples for general chemistry analyses were collected in polyethylene bottles, samples for MeHg analyses were collected in acid-washed Teflon fluorinated ethylene propylene bottles. Each bottle was rinsed with deionized water and stream water before sample collection. Grab-samples were taken from the ditches by carefully sinking the bottle below the water level. Single-use plastic gloves were worn during sampling. Water samples were placed in a cold box on ice to be transported to the laboratory. Before sampling, the water temperature, optical dissolved oxygen (ODO) content, and oxidation-reduction potential (ORP) were measured in the ditches using a YSI ProDSS multiparameter water quality meter.
All water chemistry analyses, except for MeHg, were performed in the Forest Environment Laboratory at the Latvian State Forest Research Institute “Silava”. The pH was determined according to Latvian Standard (LVS) ISO 10523:2012. Electrical conductivity (EC) was determined according to LVS EN 27888:1993. The concentration of total nitrogen (TN), nitrate nitrogen (NO3-N), and dissolved organic carbon (DOC) in water samples were determined using a FORMACSHT TOC/TN Analyser (ND25 nitrogen detector) according to LVS EN 12260:2004 and LVS EN 1484:2000, and ammonium nitrogen (NH4+-N) was determined using the spectrometric method according to LVS ISO 7150-1:1984. Total phosphorus (TP) and phosphate-phosphorus (PO43−-P) were determined using an ammonium molybdate spectrometric method according to LVS EN ISO 6878:2005. The contents of sulphate-sulphur (SO42−-S) and chloride ions (Cl) were determined using the liquid chromatography method according to LVS EN ISO 10304-1:2009. The content of total suspended solids (TSS) was determined according to LVS EN 872:2007. Prior to the chemical analyses (excluding determination of pH and TSS), the water samples were filtered using borosilicate glass fibre filters without a binder. Water samples were stored and handled according to ISO 5667-3:2012.
The MeHg content in water samples was determined at the Institute of Food Safety, Animal Health and Environment “BIOR”, Latvia. The MeHg concentration in unfiltered water was measured using gas chromatography (GC, Thermo Scientific Trace 1300, Waltham, MA, USA) by the inductively coupled plasma-mass-spectrometry (ICP-MS) method (Thermo Scientific iCAP RQ, Waltham, MA, USA) according to BIOR-T-012-199-2019/1. The standard reference material used was methylmercury(II) chloride (PESTANAL®, analytical standard, Sigma 33368, Darmstadt, Germany), and the typical recovery for spiked samples was 85%–110%. The limit of detection (LOD) was 0.1 ng L−1. Water samples below the LOD were replaced by half of the LOD (0.05 ng L−1).
In addition to the water concentration of MeHg, the MeHg/DOC ratio (in ng MeHg/mg DOC) was evaluated. As DOC is well known to be the dominant ligand for aqueous MeHg, the DOC-normalized measure of MeHg could be considered a proxy for elevated net MeHg formation and a more robust measure than MeHg concentrations alone [15].

2.3. Statistical Analysis

To account for the correlation between repeated measurements, linear mixed models were used to evaluate the impact of the treatments (groups of management-induced disturbance) on water chemistry. By including ‘sampling site’ as a random categorical factor, it accounted for the dependence of the data within a catchment. Sampling occasions were used as the repeated structure (AR(1)) with catchment as the subject. Correlations between selected water chemistry variables were tested with Spearman’s ρ using a significance level of p < 0.05.
Multivariate methods were used to find major correlates for the MeHg concentrations. Principal component analysis (PCA) was conducted for water chemical variables to identify groups of variables contributing the most to the variance between different level of management-induced disturbances.
Chemical variables (water and sediments) and catchment information variables (X) were used to explain the variance of annual mean MeHg concentration (Y) in partial least squares (PLS) regressions. PLS regression is a useful multivariate method for dealing with chemical variables which are linearly related to each other, as this method is robust against intercorrelations among X-variables. In PLS, X variables are ranked according to their relevance in explaining Y, commonly expressed as variables important for projection (VIP values). X variables with VIP values exceeding 0.5 were used in PLS regression, and VIP values exceeding 1.0 are considered as important X variables [61,62,63].
All statistical analyses were carried out using R [64]. Figures 2 and 5 were prepared using R package ‘ggplot2’, Figure 3 was prepared using package ‘factoextra’, but Figure 4 was prepared using package ‘corrplot’ and ‘Hmisc’.

3. Results

3.1. Temporal Variation in Water Chemistry

The temporal variation in water chemistry revealed seasonal variation for most water physicochemical parameters. However, the seasonal variation in DOC concentrations were quite low for most of the sites, and the difference between the highest and lowest concentrations over the seasons, within each of the sites, varied between 2.8 and 25.1 mg L−1. As the sampling sites are located in forests with organic soils, DOC concentrations were considerably high across most of the eight sites. The spatial variation of DOC across the eight sites was higher than the seasonal variation and ranged between 11.4 and 47.4 mg L−1 (Table A2, Figure 2).
The difference between the highest and lowest NO3-N concentration over the seasons, within each of the sites, varied between 0.3 and 6.1 mg L−1. The highest mean NO3-N concentrations were found in winter (1.1 ± 0.2 mg L−1), but the spatial variation of NO3-N concentration across the sites varied up to 6.4 mg L−1. The highest mean SO42−-S concentrations were found in spring (3.3 ± 0.2 mg L−1), and the difference between the highest and lowest concentrations over the seasons, within each of the sites, varied between 2.0 and 4.6 mg L−1. The spatial variation of SO42−-S across the sites was higher than the seasonal variation and ranged between 0.6 and 6.3 mg L−1 (Table A2, Figure 2). The mean water pH was 7.74 ± 0.03, and a slightly lower mean pH was observed in the winter season (7.59 ± 0.03).
High MeHg concentrations, up to 4.05 ± 0.81 ng L−1, were detected during the summer season (Site 6), but the annual mean MeHg concentration in water samples ranged up to 1.36 ± 0.91 ng L−1 (Site 6, Figure 3). If the MeHg concentration in water samples in different seasons was compared, the highest mean MeHg concentrations were found in spring (0.76 ± 0.10 ng L−1) and summer (0.68 ± 0.50 ng L−1). Furthermore, the MeHg concentration in water samples in spring and summer was statistically significantly higher than those in autumn and winter (p = 0.018) in all sampling sites. A positive correlation between the MeHg concentration and water temperature (ρ = 0.42, p = 0.015) confirmed the importance of temperature for the net methylation of Hg. However, the spatial variation of MeHg concentrations across the eight sites was slightly higher than the seasonal variation.
The MeHg/DOC ratio ranged from 0.001 ng mg−1 to 0.146 ng mg−1. The highest mean MeHg/DOC ratio was found in spring (0.037 ± 0.005 ng mg−1), and the lowest mean MeHg/DOC ratio was found in winter (0.006 ± 0.002 ng mg−1), but significant differences in the MeHg/DOC ratios between seasons were not found (p = 0.23).

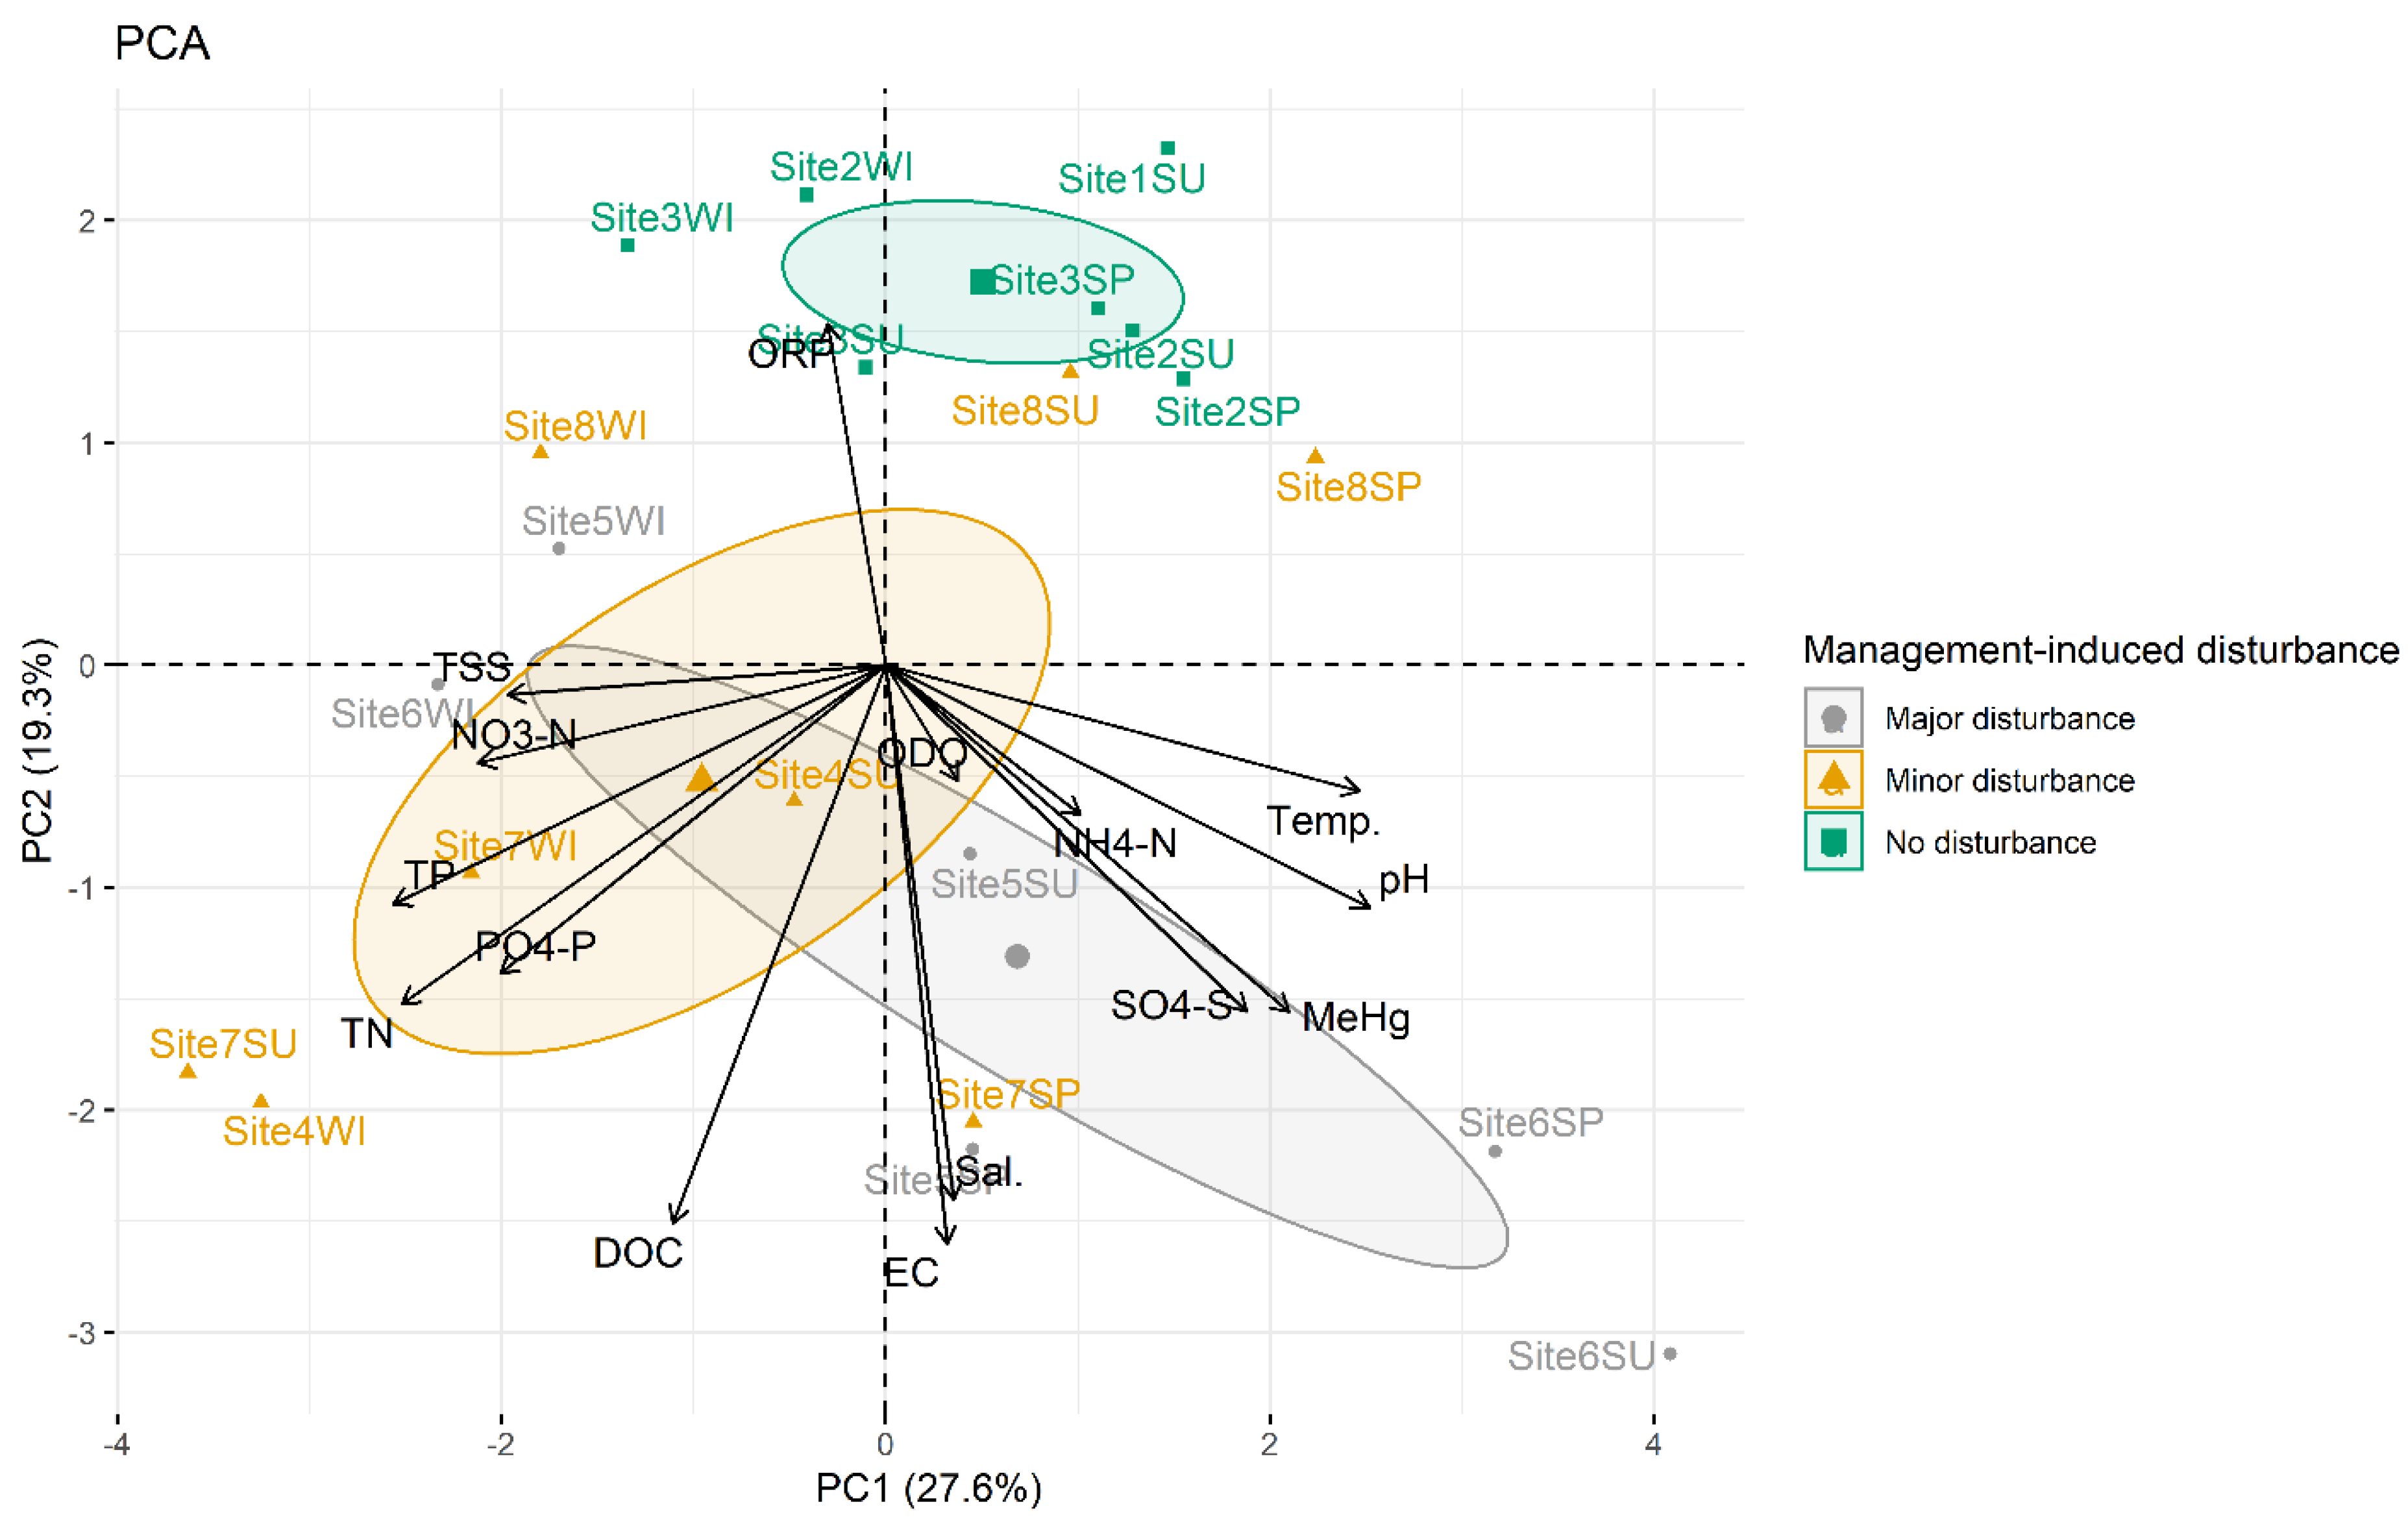
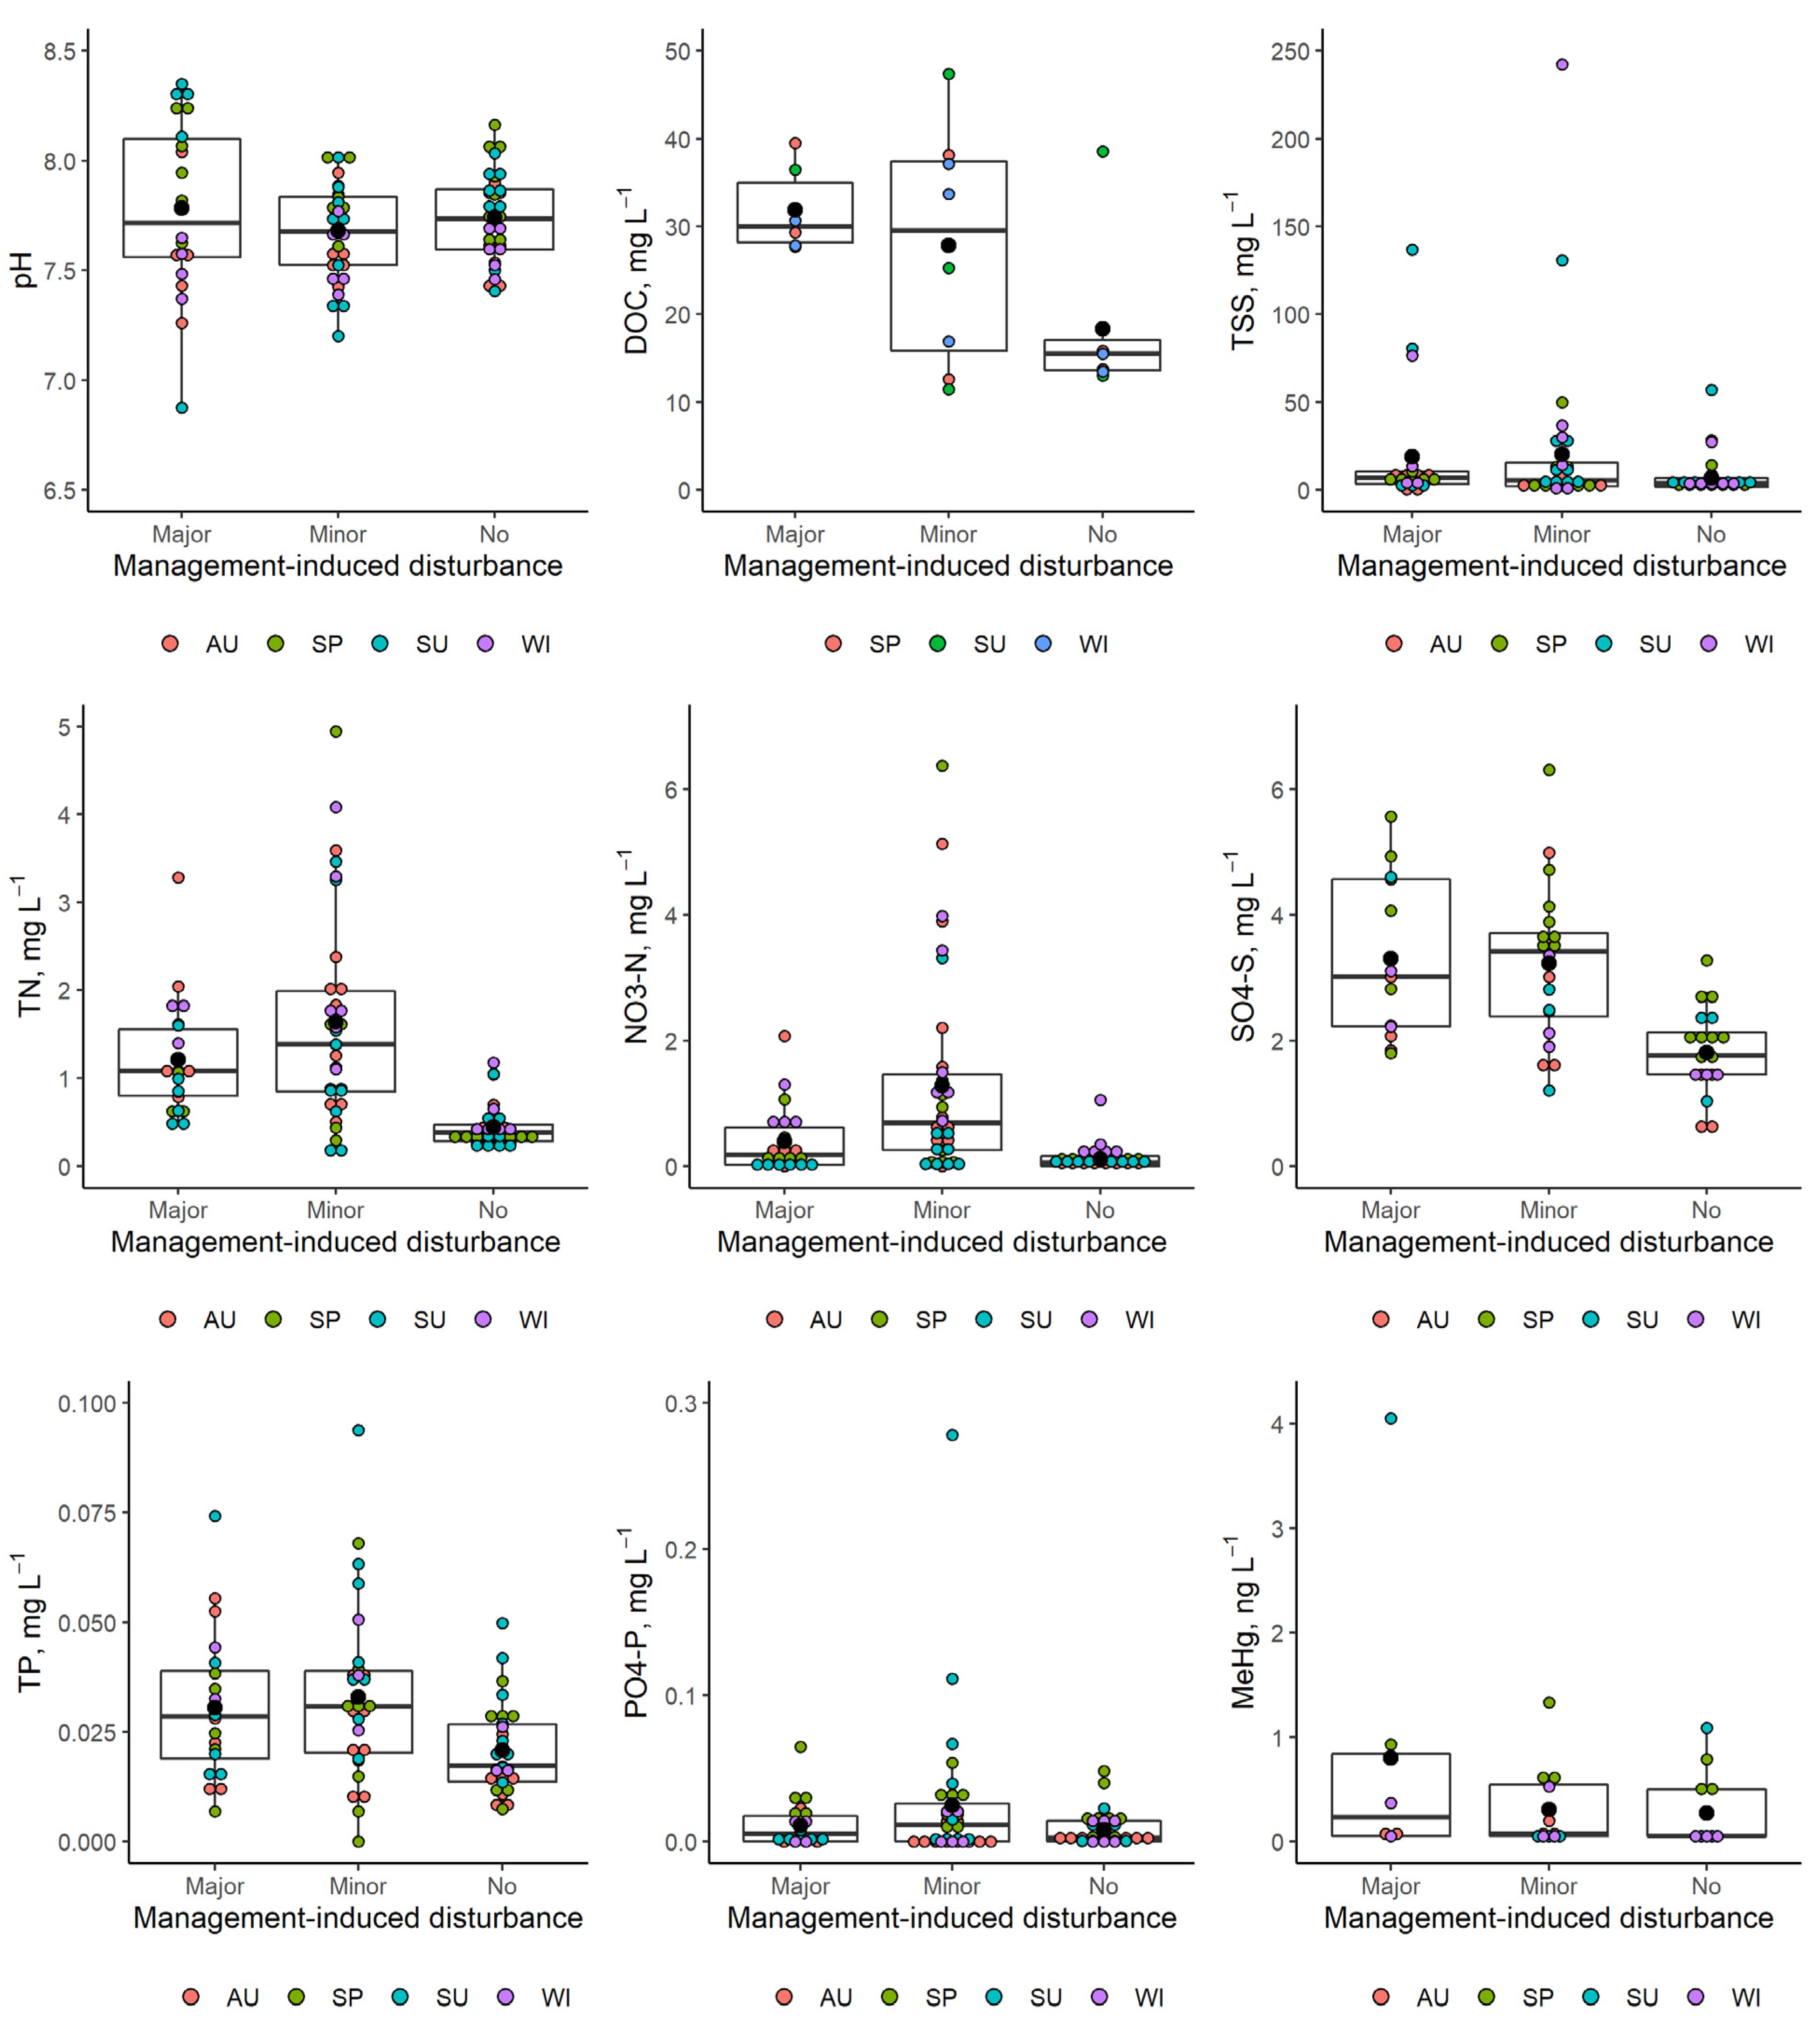
3.2. Effects of Management-Induced Disturbances on Water Chemistry

The concentrations of DOC, TN, NO3-N, TP and SO42−-S were higher in disturbed sites (Sites 4–8) than in undisturbed sites (Sites 1–3) (Figure 2). By contrast, the ORP values were higher in undisturbed sites than in disturbed ones. The pH value and concentrations of NH4+-N, PO43−-P, Cl, ODO, and TSS neither differed significantly between management groups when the disturbed (Sites 4–8) versus the undisturbed (Sites 1–3) sites were compared nor when the sites were divided into three management groups: major (Sites 5 and 6), minor (Sites 4, 7 and 8), and no (Sites 1–3) disturbance.
Although the highest MeHg concentrations (both individual values and annual mean values) were observed in Site 6 (major disturbance), there were neither statistically significant differences in MeHg concentration in water between disturbed and undisturbed sites nor between the three management groups (p = 0.46 and p = 0.26, respectively) (Figure 2). Similarly, the MeHg/DOC ratios neither differed statistically significantly between disturbed and undisturbed sites (p = 0.85) nor between the three management groups (p = 0.47).
Water in watercourses under different levels of management-induced disturbance exhibited different physico-chemical parameters leading to a clear distinction between them in the PCA analysis (Figure 3). Two principal components (i.e., PC1 and PC2) explained a total of 46.9% of the variability. PC1 accounted for 27.6% and PC2 for 19.3% of the explained variability. Sites with major and minor disturbances were characterised by higher concentrations of most measured elements, except for ORP, compared with undisturbed sites.

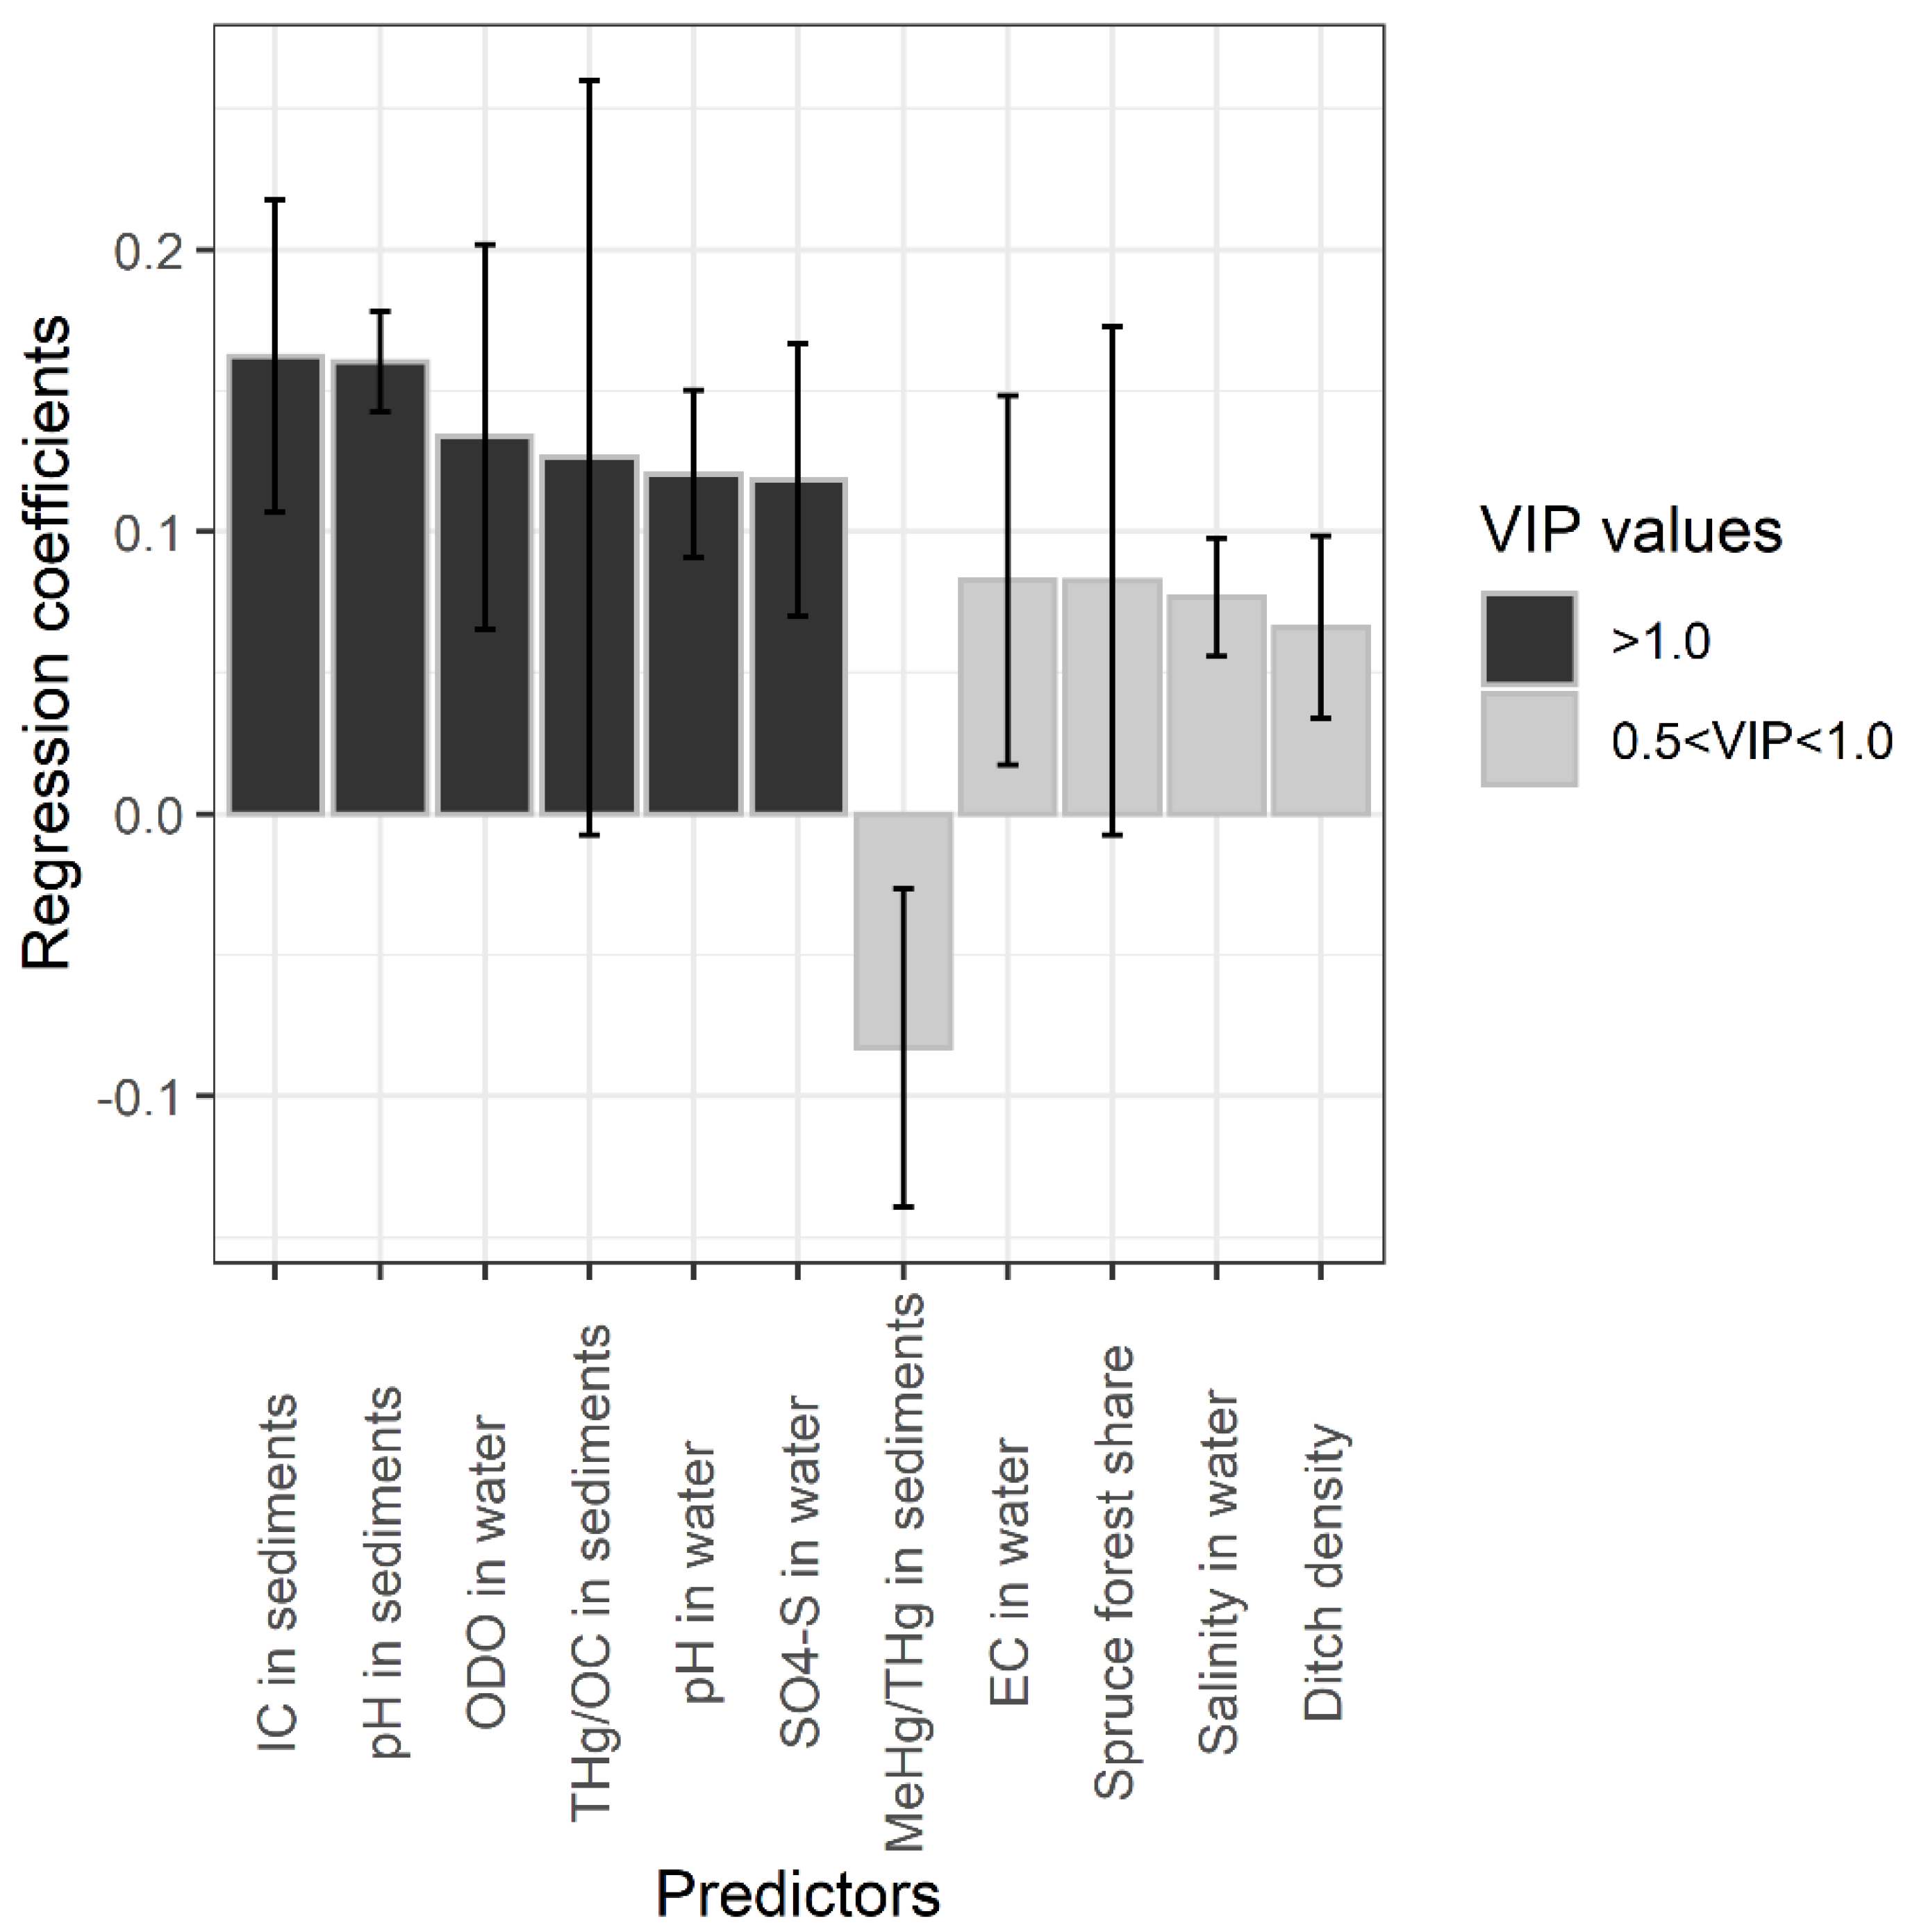
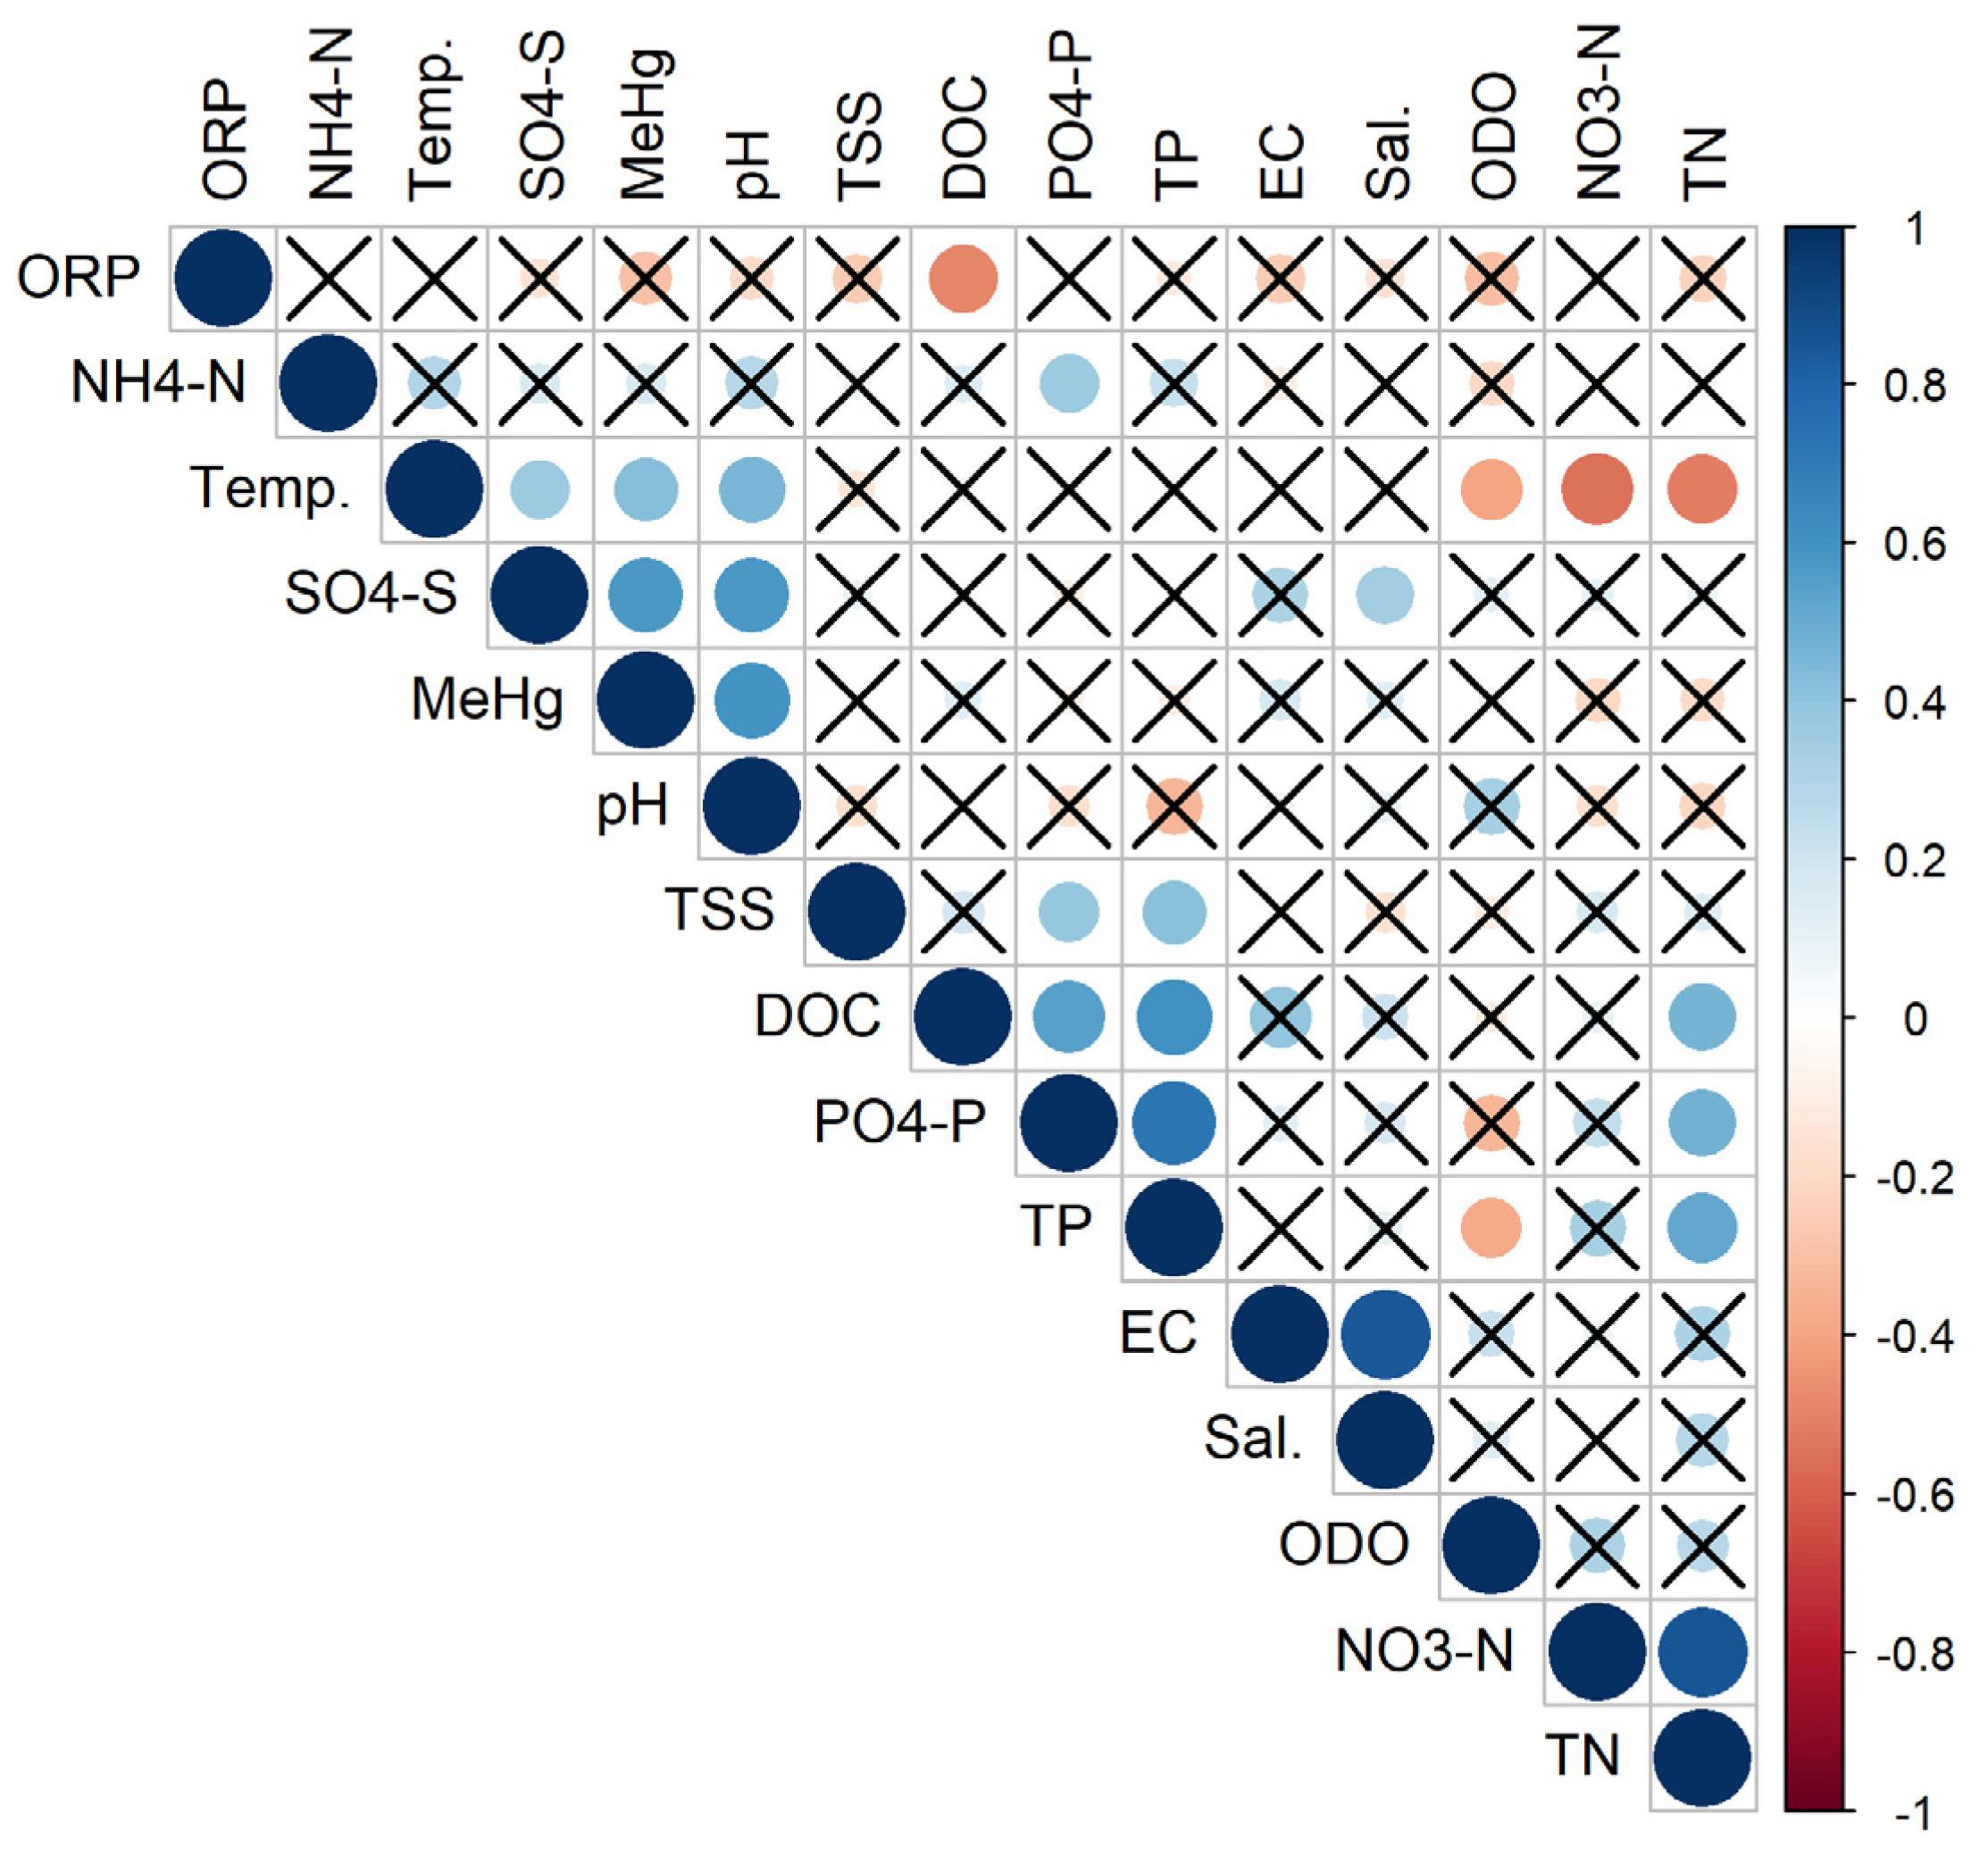
3.3. Correlations between Water Physico-Chemical Parameters

DOC concentrations in water were positively correlated with TP (ρ = 0.60), PO43−-P (ρ = 0.55) and TN concentration (ρ = 0.47) and negatively with water ORP (ρ = −0.48) (Figure 4). NO3-N concentrations were positively correlated with TN concentrations (ρ = 0.86) and negatively correlated with water temperature (ρ = −0.55). PO43−-P concentrations were positively correlated with TP (ρ = 0.73), DOC (ρ = 0.55), TN (ρ = 0.47), TSS (ρ = 0.38) and NH4+-N (ρ = 0.37) concentrations. MeHg concentrations in water were positively correlated with pH (ρ = 0.60) and SO42−-S (ρ = 0.57) concentrations and water temperature (ρ = 0.42). There was no significant correlation between MeHg and DOC concentrations in water (ρ = 0.14).
A PLS model revealed that the variation in annual mean water MeHg concentration between the sites was explained by several sediment chemistry parameters (inorganic carbon content and pH (VIP > 1.2)) and water chemistry parameters (ODO, SO42−-S concentrations and water pH (1.0 < VIP > 1.2)) (Figure 5). The PLS model including these parameters as well as those with a VIP > 0.5 (MeHg/THg in sediments, EC in water, the share of spruce forest in the catchment, the salinity in water and the density of ditches) had a goodness of fit (R2) of 0.87 and a goodness of prediction (Q2) of 0.75, indicating a strong model. The only variable with a negative relation to the MeHg concentration was the MeHg/THg ratio in sediments, but the VIP of this variable was below 1.0, and thus it was not that influential in the model (Figure 5).

4. Discussion

This paper presents, to the best of our knowledge, the first study where forest management effects on MeHg concentrations in runoff water have been evaluated in the Baltic countries. Earlier forest management studies from a global perspective have mainly been conducted on upland soils (mainly podsols) (e.g., [65,66,67,68,69]) or rather acidic peatland soils (e.g., [70]). This study was instead conducted on soils dominated by peat but with a water pH that was slightly alkaline, mainly due to Ca- and Mg-rich confined aquifer discharge characteristic for the area [71,72]. The water pH varied within a relatively narrow range from 7.6 to 8.0, showing a seasonal pattern with the highest pH values in the period from May to July. A similar seasonal pattern has been observed in Finnish peatland forests [73]. In contrast to studies which revealed increases in water acidity after DNM (e.g., [74]), in our sites, water pH did not differ significantly between management groups.
The most commonly reported and pronounced effects of DNM are changes in DOC, either decreases (e.g., [29,55,59,75,76,77]) or non-significant impacts (e.g., [74,78]), as well as elevated concentrations of TSS (e.g., [29,55,74,75,79]). DOC concentrations in our undisturbed reference catchments (mean 18.3 mg L−1) were at the same level as the values measured in peatland forests in Fenno-Scandinavia. For example, Nieminen et al. [29] present mean DOC values ranging from 11.2 to 27.1 mg L−1 in control catchments of their study, while Joensuu et al. [73] report a slightly higher mean DOC concentration in old ditch networks, 27.1 mg L−1. The concentrations of DOC were, on average, 13.6 mg L−1 (or 43%) higher in catchments with major disturbances compared with those in undisturbed sites. By contrast, most DNM studies indicate significantly decreased runoff DOC concentrations in DNM-treated areas [54], even up to 30% during the first two years after DNM [59]. One of the dominant processes that may explain the lower DOC concentrations after DNM in many of the former studies could be the lowering of the water table followed by decreased water flow in close contact with surface soil layers rich in easily released organic matter [75]. Water flow paths through deeper mineral layers could instead trap organic matter on the positively charged mineral soil particles. If the ground water level has not been so much affected by the DNM, the DOC concentrations may not drop. DNM has been found to lower the ground water levels more in soils with shallow peat compared to sites with thicker peat layers [80]. Furthermore, if the ground water levels were low already before the DNM, or in the reference catchments, that could explain the lack of any reducing effect on DOC concentrations in watercourses after the DNM [54]. Neither of these explanations seems to fit in our catchments as the peat was not that thick and the flow paths in the disturbed catchments were flowing also through mineral layers, at least during periods and in parts of the catchments. However, the special feature of all the catchments included in this study is the confined aquifer discharge resulting in vertical flow paths, causing water in both the disturbed and reference sites to pass through the mineral soils. This may be one reason why we have not detected lower DOC levels in the DNM sites compared to the reference sites. A lower water table and improved aeration can also accelerate the oxidation of organic matter and result in increased loss of carbon as CO2 into the atmosphere and as DOC into waterbodies (e.g., [81]). Furthermore, the physical disturbance caused by DNM could increase DOC by erosion and soil compaction. In our systems, increased decomposition and/or erosion after DNM may have been the dominant processes, as the DOC concentrations were higher in ditch-cleaned catchments than in reference catchments. In general, this is likely caused by site-specific factors that cause some sites to be more sensitive to forestry operations than others, as well as a variation in the performance of forestry operations and mitigation measures between sites.
The impacts of DNM on different forms (total, organic, inorganic) and species (dissolved, particulate) of N and P have been found to vary, from no or minor increases in concentration (e.g., [29,55,76]) to clearly increasing concentrations of N and P (e.g., [55,74,76,77]). In this study the concentration of NO3-N and TP in water were higher in disturbed catchments compared to undisturbed, even though sediments of the undisturbed sites contained higher concentrations of organic carbon and nutrients. This indicates that sediment chemistry is not necessarily dominant in influencing water chemistry, unless physical disturbance and mobilization of TSS and dissolved elements takes place. Elevated nutrient concentrations after forest management can contribute to eutrophication (e.g., [23,29]). However, concentrations in our catchments were relatively low, and the elevated leaching of nutrients from disturbed catchments are unlikely to cause eutrophication of recipient water bodies. Furthermore, the major component of TP is biologically unavailable. In our sites, concentrations of NH4+-N and PO43−-P, which are more available for biological uptake, did not differ significantly between management groups. In addition, water flow paths and possible dilution along them could have an effect on element concentrations in water. However, flow measurements were not done in this study.
The annual mean concentrations of MeHg in undisturbed reference catchments in this study (0.27 ± 0.10 ng L−1) were in a similar range to those in other studies from Northern Europe, slightly above those from south-middle Norway (0.09–0.18 ng L−1) [52] and southern Finland (0.15 ng L−1) [11], similar to those from north-east of Sweden (0.24 ng L−1) [65], and much below those reported in studies from southern Sweden (up to 3.8 ng L−1) [67] and on drained peatland in Finland (up to 1.8 ng L−1) [70]. Several previous studies found that Hg and MeHg concentrations in water and biota correlate positively with several landscape (catchment) characteristics, such as the percentage of wetlands in the catchment and percentage of forest cover in the catchment [82,83], and short-term hydrologic changes are important in controlling the delivery of Hg to waterbodies [84,85,86]. In our study, site 8 had the smallest share of forest cover and drained peatland. However, these differences were not clearly reflected in water chemistry, including MeHg concentrations (Figure 3). Similarly, on a European scale, Bravo et al. (2018) highlighted the large, non-systematic spatial variability in MeHg concentrations in stream systems (0.0078–0.159 ng L−1) [87]. The rate of Hg methylation is linked to factors controlling the abundance and activity of sulphate-reducing bacteria and other microorganisms capable of methylating Hg, such as a suboxic microenvironments, the availability of sulphate (electron acceptor), high-quality organic matter (electron donor), inorganic Hg and temperature [88]. Similar to our findings, several studies indicated significant seasonal patterns with the concentration of MeHg peaking during summer [65,67], suggesting the importance of temperature for the net methylation of Hg. The intensification of Hg methylation processes during the warmest periods (spring and summer) is also marked by a higher MeHg/DOC ratio in this study. At the same time, the precipitation amount was rather high during the summer period (Supplementary Material, Figure S1), which could cause a dilution of MeHg.
During forest management, there are many processes and activities that can affect the cycling of Hg. The operation of forest machinery driving can cause erosion and compaction (e.g., [11,14,89,90,91]), and tree removal can raise the ground water table and enhance water saturation of soils, which stimulates MeHg formation by Hg-methylating microbes [92,93,94]. As a result of these processes, elevated MeHg concentrations [15,65,67,69,91] or MeHg/TOC (total organic carbon) ratios [66] have been detected in Fennoscandia after forest harvesting activities. Reservoir creation by wetland restoration and beaver dams could also increase MeHg formation [50,95,96,97]. Our study focused on the impact of less-studied management operations, such as ditch cleaning and beaver dam removal. Although these activities can cause soil erosion and driving damage that has been found to increase Hg and MeHg in runoff water, these activities aim to drain the soils and thereby decrease soil water saturation. This could be a reason for the lack of forest management effects on MeHg in the present study.
The concentrations of MeHg in water were positively correlated with the SO42−-S concentration, indicated by both correlation and PLS analyses. This is consistent with findings by Bergman et al. (2012) and Braaten et al. (2020), who concluded that MeHg concentrations in surface waters are related to S dynamics, and the SO42− concentration is an important control of MeHg formation [98,99]. However, while the concentrations of SO42− were higher in disturbed catchments, those of MeHg were not. With elevated SO42− concentrations, there is a risk that MeHg formation may be promoted downstream if the water conditions become more reduced, such as in a beaver dam or other type of impoundment.

5. Conclusions

Initial insights into MeHg variation in water at eight small, forested catchments with organic soils in Latvia (hemiboreal conditions) characterized by different management-induced disturbances to the watercourse revealed elevated carbon and nitrogen concentrations in the disturbed compared with undisturbed catchments. There was no significant difference in the concentrations of MeHg or the MeHg/DOC ratio between disturbed and undisturbed catchments, but SO42− concentrations were elevated in disturbed catchments. Due to the relation between MeHg formation and SO42−, as indicated from both this study and former studies, there is a risk that elevated SO42− concentrations in disturbed catchments could promote MeHg formation if the water turned into a more reduced environment downstream. Forest management disturbance, ditch cleaning, and beaver dam removal activities aim to drain soils and lower ground water levels. These results are thereby a valuable contribution to the quite sparse literature on the effects of ditch cleaning on water quality.

Supplementary Materials

The following are available online at https://www.mdpi.com/article/10.3390/f12091278/s1, Figure S1: Monthly average precipitation pattern for the period 2007–2019 in the study area.

Author Contributions

Conceptualization, Z.L. and K.E.; methodology, Z.L. and K.E.; software, A.B.; investigation, Z.K., I.K., K.B., and A.B.; data curation, Z.K., I.K., and K.B.; writing—original draft preparation, Z.K. and A.B.; writing—review and editing, Z.L., K.E., I.K., and K.B.; visualization, Z.K. and I.K.; supervision, Z.L. and K.E.; project administration, Z.L.; funding acquisition, Z.L. All authors have read and agreed to the published version of the manuscript.

Funding

This work was supported by the Latvian Council of Science project No. lzp-2018/1-0434 ‘Interaction of microbial diversity with methane turnover and mercury methylation in organic soils’.

Data Availability Statement

Research data and materials are available upon request to corresponding author.

Acknowledgments

We are grateful to Roberts Matisons for advice on statistical treatment of data.

Conflicts of Interest

The authors declare no conflict of interest.

Appendix A

Table A1. Characteristics of drainage system catchments corresponding to each sampling site.
Parameter, UnitSampling Site
Site 1Site 2Site 3Site 4Site 5Site 6Site 7Site 8
Catchment area, ha27.854.611.070.6758.5256.4314.1665.2
Elevation (min), m95.895.899.193.193.492.996.4114.3
Elevation (max), m98.7101.799.6106.8132.399.9132.3169.1
Total ditch length, km0.050.580.003.0363.6518.6924.6012.34
Ditch density, m ha−11.910.70.042.983.972.978.318.6
Forest area, ha25.1051.379.4265.93717.51242.37304.87452.60
Share of forest area of total catchment area, %90.194.085.593.394.694.597.168.0
Share of spruce-dominated forest from the total forest area, %27.725.80.013.141.244.631.821.0
Share of pine-dominated forest from the total forest area, %63.569.074.154.839.438.945.841.0
Share of broadleaves-dominated forest from the total forest area, %8.85.225.932.216.716.516.230.8
Share of clearfellings from the total forest area, %0.00.00.00.02.60.06.23.2
Share of drained peatlands from the total forest area, %12.09.60.019.135.821.739.82.4
Share of peatland forests from the total forest area, %40.229.651.80.01.10.02.55.0
Share of wetlands from the total forest area, %0.00.016.00.00.50.00.71.0
Table A2. General water chemistry in small watercourses of drainage systems on forest land with organic soils by sampling site. Annual mean ± S.E., minimum and maximum values are shown in the table.
Parameter, UnitValueSampling Site
Site 1Site 2Site 3Site 4Site 5Site 6Site 7Site 8
pHmean ± S.E.7.79 ± 0.077.84 ± 0.047.59 ± 0.057.71 ± 0.077.61 ± 0.117.95 ± 0.117.58 ± 0.067.75 ± 0.05
min7.467.607.417.206.887.437.337.53
max8.178.087.868.048.118.357.898.01
EC, µS cm−1mean ± S.E.255 ± 5262 ± 10276 ± 9335 ± 8304 ± 16326 ± 10308 ± 9282 ± 8
min237237216288237283272224
max283354315376438374377309
TN, mg L−1mean ± S.E.0.34 ± 0.030.35 ± 0.040.63 ± 0.102.63 ± 0.441.55 ± 0.220.87 ± 0.091.86 ± 0.250.65 ± 0.13
min0.220.200.330.840.630.450.890.17
max0.490.591.185.043.281.403.461.58
NO3-N, mg L−1mean ± S.E.0.07 ± 0.030.10 ± 0.030.17 ± 0.092.52 ± 0.510.52 ± 0.210.27 ± 0.080.68 ± 0.300.54 ± 0.15
min<0.01<0.01<0.010.26<0.01<0.01<0.01<0.01
max0.290.321.056.382.070.743.311.49
NH4+-N, mg L−1mean ± S.E.0.05 ± 0.010.05 ± 0.010.04 ± 0.010.05 ± 0.010.07 ± 0.010.04 ± 0.010.28 ± 0.210.04 ± 0.01
min0.020.010.010.020.030.010.030.01
max0.080.070.070.130.160.092.330.07
TP, mg L−1mean ± S.E.0.019 ± 0.0020.021 ± 0.0020.025 ± 0.0040.042 ± 0.0040.036 ± 0.0040.025 ± 0.0060.057 ± 0.0180.017 ± 0.003
min0.0090.0080.0070.0200.0200.0070.019<LOD
max0.0300.0330.0500.0680.0550.0740.2050.036
PO43−-P, mg L−1mean ± S.E.0.005 ± 0.0020.010 ± 0.0030.010 ± 0.0040.015 ± 0.0050.014 ± 0.0060.008 ± 0.0030.042 ± 0.0160.006 ± 0.002
min<0.001<0.001<0.001<0.001<0.001<0.001<0.001<0.001
max0.0160.0480.0400.0540.0650.0290.1630.018
SO42−-S, mg L−1mean ± S.E.1.76 ± 0.251.82 ± 0.271.86 ± 0.263.91 ± 0.502.64 ± 0.374.07 ± 0.512.70 ± 0.432.83 ± 0.37
min0.630.631.031.691.802.231.211.54
max2.622.773.276.314.565.574.133.65
Cl, mg L−1mean ± S.E.1.62 ± 0.041.60 ± 0.041.97 ± 0.292.20 ± 0.091.69 ± 0.131.60 ± 0.131.54 ± 0.061.80 ± 0.08
min1.461.501.201.761.131.191.301.60
max1.741.773.152.441.982.071.692.11
DOC *, mg L−1mean ± S.E.13.021.9 ± 8.316.5 ± 0.929.5 ± 4.234.6 ± 3.529.2 ± 0.940.9 ± 3.313.7 ± 1.7
min13.013.515.525.327.827.737.111.4
max13.038.618.233.739.530.747.416.9
TSS, mg L−1mean ± S.E.2.2 ± 0.414.0 ± 5.24.5 ± 0.733.6 ± 19.427.3 ± 12.810.6 ± 6.620.0 ± 11.56.3 ± 3.2
min<0.1<0.11.61.20.6<0.1<0.1<0.1
max5.357.07.6242.4136.876.5130.736.8
ODO, mg L−1mean ± S.E.8.9 ± 0.69.9 ± 0.68.1 ± 1.09.1 ± 0.69.0 ± 1.112.1 ± 0.56.7 ± 1.09.5 ± 0.8
min3.57.54.56.50.79.21.16.2
max10.913.412.112.012.614.411.213.3
ORP, mVmean ± S.E.287 ± 12272 ± 11267 ± 6286 ± 9195 ± 33229 ± 8258 ± 8257 ± 12
min242240243238-84198226211
max346349300310270282294337
* Information on DOC concentration in water during autumn season is not available.

References

  1. Marttila, H.; Lepistö, A.; Tolvanen, A.; Bechmann, M.; Kyllmar, K.; Juutinen, A.; Wenng, H.; Skarbøvik, E.; Futter, M.; Kortelainen, P.; et al. Potential impacts of a future Nordic bioeconomy on surface water quality. Ambio 2020, 49, 1722–1735. [Google Scholar] [CrossRef] [PubMed]
  2. Hetemäki, L. The outlook for Nordic-Baltic forest bioeconomy to 2030. In The Forest Industry around the Baltic Sea Region: Future Challenges and Opportunities; Liuhto, K., Ed.; Centrum Balticum: Turku, Finland, 2020; pp. 14–24. [Google Scholar]
  3. Akselsson, C.; Westling, O.; Sverdrup, H.; Gindersen, P. Nutrient and carbon budgets in forest soils as decision support in sustainable forest management. For. Ecol. Manag. 2007, 238, 167–174. [Google Scholar] [CrossRef]
  4. Schelker, J.; Eklöf, K.; Bishop, K.; Laudon, H. Effects of forestry operations on dissolved organic carbon concentrations and export in boreal first-order streams. J. Geophys. Res. 2012, 117, G01011. [Google Scholar] [CrossRef]
  5. Akselsson, C.; Westling, O.; Alveteg, M.; Thelin, G.; Fransson, A.-M.; Hellsten, S. The influence of N load and harvest intensity on the risk of P limitation in Swedish forest soils. Sci. Total Environ. 2008, 404, 284–289. [Google Scholar] [CrossRef]
  6. Gundersen, P.; Schmidt, I.K.; Raulund-Rasmussen, K. Leaching of nitrate from temperate forests–effects of air pollution and forest management. Environ. Rev. 2006, 14, 1–57. [Google Scholar] [CrossRef]
  7. Löfgren, S.; Ring, E.; von Brömssen, C.; Sørensen, R.; Högbom, L. Short-term effects of clear-cutting on the water chemistry of two boreal streams in northern Sweden: A paired catchment study. Ambio 2009, 38, 347–356. [Google Scholar] [CrossRef]
  8. Palvianinen, M.; Finér, L.; Laurén, A.; Mattsson, T.; Högbom, L. A method to estimate the impact of clear-cutting on nutrient concentrations in boreal headwater streams. Ambio 2015, 44, 521–531. [Google Scholar] [CrossRef] [PubMed] [Green Version]
  9. Schelker, J.; Sponseller, R.; Ring, E.; Högbom, L.; Löfgren, S.; Laudon, H. Nitrogen export from a boreal stream network following forest harvesting: Seasonal nitrate removal and conservative export of organic forms. Biogeosciences 2016, 13, 1–12. [Google Scholar] [CrossRef] [Green Version]
  10. Sponseller, R.A.; Gundale, M.J.; Futter, M.; Ring, E.; Nordin, A.; Näsholm, T.; Laudon, H. Nitrogen dynamics in managed boreal forests: Recent advances and future research directions. Ambio 2016, 45, 175–187. [Google Scholar] [CrossRef] [Green Version]
  11. Porvari, P.; Verta, M.; Munthe, J.; Haapanen, M. Forestry practices increase mercury and methyl mercury output from boreal forest catchments. Environ. Sci. Technol. 2003, 37, 2389–2393. [Google Scholar] [CrossRef]
  12. Bishop, K.; Allan, C.; Bringmark, L.; Garcia, E.; Hellsten, S.; Högbom, L.; Johansson, K.; Lomander, A.; Meili, M.; Munthe, J.; et al. The Effects of Forestry on Hg Bioaccumulation in Nemoral/Boreal Waters and Recommendations for Good Silvicultural Practice. Ambio 2009, 38, 373–380. [Google Scholar] [CrossRef]
  13. Bishop, K.; Allan, C.J.; Bringmark, L.; Garcia, E.; Hellsten, S.; Högbom, L.; Johansson, K.; Lomander, A.; Meili, M.; Munthe, J.; et al. Forestry’s contribution to Hg bioaccumulation in freshwaters: Assessment of the available evidence. J. R. Swed. Acad. For. Agric. 2009, 148, 9–23. [Google Scholar]
  14. Eklöf, K.; Lidskog, R.; Bishop, K. Managing Swedish forestry’s impact on mercury in fish: Defining the impact and mitigation measures. Ambio 2016, 45, 163–174. [Google Scholar] [CrossRef] [PubMed]
  15. Kronberg, R.M.; Drott, A.; Jiskra, M.; Wiederhold, J.G.; Björn, E.; Skyllberg, U. Forest harvest contribution to Boreal freshwater methyl mercury load. Glob. Biogeochem. Cycles 2016, 30, 825–843. [Google Scholar] [CrossRef] [Green Version]
  16. Bishop, K.; Seibert, J.; Köhler, S.; Laudon, H. Resolving the Double Paradox of rapidly mobilized old water with highly variable responses in runoff chemistry. Hydrol. Process. 2004, 18, 185–189. [Google Scholar] [CrossRef]
  17. Creed, I.F.; Bergström, A.-K.; Trick, C.G.; Grimm, N.B.; Hessen, D.O.; Karlsson, J.; Kidd, K.A.; Kritzberg, E.; McKnight, D.M.; Freeman, E.C.; et al. Global change-driven effects on dissolved organic matter composition: Implications for food webs of northern lakes. Glob. Chang. Biol. 2018, 24, 3692–3714. [Google Scholar] [CrossRef]
  18. Nova, C.C.; Bozelli, R.L.; Spitzy, A.; Müller-Navarra, D. Living in a browning environment: Effects on Daphnia’s growth and fatty acid pattern. Limnol. Oceanogr. 2019, 64, 18–31. [Google Scholar] [CrossRef]
  19. Bieroza, M.; Baker, A.; Bridgeman, J. Relating freshwater organic matter fluorescence to organic carbon removal efficiency in drinking water treatment. Sci. Total Environ. 2009, 407, 1765–1774. [Google Scholar] [CrossRef]
  20. Rock, J.J. Formation of haloforms during chlorination of natural waters. Water Treat Exam 1974, 23, 234–243. [Google Scholar]
  21. Bishop, K.; Shanley, J.B.; Riscassi, A.; de Wit, H.A.; Eklöf, K.; Meng, B.; Mitchell, C.; Osterwalder, S.; Schuster, P.F.; Webster, J.; et al. Recent advances in understanding and measurement of mercury in the environment: Terrestrial Hg cycling. Sci. Total Environ. 2020, 721, 137647. [Google Scholar] [CrossRef]
  22. Laudon, H.; Sponseller, R.A.; Bishop, K. From legacy effects of acid deposition in boreal streams to future environmental threats. Environ. Res. Lett. 2021, 16, 015007. [Google Scholar] [CrossRef]
  23. Kreutzweiser, D.P.; Hazlett, P.W.; Gunn, J.M. Logging impacts on the biogeochemistry of boreal forest soils and nutrient export to aquatic systems: A review. Environ. Rev. 2008, 16, 157–179. [Google Scholar] [CrossRef]
  24. Lamontagne, S.; Carignan, R.; D’Arcy, P.; Prairie, Y.T.; Paré, D. Element export in runoff from eastern Canadian Boreal Shield drainage basins following forest harvesting and wildfires. Can. J. Fish. Aquat. Sci. 2000, 57, 118–128. [Google Scholar] [CrossRef]
  25. Nieminen, M.; Sarkkola, S.; Sallantaus, T.; Hasselquist, E.M.; Laudon, H. Peatland drainage—A missing link behind increasing TOC concentrations in waters from high latitude forest catchments? Sci. Total Environ. 2021, 774, 145150. [Google Scholar] [CrossRef] [PubMed]
  26. Conley, D.J.; Paerl, H.W.; Howarth, R.W.; Boesch, D.F.; Seitzinger, S.P.; Havens, K.E.; Lancelot, C.; Likens, G.E. Controlling eutrophication: Nitrogen and phosphorus. Science 2009, 323, 1014–1015. [Google Scholar] [CrossRef] [PubMed]
  27. Le Moal, M.; Gascuel-Odoux, C.; Ménesguen, A.; Souchon, Y.; Étrillard, C.; Levain, A.; Moatar, F.; Pannard, A.; Souchu, P.; Lefebvre, A.; et al. Eutrophication: A new wine in an old bottle? Sci. Total Environ. 2019, 651, 1–11. [Google Scholar] [CrossRef] [Green Version]
  28. Ahtiainen, M.; Huttunen, P. Long-term effects of forestry managements on water quality and loading in brooks. Boreal Environ. Res. 1999, 4, 101–114. [Google Scholar]
  29. Nieminen, M.; Ahti, E.; Koivusalo, H.; Mattsson, T.; Sarkkola, S.; Laurén, A. Export of suspended solids and dissolved elements from peatland areas after ditch network maintenance in south-central Finland. Silva Fenn. 2010, 44, 39–49. [Google Scholar] [CrossRef] [Green Version]
  30. Vitousek, P.M.; Gosz, J.R.; Grier, C.C.; Melillo, J.M.; Reiners, W.A.; Todd, R.L. Nitrate losses from disturbed ecosystems. Science 1979, 204, 469–474. [Google Scholar] [CrossRef] [Green Version]
  31. Stednick, J.D. Monitoring the effects of timber harvest on annual water yield. J. Hydrol. 1996, 176, 79–95. [Google Scholar] [CrossRef]
  32. Paavolainen, L.; Smolander, A. Nitrification and denitrification in soil from a clear-cut Norway spruce (Picea abies) stand. Soil Biol. Biochem. 1998, 30, 775–781. [Google Scholar] [CrossRef]
  33. Smolander, A.; Kitunen, V.; Mälkönen, E. Dissolved soil organic nitrogen and carbon in a Norway spruce stand and an adjacent clear-cut. Biol. Fertil. Soils 2001, 33, 190–196. [Google Scholar] [CrossRef]
  34. Palviainen, M.; Finér, L.; Kurka, A.-M.; Mannerkoski, H.; Piirainen, S.; Starr, M. Decomposition and nutrient release from logging residues after clear-cutting of mixed boreal forest. Plant Soil 2004, 263, 53–67. [Google Scholar] [CrossRef]
  35. Bonsdorff, E. Eutrophication: Early warning signals, ecosystem-level and societal responses, and ways forward. Ambio 2021, 50, 753–758. [Google Scholar] [CrossRef] [PubMed]
  36. Mergler, D.; Anderson, H.A.; Chan, L.H.M.; Mahaffey, K.R.; Murray, M.; Sakamoto, M.; Stern, A.H. Methylmercury exposure and health effects in humans: A worldwide concern. Ambio 2007, 36, 3–11. [Google Scholar] [CrossRef]
  37. Mercury and Health. Available online: https://www.who.int/news-room/fact-sheets/detail/mercury-and-health (accessed on 22 July 2021).
  38. Mergler, D. Ecosystem approaches to mercury and human health: A way toward the future. Ambio 2021, 50, 527–531. [Google Scholar] [CrossRef] [PubMed]
  39. HELCOM Core Indicator Report. Available online: https://helcom.fi/wp-content/uploads/2019/08/Metals-HELCOM-core-indicator-2018.pdf (accessed on 22 July 2021).
  40. Korpinen, S.; Laamanen, M.; Andersen, J.H.; Asplund, L.; Berger, U.; Bignert, A.; Boalt, E.; Broeg, K.; Brzozowska, A.; Cato, I.; et al. Hazardous Substances in the Baltic Sea: An Integrated Thematic Assessment of Hazardous Substances in the Baltic Sea; Helsinki Commission: Helsinki, Finland, 2010; p. 116. [Google Scholar]
  41. Legal Acts of the Republic of Latvia. Regulations Regarding the Quality of Surface Waters and Groundwaters. Available online: https://likumi.lv/ta/en/en/id/60829-regulations-regarding-the-quality-of-surface-waters-and-groundwaters (accessed on 22 July 2021).
  42. LEGMC Report on Surface Water and Groundwater Condition in 2019. 2020. Available online: https://videscentrs.lvgmc.lv/files/Udens/udens_kvalitate/VPUK_2019_FINAL_26102020.pdf (accessed on 22 July 2021). (In Latvian).
  43. Castoldi, A.F.; Coccini, T.; Manzo, L. Neurotoxic and Molecular Effects of Methylmercury in Humans. Rev. Environ. Health 2003, 18, 19–31. [Google Scholar] [CrossRef]
  44. Compeau, G.C.; Bartha, R. Sulfate-Reducing Bacteria: Principal Methylators of Mercury in Anoxic Estuarine Sediment. Appl. Environ. Microbiol. 1985, 50, 498–502. [Google Scholar] [CrossRef] [Green Version]
  45. Gilmour, C.C.; Henry, E.A.; Mitchell, R. Sulfate stimulation of mercury methylation in freshwater sediments. Environ. Sci. Technol. 1992, 26, 2281–2287. [Google Scholar] [CrossRef]
  46. Fleming, E.J.; Mack, E.E.; Green, P.G.; Nelson, D.C. Mercury methylation from unexpected sources: Molybdate-inhibited freshwater sediments and an ironreducing bacterium. Appl. Environ. Microbiol. 2005, 72, 457–464. [Google Scholar] [CrossRef] [Green Version]
  47. Wood, J.M.; Kennedy, F.S.; Rosen, C.G. Synthesis of Methyl-mercury Compounds by Extracts of a Methanogenic Bacterium. Nature 1968, 220, 173–174. [Google Scholar] [CrossRef]
  48. Hamelin, S.; Amyot, M.; Barkay, T.; Wang, Y.; Planas, D. Methanogens: Principal Methylators of Mercury in Lake Periphyton. Environ. Sci. Technol. 2011, 45, 7693–7700. [Google Scholar] [CrossRef] [PubMed]
  49. Gilmour, C.C.; Podar, M.; Bullock, A.L.; Graham, A.M.; Brown, S.D.; Somenahally, A.C.; Johs, A.; Hurt, R.A.; Bailey, K.L.; Elias, D.A. Mercury Methylation by Novel Microorganisms from New Environments. Environ. Sci. Technol. 2013, 47, 11810–11820. [Google Scholar] [CrossRef] [PubMed]
  50. Hsu-Kim, H.; Eckley, C.S.; Achá, D.; Feng, X.; Gilmour, C.C.; Jonsson, S.; Mitchell, C.P.J. Challenges and opportunities for managing aquatic mercury pollution in altered landscapes. Ambio 2018, 47, 141–169. [Google Scholar] [CrossRef] [PubMed] [Green Version]
  51. Allan, C.J.; Heyes, A.; Mackereth, R.J. 2009. Changes to groundwater and surface water Hg transport flollowing clearcut logging: A Canadian case study. J. R. Swed. Acad. For. Agric. 2009, 148, 50–54. [Google Scholar]
  52. De Wit, H.A.; Granhus, A.; Lindholm, M.; Kainz, M.J.; Lin, Y.; Braaten, H.F.V.; Blaszczak, J. Forest harvest effects on mercury in streams and biota in Norwegian boreal catchments. For. Ecol. Manag. 2014, 324, 52–63. [Google Scholar] [CrossRef] [Green Version]
  53. Koskinen, M.; Tahvanainen, T.; Sarkkola, S.; Menberu, M.W.; Laurén, A.; Sallantaus, T.; Marttila, H.; Ronkanen, A.-K.; Parviainen, M.; Tolvanen, A.; et al. Restoration of nutrient-rich forestry-drained peatlands poses a risk for high exports of dissolved organic carbon, nitrogen, and phosphorus. Sci. Total Environ. 2017, 586, 858–869. [Google Scholar] [CrossRef]
  54. Nieminen, M.; Palviainen, M.; Sarkkola, S.; Laurén, A.; Marttila, H.; Finér, L. A synthesis of the impacts of ditch network maintenance on the quantity and quality of runoff from drained boreal peatland forests. Ambio 2018, 47, 523–534. [Google Scholar] [CrossRef] [PubMed]
  55. Joensuu, S.; Ahti, E.; Vuollekoski, M. Effects of ditch network maintenance on the chemistry of run-off water from peatland forests. Scand. J. For. Res. 2002, 17, 238–247. [Google Scholar] [CrossRef]
  56. Hynninen, A.; Sarkkola, S.; Laure’n, A.; Koivusalo, H.; Nieminen, M. Capacity of riparian buffer areas to reduce ammonium export originating from ditch network maintenance areas in peatlands drained for forestry. Boreal Environ. Res. 2011, 16, 430–444. [Google Scholar]
  57. Joensuu, S.; Vuollekoski, M.; Karosto, K. Kunnostusojitusten pitkäaikaisvaikutuksia. Suom. Ympäristö-Finn. Environ.-Miljön I Finl. 2006, 816, 83–90. (In Finnish) [Google Scholar]
  58. Åström, M.; Aaltonen, E.K.; Koivusaari, J. Impact of forest ditching on nutrient loadings of a small stream—A paired catchment study in Kronoby, W. Finland. Sci. Total Environ. 2002, 297, 127–140. [Google Scholar] [CrossRef]
  59. Hansen, K.; Kronnäs, V.; Zetterberg, T.; Setterberg, M.; Moldan, F.; Pettersson, P.; Munthe, J. The Effect of Ditch Cleaning on Discharge, Water Chemistry and Benthos in Forest Ecosystems; Report B2072; IVL Swedish Environmental Research Institute: Stockholm, Sweden, 2013. (In Swedish) [Google Scholar]
  60. Zālītis, P. The impact of the hydrological regime of the peat soils upon the growth potential of young spruce stands. Mezzinatne 2008, 17, 3–8. (In Latvian) [Google Scholar]
  61. Eriksson, L.; Johansson, E.; Kettapeh-Wold, N.; Wold, S. Introduction to Multiand Megavariate Data Analysis using Projection Methods (PCA & PLS); Umetrics: Umea, Sweden, 1999. [Google Scholar]
  62. Wold, S.; Sjöström, M.; Eriksson, L. PLS-regression: A basic tool of chemometrics. Chemom. Intell. Lab. Syst. 2001, 58, 109–130. [Google Scholar] [CrossRef]
  63. Kucheryavskiy, S. mdatools–R package for chemometrics. Chemom. Intell. Lab. Syst. 2020, 198, 103937. [Google Scholar] [CrossRef]
  64. R Core Team. R: A Language and Environment for Statistical Computing. Available online: http://www.r-project.org/ (accessed on 16 September 2021).
  65. Eklöf, K.; Schelker, J.; Sørensen, R.; Meili, M.; Laudon, H.; Von Brömssen, C.; Bishop, K. Impact of forestry on total and methyl-mercury in surface waters: Distinguishing effects of logging and site preparation. Environ. Sci. Technol. 2014, 48, 4690–4698. [Google Scholar] [CrossRef]
  66. Skyllberg, U.; Westin, M.B.; Meili, M.; Björn, E. Elevated Concentrations of Methyl Mercury in Streams after Forest Clear-Cut: A Consequence of Mobilization from Soil or New Methylation? Environ. Sci. Technol. 2009, 43, 8535–8541. [Google Scholar] [CrossRef] [PubMed]
  67. Eklöf, K.; Meili, M.; Åkerblom, S.; von Brömssen, C.; Bishop, K. Impact of stump harvest on run-off concentrations of total mercury and methylmercury. For. Ecol. Manag. 2013, 290, 83–94. [Google Scholar] [CrossRef]
  68. Kronberg, R.M.; Tjerngren, I.; Drott, A.; Björn, E.; Skyllberg, U. Net degradation of methyl mercury in alder swamps. Environ. Sci. Technol. 2012, 46, 13144–13151. [Google Scholar] [CrossRef]
  69. Porvari, P.; Verta, M.; Munthe, J. The Effect of Forestry Practices on Mercury and Methyl Mercury Output from Forest Catchment: A Follow-up Stud. Mater. Geoenviron. 2004, 51, 1316–1319. [Google Scholar]
  70. Ukonmaanaho, L.; Starr, M.; Kantola, M.; Laurén, A.; Piispanen, J.; Pietilä, H.; Perämäki, P.; Merilä, P.; Fritze, H.; Tuomivirta, T.; et al. Impacts of forest harvesting on mobilization of Hg and MeHg in drained peatland forests on black schist or felsic bedrock. Environ. Monit. Assess. 2016, 188, 228. [Google Scholar] [CrossRef]
  71. Zālītis, P. Forest and Water; LSFRI Silava: Salaspils, Latvia, 2012; 356p. (In Latvian) [Google Scholar]
  72. Kalvīte, Z.; Lībiete, Z.; Kļaviņš, I.; Bārdule, A.; Bičkovskis, K. The impact of beaver dam removal on the chemical properties of water in drainage ditches in peatland forests. Scand. J. For. Res. 2021, 36, 1–14. [Google Scholar] [CrossRef]
  73. Joensuu, S.; Ahti, E.; Vuollekoski, M. Discharge water quality from old ditch networks in Finnish peatland forests. Suo 2001, 52, 1–15. [Google Scholar]
  74. Manninen, P. Effects of forestry ditch cleaning and supplementary ditching on water quality. Boreal Environ. Res. 1998, 3, 23–32. [Google Scholar]
  75. Åström, M.; Aaltonen, E.K.; Koivusaari, J. Impact of ditching in a small forested catchment on concentrations of suspended material, organic carbon, hydrogen ions and metals in stream water. Aquat. Geochem. 2001, 7, 57–73. [Google Scholar] [CrossRef]
  76. Joensuu, S.; Ahti, E.; Vuollekoski, M. Long-term effects of maintaining ditch networks on runoff quality. Suo 2001, 52, 17–28. [Google Scholar]
  77. Åström, M.; Aaltonen, E.K.; Koivusaari, J. Changes in leaching patterns of nitrogen and phosphorus after artificial drainage of a boreal forest—A paired catchment study in Lappajärvi, western Finland. Boreal Environ. Res. 2005, 10, 67–78. [Google Scholar]
  78. Joensuu, S. Hydrological and Hydrochemical Impacts of Ditch Network Maintenance; TASO-Hanke-Kunnostusojituksen Vesiensuojelupäivä Jyväskylässä: Jyväskylässä, Finland, 16 April 2013; p. 1. (In Finnish) [Google Scholar]
  79. Tuukkanen, T.; Stenberg, L.; Marttila, H.; Finér, L.; Piirainen, S.; Koivusalo, H.; Kløve, B. Erosion mechanisms and sediment sources in a peatland forest after ditch cleaning. Earth Surf. Process. Landf. 2016, 41, 1841–1853. [Google Scholar] [CrossRef]
  80. Koivusalo, H.; Ahti, E.; Laurén, A.; Kokkonen, T.; Karvonen, T.; Nevalainen, R.; Finér, L. Impacts of ditch cleaning on hydrological processes in a drained peatland forest. Hydrol. Earth Syst. Sci. 2008, 12, 1211–1227. [Google Scholar] [CrossRef]
  81. Laine, J.; Silvola, J.; Tolonen, K.; Alm, J.; Nykänen, H.; Vasander, H.; Sallantaus, T.; Savolainen, I.; Sinisalo, J.; Martikainen, P.J. Effect of water-level drawdown on global climatic warming: Northern peatlands. Ambio 1996, 25, 179–184. [Google Scholar]
  82. Graydon, J.A.; St. Louis, V.L.; Lindberg, S.E.; Sandilands, K.A.; Rudd, J.W.M.; Kelly, C.A.; Harris, R.; Tate, M.T.; Krabbenhoft, D.P.; Emmerton, C.A.; et al. The role of terrestrial vegetation in atmospheric Hg deposition: Pools and fluxes of spike and ambient Hg from the METAALICUS experiment. Glob. Biogeochem. Cycles 2012, 26. [Google Scholar] [CrossRef] [Green Version]
  83. Witt, E.L.; Kolka, R.K.; Nater, E.A.; Wickman, T.R. Influence of the Forest Canopy on Total and Methyl Mercury Deposition in the Boreal Forest. Water Air Soil Pollut. 2009, 199, 3–11. [Google Scholar] [CrossRef]
  84. Brigham, M.E.; Wentz, D.A.; Aiken, G.R.; Krabbenhoft, D.P. Mercury cycling in stream ecosystems. 1. Water column chemistry and transport. Environ. Sci. Technol. 2009, 43, 2720–2725. [Google Scholar] [CrossRef]
  85. Shanley, J.B.; Kamman, N.C.; Clair, T.A.; Chalmers, A. Physical controls on total and methylmercury concentrations in streams and lakes of the northeastern USA. Ecotoxicology 2005, 14, 125–134. [Google Scholar] [CrossRef]
  86. Nagorski, S.A.; Engstrom, D.R.; Hudson, J.P.; Krabbenhoft, D.P.; Hood, E.; Dewild, J.F.; Aiken, G.R. Spatial distribution of mercury in southeastern Alaskan streams influenced by glaciers, wetlands, and salmon. Environ. Pollut. 2014, 184, 67–72. [Google Scholar] [CrossRef]
  87. Bravo, A.G.; Kothawala, D.N.; Attermeyer, K.; Tessier, E.; Bodmer, P.; Ledesma, J.L.J.; Audet, J.; Casas-Ruiz, J.P.; Catalán, N.; Cauvy-Fraunié, S.; et al. The interplay between total mercury, methylmercury and dissolved organic matter in fluvial systems: A latitudinal study across Europe. Water Res. 2018, 144, 172–182. [Google Scholar] [CrossRef] [PubMed]
  88. Drott, A.; Lambertsson, L.; Björn, E.; Skyllberg, U. Do Potential Methylation Rates Reflect Accumulated Methyl Mercury in Contaminated Sediments? Environ. Sci. Technol. 2008, 42, 153–158. [Google Scholar] [CrossRef] [PubMed]
  89. Eklöf, K.; Bishop, K.; Bertilsson, S.; Björn, E.; Buck, M.; Skyllberg, U.; Osman, O.A.; Kronberg, R.M.; Bravo, A.G. Formation of mercury methylation hotspots as a consequence of forestry operations. Sci. Total Environ. 2018, 613–614, 1069–1078. [Google Scholar] [CrossRef] [PubMed]
  90. Braaten, H.F.V.; de Wit, H.A. Effects of disturbance and vegetation type on total and methylmercury in boreal peatland and forest soils. Environ. Pollut. 2016, 218, 140–149. [Google Scholar] [CrossRef] [PubMed] [Green Version]
  91. Munthe, J.; Hultberg, H. Mercury and Methylmercury in Runoff from a Forested Catchment—Concentrations, Fluxes, and Their Response to Manipulations. Water Air Soil Pollut. Focus Vol. 2004, 4, 607–618. [Google Scholar] [CrossRef]
  92. Stamenkovic, J.; Gustin, M.S.; Dennett, K.E. Net methyl mercury production versus water quality improvement in constructed wetlands: Trade-offs in pollution control. Wetlands 2005, 25, 748–757. [Google Scholar] [CrossRef]
  93. Selvendiran, P.; Driscoll, C.T.; Bushey, J.T.; Montesdeoca, M.R. Wetland influence on mercury fate and transport in a temperate forested watershed. Environ. Pollut. 2008, 154, 46–55. [Google Scholar] [CrossRef] [PubMed]
  94. Paranjape, A.R.; Hall, B.D. Recent advances in the study of mercury methylation in aquatic systems. FACETS 2017, 2, 85–119. [Google Scholar] [CrossRef]
  95. Roy, V.; Amyot, M.; Carignan, R. Beaver ponds increase methylmercury concentrations in Canadian shield streams along vegetation and pond-age gradients. Environ. Sci. Technol. 2009, 43, 5605–5611. [Google Scholar] [CrossRef] [PubMed]
  96. Levanoni, O.; Bishop, K.; Mckie, B.G.; Hartman, G.; Eklöf, K.; Ecke, F. Impact of Beaver Pond Colonization History on Methylmercury Concentrations in Surface Water. Environ. Sci. Technol. 2015, 49, 12679–12687. [Google Scholar] [CrossRef]
  97. Ecke, F.; Levanoni, O.; Audet, J.; Carlson, P.; Eklöf, K.; Hartman, G.; McKie, B.; Ledesma, J.; Segersten, J.; Truchy, A.; et al. Meta-analysis of environmental effects of beaver in relation to artificial dams. Environ. Res. Lett. 2017, 12, 113002. [Google Scholar] [CrossRef]
  98. Bergman, I.; Bishop, K.; Tu, Q.; Frech, W.; Åkerblom, S.; Nilsson, M. The Influence of Sulphate Deposition on the Seasonal Variation of Peat Pore Water Methyl Hg in a Boreal Mire. PLoS ONE 2012, 7, e45547. [Google Scholar] [CrossRef]
  99. Braaten, H.F.V.; Lindholm, M.; de Wit, H.A. Five decades of declining methylmercury concentrations in boreal foodwebs suggest pivotal role for sulphate deposition. Sci. Total Environ. 2020, 714, 136774. [Google Scholar] [CrossRef]
Figure 1. Location of the research area in the Baltic Sea region (a); Locations of study sites and catchment areas (b). The dark blue lines in (b) represent the sub-catchment boundaries while the light blue lines represent the drainage ditches.
Forests 12 01278 g001
Figure 2. Variation of water general chemistry (pH and concentrations of DOC (dissolved organic carbon), TSS (total suspended solids), TN (total nitrogen), NO3-N, SO42−-S, TP (total phosphorus) and PO43−-P) and MeHg concentration in small watercourses of drainage systems in forest land with organic soils by groups of management-induced disturbance. In the boxplots, the median is shown by the bold line, the mean is shown by the black dot, the box corresponds to the lower and upper quartiles, whiskers show the minimal and maximal values (within 150% of the interquartile range from the median) and dots outside the box and whiskers represent outliers of the datasets. Coloured dots represent different seasons: AU—autumn, WI—winter, SP—spring, SU—summer.
Forests 12 01278 g002
Figure 3. Principal component analysis (PCA) of physico-chemical parameters of water in small watercourses of drainage systems under different levels of management-induced disturbance. Arrows represent variable loadings. AU—autumn, WI—winter, SP—spring, SU—summer, DOC—dissolved organic carbon, EC—electrical conductivity, ODO—optical dissolved oxygen, ORP—oxidation-reduction potential, Sal.—salinity, TN—total nitrogen, TP—total phosphorus, TSS—total phosphorus.
Forests 12 01278 g003
Figure 4. Spearman’s correlations between water physico-chemical parameters. Positive correlations are displayed in blue and negative correlations in red. Colour intensity and the size of the circle are proportional to the correlation coefficients. In the right side of the correlogram, the legend colour shows the correlation coefficients and the corresponding colours. Correlations with p > 0.05 are considered as insignificant (crosses are added). DOC—dissolved organic carbon, EC—electrical conductivity, ODO—optical dissolved oxygen, ORP—oxidation-reduction potential, Sal.—salinity, TN—total nitrogen, TP—total phosphorus, TSS—total phosphorus.
Forests 12 01278 g004
Figure 5. The PLS regression coefficients (±S.E.) showing the most influential descriptor variables (predictors) on the mean annual MeHg concentration in small watercourses of drainage systems (the spatial dataset). EC—electrical conductivity, IC—inorganic carbon, OC—organic carbon, ODO—optical dissolved oxygen.
Forests 12 01278 g005
Table 1. Characterization of the sampling sites, including the sampling site coordinates, the type of disturbance, the character of the ditch/stream (e.g., natural versus drainage ditch) and carbon, nitrogen, sulphur and phosphorus concentrations in sediments.
Sampling SiteSampling Point Coordinates
(Latitude; Longitude)
Management-Induced DisturbanceType of DisturbanceOrganic Carbon Concentration
(g kg−1)
Total Nitrogen Concentration
(g kg−1)
Total Sulphur Concentration
(g kg−1)
Total Phosphorus Concentration
(g kg−1)
Site 156.689° N;
25.815° E
NoneNatural stream, no disturbance>400>15>5>0.5
Site 256.693° N;
25.810° E
NoneNatural stream, no disturbance>400>15>5>0.5
Site 356.699° N;
25.816° E
NoneNatural stream, no disturbance>400>15>5>0.5
Site 456.664° N;
25.863° E
MinorDrainage ditches >10 years since ditch cleaning<100<10<2<0.5
Site 556.693° N;
25.862° E
MajorDrainage ditch with beaver dam removal in 2017<100<10<2<0.5
Site 656.696° N;
25.861° E
MajorDrainage ditch, ditch cleaning in 2016<100<10<2<0.5
Site 756.682° N;
25.838° E
MinorDrainage ditch, >10 years since ditch cleaning<100<10<2<0.5
Site 856.731° N;
25.839° E
MinorNatural stream with careful beaver dam removal in recent years (2016)<100<10<2<0.5
Publisher’s Note: MDPI stays neutral with regard to jurisdictional claims in published maps and institutional affiliations.

