1. Introduction
Forest resources provide wood products for building constructions, and the material properties of wood attract wide attention. Duration of load (DOL) of wood refers to the fact that the strength of wood decreases under sustained load, which is usually reflected by the ratio of the time-dependent long-term strength of wood to the short-term strength. The earliest study on DOL was conducted by Buffon [
1]. He concluded that the long-term load-carrying capability of Oak beams should be less than half of the short-term capability. In 1881, Thurston [
2] found out that specimens of wood in bending loaded at a stress ratio of 0.6, the ratio of the applied stress to the short-term bending strength, also known as modulus of rupture, would fail in 8 to 15 months. In 1947, Wood [
3] conducted experimental investigations of DOL of wood in bending with Douglas-fir small clear specimens, in which the short-term strength of a specimen that was to undergo the long-term test was estimated by the pair matching method. The specimens with moisture content (MC) of 6% and 12% were tested, respectively. The DOL was reflected by a linear relationship between the logarithmic failure time and the stress ratio as
SL = 90.4 − 6.3 lg(
tf), where
SL was the stress ratio (%), and
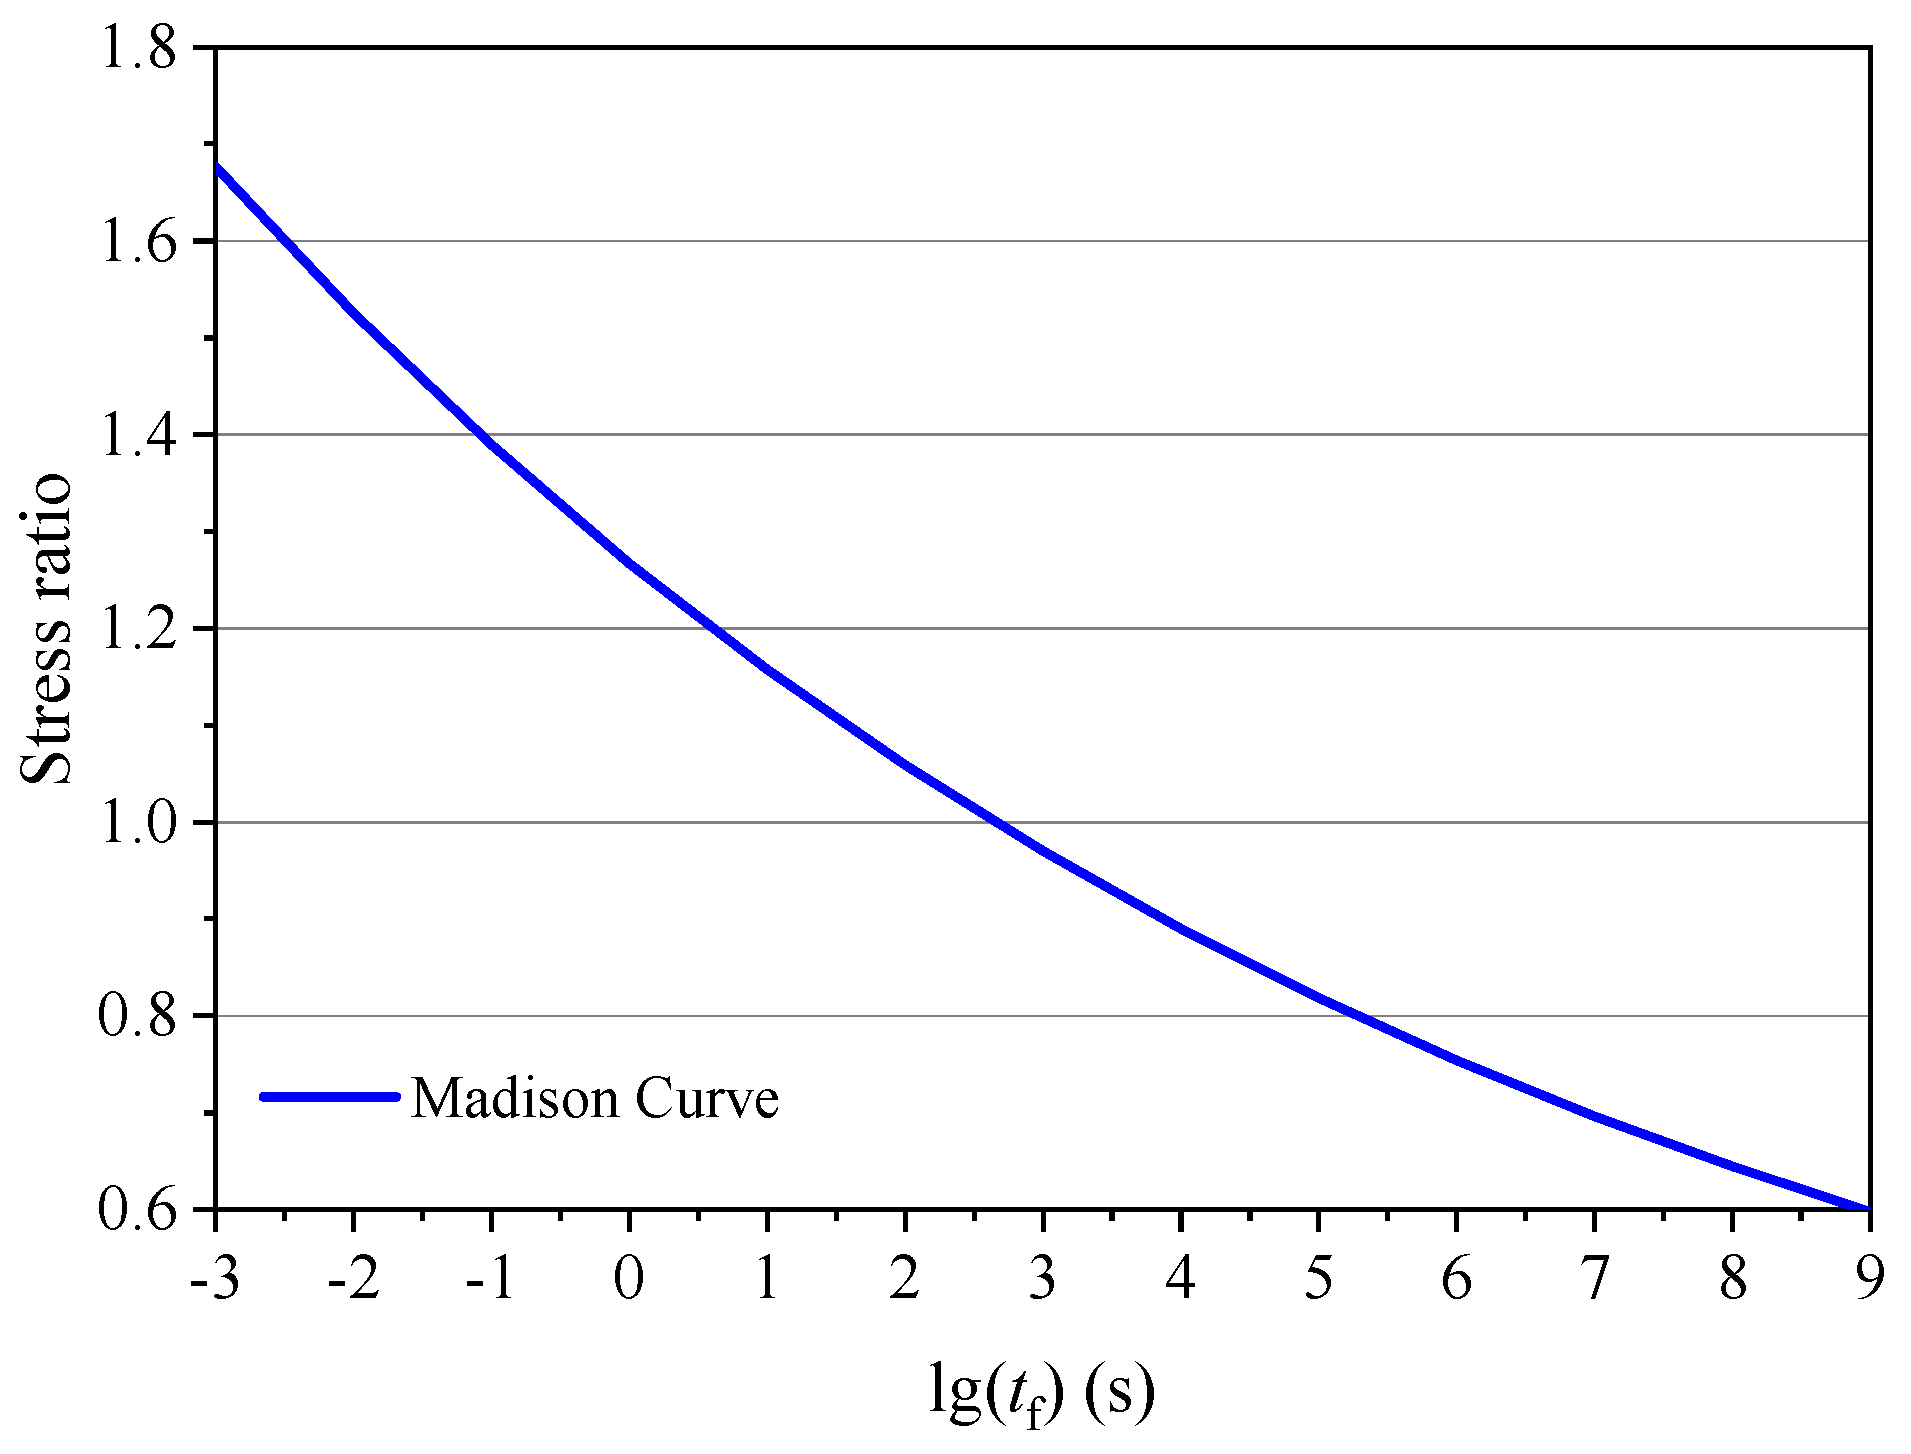
tf was the failure time of wood in hours. In 1951, the Madison Curve was then proposed by Wood [
4], which was a combination of the results of Wood’s long-term loading test, Liska’s ramp loading test [
5] and Elmendorf’s impact test [
6]. The relationship between the failure time and the stress ratio was approximated with a hyperbola as
SL = 18.3 + 108.4
tf−0.0464, where
SL was the stress ratio (%), and
tf was the failure time of wood in seconds. The Madison Curve is shown in
Figure 1, with the asymptote being a stress ratio of 18.3%. In obtaining the Madison Curve, a modified stress ratio of 150% under impact load lasting for 0.015 s was employed [
7], instead of the ratio of 175% as measured by Elmendorf in the test. Since the Madison Curve came into being, the related research has always been compared with it. If the result of DOL falls below the Madison Curve, the DOL is said more server than the Madison Curve, otherwise less severe.
In the 1970s research of DOL began to focus on structural timber. Madsen and Barrett [
8] investigated the DOL of Douglas-fir dimension lumber of different grades in bending. The sample matching technique [
8] was used to determine the short-term strength of the dimension lumber. The environmental conditions of testing were uncontrolled indoor climate. They concluded that the DOL of dimension lumber was less severe than that identified from Madison Curve and the DOL of the higher quality lumber was more severe than the lower quality lumber.
The findings stimulated wider research interests in DOL investigations [
9,
10]. In 1982, Foschi and Barrett [
11] explored the DOL of Hemlock dimension lumber and verified that the Madison Curve gave more severe prediction of the strength decrease than the test results. In 2000, Gerhards [
12] reviewed his long-term bending test of Grade Select Structural (SS) and Grade No. 2 dimension lumber of Douglas-fir conducted in a constant temperature of 22.8 °C and relative humidity (RH) of 50% [
13]. Contrary to the results of Madsen and Barrett [
8] and the results of Foschi and Barrett [
11], his study indicated that DOL of the dimension lumber fell below the Madison Curve and DOL of lower quality lumber was more severe than higher quality lumber. In 2007, Hoffmeyer and Sørensen [
14] presented their experimental investigations of DOL of structural timber of Norway spruce, including the effect of MC of wood on DOL. The timber was conditioned and tested at RH of 55% and 90%, respectively, which gave MC of wood about 11% and 20%. The investigation suggested that DOL of structural timber with MC of 11% fell between the Madison Curve and the results from Madsen and Barrett. DOL of structural timber with MC of 20% fell below the Madison Curve. The study also revealed that timber quality does not affect the DOL. Wu et al. [
15] conducted experimental investigations of DOL of wood in tension perpendicular to grain with small clear specimens, the test results of DOL presented a convex curve and fell between the Madison Curve and the results from Madsen and Barrett.
So far, conclusions of DOL were all drawn from experimental studies, yet tests in the studies were not conducted under unified conditions and methods in terms of the specimens, strength estimation method (pair matching or sample matching) and the environment conditions (different MC). There are similarities and differences in conclusions between different studies. It seems that whether the DOL of structural timber and that of clear wood is the same and whether the DOL is dependent on timber quality remain a question still worth investigating under a unified environment and methods. Furthermore, there are two opposite assumptions in dealing with the DOL of modulus of elasticity (MOE) of wood in different national design standards [
16]. One assumption is that the DOL of MOE and the strength is the same, the other is that MOE has no DOL at all. The assumptions lead to a significant difference in the buckling resistance evaluations that involve MOE in design standards like Eurocode 5 [
17] and NDS-2018 [
18]. Explanation to this inconsistency is needed.
Given the background related above, this study aims to investigate whether there is any difference in DOL between lumber of different grades and between structural timber and the clear wood; to investigate whether there is DOL of MOE of wood. Short-term and long-term bending tests of dimension lumber of two strength grades and small clear specimens of the same species of the dimension lumber were conducted in this study. The tests were all under the same constant environmental conditions, and the same sample matching technique was used. The long-term strength and MOE over a load duration of 18 months were obtained via the tests, the DOL between different grades of lumber and that between structural timber and the clear wood was compared.
2. Materials and Methods
2.1. Materials
Canadian Spruce-Pine-Fir (Canfor, Canada) dimension lumber of Grades No. 2 and No. 3 and the cross-sectional dimension of 2″ × 6″ (38 mm × 140 mm) was used to make specimens for the bending test, of which the strength and quality of Grade No. 2 are higher than No. 3 [
18]. The dimension lumber came from same batch of standard factory products. The full-sized specimens were of original dimension lumber with a length of 2820 mm and the small clear specimens of size 20 mm × 20 mm × 410 mm were randomly taken from the dimension lumber. 320 full-sized specimens for each grade and 320 small clear specimens were thus prepared to investigate the DOL of dimension lumber of different quality and DOL of the clear wood. The test schemes are listed in
Table 1. All specimens were conditioned under a temperature of 20 ± 2 °C and RH of 65 ± 3% before testing.
2.2. Sample Matching Technique
In evaluating the DOL, the short-term strength and the long-term strength of the same specimen are needed. However, a specimen could not be broken twice. The precondition for evaluating DOL is to estimate correctly the short-term strength of a specimen that is to undergo long-term testing. Different methods to estimate the strength of specimen had been tried. Pair matching was once used to evaluate the short-term strength of small clear specimens [
3]. In this method, three adjacent specimens are simultaneously cut from the timber. Assuming that the strength of the middle specimen is equal to the average strength of the two specimens on the side, the two side specimens are tested for the strength, and the middle one is left for long-term test. In investigating the DOL of structural timber, pair matching was once used to evaluate the short-term strength of timber. Norén [
19] attempted to use this method by sawing the structural timber with great care to obtain identical full-sized specimens, yet the accuracy of the results was poor, the method proved not feasible. Sample matching was then proposed by Madsen and Barrett [
8]. In this method, two samples of specimens with adequate sample sizes from the same source are assumed to have the same strength distribution. Specimens of one sample are tested for short-term strength, and specimens of the other sample are to undergo long-term test. The strength of a specimen under certainly applied stress decreases with time and it may fail at a particular time. If a specimen fails, the long-term strength equals to the applied stress, and the sequence of failure indicates the strength percentile of the specimen. The short-term strength of a specimen in the long-term test is assumed to be equal to the strength of the same percentile in the short-term test. The DOL of a failed specimen under constant load is represented by the ratio of the applied stress (long-term strength) to the short-term strength of the same percentile following the sample matching technique. In this study, sample matching was used for both the structural timber and the clear wood.
2.3. Short-Term Test
Dimension lumber specimens all with a span of 2520 mm and a span to depth ratio of 18: 1, were tested in third-point edgewise bending via a Metriguard Model 312 Bending Proof Tester (Metriguard, Pullman, WA, USA). Dimension lumber in the bending test failed in about 7.5 min in average (about 5 mm/min), being consistent with the recommendation of Standard GB/T 50329-2012 [
20]. Small clear specimens all with a span of 360 mm and the same span to depth ratio as dimension lumber were also tested in third-point bending via a universal testing machine, with the load being parallel to the tangential direction. A specimen failed in about 1.7 min in average, being consistent with the recommendation of Standard GB/T 1936.1-2009 [
21]. The moisture content of Grade No. 2 and No. 3 dimension lumber and small clear specimens was 12.0%, 11.8% and 12.2%, respectively, each measured via oven-drying with 30 wood pieces of 20 mm × 20 mm × 20 mm from the respective group after testing.
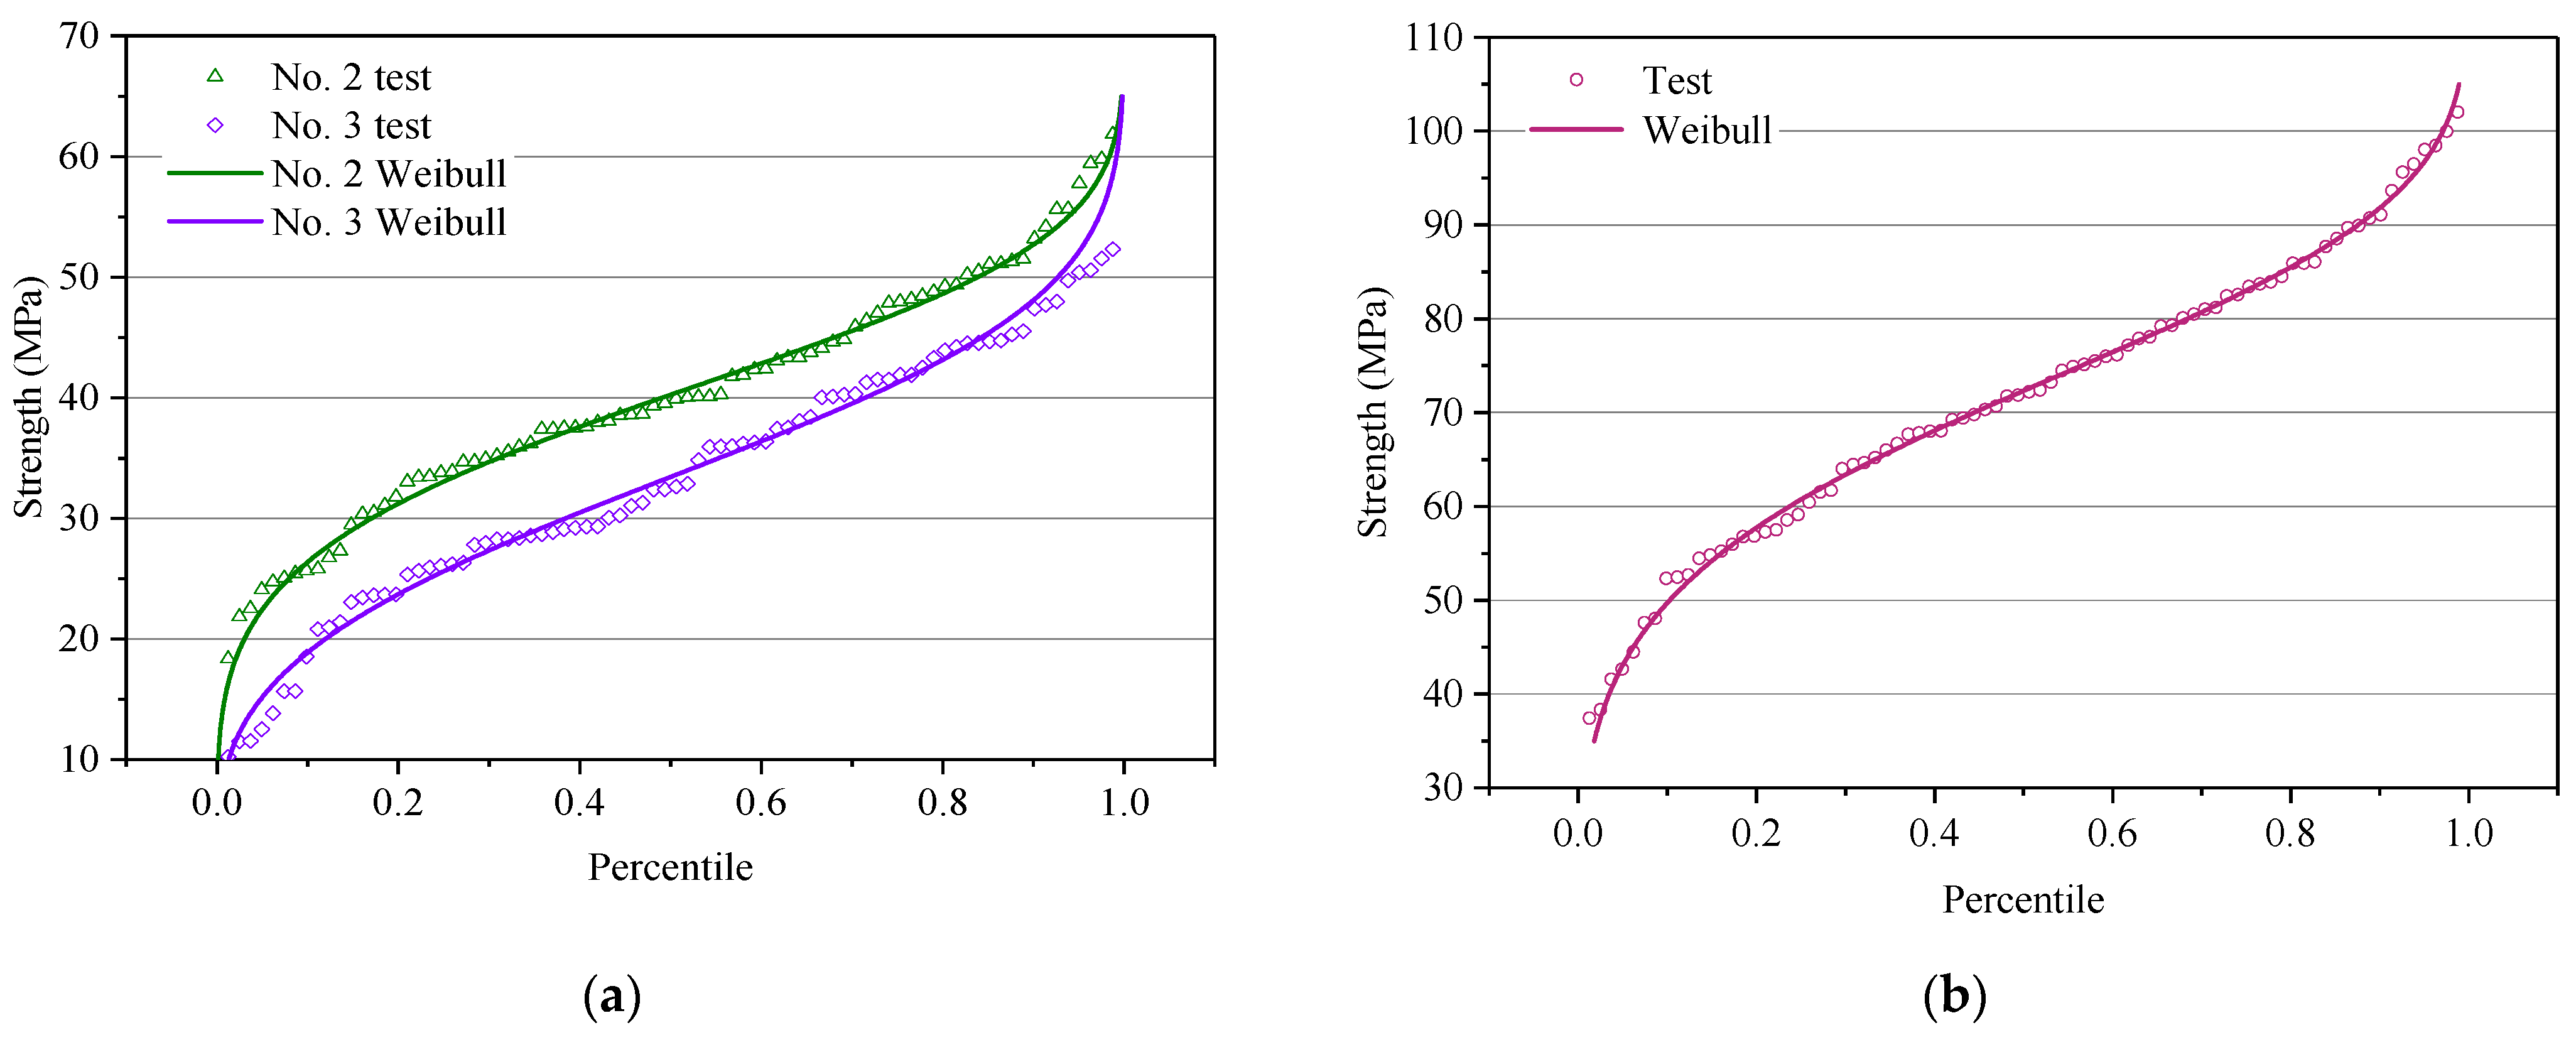
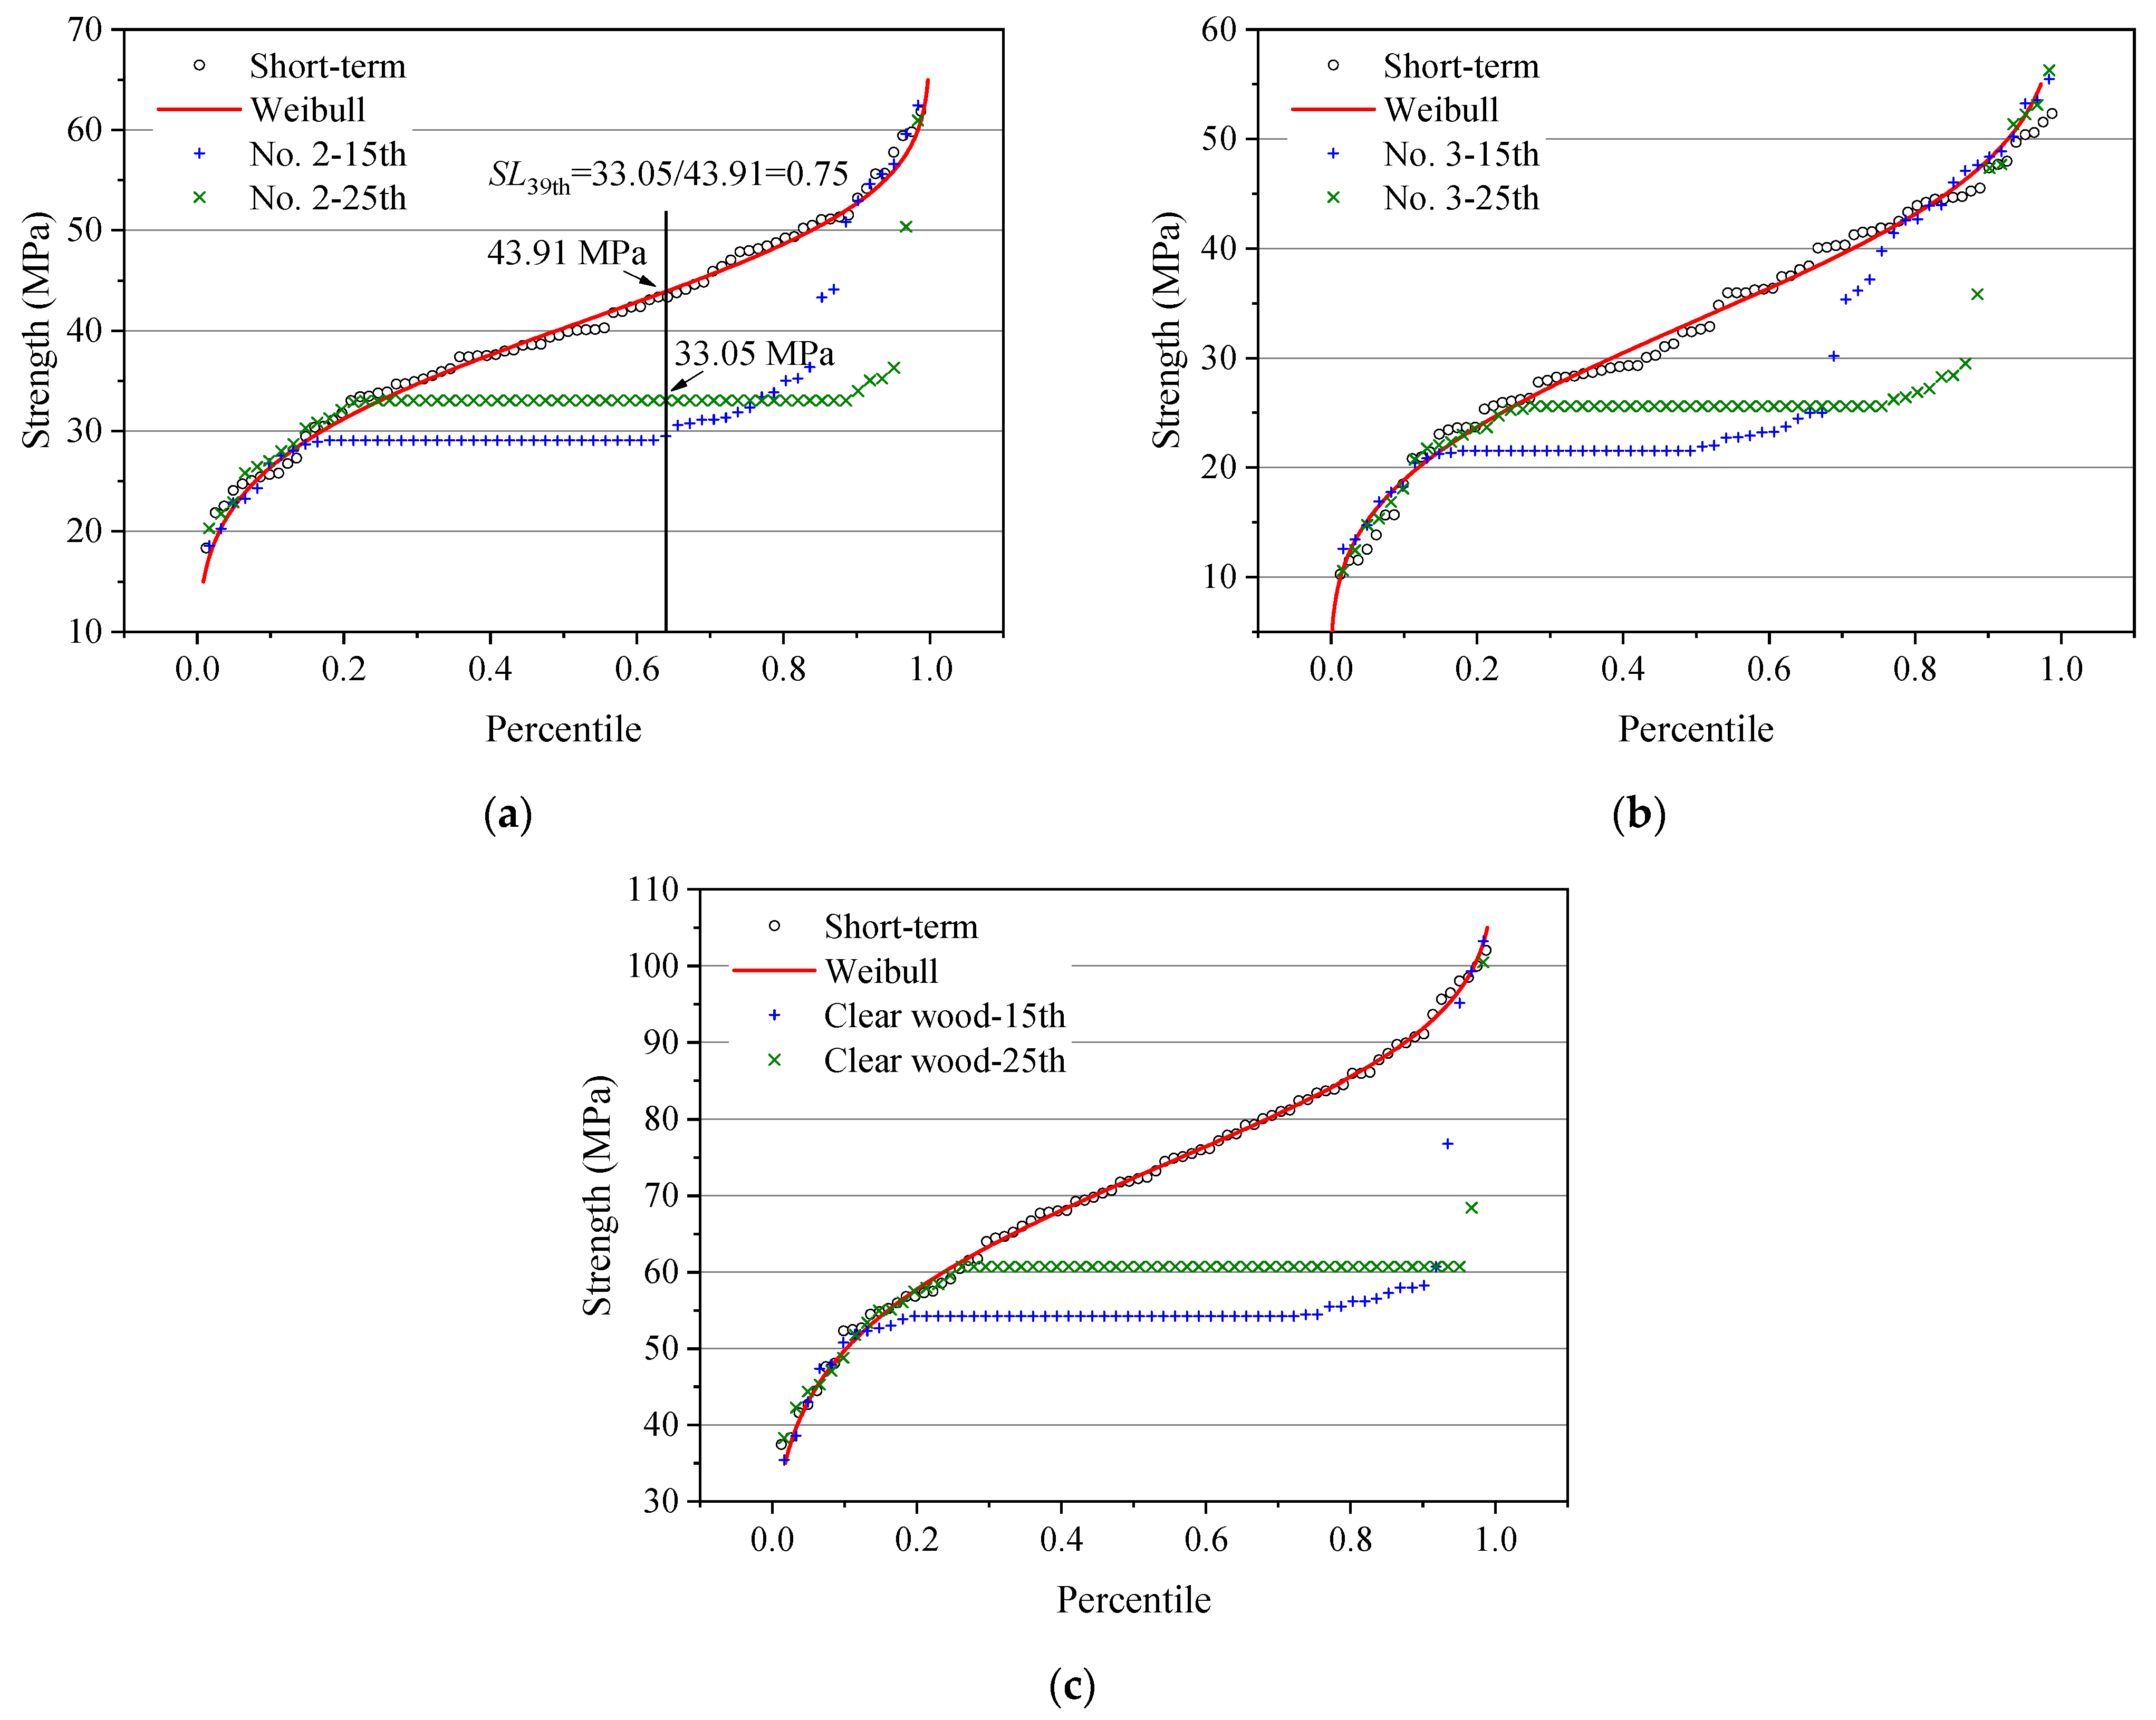
Then, 2-P Weibull distribution [
22] was used to fit the short-term strength. The distribution can be expressed as
where
m is the scale parameter;
k is the shape parameter;
p represents the percentile of strength;
σs is the short-term strength.
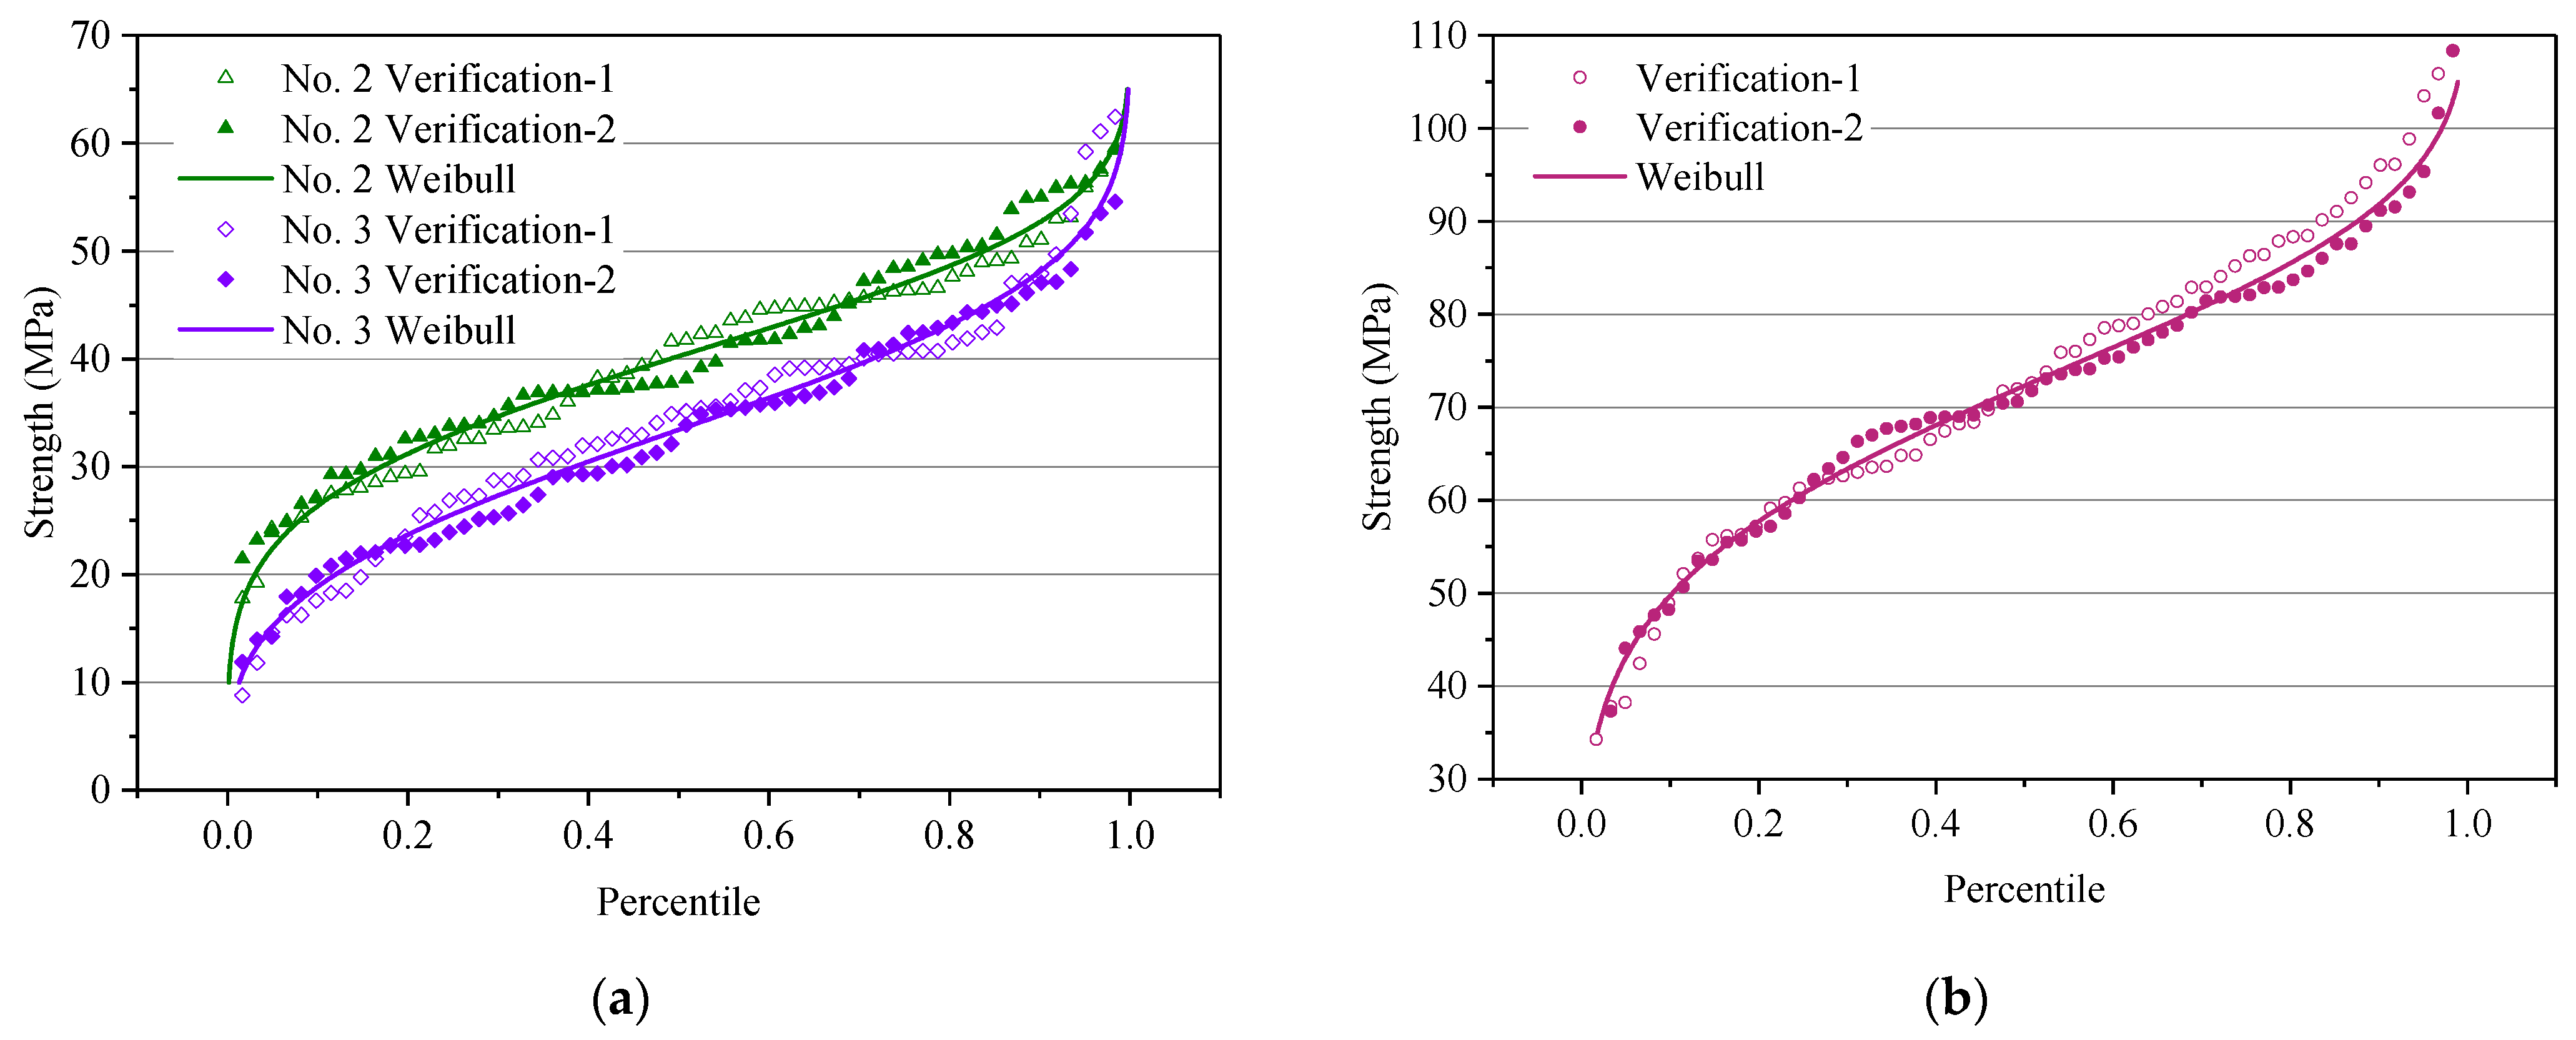
To verify the accuracy of the calibrated 2-P Weibull distributions, 120 specimens were taken from each respective group of the specimens, and were randomly divided into two groups of 60 specimens each to conduct the short-term tests with the same loading conditions as mentioned above.
2.4. Long-Term Test
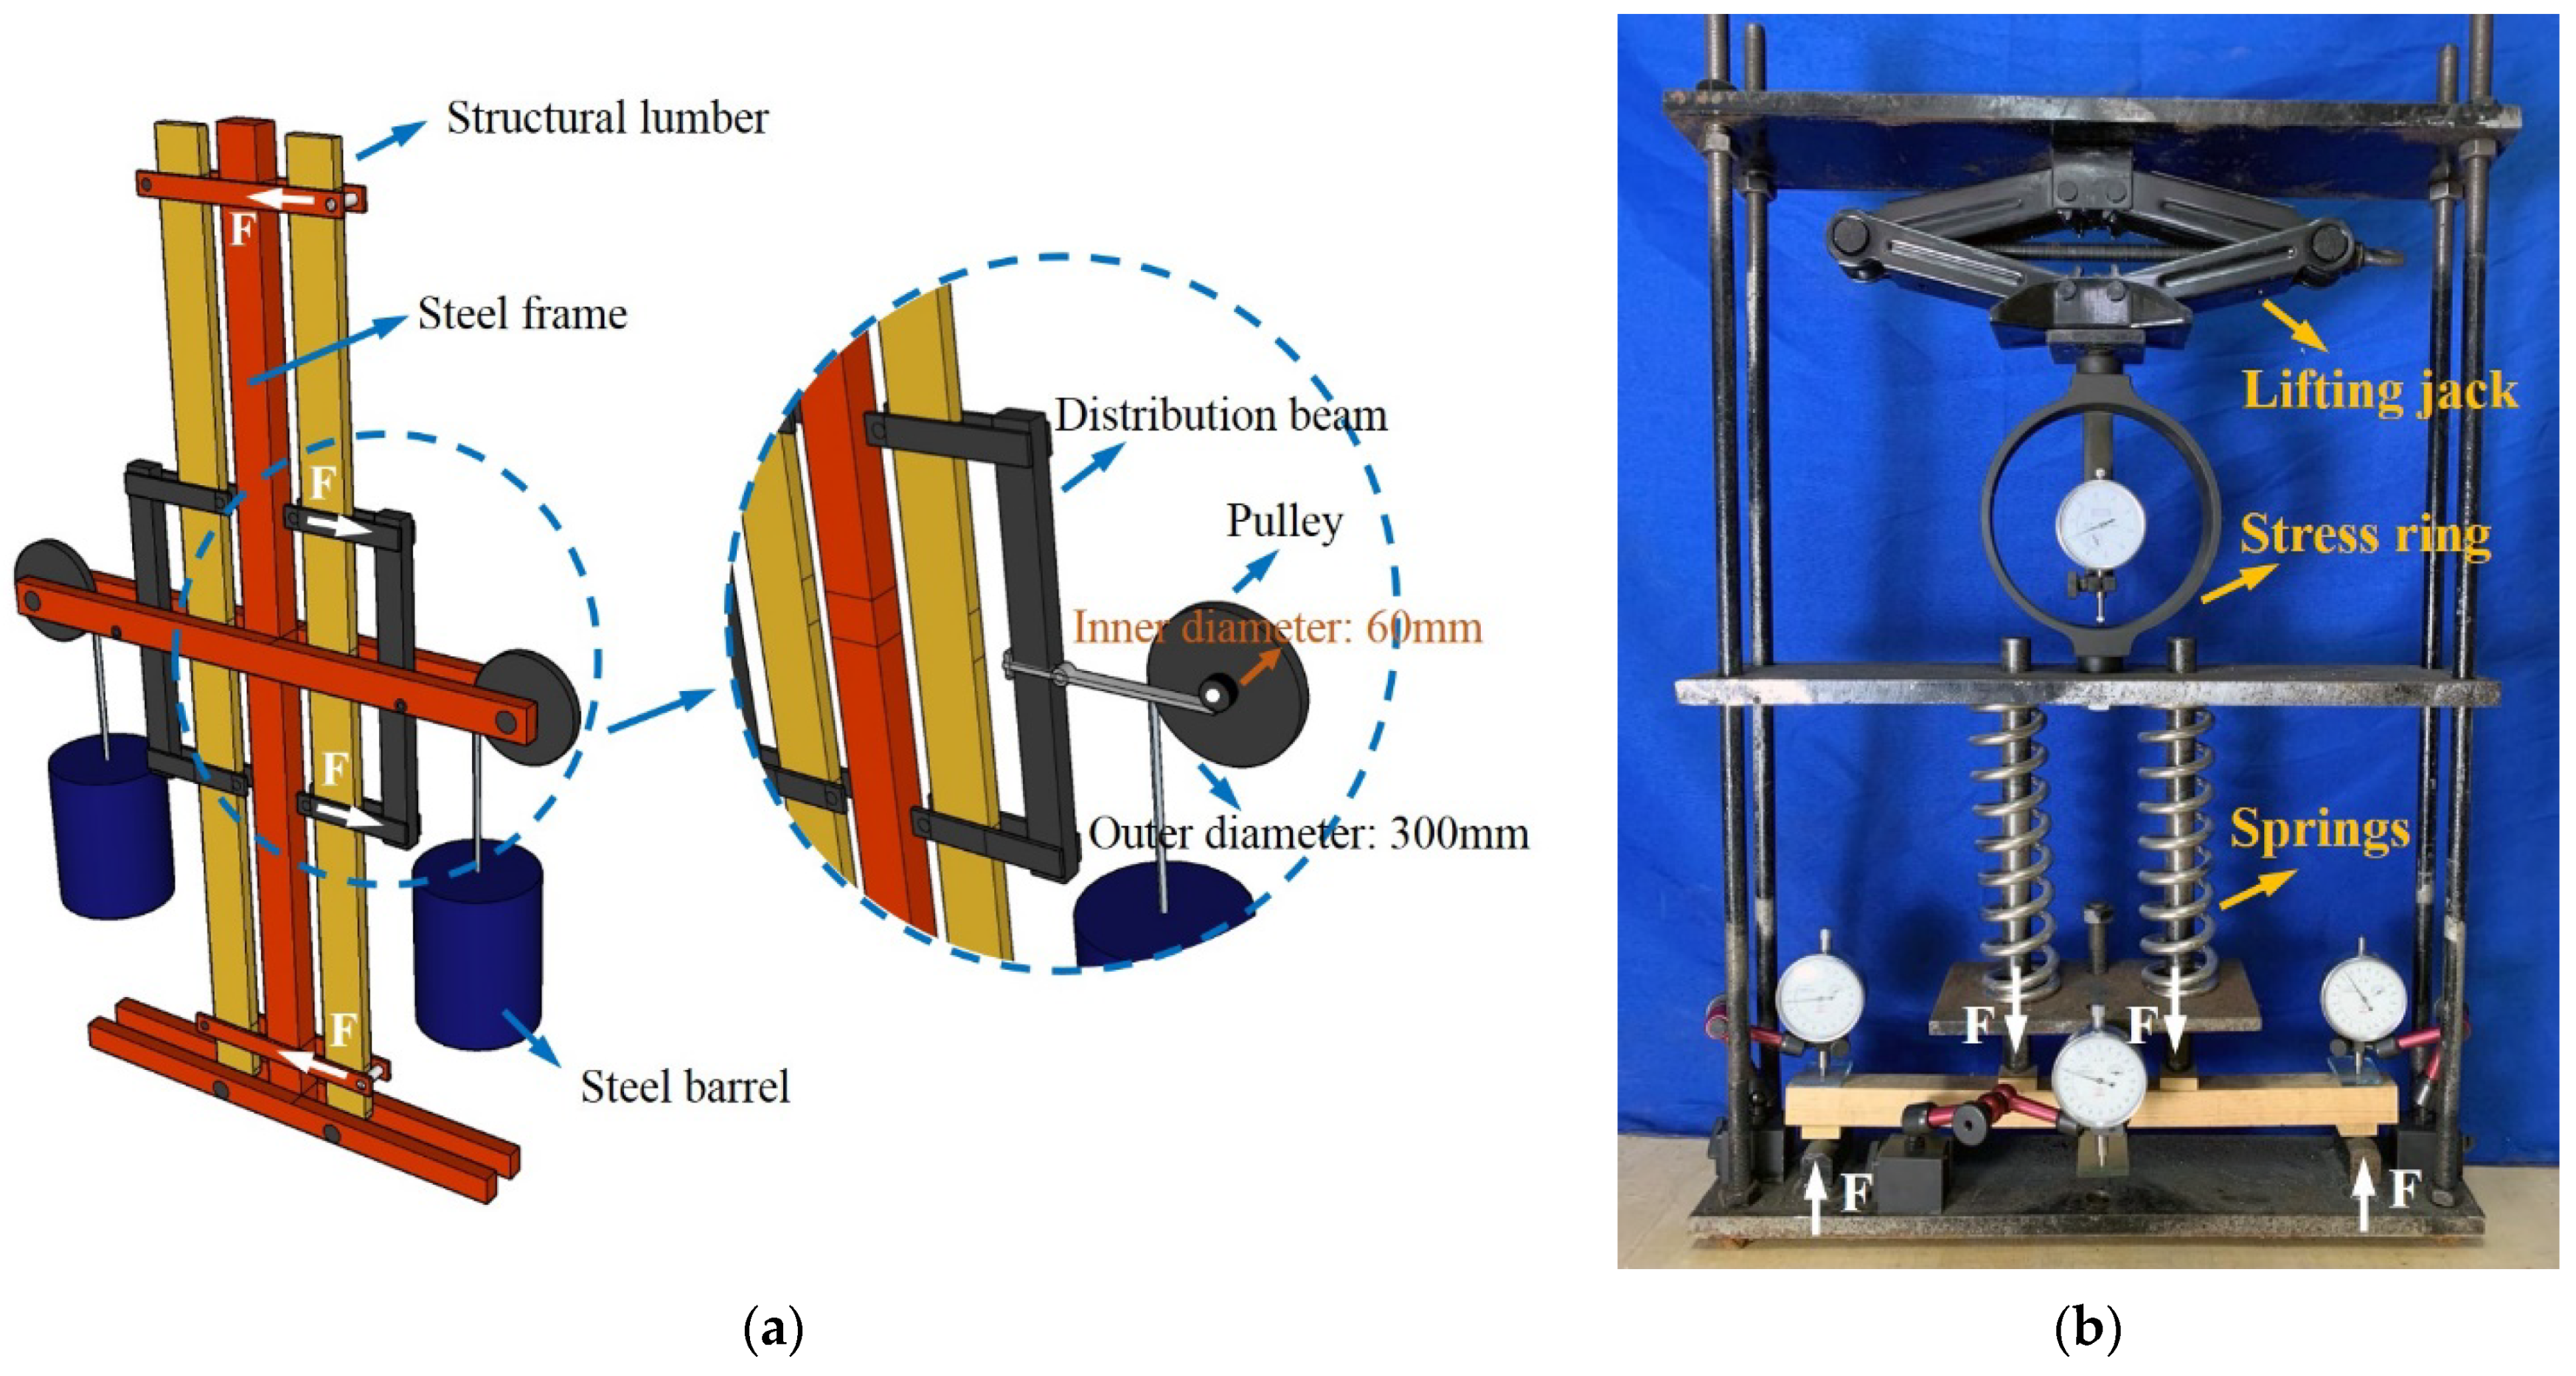
Long-term test was performed in an environment of constant temperature of 20 ± 3 °C and RH of 65 ± 5%. As shown in
Figure 2a, forty loading rigs similar to the design of Hoffmeyer and Sørensen’s (2007) were manufactured for the bending test of dimension lumber. Load was applied to a specimen in third-point bending via a load distribution beam. A pulley with two lever arms of force, which were 60 mm and 300 mm long, respectively, was installed in the rig. A bucket containing steel emery was connected to the lever arm of 300 mm long and the distribution beam was connected to the lever arm of 60 mm long such that the force to counterbalance the weight of steel emery was magnified by a ratio of 5. As shown in
Figure 2b, forty test rigs were designed and manufactured for the test of the small clear specimens. Third-point bending load was applied to the specimen by a lifting jack via two springs. A stress ring was installed to monitor and control the load.
Specimens of Grade No. 2 dimension lumber, Grade No. 3 dimension lumber and the small clear were divided into two sub-samples, respectively, with each sub-sample consisting of 60 specimens. Stress levels equaling to the 15th percentile and 25th percentile of the short-term strength were applied to the specimens in two sub-samples of each group, respectively. A number of specimens failed in the ramp loading stage of the long-term test (BOL, broken on up-loading), some specimens failed under constant load as the test progressed, and some others survived the long-term loading. For the survived specimens, ramp loading test was conducted immediately after the long-term tests to obtain the residual strength and MOE.
The effectiveness of sample matching can be validated by the number of the BOL’s. For example, for a group of 60 specimens under the stress of the 15th percentile of the short-term strength, there should be about 9 failures (60 × 0.15) in applying the target load. For a group of 60 specimens under the stress of the 25th percentile of the short-term strength, there should be about 15 failures (60 × 0.25). These expectations of failure will be compared with test results in the
Section 3.2.
Meanwhile, in the ramp loading stage of the long-term test, all specimens were installed with dial gauges to obtain the load-deflection curves. Following EN 408 [
23], the section of load-deflection curve between 10% and 40% of the mean maximum load from the short-term tests was used to calculate the MOE (short-term). The MOE of the survival specimens, i.e., the long-term MOE, was also obtained via the same method.
Long-term bending test of Grade No. 2 dimension lumber and small clear specimens were conducted first, followed by the test of Grade No. 3 dimension lumber. Once a specimen failed, it was replaced immediately with a new one, making efficient use of the test rigs. In the long-term test, load on each specimen was designed to last for 18 months, taking a total test period of 40 months.
4. Discussion
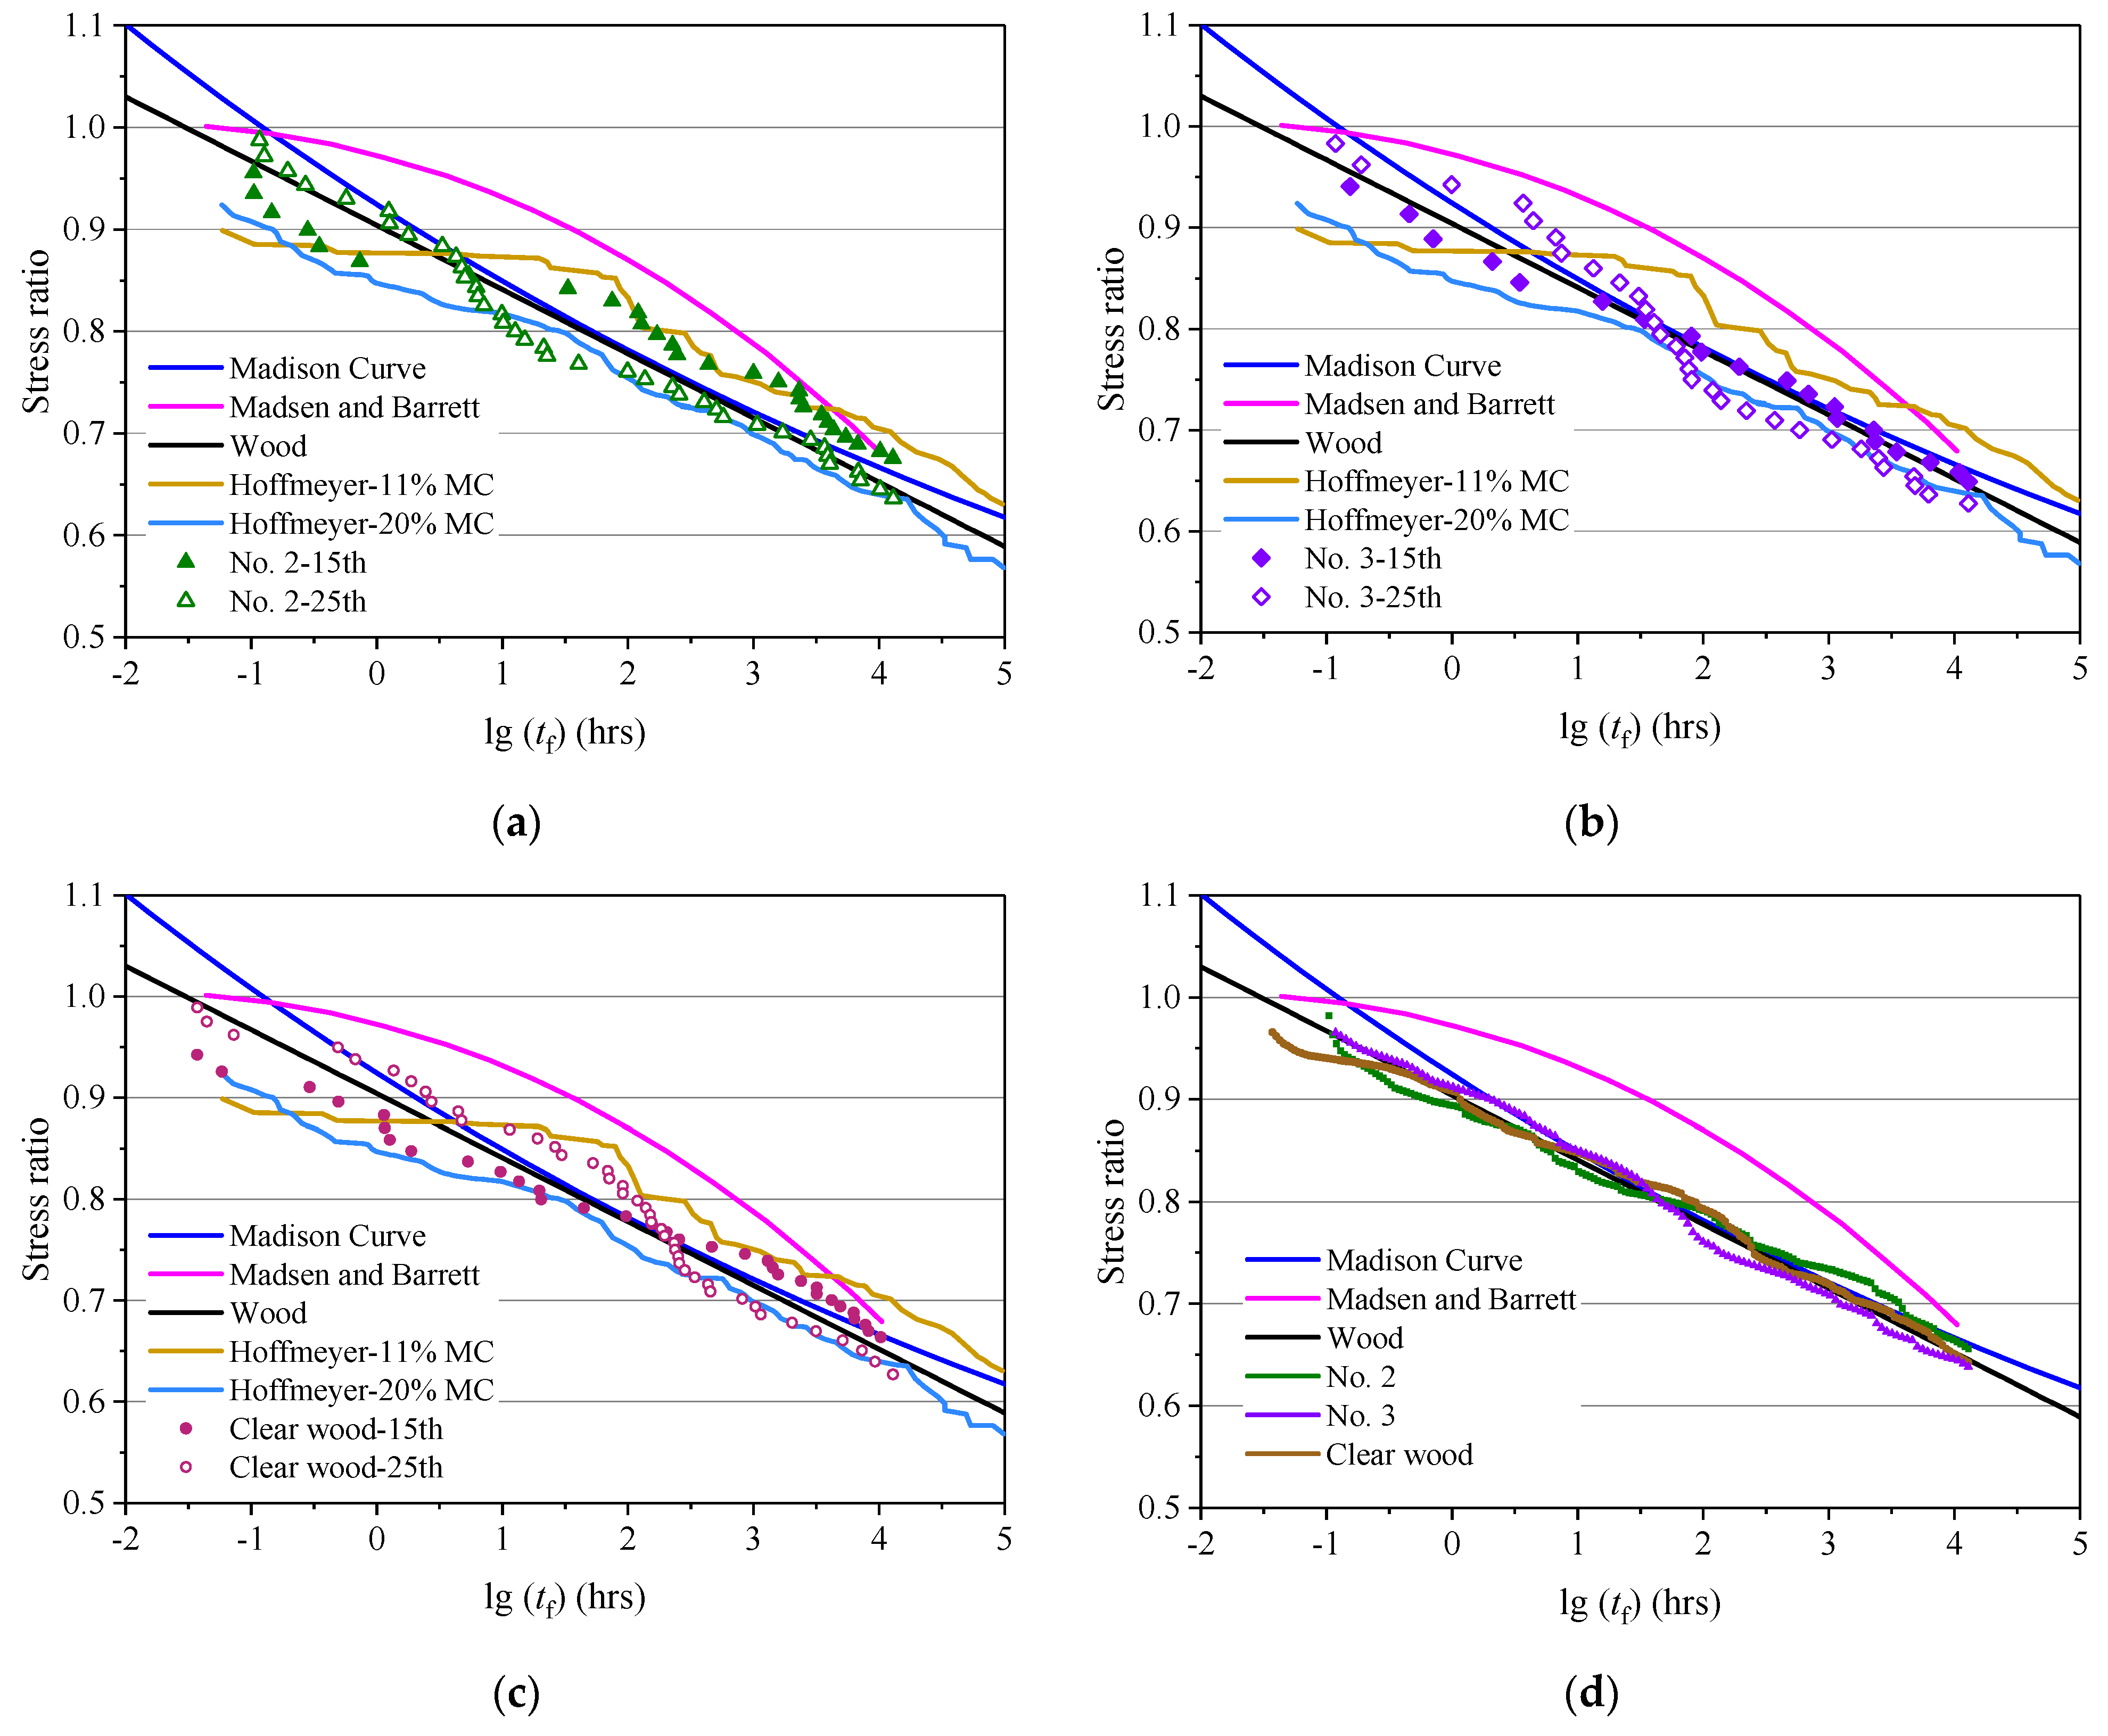
As for the strength loss shown in
Figure 6a–c. For dimension lumber, data points from this study almost all lie lower (more severe) than the results by Madsen and Barrett, and they are close to Wood’s curve and the Madison Curve. The difference between the results of this study and the Madison Curve is relatively larger in the front portion, indicating that in obtaining the Madison Curve by combining Wood’s results with the impact test by Elmendorf might give a less severe estimation of DOL. Comparing results of this study with the results of Hoffmeyer and Sørensen’s [
14], the latter is more severe in the front portion of the curve, and then the data points of this study almost all go between the results of timber with MC of 11% and the results of timber with MC of 20% by Hoffmeyer and Sørensen. Test results of small clear specimens show the same trend as dimension lumber, they tend to be closer to Wood’s curve, though with some fluctuations. It is worth pointing out that, none of the DOL curves in this study presents a convex shape as Madsen and Barrett’s test results did, whilst another study regarding the DOL of wood in tension perpendicular to grain indeed presented a trend similar to Madsen and Barrett’s [
15].
The Analysis of Variance (ANOVA) was conducted on the strength loss of Grade No. 2, Grade No. 3 dimension lumber and the clear wood as shown in
Figure 6d, resulting in
p-Value = 0.995 > 0.05. This indicates that there is virtually no difference among the three averaged curves of Grade No. 2, Grade No. 3 dimension lumber and the clear wood. This indicates that the lumber grade or quality considered in this study does not affect the DOL, and there is virtually no difference in DOL between structural timber and the clear wood, either. If considering the clear wood as the timber of quality higher than Grade No. 2 dimension lumber, this justifies further the point of view that timber quality does not affect the DOL. Since the main factors that affect the strength of wood are the natural defects, which determine the quality of wood, test evidence from this study that the quality does not affect DOL of wood in fact reveals that defects of wood do not affect the DOL. An explanation to this can be that, DOL is due to the viscosity of wood that would be largely the same even if the wood is with different degrees of defects.
Moreover, the three averaged curves are more in agreement with Wood’s curve than with the Madison Curve. Employing the form of the equation of Wood’s curve, linear fitting of the relationship between the logarithmic time of failure and the stress ratio using all the data points that form the three averaged curves in
Figure 6d from this study gives
where
SL is the stress ratio representing the DOL (%);
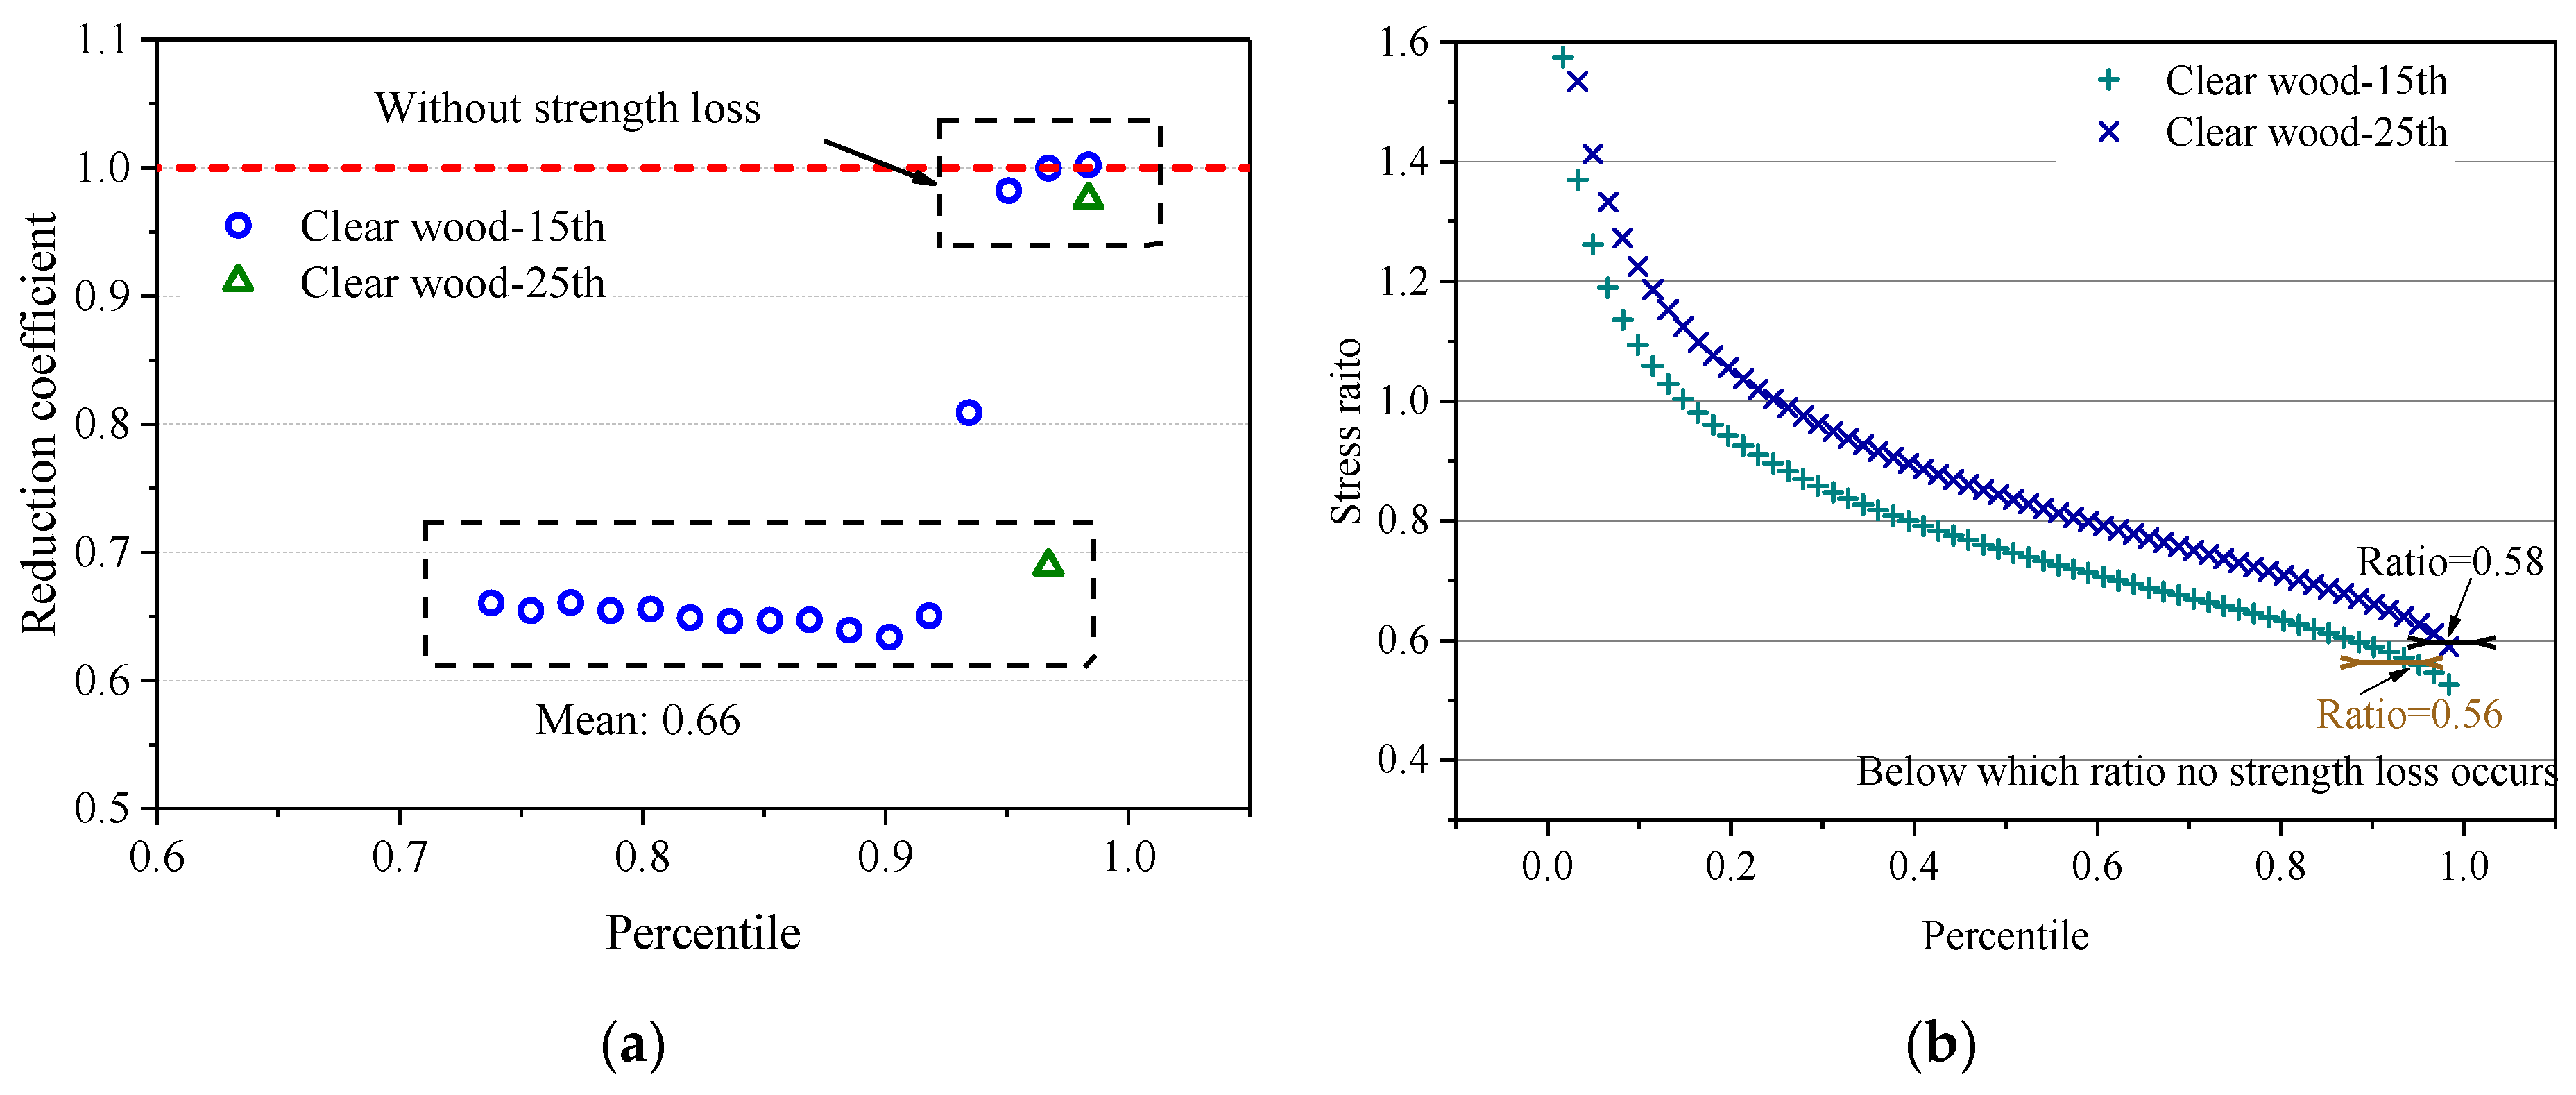
tf is the time to failure (hours). The predicted stress ratio at 1.5 years using Equation (2) is 0.65, which is very close to or even exactly the same as the mean strength reduction coefficient of 0.66 of all survival specimens, Wood’s curve prediction of 0.65 and the Madison Curve prediction of 0.66.
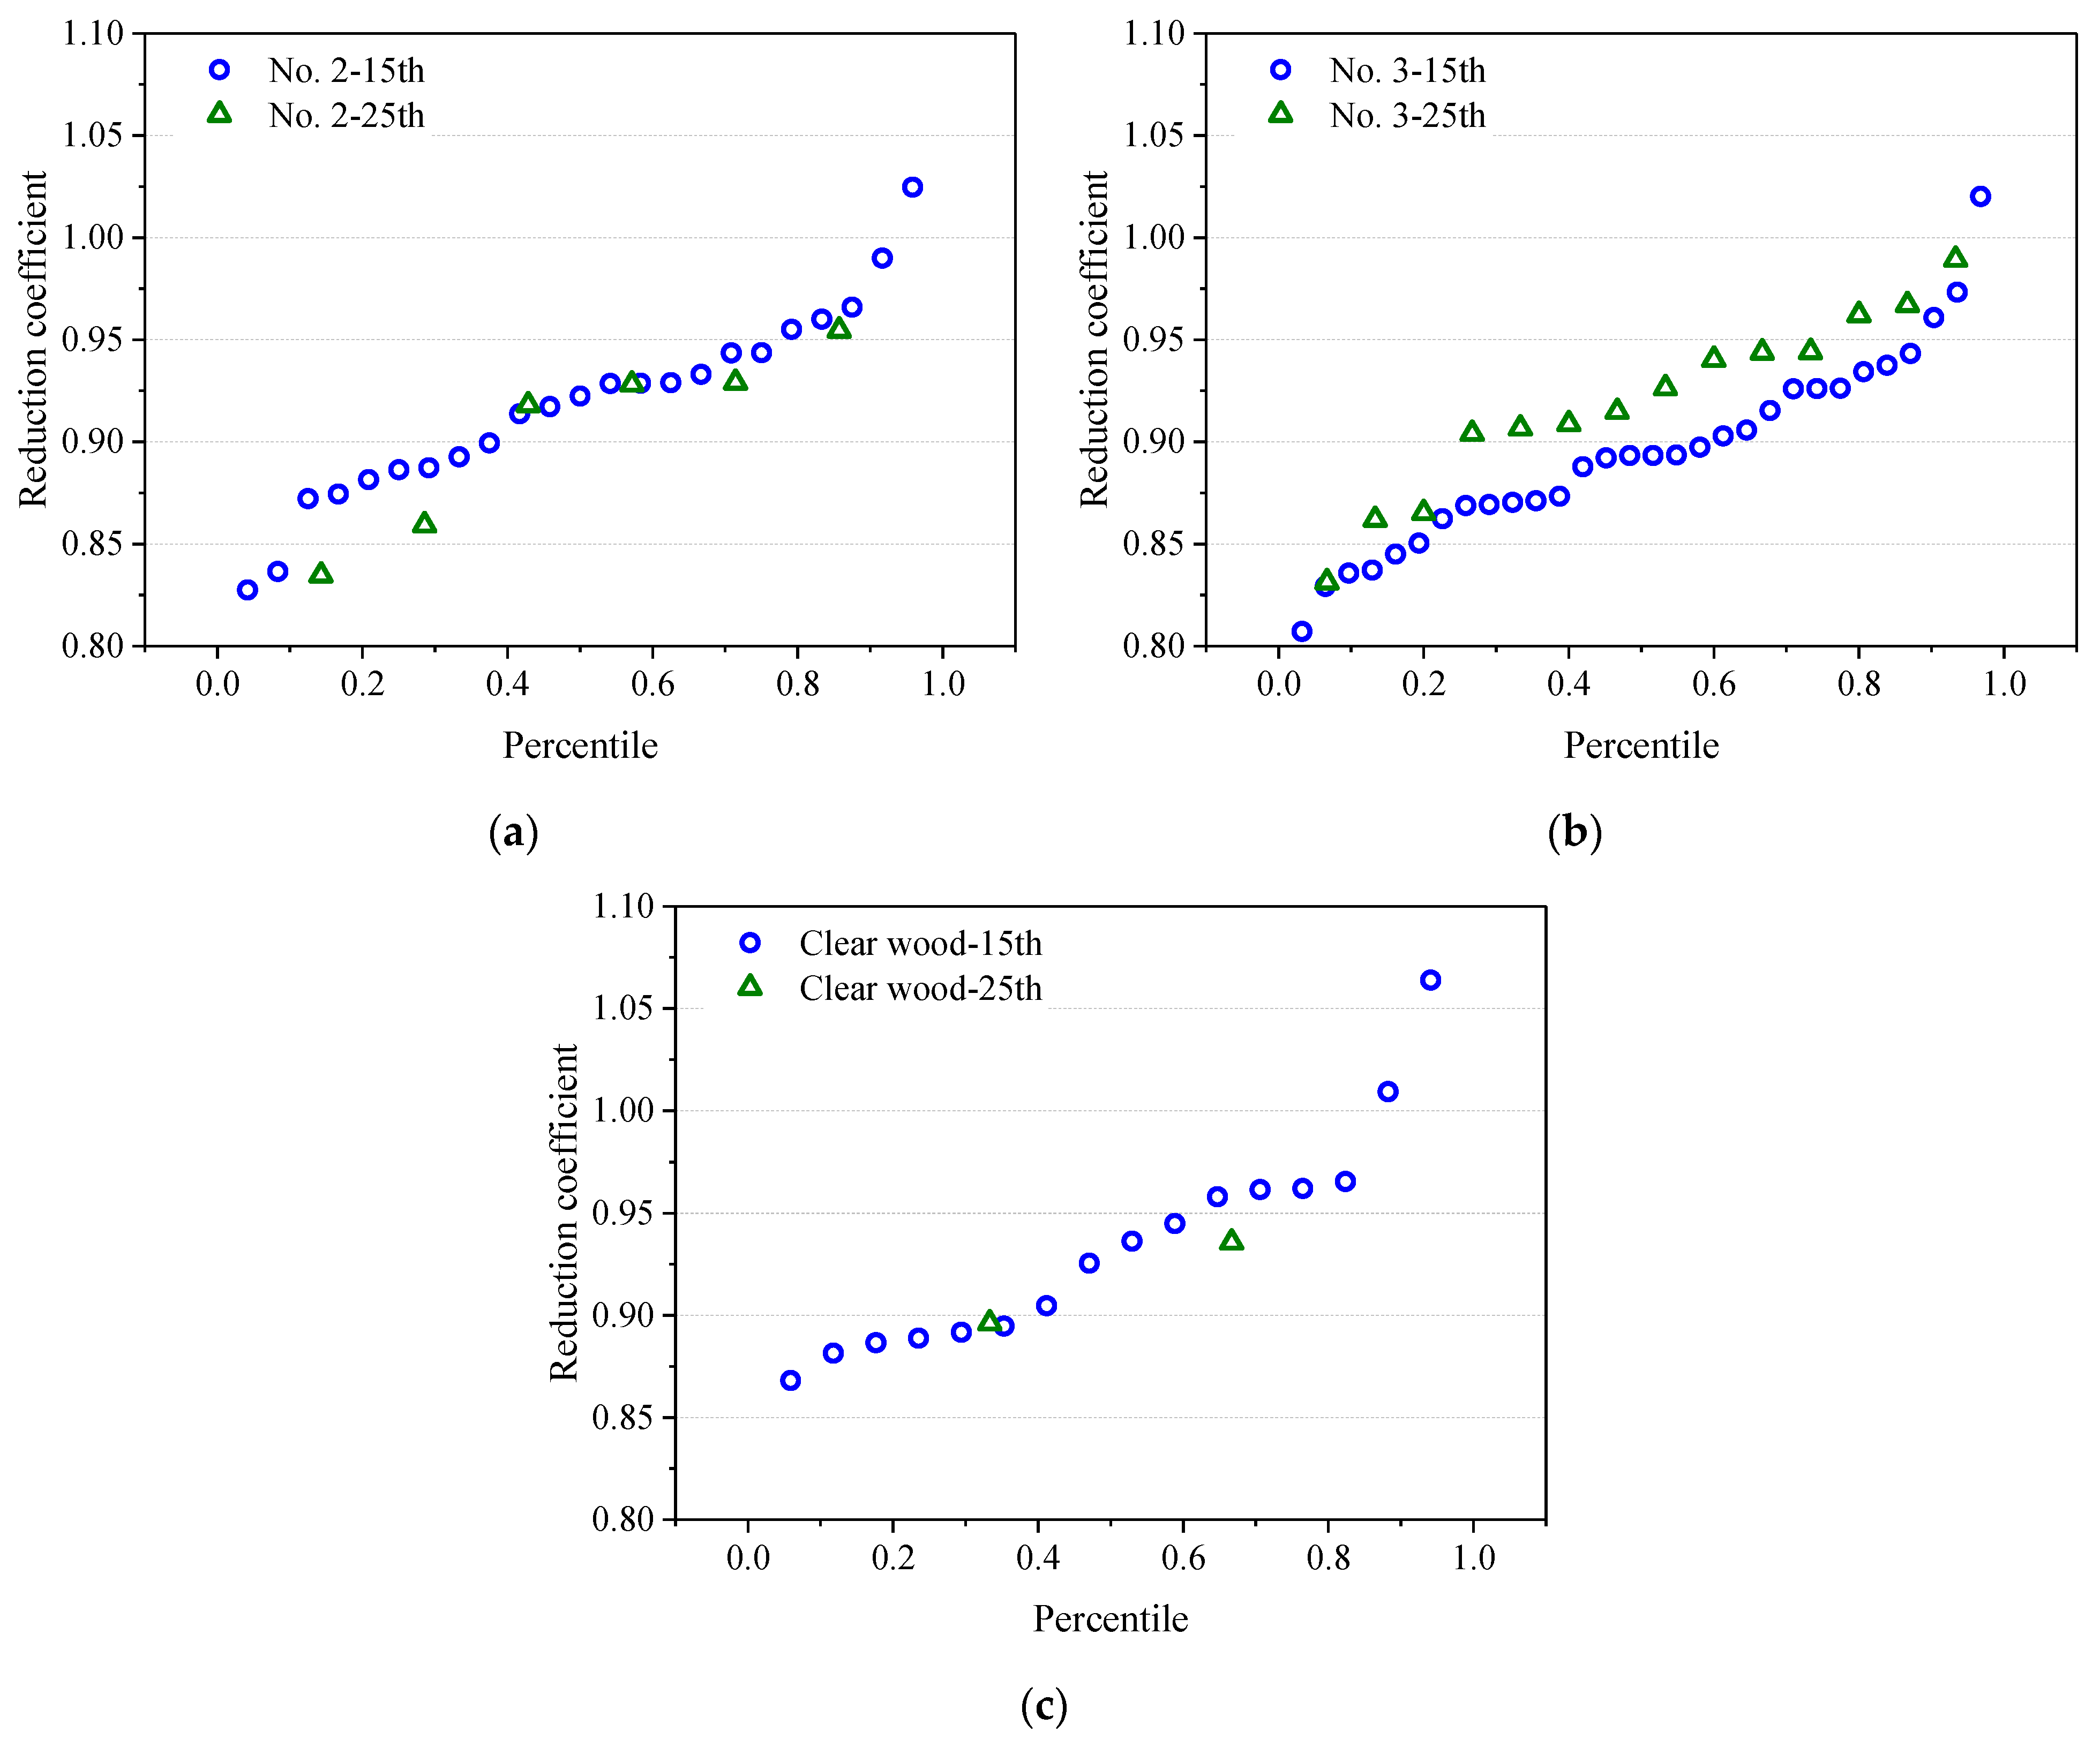
As for the reduction coefficient of MOE shown in
Figure 10, the test results indicates that load duration does have a decreasing effect on MOE of wood, although this effect is less severe than that poses on strength of wood. The same conclusion was also drawn from the DOL study of wood in tension perpendicular to grain [
15]. It seems that DOL of strength can now be explained as that the wood is damaged under sustained load, so the strength of wood is decreased. The MOE of the damaged wood must also be decreased, though it is to less severe degree. It can be seen that neither the assumption that DOL of MOE is the same as the strength of wood nor the assumption that MOE is without DOL is consistent with the findings of this study. Further investigation of the DOL of MOE is needed.


