Article

Productivity and Profitability of Poplars on Fertile and Marginal Sandy Soils under Different Density and Fertilization Treatments

by
Solomon B. Ghezehei
1,*,
Alexander L. Ewald
1,
Dennis W. Hazel
1,
Ronald S. Zalesny, Jr.
2 and
Elizabeth Guthrie Nichols
1
1
Department of Forestry and Environmental Resources, North Carolina State University, Raleigh, NC 27695, USA
2
Institute for Applied Ecosystem Studies, Northern Research Station, USDA Forest Service, Rhinelander, WI 54501, USA
*
Author to whom correspondence should be addressed.
Forests 2021, 12(7), 869; https://doi.org/10.3390/f12070869
Submission received: 28 April 2021 / Revised: 25 June 2021 / Accepted: 28 June 2021 / Published: 30 June 2021

Abstract

:
We evaluated the productivity and profitability of four highly productive poplars including Populus deltoides × P. deltoides (DD ‘140’ and ‘356’), P. deltoides × P. maximowiczii (DM ‘230’), and P. trichocarpa × P. deltoides (TD ‘185’) under two densities (2500 and 5000 trees ha−1), and three fertilization treatments (0, 113, 225 kg nitrogen ha−1) at three sandy coastal sites varying in soil quality. Green stem biomass (GSB) was estimated from the sixth-year stem diameter. Leaf-rust (Melampsora castagne) and beetle damage (by Chrysomela scripta Fabricius), the leaf area index (LAI) and foliar nitrogen, were measured in year two. At all sites, DD and DM had higher survival (>93%) than TD (62–83%). DD produced greater GSB (92.5–219.1 Mg ha−1) than DM (54–60.2 Mg ha−1) and TD (16.5–48.9 Mg ha−1), and this was greater under the higher density (85.9–148.6 Mg ha−1 vs. 55.9–124.9 Mg ha−1). Fertilization significantly increased GSB on fertile soil but not marginal soils; a higher rate did not significantly enhance GSB. Leaf rust was higher for fertile soil (82%) than marginal soils (20–22%), and TD ‘185’ (51% vs. others 34%). C. scripta damage was higher for the higher density (+42%) than lower density, and TD ‘185’ (50% vs. others >38%). LAI was higher on fertile soil (1.85 m2 m−2) than marginal soils (1.35–1.64 m2 m−2), and under the lower density (1.67 m2 m−2 vs. 1.56 m2 m−2). The high GSB producer DD ‘356’ had the lowest LAI (1.39 m2 m−2 vs. 1.80 m2 m−2). Foliar nitrogen varied among genomic groups (DD ‘140’ 1.95%; TD ‘185’ 1.80%). Our plots were unprofitable at a 27 USD Mg−1 delivered price; the biggest profitability barriers were the high costs of higher density establishment and weed control. The best-case treatment combinations of DD (‘140’, ‘356’) would be cost-effective if the price increased by 50% (USD 37.54 Mg−1) or rotations were 12 years (fertile-soil) and longer (marginal soils). The requirement for cost-effectiveness of poplars includes stringent and site-specific weed control which are more important than fertilizer applications.

1. Introduction

The Energy Independence and Security Act (EISA) of 2007 mandates an increase in biofuel use, from 34.1 billion liters in 2008 to 136.3 billion liters in 2022 [1], and targets a 9% decrease in greenhouse gas emissions [2]. Currently, more than 137 million tonnes of corn (Zea mays L.) are used for ethanol to be blended into transportation fuels in the United States (US), which dramatically increases the demand for field corn to meet the EISA standards [3]. Increased corn-based ethanol production raises environmental concerns for erosion, water and fertilizer uses, pollution related to pesticide use, and nutrient run-off, and the use of agricultural food-crop lands for energy production [3,4,5]. Concurrently, the southeastern US is the largest exporter of wood pellets to Europe due to abundant feedstock inventory, manufacturing proximity, and accessible shipping ports [6]. Increased wood pellet market growth, and European renewable energy targets [7,8,9] are expected to catalyze the need for more noncontentious lands and sustainable feedstock supplies from the US.
One opportunity to expand biofuels and bioenergy production in the US, while minimizing environmental concerns, is to develop second generation feedstocks such as tall grasses, Panicum L. and Miscanthus (Nees) Andersson, and short rotation woody crops (SRWCs) such as Populus L. or Salix L. [10,11]. When compared to annual and perennial crops, woody species grown in short rotation have higher energy densities, lower transportation costs, and reduced needs for annual inputs such as fertilizer [12,13]. Of the SRWCs produced in the US, poplars (Populus sp. and their hybrids) are among the most commonly analyzed bioenergy crops due to their high productivity and decades of genetic improvement [12,14].
Prior clonal studies have shown that poplars, when intensively cultured as SRWCs, can produce substantially greater biomass than other temperate species [7,14,15,16,17,18]. Ecosystem demography models have estimated potential yields of poplar plantations across the temperate regions of the US ranging between 10 and 18 Mg ha−1 year−1 (dry mass) [19]. However, growth projections for poplars are heavily dependent on climate, soil condition, clonal parentage, fertilization rates, and stand densities [16,19].
Planting densities vary widely for poplars, typically ranging from 1000 to 20,000 stems ha−1, based on end uses of the trees [20]. When poplars are planted at high densities, they produce smaller individual trees but a greater cumulative stand biomass [21,22]. Determining the optimal stand density depends on the biological and nutrient limitations of a site, such as climate, precipitation, and soil quality [20]. Because density influences the amount of biomass produced on a “per tree” and “per area” basis, the intended use of the biomass is important for site establishment, rotation lengths, and profitability for landowners.
To avoid SRWC competition with agriculture and conventional forestry for land use, marginal lands are an important resource for SRWC production [1,23]. Abandoned and degraded lands in SRWC production could be utilized to produce 10 to 52% of the current liquid fuel consumption [23,24]. However, marginal lands often have lower quality soils with limited fertility [25], and poplar biomass yields often decline significantly on marginal soils [26,27,28]. One study reported poplar biomass yields of 22.4 m3 ha−1 year−1 on fertile soils compared with 1.1 m3 ha−1 year−1 on marginal soils [27].
Understanding poplar responses to fertilizer application rates on marginal lands is essential to optimizing yields and enhancing economic returns for biofuels and bioenergy production [29,30]. Prior studies have evaluated nitrogen (N) fertilizer application rates, ranging from 60 to 250 kg N ha−1 for poplars across a variety of different site-specific conditions, and optimum nitrogen fertilization rates are site- and genotype-specific [31,32,33]. In the southeastern US, estimated optimal N application rates for optimal growth were 70 to 90 kg N ha−1 year−1 for two, non-irrigated cottonwood (Populus deltoides Bartr. ex Marsh) clones [32].
Fertilization and densely-planted stands increase input costs and impact profitability if biomass yields, and market prices do not yield revenue greater than the establishment and production costs. Poplars and other fast-growing trees can be economically feasible when costs are minimized by effective stand establishment and management, especially the suppression of weed competition, and when revenues are maximized [34]. Advancing woody feedstocks for bioenergy production requires economic profitability for landowners [35], and subsidization can improve the economic viability of SRWC stands [34,36]. In the southeastern US, prices of bioenergy feedstocks are low compared to other markets, and understanding what management practices (e.g., stand density, fertilization, and rotation length) will produce the best economic returns from poplar genotypes is needed to appropriately promote and position SRWCs as a viable bioenergy feedstock [34].
Our objectives were to examine if first-year fertilization and its interactive effects with site/soil quality, stand density, and poplar genetics could lead to greater biomass yields and improved cost-effectiveness of poplar biomass production systems. For this purpose, we selected four poplar clones (‘140’, ‘185’, ‘230’, ‘356’) that were the most productive genotypes after eight years of clonal trials in North Carolina, USA [7,17,37,38]. We tested poplar productivity and economic returns under two stand densities and three fertilization regimes on fertile and marginal coastal sandy soils. We hypothesized that fertilizer application in year-one enhances poplar productivity and leads to improved profitability under high and low stand densities on fertile and marginal lands. Genotype responses to the early-age incidence of disease and pests, foliar N content, and leaf area index (LAI) were also evaluated across sites and treatments. Economic returns were evaluated based on the estimated stem biomass at six, and twelve years for current and potential market prices.

2. Materials and Methods

2.1. Site Description

Trial stands were established at coastal sites that varied in soil quality and cropping history (Table 1) using four poplar genotypes belonging to three genomic groups: P. deltoides × P. deltoides ‘DD’ clones ‘140’ and ‘356’; P. deltoides Populus maximowiczii A. Henry ‘DM’ clone ‘230’; Populus trichocarpa Torr. et. Gray × P. deltoides ‘TD’ clone ‘185’. Williamsdale, NC, USA had highly productive, fertile soils [39] while the two sites in Clinton, NC, USA (Clinton A and Clinton B) had marginal soils [40]. Prior to establishing poplars, the sites were planted with a winter wheat (Triticum aestivum L.) cover crop in fall 2014 and routinely mowed.

2.2. Experimental Setup

The experimental design was a cluster-randomized design with two densities (2500 and 5000 trees ha−1), three fertilization levels (0, 113, and 225 kg N ha−1) and four clones. Each cluster contained four trees of a clone; the clusters were replicated three times, and placed randomly within the study sites. At each site, 18 experimental plots (nine plots per density), and a total of 288 experimental trees were used. Border trees were planted around the perimeter of each plot to reduce border effects.
Site preparation was performed in February 2015 when soils were subsoiled (i.e., ripped) then banded with a 30-cm band of 41% glyphosate (4.67 L ha−1) and 37.4% pendimethalin (9.35 L ha−1) solution along the rip lines for weed control prior to planting. Poplar cuttings were purchased from ArborGen, LLC (Ridgeville, SC, USA), soaked for 24 h, and planted as 25-cm, non-rooted cuttings in March 2015. Nitrogen fertilizer (YaraLiva Calcinit 15.5-0-0, Yara North America, Tampa, FL, USA) was applied by hand in a 0.6-m radius around the individual trees within the fertilized plots in April 2015. Plots were banded with glyphosate/pendimethalin along the tree lines approximately five times per growing season for weed control. Non-banded areas were maintained by mowing once a month. All sites were treated for cottonwood leaf beetle (Chrysomela scripta Fabricius) infestation with Sevin® (Carbaryl, Bayer, Leverkusen, Germany), which was applied by hand sprayer in the early summer of year one and mist blower in early- and mid-summer of year two. Soil samples were collected in the spring of 2015 at a depth of 15 cm for each of the unfertilized plots and combined by site. The soils were analyzed at Waters Agricultural Laboratory (Warsaw, NC, USA) using the Mehlich III method, which is a method of extracting multiple soil micronutrients and macronutrients using a weak acid (Table 1).

2.3. Data Collection

The stem diameter at breast height (DBH) of six-year-old trees was measured at a height of 1.3 m using a Lufkin Executive Thin Line DBH tape (Apex Tool Group, Cleveland, OH, USA). The green stem biomass (GSB) per tree was estimated using the equation [41],
GSB = 0.1375   DBH   2.3681
where GSB is in kg and DBH is in cm.
During the second year of growth (July 2016), the presence of Melampsora castagne rust and C. scripta leaf damage were inventoried by scoring the presence or absence of damage for the whole tree. Leaf Area Index (LAI) measurements were also taken using an LAI-2000 LI-COR Plant Canopy Analyzer (LI-COR, Lincoln, Nebraska, NE, USA); the measurements were taken within the tree clusters with the same treatment combinations (density × fertilizer rate × clones). Leaf samples for foliar percent nitrogen (N) were also collected by compositing four leaves taken from each tree, one from each ordinal direction while increasing in height, for a total of 16 leaves per clone, per plot. All foliar samples were analyzed at Waters Agricultural Laboratory (Warsaw, NC, USA).

2.4. Data Analysis

Tree stem biomass values within each density × fertilization × clone split blocks (clusters) were summed to obtain total GSB values (Mg ha−1), which were analyzed (as completely randomized design) using a generalized linear model (PROC GLM, p = 0.05; SAS, Cary, NC, USA) to examine the effects of the levels of stand density, fertilization rate, and clone at the three sites. The following statistical model was used:
y ijk = μ + α D + β F + γ G + α β DF + α γ DG + β γ FG + α β γ DFG + ε DFG
where: μ is the overall average of the experiment, αD is the effect of density treatment (fixed), βF is the effect of fertilization treatment (fixed), γG is the fixed effect of clones, αβDF, αγDG, βγFG, and αβγDFG are effects of treatment interactions (density × fertilization, density × genetics, fertilization × genetics, density × fertilization × genetics, respectively) and εDFG is the random error.
LAI, foliar N, Melampsora rust, and C. scripta leaf damage data were also evaluated within the levels of stand density, fertilization rate, and clone at the three sites. Melampsora rust and C. scripta damage were scored using a modified Schreinder index with the percentage of leaves scored on a scale of 0 to 4 (0 = 100% of foliage with observable damage; 1 = 75%; 2 = 50%; 3 = 25%; 4 = no evidence of Melampsora rust or C. scripta damage) [42]. Field precision was determined by the duplication of field measurements for DBH, LAI, and foliar N. The resulting relative percent differences were 1 ± 3% for DBH (7.2% duplicated), 5.3 ± 5.6 % for LAI (21.2% duplicated) and 16 ± 12% for foliar nitrogen percent (11.5% duplicated).

2.5. Economic Analysis

The economic viability of the stands was examined using net present value (NPV) and break-even price analysis. Stand establishment and maintenance costs included chemical weed suppression, sub-soiling, cover crops, pesticide applications, and associated labor and material costs. Harvest and transport costs were determined assuming the harvested biomass was hauled for an average hauling distance of 84 km using a 40-tonne net log truck with a diesel consumption of 2.13 km L−1. A diesel price of 0.62 USD L−1 (assumed) was used, and poplar seedlings were assumed to cost 0.375 per seedling, the same as the ‘1000+’ hardwood price package in the North Carolina tree seedling catalog for 2020–2021 [43]. No costs of land rent or property taxes were included due to the unavailability of such cost information for marginal and abandoned lands. Stand revenues after six growing years were determined based on GSB values, and a delivered price of 27.01 USD Mg−1, which was the ten-year (2011–2020) average hardwood pulpwood delivered price for eastern North Carolina [44]. To determine revenues from the stands in 12-year rotations, mean annual increments (MAI, in Mg ha−1 year−1) of GSB at the age of 12 years were estimated using equations of the best-fit (logarithmic) curves for MAI versus age for treatment combinations during the study years (six). The treatment combinations used were selected based on GSB analyses (showing significant differences), and included density × genomic group at the Clinton sites (Supplementary Figure S1) and fertilizer rate × genomic group at the Williamsdale site (Supplementary Figure S2).

3. Results and Discussion

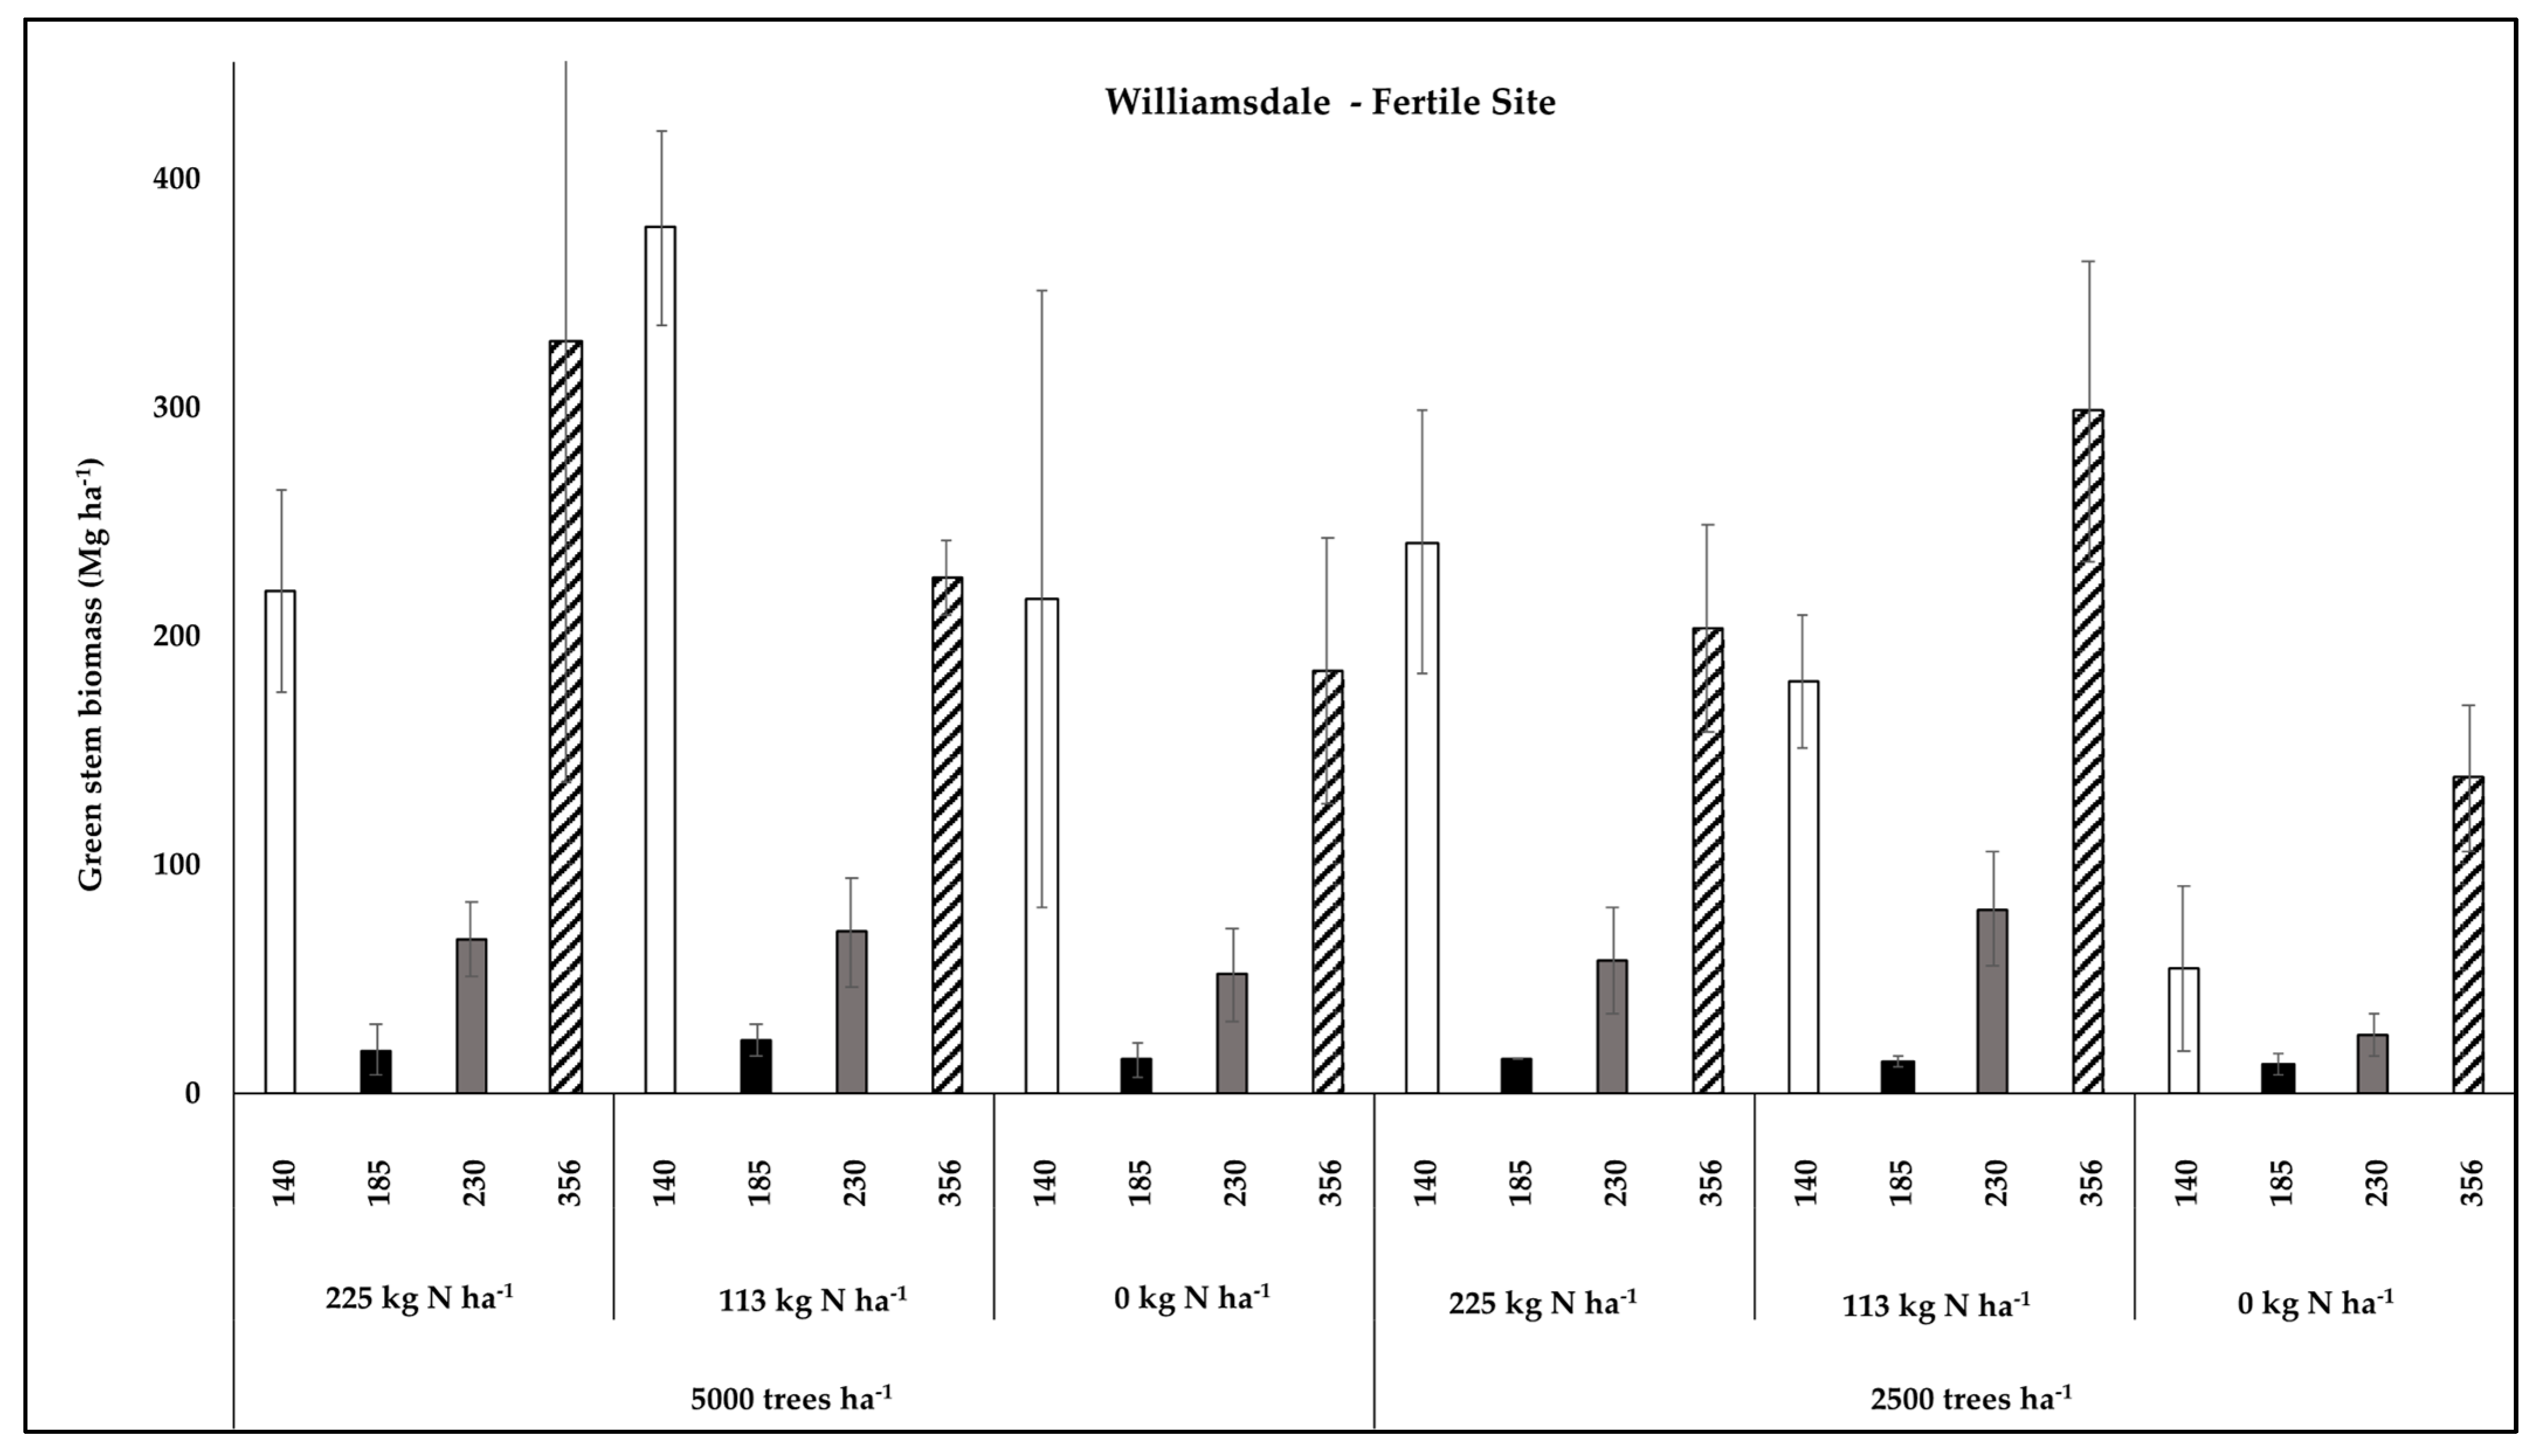
3.1. Clonal Productivity Responses to Stand Density and Fertilizer Application

The four poplar clones selected for this study had demonstrated superior growth and survival compared to other poplar clones as a function of genetics and site quality for sandy coastal soils [17,37]. There were differences in GSB among genomic groups in the fertile and marginal sites; however, there were no significant interaction effects of genotype with density or fertilization (p > 0.1371; Table 2 and Table 3). DD genotypes produced significantly greater GSB (Clinton A: 109.3 Mg ha−1; Clinton B: 92.5 Mg ha−1; Williamsdale: 219.1 Mg ha−1) than the DM (Clinton A: 54 Mg ha−1; Clinton B: 56.3 Mg ha−1; Williamsdale: 60.2 Mg ha−1) and TD (Clinton A: 48.9 Mg ha−1; Clinton B: 38.5 Mg ha−1; Williamsdale: 16.5 Mg ha−1) clones. Only clone (p < 0.0001) and density (p < 0.0001) were significant factors at both Clinton sites, while at Williamsdale, fertilization (p = 0.0003, Table 2 and Table S1) and density × fertilization × clone interaction effects (p = 0.0093) were also significant (Figure 1). At the three sites, clones ‘140’ (95.1 to 214.3 Mg ha−1) and ‘356’ (89.8 to 223.8 Mg ha−1) produced the greatest GSB and clone ‘185’ had lowest GSB (16.5 to 48.9 Mg ha−1). GSB after six years was greatest under the higher stand density at all sites (85.9 to 148.6 Mg ha−1 versus 55.9 to 124.9 Mg ha−1), although biomass productivity of both densities was comparable at early ages after the second growing season. Effects of site between Clinton A and B, and site interactions with stand density, fertilizer rates and clones were insignificant (p ≥ 0.1254; Table S2).
GSB under high and lower fertilization rates was similar at the Williamsdale site (164.8 Mg ha−1and 154.8 Mg ha−1, respectively; Table 2) but significantly higher than GSB in unfertilized plots (93.1 Mg ha−1). At the marginal sites, GSB did not significantly vary with fertilization rates but GSB was greater under the lower fertilizer treatments (78.4–93.6 Mg ha−1) than the high- (69.6 to 73.5 Mg ha−1) and no-fertilizer (63.7 to 71.8 Mg ha−1) treatment plots. The high fertilizer rate (225 kg N ha−1) had the greatest effect on GSB (> 29%) at the fertile Williamsdale site (all but one treatment combination) and greater effects on low productivity clones (‘185’ and ‘230’) and the higher stand density (5000 trees ha−1) at the marginal sites. Compared to the no-fertilizer treatment, the lower fertilizer rate (113 kg N ha−1) led to higher GSB in all treatment combinations at Williamsdale (>7%) and for more clones (‘185’, ‘230’, ‘356’) in the high than low stand density (only clone ‘356’) at Clinton-A. At Clinton B, the lower fertilization rate led to increases in GSB of clone ‘140’ under both densities (>22.5%). Across stand densities in the marginal sites, DD clones produced greater GSB under the lower fertilization rate (clone ‘356’ at Clinton A, clone ‘140’ at Clinton B) compared to unfertilized plots.
The density × fertilization × clone interaction effects on GSB were significant for all density (p < 0.0001), and fertilizer (p < 0.0001) treatment levels. However, only clones ‘140’ and ‘356’ showed significant interactions (p < 0.0001 and p = 0.0027, respectively) with the other density and fertilization treatments. Site comparisons between Clinton A and B (where the only difference was for the soil series) showed that soils of the marginal sites (p = 0.1254) or site interactions with the study treatment did not have significant effects on GSB (p = 0.1254 to 0.8577).
The site-specific responses of poplar productivity were not surprising and have been documented for coastal sandy soils [17,37]. Miller and Bender [45] reported that most of the variability in poplar growth responses was due to site effects, while genetics accounted for 23% of growth variability. Our study observed greater GSB differences among genotypes and due to genotype × site interactions, than biomass differences between the marginal and fertile sites, which were mainly attributed to soil quality differences. Our results supported that GSB yields can be improved by using poplar genotypes uniquely suited to site conditions. Estimated GSB yields of our non-fertilized, fertile site were similar to findings from previous poplar studies on moderately to highly fertile lands [16,21,35,38,41] that reported biomass values of 4.6 to 33.9 green Mg ha−1 year−1 (assuming 50% moisture content), and indicated that a green biomass greater than 40 Mg ha−1 year−1 is possible from site-matched genotypes [46]. In our study, GSB of 3.6 to 18 Mg ha−1 year−1 on marginal soils without fertilization (at 2500 trees ha−1 after six years of growth) were comparable to or greater than biomass values of 1.1 to 15.1 Mg ha−1 year−1 from previous poplar studies on marginal lands [27,47].
Interestingly, fertilization significantly improved GSB yields at the fertile site of our study, but not at the marginal sites. Studies addressing the site-specific response of poplars to fertilization have reported mixed results, with some having improved yields with fertilization [48] and others showing no improvements with fertilization [49]. The variable response of clones to fertilization between fertile and marginal soils emphasizes site-specific and soil quality differences on genetic responses. Marginal soils at our sites had a lower cation exchange capacity (CEC) than fertile soils (Table 1), in addition to lower phosphorus, potassium, and magnesium. The low CEC can result in rapid loss of nutrients due to leaching, particularly when fertilizer is applied in a single application to sandy soils [50].

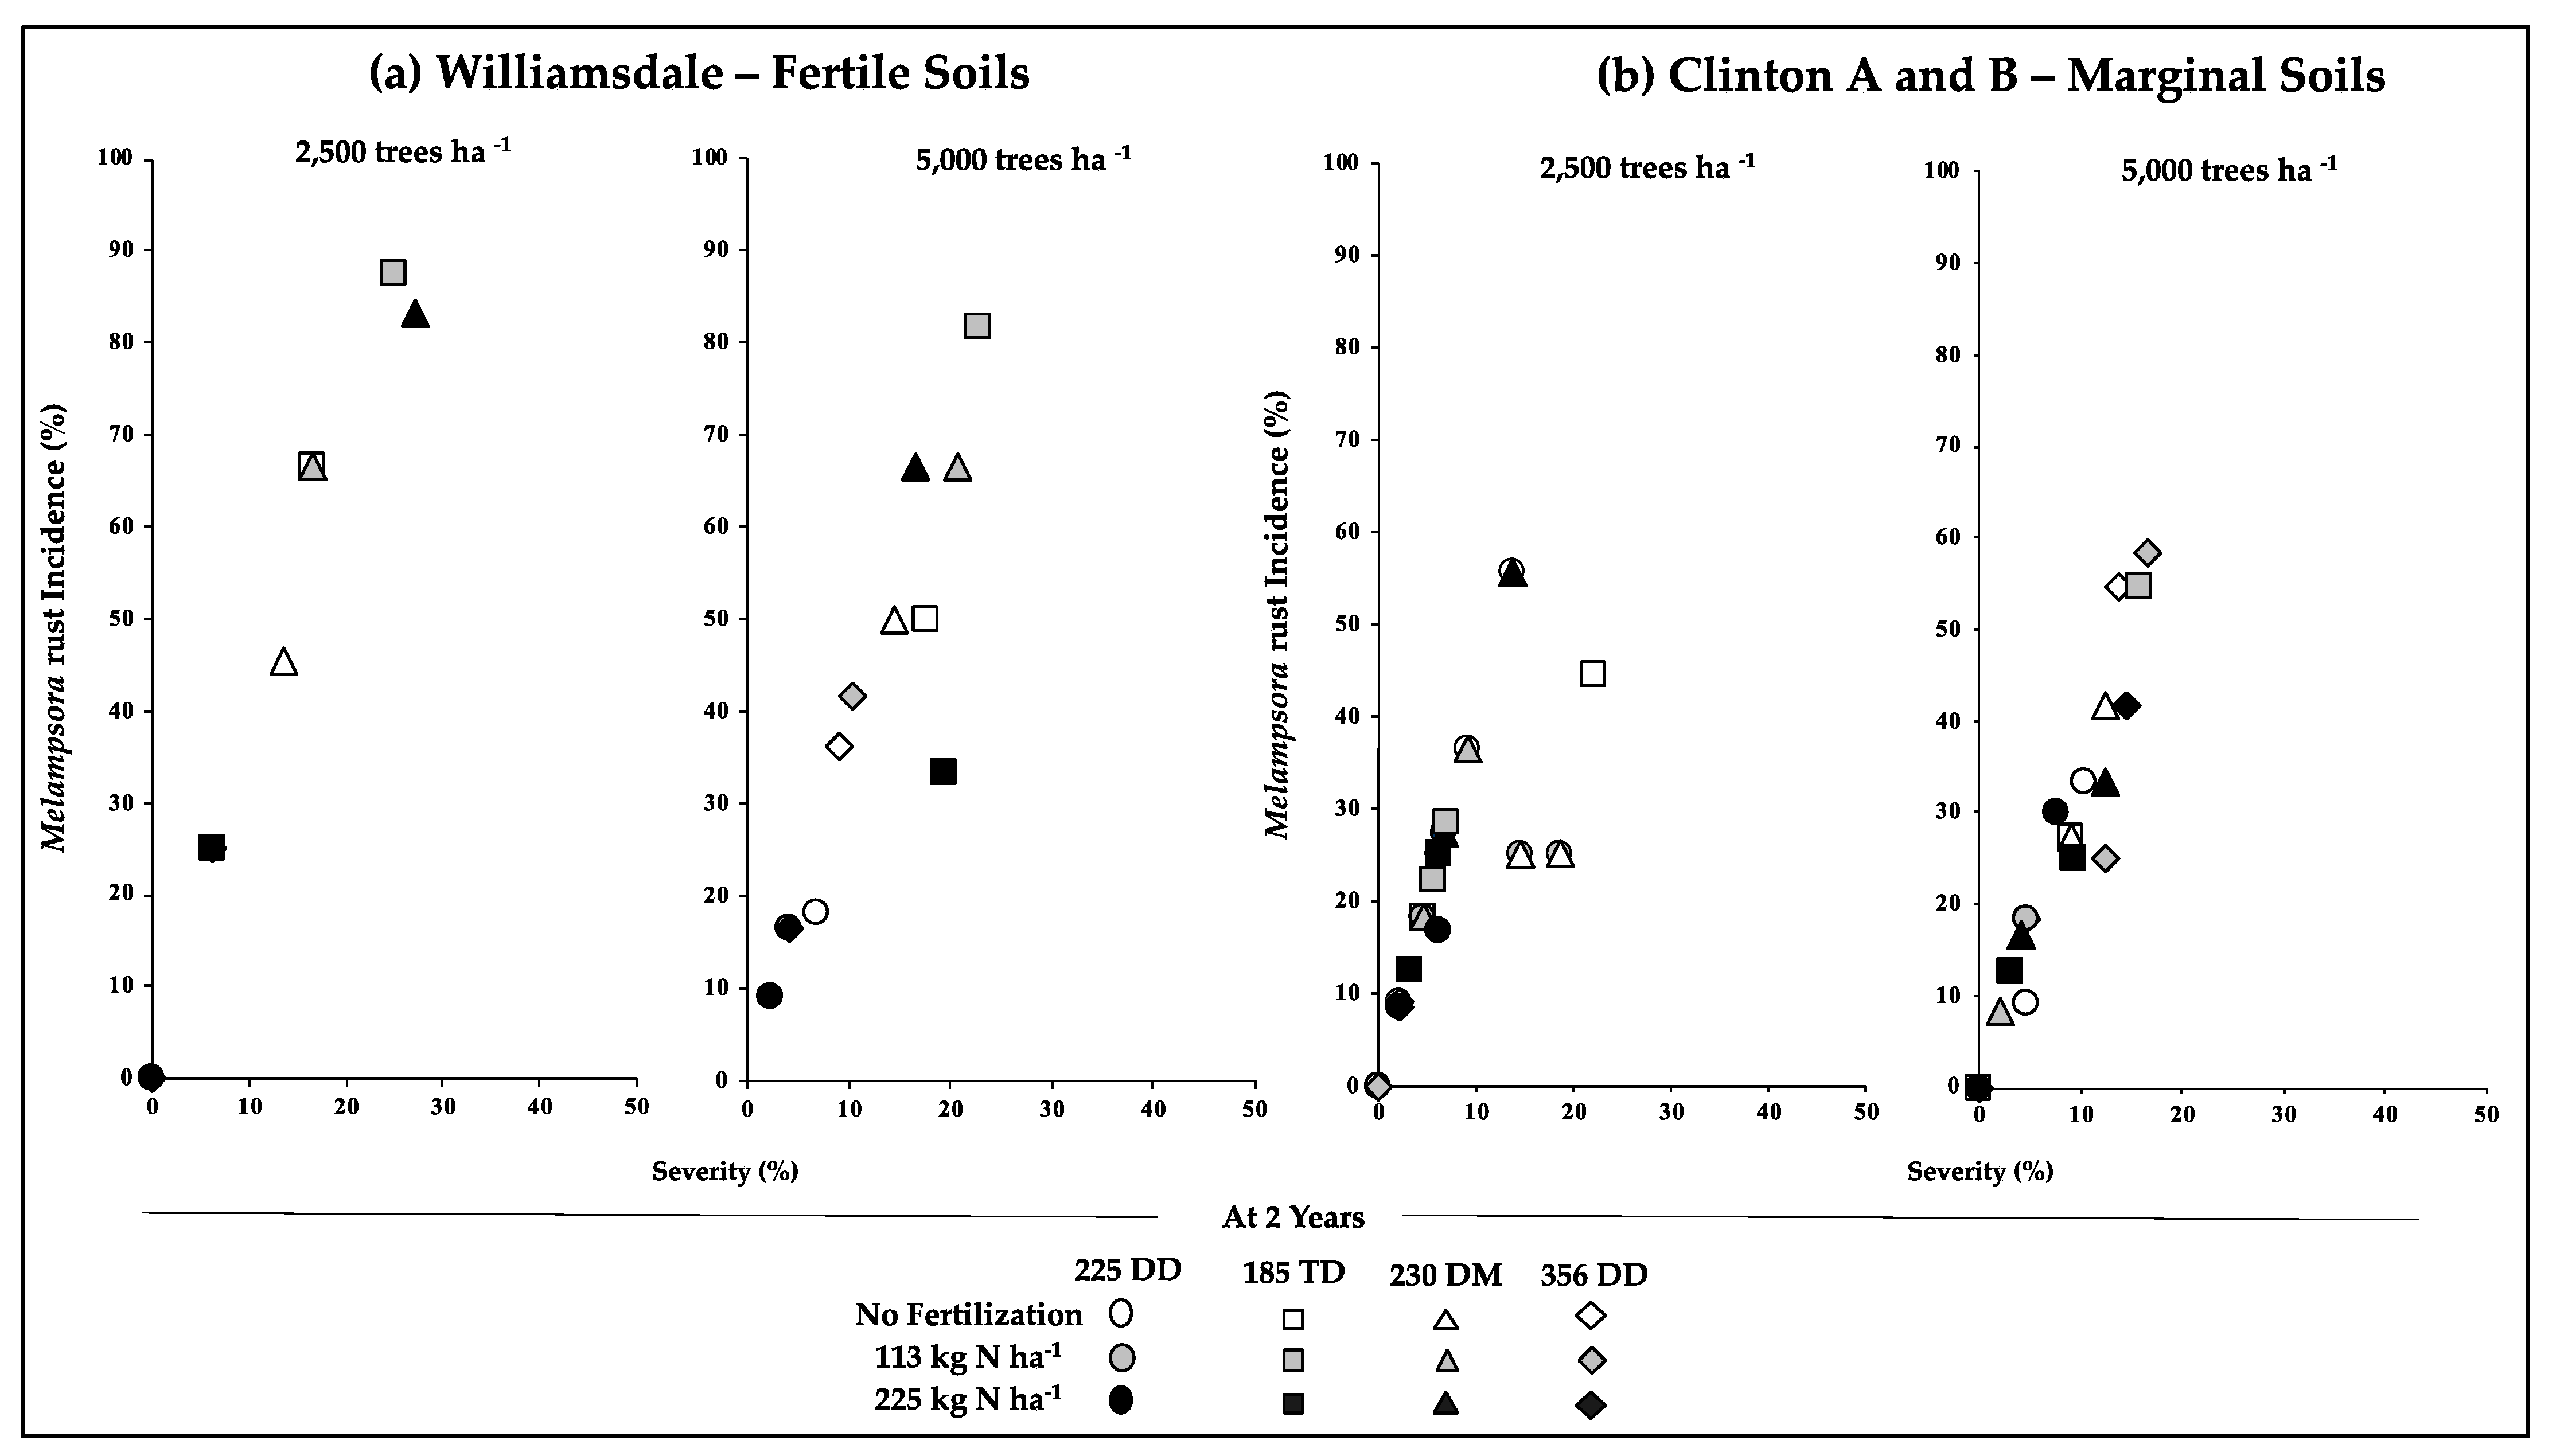
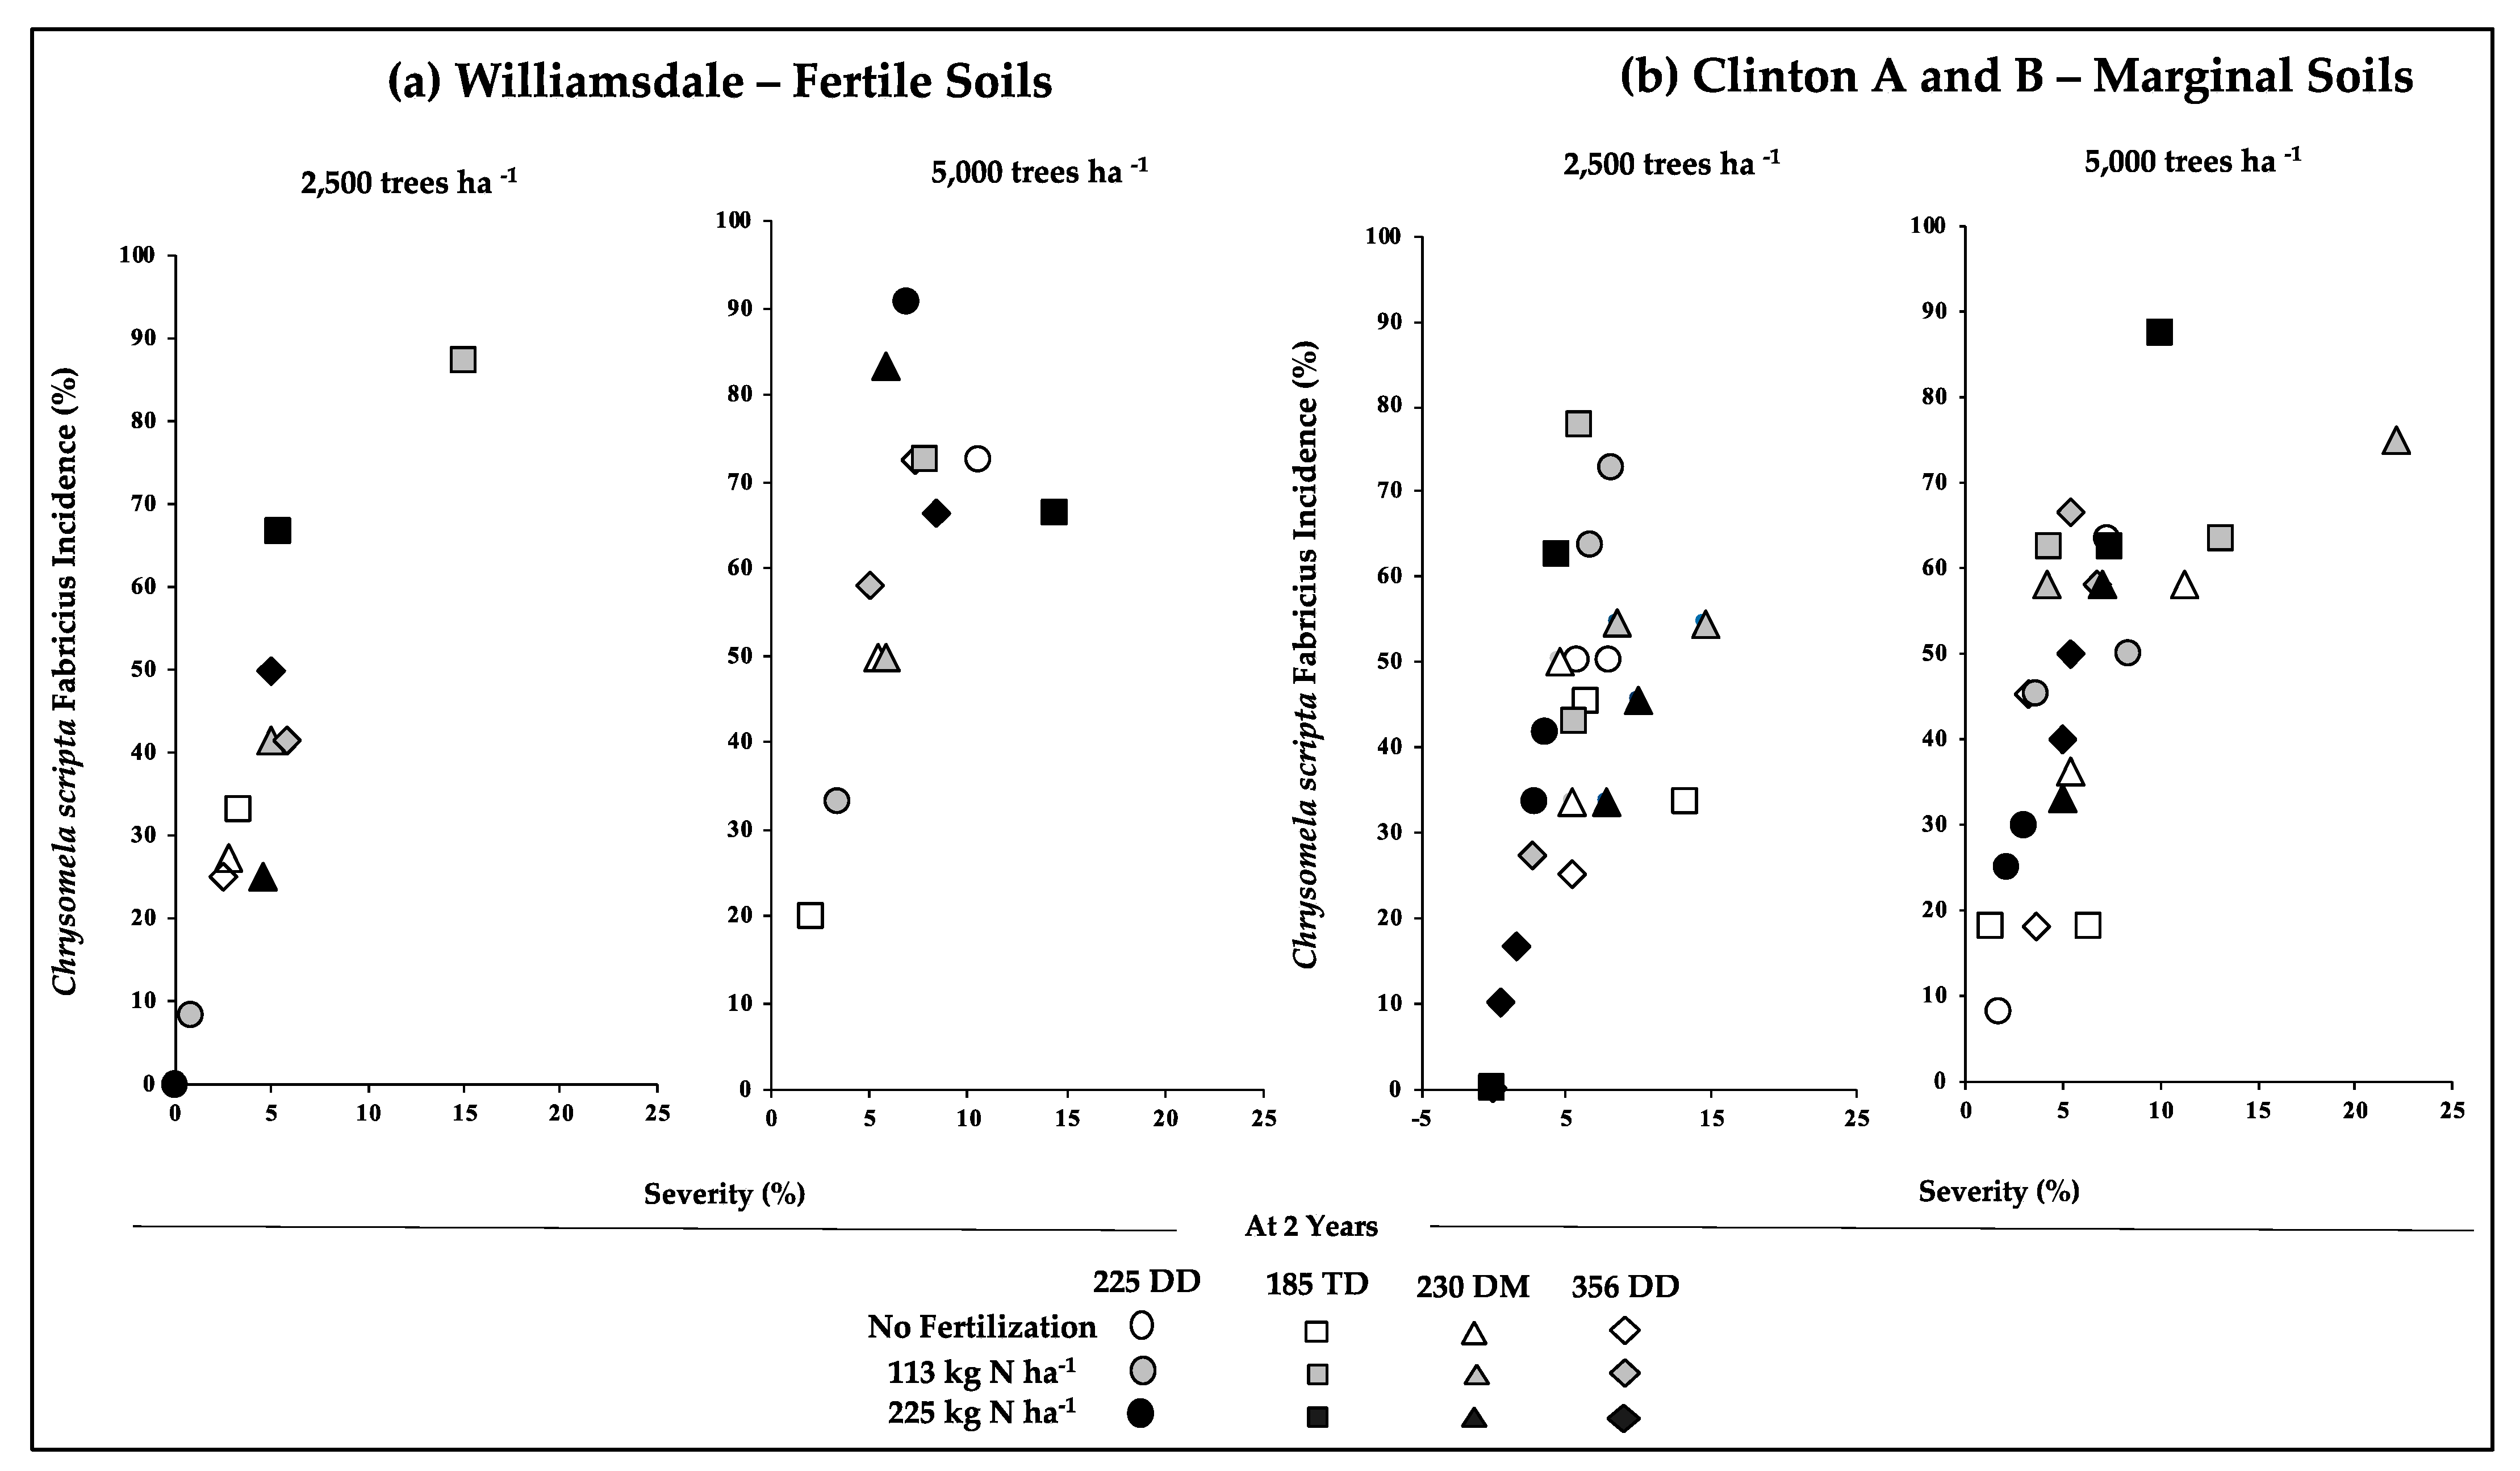
3.2. Early Growth/Productivity in Relation to the Incidence of Pests and Disease

Productivity depends on tree survival and health, particularly tree responses to predation, weed control, and disease [16,21,27,49]. Neither stand density (p = 0.3664), fertilization (p = 0.2341), nor their interactions (p > 0.117) were significant for survival, an outcome in agreement with Ghezehei et al. [7] and in contrast to other studies [18,28,51,52]. However, survival was significantly affected by clones (p < 0.0001). Regardless of the stand density and sites, survival in non-fertilized plots was >92% for clones ‘140’, ‘230’ and ‘356’ and ranged from 75% to 92% for clone ‘185’. Survival in fertilized plots was not consistent among clones, particularly for TD clone ‘185’, that had 58% to 100% of its trees alive, depending on the stand density and site. Regardless of the density or fertilization rate, DD (‘140’ and ‘356’) and DM (‘230’) clones had greater survival variability on the marginal soils (‘140’: 83 to 100%; ‘356’ and ‘230’:67 to 100%) than the fertile site where GSB was the highest. However, lower clonal survival did not always result in significantly lower biomass in fertilized plots, which corroborated a previous poplar study in the southeast USA [41].
Diseases and predation impact poplar productivity [37,53]. Melampsora rust, C. scripta, and white-tailed deer (Odocoileus virginianus Zimmermann) damage were observed at all three sites for all clones. The presence of deer damage was minimal (<1%) and did not impact tree health in this study. Melampsora rust was prevalent across all sites but differed significantly among sites (p < 0.0001) and clones (p = 0.0036) (Figure 2, Table S5). Stands on the fertile soil at Williamsdale had the highest rate of Melampsora rust (82%) compared to the stands on marginal soils for Clinton A (20%) and Clinton B (22%). Clone ‘185’ had a significantly higher presence of Melampsora rust (51%) across all sites than the other clones (34%). The stand density (p = 0.7090) and fertilization rate (p = 0.2031) did not significantly influence the presence of Melampsora rust (Figure 2). These results support prior findings that site and genotype are important factors for the extent of Melampsora rust damage [54].
Stand density significantly affected the presence of C. scripta (p < 0.0001; Figure 3 and Table S6). Overall, the stand density of 5000 trees ha−1 had 42% higher rates of C. scripta beetle damage than the density of 2500 trees ha−1. All clones exhibited a mean beetle damage incidence greater than 38%, but the TD clone ‘185’ had a higher damage incidence of 50%. Interestingly, low-fertilizer plots (113 kg N ha−1) had more beetle damage (52%) than the no-fertilization plots (33.6%) or the high-fertilizer (225 kg N ha−1) plots (44.5%), for all clones across the three sites. All three sites were treated for beetle infestation for both growing seasons, but denser stands may pose physical challenges to pesticide distribution, thus limiting the effectiveness of application [55].
The severity of the Melampsora rust and C. scripta damage can decrease photosynthesis efficiency, cause early defoliation, and increase susceptibility to other pests and fungal diseases [54]. Thus, Melampsora rust and C. scripta damage can reduce annual growth by as much as 50% [54], which impacts stand productivity and profitability for landowners. Trees with observed Melampsora rust and C. scripta incidence had a mean severity below 25% of the total crown area for any given treatment combinations of clone or stand density (Figure 2 and Figure 3). The differences in the severity of damage of treatment combinations were within 10% of one another, which led to weak correlations between biomass productivity (after two years) and Melampsora rust (R2 = 0.0886) or C. scripta incidence (R2 = 0.0056).

3.3. Productivity in relation to LAI and Foliar N
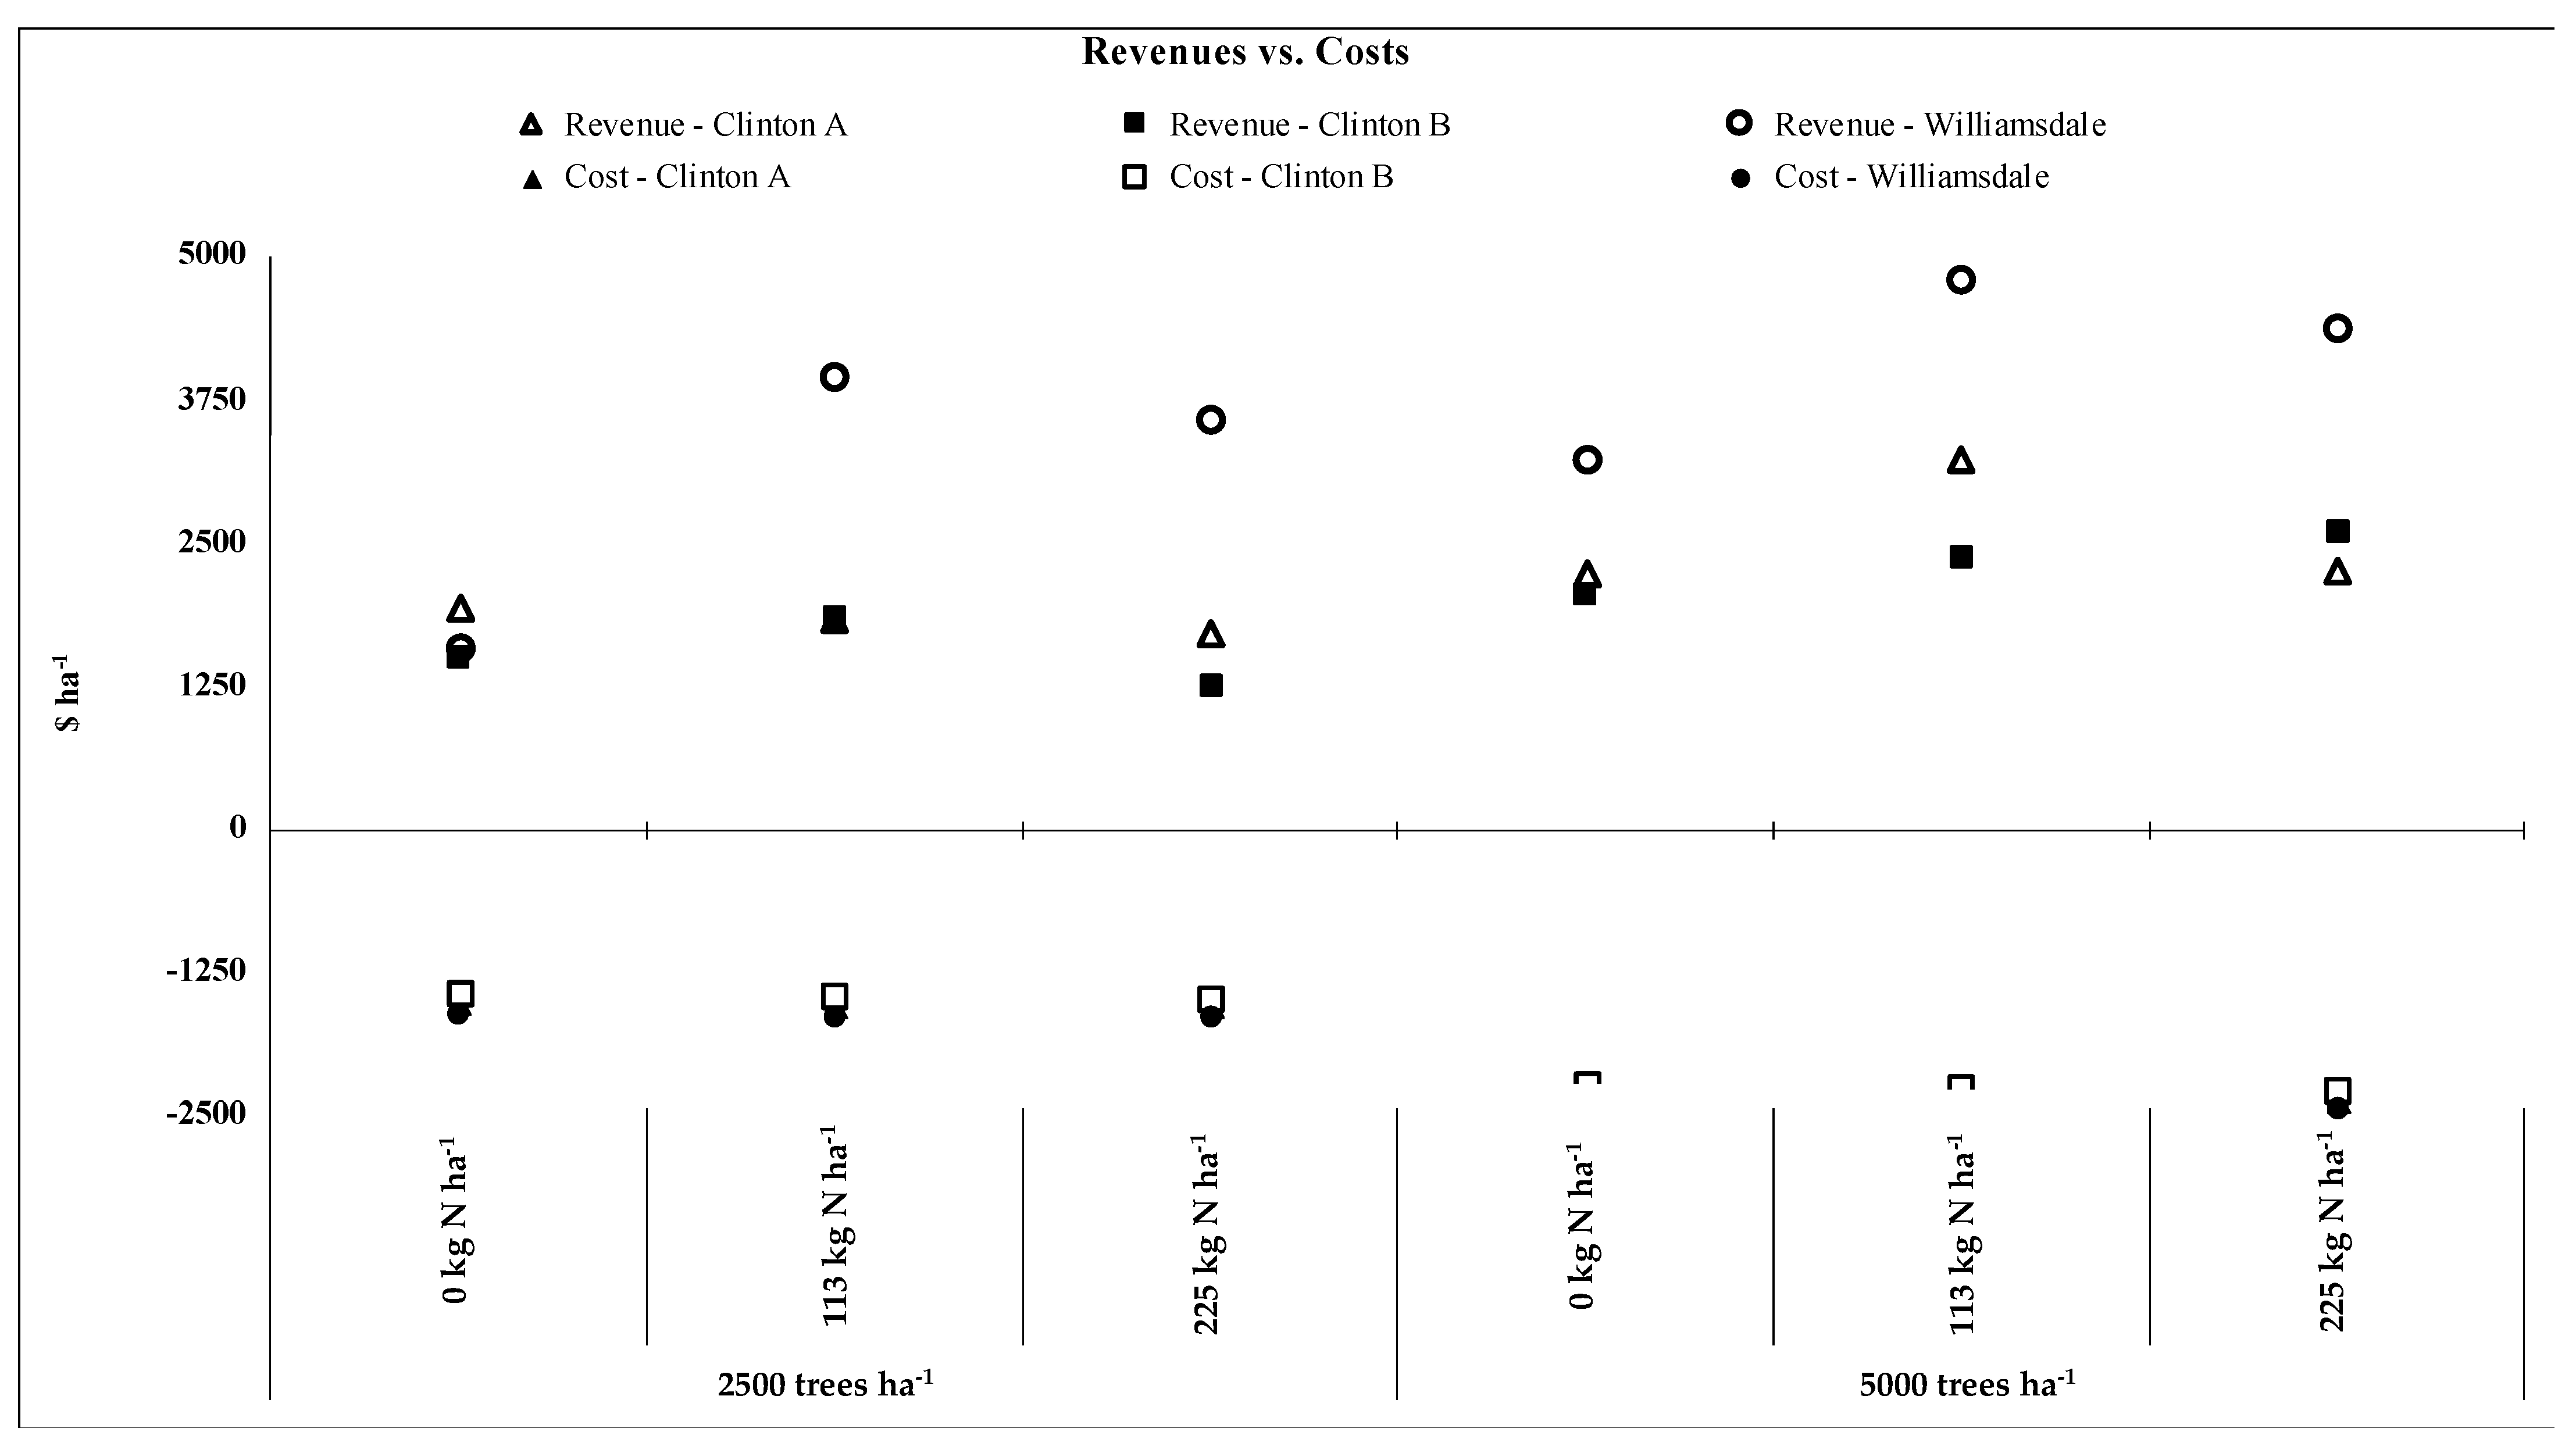
Biomass production in forest stands is directly related to the amount of solar radiation intercepted by the foliage or leaf area [56,57,58]. In our study, poplar LAI was significantly affected by stand density (p = 0.0012), fertilization (p < 0.0001), and clone (p < 0.0001), but not their interaction (p = 0.9461, Table S3). In contrast to previous studies [21,56,57], the correlation between LAI and biomass productivity at two years after planting was not strong (R2 = 0.12). The lack of correlation most likely reflects the influence of stand density, fertilization, and clone. The LAI (1.85 m2 m−2) of all trees on fertile soils (Williamsdale) was greater than the LAI for marginal soils (1.64 m2 m−2 for Clinton A and 1.35 m2 m−2 for Clinton B). Despite being one of the two highest stem biomass producers at the sites, DD clone ‘356’ had a significantly lower LAI (1.39 m2 m−2) than the other three clones (1.80 m2 m−2) (Table 3). In contrast to the findings of Fang et al. [21], the stand density of 5000 trees ha−1 had a lower average LAI (1.56 m2 m−2) than that of 2500 trees ha−1 (1.67 m2 m−2).
Foliar N (%) analyses can indicate whether nutrient concentrations are sufficient for metabolic requirements for tree growth [59]. This study found that foliar N of the young stands was significantly affected by fertilization (p < 0.0001), clone (p < 0.0001), and density × fertilization × clone interactions (p = 0.0227), but not stand density (p = 0.4443). Among unfertilized trees, foliar N was significantly higher at Williamsdale (1.97%) than Clinton A and B (1.84%). There were significant differences in foliar N among genotypes (p < 0.0001). DD clone ‘140’ had the highest foliar N (1.95%) while TD clone ‘185’ had the lowest foliar N (1.80%). Significant correlations were present between foliar N and biomass in this study (p < 0.0001, Table S7), which agreed with previous poplar results [59,60].
The influence of fertilization on foliar N content has varied among earlier studies. Pope et al. [61] reported that fertilization can be an important factor for foliar N poplar content on a certain soil series. Foliar N concentrations increased by approximately 5% in the fertilized treatments on fertile soils (Williamsdale), regardless of the stand density or clone. However, foliar N concentrations decreased by approximately 3% in the fertilized treatments of marginal soils, regardless of the stand density or clone, which may reflect a low N availability due to poor soil quality. Wilson et al. [60] observed that fertilized trees had higher foliar N%, but that N leachate increased with the fertilizer application rate. Thus, increased fertilization rates may not produce expected increases in poplar growth and foliar N, potentially due to soil processes such as microbial competition, leaching, and adsorption [60].

3.4. Profitability

At the current delivered price of 27.01 USD Mg−1, none of the study plantations would be economically feasible at the age of six years (Table 4). Economic feasibility of all stands in our study improved at longer rotations (Table 4), and the findings agreed with previous poplar studies [16,41,45,51]. The cost-effectiveness of plantations is also enhanced by selecting the best clones for a region. Based on our study, plantations of the best clones (‘140’ and ‘356’) would be feasible after at least 12 years of growth on the fertile site, enhanced with a medium fertilizer rate (113 kg N ha−1), and with longer than 12-year rotations on the marginal or fertile soils, with or without fertilization. Poplar biomass yields of 7 to 8 dry Mg ha−1 year−1 would not be profitable, even in markets supportive of short-rotation forestry [62], and our six-year-old stands would not be cost-effective even with a GSB of 63 Mg ha−1 (GSB ranged from 2 Mg ha−1 for clone ‘185’ to 63 Mg ha−1 clone ‘356’). It should be noted that trial-based productivity estimates, such as the year-12 MAI values in this study, are likely to overestimate the productivity that can be expected from large-scale productions.
Stand density has significant implications on the biomass productivity and cost-effectiveness of poplar plantations [16,45]. In the current study, stand density greatly impacted NPV. After six years of growth, GSB production was generally greater for the density of 5000 trees ha−1 than the density of 2500 trees ha−1 (Table 4), but the biomass gains were negated due to the higher establishment cost of the former (Figure 4). Consequently, non-fertilized and fertilized plots were generally less economically feasible at the higher density due to the added cost of more cuttings. Bioenergy plantations can be planted at a high stand density to maximize woody biomass production per unit area; it is not unreasonable to expect that higher density plantations can be viable for this purpose by producing more trees but with a smaller diameter, due to high intraspecific competition. In contrast, lower density trees produce fewer but bigger diameter trees; the production of larger diameters could lead to a higher income since a larger diameter can enhance stem grade for many applications.
Limited nutrient availability can reduce growth in SRWC plantations, and prior studies have shown increased biomass yields with nitrogen fertilization [7,16,35,48,61]. In our study, fertilization consistently improved growth, especially on fertile soils; the benefits, however, were marginalized due to the high cost of the fertilizer (USD 427.25 t−1) and subsequent additional weed management control. For fertile soils, where fertilization resulted in significant GSB increases (‘140’ and ‘356’), break-even prices, which are the market prices needed to simply recoup costs, decreased substantially from non-fertilized soils (Table 4). Medium fertilizer application rates seemed to have the best economic potential at both densities since it led to a higher GSB than the no-fertilization treatment, but was less costly than the higher-rate fertilization treatment (225 kg N ha−1).
Site fertility was a major factor for cost-effectiveness of the stands. For the same density, fertilizer rate, and growth (e.g., 13.4 Mg ha−1 year−1 from clone ‘140’ at Clinton B and clone ‘230’ at Williamsdale), marginal soils at Clinton had lower break-even prices than the fertile soil at Williamsdale because of the lower weed control costs on marginal soils. At the current price, profitability appears possible in rotations longer than 12 years on non-fertilized marginal and fertile soils in the region. A 50% increase in the current price (to USD 40.51 Mg−1) would make the best cases of density × fertilization × clone in the three sites we studied economically feasible; a 25% price increase (to USD 33.76 Mg−1) would lead to the cost-effectiveness of plantations at both the marginal and the fertile sites in a 12-year rotation (Table 4).
The most substantial challenges to profitability in our study were greater establishment costs for higher density plantings at all sites and weed control costs of the fertile site. Management greatly affected the cost-effectiveness of stands, a result that agreed with a previous study by Ghezehei et al. [34]. Average production costs of the study ranged from USD 1450 ha−1 for low density, lower fertilization marginal stands, to USD 2467 ha−1 for the high density, lower fertilization fertile stand (Williamsdale). Based on our current results, more stringent weed control was more effective than fertilization, whereas, a high fertilization rate is not as important for marginal or fertile soils to maximize productivity or economic feasibility. We also observed that fertilization and genotype can have significant effects on biomass productivity. These findings highlight the importance of selecting the correct poplar genomic groups or clones for site-specific conditions, as well as stand management and density, in order to optimize productivity with costs to achieve economic feasibility. This is especially true on marginal lands where biomass yields are hindered. These findings agree with prior economic analyses for poplars in coastal sandy soils [7].

4. Conclusions

Appropriate stand density, fertilization, and genotype selection can provide substantial biomass yields for poplars in coastal sandy soils. This study demonstrated that fertilization of poplars on marginal lands can improve biomass to be similar to stem biomass observed on non-fertilized, fertile soils; however, stem biomass was significantly greater on fertilized stands on fertile soil. The influence of genotype was specific to the fertilization, disease, pest, and foliar N response on fertile and marginal soils. Higher levels of fertilization did not necessarily correlate to higher biomass or profitability. At current market prices, profitability was not feasible for the study stands, even for those stands that produced a high stem biomass on fertile soil increased with fertilizer in the planting year. Higher stand density generally increased stem biomass on fertile and marginal lands, yet the most likely path to profitability would be at least 12-year rotations of both higher and lower density stands of DD clones treated with fertilizer. To be profitable, the marginal sites would require 12-year rotations, a medium fertilization rate, and proper clonal selection (i.e., ‘356’). The economic viability of poplars depends on site-specific management practices and genotype selection between fertile and marginal soils, as well as selection of the optimal rotation and significant increases of market prices.

Supplementary Materials

The following are available online at https://www.mdpi.com/article/10.3390/f12070869/s1; Figure S1: Mean annual increment (MAI, Mg ha−1) of green stem biomass versus stand age at Clinton A and Clinton B (in the Coastal region of North Carolina, USA) during the first six years of growth; Figure S2: Mean annual increment (MAI, Mg ha−1) of green stem biomass versus stand age at Williamsdale site in North Carolina, during the first six years of growth; Table S1: Results of analyses of variance for stem biomass (green) of poplar clones established at two stand densities with three fertilization rates at Clinton A, Clinton B, and Williamsdale (in the Coastal region of North Carolina, USA) after six years of growth ( = 0.05); Table S2: Results of analyses of variance for site effects and interaction on stem biomass (green) of poplar clones established at two stand densities with three fertilization rates at Clinton A, Clinton B, and Williamsdale (in the Coastal region of North Carolina, USA) after six years of growth ( = 0.05); Table S3: Results of analyses of variance for LAI of poplar clones during the second year of growth. The stands were established at two stand densities with three fertilization rates at three sites in the Coastal region of North Carolina, USA (Clinton A, Clinton B, and Williamsdale; = 0.05); Table S4: Results of analyses of variance for foliar nitrogen (%) of poplar clones during the second year of growth. The stands were established at two stand densities with three fertilization rates at three sites in the Coastal region of North Carolina, USA (Clinton A, Clinton B, and Williamsdale; = 0.05); Table S5: Results of analyses of variance for Melampsora (rust) presence on poplar clones during the second year of growth. The stands were established at two stand densities with three fertilization rates at three sites in the Coastal region of North Carolina, USA ( = 0.05); Table S6: Results of analyses of variance for Chrysomela scripta Fabricius damage presence on poplar clones during the second year of growth. The stands were established at two stand densities with three fertilization rates at three sites in the Coastal region of North Carolina, USA ( = 0.05); Table S7: Analysis results of stem biomass correlations with LAI, foliar N, Melampsora spp. rust, and Chrysomela scripta damage for poplars ( = 0.05). The poplar were two years old and established at two stand densities with three fertilization rates at three sites in the Coastal region of North Carolina, USA.

Author Contributions

Conceptualization and methodology, A.L.E., E.G.N. and D.W.H.; investigation, S.B.G., A.L.E., D.W.H. and E.G.N.; data curation and formal analysis, S.B.G. and A.L.E.; writing—original draft preparation, S.B.G. and A.L.E.; writing—review and editing, S.B.G., A.L.E., D.W.H., R.S.Z.J. and E.G.N.; project administration, E.G.N. and S.B.G.; funding acquisition, E.G.N. and D.W.H. All authors have read and agreed to the published version of the manuscript.

Funding

This research was funded by the North Carolina Department of Agriculture and Consumer Services, Bioenergy Research Initiatives (Grant numbers: G40100285014RSD and 17-072-4001).

Data Availability Statement

Data are available on request from the corresponding author. The data are not publicly available due to data management and storage agreement with the project sponsor, the North Carolina Department of Agriculture & Consumer Services, Bioenergy Research Initiatives.

Acknowledgments

We would like to thank the Williamsdale Biofuels Field Lab and the Horticultural Crops Research Station at Clinton for accommodating the study sites, and John Garner, Stewart Biegler and Charles Burrow for their cooperation and assistance in managing the research stands. We also thank Erica Simmons (NC State University student) for data analyses for the current study.

Conflicts of Interest

The authors declare no conflict of interest.

References

  1. U.S. Department of Energy. 2016 Billion-Ton Report: Advancing Domestic Resources for a Thriving Bioeconomy. In Economic Availability of Feedstocks; Langholtz, M.H., Stokes, B.J., Eaton, L.M., Eds.; ORNL/TM-2016/160; Oak Ridge National Laboratory: Oak Ridge, TN, USA, 2016; Volume 1, 448p. Available online: http://energy.gov/eere/bioenergy/2016-billion-ton-report (accessed on 23 February 2021). [CrossRef] [Green Version]
  2. Alternative Fuels Data Center. Energy Independence and Security Act of 2007. US Department of Energy, Energy Efficiency and Renewable Energy Office. Available online: https://afdc.energy.gov/laws/eisa.html (accessed on 29 March 2021).
  3. Hay, J.F. Corn for Biofuel Production. Farm Energy. 3 April 2019. Available online: https://farm-energy.extension.org/corn-for-biofuel-production/ (accessed on 18 March 2021).
  4. Larson, J.A.; English, B.C.; De La Torre Ugarte, D.G.; Menard, R.J.; Hellwinckel, C.M.; West, T.O. Economic and environmental impacts of the corn grain ethanol industry on the United States agricultural sector. J. Soil Water Conserv. 2010, 65, 267–279. [Google Scholar] [CrossRef] [Green Version]
  5. Chen, L.; Debnath, D.; Zhong, J.; Ferin, K.; Van Loock, A.; Khanna, M. The economic, and environmental costs and benefits of the renewable fuel standard. Environ. Res. Lett. 2021, 16, 034021. [Google Scholar] [CrossRef]
  6. Ghezehei, S.B.; Nichols, E.G.; Hazel, D.W. Early Clonal survival and growth of poplars grown on North Carolina Piedmont and Mountain marginal lands. BioEnergy Res. 2016, 9, 548–558. [Google Scholar] [CrossRef]
  7. Official Journal of the European Union. Commission Implementing Regulation (EU) 2020/1294 of 15 September 2020 on the Union Renewable Energy Financing Mechanism. Official Journal of the European Union, L303/1-L303/16. 17 September 2020. Available online: https://eur-lex.europa.eu/legal-content/EN/TXT/PDF/?uri=CELEX:32020R1294&from=EN (accessed on 27 February 2021).
  8. Matzenberger, J.; Kranzl, L.; Tromborg, E.; Junginger, M.; Daioglou, V.; Sheng Goh, C.; Keramidas, K. Future perspectives of international bioenergy trade. Renew. Sustain. Energy Rev. 2015, 43, 926–941. [Google Scholar] [CrossRef]
  9. FORISK Consulting. Wood bioenergy US. Forisk Res. Q. 2021. Quarter 1. Available online: https://forisk.com/wordpress//wp-content/assets/2021_Q1_WBUS_Free-Summary_20210203.pdf (accessed on 28 April 2021).
  10. Townsend, P.A.; Haider, N.; Boby, L.; Heavey, J.; Miller, T.A.; Volk, T.A. A Roadmap for Poplar and Willow to Provide Environmental Services and to Build the Bioeconomy; WSU Extension-EM115E; Washington State University (WSU): Washington, WA, USA, 2019; Peer-Reviewed. [Google Scholar]
  11. Cser, H.; Boby, L. Biomass feedstocks characteristics. South Reg. Ext. For. 2015. SREF-BE-005. Available online: https://sref.info/resources/publications/biomass-feedstocks-characteristics-1 (accessed on 18 April 2021).
  12. Balatinecz, J.J.; Kretschmann, D.E. Properties and utilization of poplar wood. In Poplar Culture in North America; Dickmann, D.I., Isebrands, J.G., Eckenwalder, J.E., Richardson, J., Eds.; National Research Council of Canada: Ottawa, ON, Canada, 2001; pp. 277–291. [Google Scholar]
  13. Tyndall, J.; Schulte, L.; Hall, R. Expanding the US Cornbelt Biomass Portfolio: Forester perceptions of the potential for woody biomass. Small Scale For. 2011, 10, 287–303. [Google Scholar] [CrossRef]
  14. Zalesny, R.S., Jr.; Cunningham, M.W.; Hall, R.B.; Mirck, J.; Rockwood, D.L.; Stanturf, J.A.; Volk, T.A. Woody biomass from short rotation energy crops. In Sustainable Production of Fuels, Chemicals and Fibers from Forest Biomass; Zhu, J.Y., Zhang, X., Pan, X., Eds.; American Chemical Society: Washington, DC, USA, 2011; pp. 27–63. [Google Scholar] [CrossRef]
  15. Wright, J.; Gallagher, T. Sustainable Production Practices of Short Rotation Woody Crops in the Southeastern United States: A Guidebook for Cottonwood and Hybrid Poplar. IBSS Southeastern Partnership for Integrated Biomass Supply Systems. Available online: http://www.se-ibss.org/publications-and-patents/extension-and-outreach-publications/sustainable-production-practices-of-short-rotation-woody-crops-in-the-southeastern-united-states-a-guidebook-for-cottonwood-and-hybrid-poplar (accessed on 15 February 2021).
  16. Miller, R.O.; Bender, B.A. Planting Density Effects on Biomass Growth of Hybrid Poplar Varieties in Michigan; Forest Biomass Innovation Center Research Report; Michigan State University: East Lansing, MI, USA, 2016; Available online: https://www.canr.msu.edu/uploads/396/36452/2016c.pdf (accessed on 3 March 2021).
  17. Shifflett, S.; Hazel, D.; Frederick, D.; Nichols, E.G. Species Trials of short rotation woody crops on two wastewater application sites in North Carolina, USA. BioEnergy Res. 2014, 7, 157–173. [Google Scholar] [CrossRef]
  18. Coyle, D.R.; Coleman, M.D.; Durant, J.A.; Newman, L.A. Survival and growth of 31 Populus clones in South Carolina. Biomass Bioenergy 2006, 30, 750–758. [Google Scholar] [CrossRef] [Green Version]
  19. Wang, D.; LeBauer, D.; Dietze, M. Predicting yields of short-rotation hybrid poplar (Populous spp.) for the United States through model-data synthesis. Ecol. Soc. Am. 2013. [Google Scholar] [CrossRef] [Green Version]
  20. Hinchee, M.; Rottmann, W.; Mullinax, L.; Zhang, C.; Shujun, C.; Cunningham, M.; Pearson, L.; Nehra, N. Short-rotation woody crops for bioenergy and biofuels applications. In Biofuels; Tomes, D., Lakshmanan, P., Songstad, D., Eds.; Springer: New York, NY, USA, 2011; pp. 139–156. [Google Scholar] [CrossRef]
  21. Fang, S.; Xu, X.; Lu, S.; Tang, L. Growth dynamics and biomass production in short-rotation poplar plantations: 6-year results for three clones at four spacings. Biomass Bioenergy 2000, 41, 415–425. [Google Scholar] [CrossRef]
  22. Amichev, B.Y.; Johnston, M.; Van Rees, K.C.J. Hybrid poplar growth in bioenergy production systems: Biomass prediction with a simple process-based model (3PG). Biomass Bioenergy 2010, 34, 687–702. [Google Scholar] [CrossRef]
  23. Mehmood, M.A.; Ibrahim, M.; Rashid, U.; Nawaz, M.; Ali, A.; Hussain, A.; Gull, M. Biomass production for bioenergy using marginal lands. Sustain. Prod. Consum. 2017, 9, 3–21. [Google Scholar] [CrossRef]
  24. Campbell, J.E.; Lobell, D.B.; Genova, R.C.; Field, C.B. The global potential of bioenergy on abandoned agriculture lands. J. Environ. Sci. Technol. 2008, 42, 5791–5794. [Google Scholar] [CrossRef]
  25. Finzi, A.C.; Norby, R.J.; Calfapietra, C.; Gallet-Budynek, A.; Gielen, B.; Holmes, W.E.; Hoosbeek, M.R.; Iversen, C.M.; Jackson, R.B.; Kubiske, M.E.; et al. Increases in Nitrogen Uptake Rather than Nitrogen-Use Efficiency Support Higher Rates of Temperate Forest Productivity under Elevated CO2. Proc. Natl. Acad. Sci. USA 2007, 104, 14014–14019. [Google Scholar] [CrossRef] [Green Version]
  26. Liu, Z.; Dickmann, D.I. Responses of two hybrid Populus clones to flooding, drought, and nitrogen availability. I. Morphology and growth. Can. J. Bot. 1992, 70, 2265–2270. [Google Scholar] [CrossRef]
  27. Truax, B.; Gagnon, D.; Fortier, J.; Lambert, F. Yield in 8 year-old hybrid poplar plantations on abandoned farmland along climatic and soil fertility gradients. For. Ecol. Manag. 2012, 267, 228–239. [Google Scholar] [CrossRef]
  28. Dipesh, K.; Blazier, M.; Pelkki, M.; Liechty, H. Genotype influences survival and growth of eastern cottonwood (Populus deltoides L.) managed as a bioenergy feedstock on retired agricultural sites of the Lower Mississippi Alluvial Valley. New For. 2017, 48, 95–114. [Google Scholar] [CrossRef]
  29. Crouse, D.A. Soils and Plant Nutrients. North Carolina State Extension Publications. Available online: https://content.ces.ncsu.edu/extension-gardener-handbook/1-soils-and-plant-nutrients (accessed on 21 March 2021).
  30. Flynn, R. Calculating Fertilizer Costs; Cooperative Extension Service; College of Agricultural, Consumer and Environmental Sciences, New Mexico State University: Las Cruces, NM, USA, 2014. [Google Scholar]
  31. Brown, K.; Van den Driessche, R. Effects of nitrogen and phosphorus fertilization on the growth and nutrition of hybrid poplars on Vancouver Island. New For. 2005, 29, 89–104. [Google Scholar] [CrossRef]
  32. Coyle, D.R.; Aubrey, D.P.; Siry, J.P.; Volfovicz-Leon, R.R.; Coleman, M.D. Optimal nitrogen application rates for three intensively-managed hardwood tree species in the southeastern USA. For. Ecol. Manag. 2013, 303, 131–142. [Google Scholar] [CrossRef] [Green Version]
  33. Lasa, B.; Jauregui, I.; Aranjuelo, I.; Sakalauskiene, S.; Aparicio-Tejo, P.M. Influence of stage of development in the efficiency of nitrogen fertilization on poplar. J. Plant Nutr. 2016, 39, 87–98. [Google Scholar] [CrossRef]
  34. Ghezehei, S.B.; Nichols, E.G.; Hazel, D.W. Productivity and cost-effectiveness of short-rotation hardwoods on various land types in the Southeastern USA. Int. J. Phytorem. 2019. [Google Scholar] [CrossRef]
  35. Long, H.; Li, X.; Wang, H.; Jia, J. Biomass resources and their bioenergy potential estimation: A review. Renew. Sustain. Energy Rev. 2013, 26, 344–352. [Google Scholar] [CrossRef]
  36. El Kasmioui, O.; Ceulemans, R. Financial analysis of the cultivation of short rotation woody crops for bioenergy in Belgium: Barriers and opportunities. BioEnergy Res. 2013, 6, 336–350. [Google Scholar] [CrossRef]
  37. Shifflett, S.D.; Hazel, D.W.; Nichols, E.G. Sub-soiling and genotype selection improves Populus productivity grown on a North Carolina sandy soil. Forests 2016, 794, 74. [Google Scholar] [CrossRef] [Green Version]
  38. Ghezehei, S.B.; Nichols, E.G.; Maier, C.A.; Hazel, D.W. Adaptability of Populus to physiography and growing conditions in the Southeastern USA. Forests 2019, 10, 118. [Google Scholar] [CrossRef] [Green Version]
  39. U.S. Department of Agriculture, Agricultural Statistics Service. 2012 Census of Agriculture, Volume 1, Chapter 1: National Level Data, Land: 2012 and 2007 (Table 8). Available online: https://www.nass.usda.gov/Publications/AgCensus/2012/Full_Report/Volume_1,_Chapter_1_US/st99_1_008_008.pdf (accessed on 16 April 2021).
  40. Web Soil Survey. 2016. Available online: https://websoilsurvey.sc.egov.usda.gov/App/HomePage.htm (accessed on 1 March 2021).
  41. Ghezehei, S.B.; Wright, J.; Zalesny, R.S., Jr.; Nichols, E.G.; Hazel, D.W. Matching site-suitable poplars to rotation length for optimized productivity. For. Ecol. Manag. 2020, 45, 117670. [Google Scholar] [CrossRef]
  42. Schreiner, E.J. Rating Poplars for Melampsora Leaf Rust Infection; Forest Research Note NE-90; U.S. Department of Agriculture, Forest Service, Northeastern Forest Experiment Station: Upper Darby, PA, USA, 1959; pp. 1–3.
  43. North Carolina Tree Seedling Catalog 2020–2021. Available online: https://www.ncforestservice.gov/nursery/pdf/NCFS_Tree_Seedling_Catalog.pdf (accessed on 15 February 2021).
  44. Historic North Carolina Delivered Timber Prices, 1988–2020. NC State Extension. Available online: https://content.ces.ncsu.edu/historic-north-carolina-delivered-timber-prices-1988-2014 (accessed on 21 April 2021).
  45. Miller, R.O.; Bender, B.A. Sources of variation in hybrid poplar biomass production throughout Michigan, USA. Michigan State University, Forest Biomass Innovation Center Research Report, 2016 (d). In Proceedings of the A Presentation in the 25th International Poplar Symposium, Berlin, Germany, 13–16 September 2016. [Google Scholar]
  46. Zalesny, R.S., Jr.; Stanturf, J.A.; Gardiner, E.S.; Perdue, J.H.; Young, T.M.; Coyle, D.R.; Headlee, W.L.; Bañuelos, G.S.; Hass, A. Ecosystem services of woody crop production systems. BioEnergy Res. 2016, 9, 465–491. [Google Scholar] [CrossRef] [Green Version]
  47. Dillen, S.Y.; Djomo, S.N.; Al Afas, N.; Vanbeveren, S.; Ceulemans, R. Biomass yield and energy balance of a short-rotation poplar coppice with multiple clones on degraded land during 16 years. Biomass Bioenergy 2013, 56, 157–165. [Google Scholar] [CrossRef] [Green Version]
  48. Christersson, L. Biomass production of intensively grown poplars in the southernmost part of Sweden: Observations of characters, traits and growth potential. Biomass Bioenergy 2006, 30, 497–508. [Google Scholar] [CrossRef]
  49. Vande Walle, I.; Van Camp, N.; Van de Casteele, L.; Verheyen, K.; Lemeur, R. Short-rotation forestry of birch, maple, poplar and willow in Flanders (Belgium) I-Biomass production after 4 years of tree growth. Biomass Bioenergy 2007, 31, 267–275. [Google Scholar] [CrossRef]
  50. Sonon, L.S.; Kissel, D.E.; Saha, U. Cation Exchange Capacity and Base Saturation. University of Georgia Extension. 2017. Available online: https://secure.caes.uga.edu/extension/publications/files/pdf/C%201040_2.PDF (accessed on 27 March 2021).
  51. Ghezehei, S.B.; Shifflett, S.D.; Hazel, D.W.; Nichols, E.G. SRWC bioenergy productivity and economic feasibility on marginal lands. J. Environ. Manage. 2015, 160, 57–66. [Google Scholar] [CrossRef] [Green Version]
  52. Navarro, A.; Stellacci, A.; Campi, P.; Vitti, C.; Modugno, F.; Mastrorilli, M. Feasibility of SRC species for growing in Mediterranean conditions. BioEnergy Res. 2016, 9, 208–223. [Google Scholar] [CrossRef]
  53. Verlinden, M.S.; Broeckx, L.S.; Van den Bulcke, J.; Van Acker, J.; Ceulemans, R. Comparative study of biomass determinants of 12 poplar (Populus) genotypes in a high-density short-rotation culture. For. Ecol. Manag. 2013, 307, 101–111. [Google Scholar] [CrossRef]
  54. Covarelli, L.; Beccari, G.; Tosi, L.; Fabre, B.; Frey, P. Three-year investigations on leaf rust of poplar cultivated for biomass production in Umbria, Central Italy. Biomass Bioenergy 2013, 49, 315–322. [Google Scholar] [CrossRef]
  55. Coyle, D.R.; Hart, E.R.; McMillin, J.D.; Rule, L.C.; Hall, R.B. Effects of repeated cottonwood leaf beetle defoliation on Populus growth and economic value over an 8-year harvest rotation. For. Ecol. Manag. 2008, 255, 3365–3373. [Google Scholar] [CrossRef]
  56. Ceulemans, R.; Pontailler, J.; Mau, F.; Guittet, J. Leaf allometry in young poplar stands: Reliability of leaf area index estimation, site and clone effects. Biomass Bioenergy 1993, 4, 315–321. [Google Scholar] [CrossRef]
  57. Ridge, C.R.; Hinckley, T.M.; Stettler, R.F.; Van Volkenburgh, E. Leaf growth characteristics of fast-growing poplar hybrids Populus trichocarpa × P. deltoides. Tree Physiol. 1986, 1, 209–216. [Google Scholar] [CrossRef] [PubMed]
  58. Waring, R.; Landsberg, J.; Linder, S. Tamm Review: Insights gained from light use and leaf growth efficiency indices. For. Ecol. Manag. 2016, 379, 232–342. [Google Scholar] [CrossRef]
  59. dLteif, A.; Whalen, J.K.; Bradley, R.L.; Camire, C. Diagnostic tools to evaluate the foliar nutrition and growth of hybrid poplars. Can. J. For. Res. 2008, 38, 2138–2147. [Google Scholar]
  60. Wilson, A.; Nzokou, P.; Güney, D.; Kulaç, Ş. Growth response and nitrogen use physiology of Fraser fir (Abies fraseri), red pine (Pinus resinosa), and hybrid poplar under amino acid nutrition. New For. 2013, 44, 281–295. [Google Scholar] [CrossRef]
  61. Pope, P.E.; McLaughlin, R.A.; Hansen, E.A. Biomass and nitrogen dynamics of hybrid poplar on two different soils: Implications for fertilization strategy. Can. J. For. Res. 1988, 18, 223–230. [Google Scholar]
  62. Schweier, J.; Becker, G. Economics of poplar short rotation coppice plantations on marginal land in Germany. Biomass Bioenergy 2013, 59, 494. [Google Scholar]
Figure 1. Mean green stem biomass (Mg ha−1) for Populus clones established at a fertile Coastal site (Williamsdale) in North Carolina, USA by stand density and fertilization treatment after six years of growth. Error bars denote one standard deviation of the mean per treatment (α = 0.05, ANOVA).
Forests 12 00869 g001
Figure 2. Melampsora rust incidence (%) and severity (%) for four Populus clones established on (a) fertile soil at Williamsdale and (b) marginal soils in Clinton in the Coastal region in North Carolina, USA, by site, stand density, and fertilization treatment after two years of growth.
Forests 12 00869 g002
Figure 3. Chrysomela scripta Fabricius incidence (%) and severity (%) of four Populus clones established on (a) fertile soil at Williamsdale and (b) marginal soils in Clinton in the Coastal region in North Carolina, USA, by stand density, and fertilization treatment after two years of growth.
Forests 12 00869 g003
Figure 4. Comparisons of revenues and costs (establishment and management) of six-year-old hybrid poplar plantations established in the Coastal region in North Carolina, USA, by site, stand density, and fertilization treatment. Mean clonal stem biomass values were used to calculate revenues.
Forests 12 00869 g004
Table 1. Climate and site characteristics of Clinton A, Clinton B and Williamsdale in North Carolina, USA.
Site Characteristics Clinton A Clinton B Williamsdale
Soil Quality Marginal Marginal Fertile
Location 35° 1′ 20.47″ N; 78° 16′ 24.62″ W 35° 1′ 20″ N; 78° 16′ 23.90″ W 34° 45′ 51.06″ N; 78°5′ 59.04″ W
Soil Series c Wagram loamy sand Orangeburg loamy fine sand Noboco loamy fine sand
Mean Annual Rainfall (mm) a,b 1371 1371 1480
Elevation (msl) a 50.6 50.6 17
Mean Annual T (C) a,b 16.7 16.7 16.7
Mean Daily Humidity (%) a,b 71.9 71.9 73.4
Mean Plant Available Water (cm3 cm−3) a,b 0.18 0.18 0.2
Soil pH d 6.2 6.1 6
Cation Exchange Capacity (Meq/100g) d 2.3 2.1 6.9
Soil P (kg ha−1) d 504 605 1011
Soil K (kg ha−1) d 131 112 410
Soil Mg (kg ha−1) d 102 92 308
Soil Ca (kg ha−1) d 559 517 1630
Soil NO-3 (kg ha−1) d 3.7 2.5 4.1
Prior Crop Sorghum Sorghum Corn
a Climate data provided by the State Climate Office of North Carolina; b December 2014–December 2016; c Data provided by USDA Web Soil Survey (last accessed on 15 June 2020)); d collected at a depth of 15 cm.
Table 2. Green stem biomass (Mg ha−1) of four six-year-old hybrid poplar clones established under three fertilization rates and two stand densities at three sites in the Coastal region of North Carolina, USA. Treatment means within sites with the same letter are not significantly different.
TreatmentsMean Stem Biomass (Mg ha−1)
Clinton AClinton BWilliamsdale
Stand Density5000 trees ha−1
2500 trees ha−1
MSD (= 0.05)
93.9 A
65.3 B
18.02
85.6 A
55.9 B
16.69
148.6 A
124.9 A
27.98
Fertilizer Rate225kg N ha−1
113 kg N ha−1
0 kg N ha−1
MSD (= 0.05)
73.5 A
93.6 A
71.8 A
26.6
69.6 A
78.4 A
63.7 A
24.6
164.8 A
154.8 A
93.1 B
36.06
Clone‘140’
‘356’
‘230’
‘185’
MSD (⍺ = 0.05)
114.8 A
103.2 A
54.0 B
48.9 B
33.80
95.1 A
89.8 A
56.3 B
38.5 B
31.30
214.3 A
223.8 A
60.2 B
16.5 B
52.81
Overall79.469.8129.7
Table 3. Estimated green stem biomass (Mg ha−1) after six years, and leaf area index (LAI, m2 m−2) and foliar nitrogen content (%) during the second growing season of poplar clones established at two stand densities with three fertilization rates at three sites in the Coastal region of North Carolina, USA.
Stand
Density
Fertilizer RatesClone
(Genomic
Group)
Stands Age: Six YearsStand Density: Two Years
Mean Green Stem Biomass ± 1SD (Mg ha−1)LAI (m2 m−2) (SD)Foliar N% (SD)
Clinton
A
Clinton
B
WilliamsdaleClinton
A
Clinton
B
WilliamsdaleClinton
A
Clinton
B
Williamsdale
5000
trees ha−1
225
(kg N ha−1)
‘140’ (DD)
‘185’ (TD)
‘230’ (DM)
‘356’ (DD)
107.3 ± 48.8
62.1 ± 78.4
52.3 ± 14.6
103.2 ± 52.8
114.4 ± 52.3
55.0 ± 31.5
68.0 ± 28.5
136.3 ± 39.4
219.1 ± 44.3
18.5 ± 11.0
66.8 ± 16.1
329 ±193.4
1.2 (0.5)
1.8 (0.9)
1.9 (0.8)
1.3 (0.6)
0.9 (0.3)
1.2 (0.3)
1 (0.2)
0.9 (0.3)
1.2 (0.2)
1.4 (0.2)
1.2 (0.3)
1.3 (0.2)
2 (0.2)
2.1 (0.1)
1.9 (0.2)
1.8 (0.4)
1.7 (0.2)
1.7 (0.3)
1.8 (0.2)
1.8 (0.2)
2.1 (0.1)
2 (0.2)
2 (0.2)
2 (0.1)
113
(kg N ha−1)
‘140’ (DD)
‘185’ (TD)
‘230’ (DM)
‘356’ (DD)
146.2 ± 41.6
61.5 ± 42.0
90.2 ± 16.8
170.2 ± 60.3
140.5 ± 51.5
48.0 ± 12.2
74.5 ± 19.7
80.6 ± 57.0
378.1 ± 42.5
22.8 ± 6.8
70.2 ± 23.5
225.2 ± 15.9
1 (0.3)
1.6 (0.4)
1.4 (0.5)
1.5 (0.5)
1.2 (0.4)
1.8 (0.5)
1.5 (0.3)
1 (0.1)
2.2 (0.1)
2.5 (0.2)
2.7 (0.1)
2.5 (0.1)
1.7 (0.3)
1.8 (0.2)
1.7 (0.2)
1.3 (0.3)
1.6 (0.1)
1.6 (0.3)
1.6 (0.1)
1.9 (0.1)
2.2 (0.1)
2.1 (0.2)
2 (0.3)
2.1 (0.1)
0
(kg N ha−1)
‘140’ (DD)
‘185’ (TD)
‘230’ (DM)
‘356’ (DD)
141.7 ± 61.4
44.6 ± 27.2
43.5 ± 17.8
93.2 ± 55.6
112.2 ± 27.9
44.9 ± 14.4
62.7 ± 19.8
76.4 ± 71.8
215.7±135.2
14.3 ± 7.8
51.4 ± 20.7
184.7 ± 58.3
1.5 (0.4)
2.1 (0.4)
2.2 (0.2)
1.4 (0.3)
1 (0.1)
2.1 (0.1)
1.1 (0.4)
1.1 (0.1)
1.9 (0.4)
2.2 (0.6)
1.8 (0.3)
2.2 (0.6)
2.1 (0.3)
1.8 (0.1)
1.9 (0)
2 (0.2)
1.9 (0.1)
1.8 (0.1)
1.8 (0.2)
1.8 (0.1)
2.2 (0.2)
2.1 (0.6)
2.1 (0.2)
2.1 (0.1)
2500
trees ha−1
225
(kg N ha−1)
‘140’ (DD)
‘185’ (TD)
‘230’ (DM)
‘356’ (DD)
102.1 ± 14.8
30.0 ± 13.5
44.0 ± 10.9
70.1 ± 43.2
57.4 ± 25.7
38.4 ± 7.1
38.8 ± 5.7
43.2 ± 12.8
240.6 ± 57.3
15.2
57.8 ± 23.5
203.2 ± 45.1
1.8 (0.3)
1.5 (0.5)
1.3 (0.4)
1.1 (0.4)
1.3 (0.5)
1.1 (0.4)
1.1 (0.5)
1.6 (0.6)
1.2 (0.5)
1.3 (0.6)
1.7 (0.9)
1.5 (0.7)
1.8 (0.1)
1.6 (0.4)
1.8 (0.1)
1.7 (0.3)
1.7 (0.4)
2.2 (0.3)
2.1 (0.3)
1.9 (0.2)
2 (0.2)
1.9 (0)
1.9 (0.2)
1.9 (0.1)
113
(kg N ha−1)
‘140’ (DD)
‘185’ (TD)
‘230’ (DM)
‘356’ (DD)
83.9 ± 39.7
46.3 ± 4.0
45.3 ± 5.4
89.7 ± 33.4
80.4 ± 54.6
24.3 ± 15.4
53.1 ± 11.2
107.9 ± 58.8
180.1 ± 28.8
13.1 ± 2.4
80.1 ± 24.9
298.0 ± 65.9
1.8 (0.3)
1.5 (0.5)
1.3 (0.4)
1.1 (0.4)
1.8 (0.4)
1.9 (0.3)
1.5 (0.2)
1.4 (0.3)
1.8 (0.8)
1.5 (0.6)
1.9 (1)
1.4 (0.6)
1.8 (0.1)
1.6 (0.4)
1.8 (0.1)
1.7 (0.3)
1.7 (0.1)
1.6 (0)
2 (0.3)
1.9 (0.2)
2.1 (0.5)
1.8 (0.2)
2.1 (0.2)
2.1 (0.1)
0
(kg N ha−1)
‘140’ (DD)
‘185’ (TD)
‘230’ (DM)
‘356’ (DD)
107.7 ± 12.1
51.0 ± 37.2
48.6 ± 21.1
71.4
65.6 ± 46.4
21.3 ± 16.0
40.4 ± 12.7
90.0 ± 22.5
54.1 ± 36.0
12.2 ± 4.4
25.5 ± 9.2
137.5 ± 32.1
1.5 (0.6)
1.8 (0.8)
2.1 (0.2)
2.1 (0.6)
1.3 (0.5)
1.4 (0.3)
1.9 (0.3)
2.1 (0.1)
2.3 (0.5)
2.3 (0.8)
2.4 (0.4)
2.1 (0.6)
1.9 (0.2)
2 (0.3)
1.8 (0.2)
1.6 (0.2)
1.7 (0.2)
1.9 (0.1)
1.6 (0.3)
1.4 (0.2)
2.1 (0.2)
2.1 (0.1)
1.9 (0.1)
2.1 (0.1)
Table 4. Net present values (NPV, USD ha−1), break-even prices (USD per green Mg stem biomass), and mean annual increments of stem biomass (MAI, in Mg ha−1 year−1) of poplar stands established at three sites in the Coastal region of North Carolina, USA, as a function of stand density, fertilization rate, and rotation length (six and twelve years). Prices used in NPV calculations, and break-even prices represent hardwood pulpwood prices at delivery.
Stand
Density
Fertilizer
Rates
CloneStand Age: 6 YearsStand Age: 12 Years
NPV ($USD ha−1) at
(Price = $27 Mg−1)
Break-Even Price
($USD Mg−1 Green Biomass)
NPV ($USD ha−1)
(Price = $27 USD Mg−1)
Break-Even Price
($USD Mg−1 Green Biomass)
Stem MAI,
(Mg ha−1 year−1)
Clinton
A
Clinton
B
WilliamsdaleClinton
A
Clinton
B
WilliamsdaleClinton
A
Clinton
B
WilliamsdaleClinton
A
Clinton
B
WilliamsdaleClinton
A
Clinton
B
Williamsdale
2500
Trees
ha−1
0
(kg N ha−1)
‘140’
‘185’
‘230’
‘356’
($1300)
($1686)
($1702)
($1547)
($1509)
($1810)
($1681)
($1343)
($1838)
($2123)
($2032)
($1270)
38.0
57.8
59.7
47.1
48.3
106.7
65.9
40.7
58.9
191.8
102.3
35.4
$33
($1630)
($1677)
($1240)
($1195)
($2045)
($1679)
($728)
($1939)
($2651)
($2425)
($520)
-
37.6
38.4
32.6
32.9
59.2
40.8
29.4
40.5
110.2
63.3
28.2
25.3
12.0
11.4
16.8
15.4
5.0
9.5
21.2
11.3
2.5
5.3
28.7
113
(kg N ha−1)
‘140’
‘185’
‘230’
‘356’
($1485)
($1741)
($1748)
($1446)
($1431)
($1813)
($1617)
($1244)
($1004)
($2139)
($1684)
($202)
43.4
62.2
63.1
41.9
43.4
97.0
55.3
37.5
32.0
181.7
46.6
27.3
($1023)
($1744)
($1763)
($912)
($935)
($2010)
($1458)
($408)
$181
($2659)
($1520)
$2185
30.9
39.5
39.9
30.2
30.6
54.7
36.0
28.0
-
104.7
34.0
23.9
19.7
10.9
10.6
21.1
18.9
5.7
12.5
25.3
37.5
2.7
16.7
62.1
225
(kg N ha−1)
‘140’
‘185’
‘230’
‘356’
($1372)
($1862)
($1767)
($1589)
($1598)
($1727)
($1724)
($1694)
($606)
($2139)
($1849)
($860)
39.3
85.3
64.6
48.1
52.9
69.1
68.5
63.6
29.1
160.3
57.1
30.7
($684)
($2067)
($1799)
($1298)
($1386)
($1750)
($1742)
($1658)
$1,195
($2,636)
($1,913)
$559
29.0
50.1
40.6
33.0
34.9
42.1
41.9
39.7
-
93.4
39.5
25.7
24.0
7.1
10.3
16.5
13.5
9.0
9.1
10.2
50.1
3.2
12.0
42.3
5000
Trees
ha−1
0
(kg N ha−1)
‘140’
‘185’
‘230’
‘356’
($1963)
($2623)
($2630)
($2292)
($2085)
($2543)
($2422)
($2329)
($1629
($2998)
($2746)
($1839)
39.3
80.8
82.3
49.2
43.6
78.6
62.1
54.6
33.5
220.9
76.0
35.8
($772)
($2634)
($2655)
($1702)
($1182)
($2473)
($2132)
($1869)
($69)
($3492)
($2861)
($595)
28.4
46.2
46.8
32.6
30.0
44.8
37.8
34.6
-
118.4
47.5
27.8
33.3
10.5
10.2
21.9
26.4
10.6
14.7
18.0
44.9
3.0
10.7
38.5
113
(kg N ha−1)
‘140’
‘185’
‘230’
‘356’
($1969)
($2545)
($2349)
($1806)
($1930)
($2559)
($2379)
($2337)
($561)
($2977)
($2655)
($1601)
38.9
64.8
50.6
36.3
39.1
75.7
55.9
53.2
27.9
147.9
61.6
33.1
($723)
($2348)
($1796)
($263)
($676)
($2451)
($1942)
($1825)
$2656
($3385)
($2579)
$57
28.2
39.3
33.2
27.1
28.1
43.5
35.2
34.0
-
82.5
40.4
-
34.3
14.4
21.2
40.0
33.0
11.3
17.5
18.9
78.8
4.7
14.6
46.9
225
(kg N ha−1)
‘140’
‘185’
‘230’
‘356’
($2257)
($2565)
($2631)
($2285)
($2131)
($2535)
($2447)
($1982)
($1670)
($3033)
($2705)
($922)
46.0
64.7
73.0
47.0
43.7
69.1
59.7
39.9
33.6
178.8
64.2
29.1
($1493)
($2360)
($2547)
($1571)
($1201)
($2341)
($2090)
($781)
($75)
($3484)
($2664)
$1795
31.2
39.2
42.8
31.6
30.0
40.7
36.7
28.5
-
97.5
41.6
-
25.2
14.6
12.3
24.3
26.9
12.9
16.0
32.0
45.6
3.9
13.9
68.6
Publisher’s Note: MDPI stays neutral with regard to jurisdictional claims in published maps and institutional affiliations.

