Article

Genetic Evaluation and Combined Selection for the Simultaneous Improvement of Growth and Wood Properties in Catalpa bungei Clones

1
State Key Laboratory of Tree Genetics and Breeding, Key Laboratory of Tree Breeding and Cultivation of State Forestry Administration, National Innovation Alliance of Catalpa bungei, Research Institute of Forestry, Chinese Academy of Forestry, Beijing 100093, China
2
Xiaolongshan Research Institute of Forest Science and Technology, Tianshui 741506, China
3
State Key Laboratory of Tree Genetics and Breeding, Northeast Forestry University, Harbin 150040, China
*
Author to whom correspondence should be addressed.
Forests 2021, 12(7), 868; https://doi.org/10.3390/f12070868
Submission received: 8 May 2021 / Revised: 19 June 2021 / Accepted: 23 June 2021 / Published: 30 June 2021
(This article belongs to the Section Genetics and Molecular Biology)

Abstract

:
Catalpa bungei is an important timber tree. Improvements in growth and wood quality are important goals of C. bungei breeding, and it is necessary to understand the genetic parameters of specific target traits and genetic correlation between growth traits and wood properties for tree breeding. In this study, the genetic parameters of height, diameter at breast height (DBH) and wood properties were estimated and genetic and phenotypic correlations between growth traits and wood properties were evaluated in C. bungei. Finally, different selection scenarios were used to evaluate and select optimal clones. The results showed that there were significant differences in growth and wood properties among clones. The wood hardness (0.66–0.79), basic density (0.89), air-dried density (0.89) and compression strength parallel to the grain of wood (CSP) (0.84) had high repeatability. The variance component proportions indicated that the variation in wood properties came mainly from different genotypes (clones) rather than from different individuals of the same clone. The DBH showed a significant negative genetic correlation with the hardness of radial section (HRS) (−643), basic density (−0.531) and air-dry density (−0.495). This unfavorable relationship makes it difficult to improve growth and wood quality simultaneously in C. bungei. We selected the optimal clones under different scenarios, and we obtained 7.75–9.06% genetic gains for growth in the scenario in which height and DBH were the target traits. Genetic gains of 7.43–14.94% were obtained for wood properties by selecting optimal clones in the scenario in which wood properties were the target traits. Approximately 5% and 4% genetic gains were obtained for growth and wood properties, respectively, for the combined selection. This study provides new insights into the genetic improvement of wood quality in C. bungei.

1. Introduction

Catalpa bungei is a multipurpose tree that is native to China. Its straight stem and showy flowers make it a popular ornamental tree. In addition, the wood of C. bungei is hard and dense with superior physical properties, making it suitable for construction and furniture. Due to these characteristics, C. bungei is a valuable and economically important timber tree in China [1]. A breeding objective is a combination of traits that a breeder wishes to improve, and it usually involves certain properties of economic importance [2]. Most of the genetic improvements for tree species focus on increasing growth rates, achieving higher wood yields and enhancing wood properties and quality [3,4,5]. Moreover, rapid growth has always been the main improvement aim for trees for which the breeding work started late or developed slowly. C. bungei breeding began in the 1980s, and its genetic improvement has been emphasized in growth rates. Although its development process has been relatively slow, several rapidly growing clones have been identified [6,7,8]. However, with socioeconomic development, the market demand for high-quality timber is increasing. Therefore, in addition to increasing the growth rate of C. bungei, improving wood quality has become an urgent goal for genetic improvement.
Wood processing techniques and the economic value of wood production are highly related to wood properties. For example, wood density, which has been shown to have high heritability or repeatability [9,10,11], affects timber strength, machinability and hardness [12]. Thus, wood density has been considered the most important trait for genetic improvement. However, wood processing is a complex process. The standard for wood quality is not a single index. In addition to wood density, the compressive resistance, microfiber angle, modulus of elasticity and dry shrinkage are all important for evaluating wood quality. Therefore, the best breeding strategy for wood quality should be combined with specific breeding objectives to select suitable wood traits for improvement.
In tree breeding programs, knowledge of the relationship between target traits is important. In some breeding programs, several traits need to be improved simultaneously. When a negative genetic correlation exists between two target traits, the simultaneous improvement of both traits becomes difficult [9]. Many studies have found negative correlations between tree growth and wood quality traits. Zhou et al. [13] found highly unfavorable genetic correlations between tree diameter and wood density (−0.479), the clearwood modulus of elasticity (−0.506) and the modulus of elasticity using time-of-flight (MOEtof) (−0.382) in Scots pine (Pinus sylvestris). Genetic relationship analysis implied that the clearest adverse effect following selection for tree volume would reduce wood density in Picea abies [4]. However, not all tree species exhibit negative genetic correlations between growth traits and wood quality traits. A highly positive genetic correlation between the height and the average wood density of the outermost five rings at breast height (RD5) (0.912) was detected in larch, and the correlations of height with the area-weighted average wood density of the entire disk at breast height (AWD) were also positive (0.804). Similarly, highly positive genetic correlations between diameter at breast height (DBH) and RD5 (0.826) and AWD (0.757) were found in Larix kaempferi [9]. Among hardwood species, a weak genetic correlation of tree height and DBH with wood density was detected in hybrid poplar clones [11]. However, highly negative genetic correlations of height with basic wood density (BD) (−0.59), modulus of elasticity (−0.31) and modulus of rupture (−0.65) were detected in eucalyptus [14]. DBH also has a negative genetic correlation with BD (−0.58) in certain tree species [15]. The complex correlation between tree growth and wood properties has created great difficulties for tree breeding. For example, increasing the growth rate alone in the breeding process reduces the wood density of Pinus radiata [16]. Genetic correlations and their correlated responses indicate that breeding for a 1% increase in diameter would confer an approximately 2% decrease in the stiffness of lodgepole pine [17]. Therefore, tree breeders must understand the degree of genetic correlation between traits. In a multitrait and multiobjective breeding strategy, Li and Wu [18] estimated the genetic parameters and correlations of the traits of Pinus radiata, and their results suggested that DBH and wood density should be improved through selection at different ages. In addition, some tree breeders use comprehensive assessment and index selection methods to improve growth and wood properties in Pinus [5,19]. These studies emphasize the importance of genetic parameter assessment in tree selection. An appropriate breeding strategy can be generated only with a sufficient understanding of the genetic characteristics of the species and the cultivation environment.
The genetic control of wood properties and the relationship between wood properties and growth have not been investigated in C. bungei clones. Therefore, the aims of this study were (I) to estimate the genetic variation and repeatability of the wood properties of C. bungei, e.g., the wood hardness, strength and density; (II) to evaluate the genetic and phenotypic correlations of wood properties with growth traits; and (III) to evaluate possible genetic gains that could be obtained using different selection scenarios.

2. Materials and Methods

2.1. Plant Material and Experimental Site

The C. bungei clone trials were performed in Tianshui city, Gansu Province, Northwest China (105°54′ E, 34°28′ N). The area is part of the semiarid and semihumid climate transition zone. The mean annual precipitation is 600–800 mm, and the mean annual temperature is 10.7 °C. The mean extreme high temperature is 39 °C, and the mean extreme low temperature is −19.2 °C. The average frost-free period is 190 days.
The test plantation containing 19 C. bungei clones was using 1-year-old grafted seedlings at the beginning of 2006. The 19 clones came from different individuals with excellent growth performance from different Catalpa bungei hybrids. Detailed information about the 19 clones is provided in Table 1. A completely randomized block design was adopted for the layout of the test plantation, including 4 blocks with 2 individuals per block. The total number of ramets per clone was 8, and the total number of individuals was 152. The planting space was 2 m × 2 m.

2.2. Growth Traits

The height and DBH of each tree were measured at the end of the year. The tree height was measured using a tree height measurement device, and the DBH was measured at 1.3 m above the ground using a diameter tape.

2.3. Wood Sampling and Wood Property Measurement

Three individuals exhibiting consistent growth were selected from the ramets of each clone. The trees were cut down at 1.3 m above the ground to obtain wood disk samples. Thirty-four samples from each individual were prepared for the measurements of wood properties.

2.3.1. Wood Hardness

Seventeen of the wood samples (70 mm × 50 mm × 50 mm) from each individual within the clone were used for the wood hardness measurements, including the hardness of transverse section (HES), hardness of tangential section (HTS) and hardness of radial section (HRS). Each sample was tested for tangential, radial and transverse sections. Each sample was placed on a universal mechanical testing machine (RGM-4100, Reger, Shenzhen, China). Then, a steel indenter was pressed into the test surface of the sample at a speed of 3~6 mm per minute until the depth of the indentation was equal to the radius of the hemispherical tip (5.64 mm). See the standard [20] for the detailed steps. After the test, a wood sample of approximately 20 mm × 20 mm × 20 mm was cut out immediately at the location of the indentation on the sample to measure the moisture content. The wood hardness was calculated with an assumed 12% moisture content for the sample. The test results for two tangential sections were averaged. The formula for hardness was as follows:
H 12 = K P [ 1 + 0.03 ( W 12 ) ]
H 12 : Wood hardness, N. W: Moisture content of the sample, %. P: Maximum load, N. K: Coefficient of the test, equal to 1.

2.3.2. Wood Density

The BD and air-dry density (ADD) of the samples were measured according to the drainage method [21]. The formula for the BD was as follows:
BD = m 0 V m a x
BD : Basic density, g/cm3. m 0 : Oven-dry mass, g. V m a x : Volume of the sample above the fiber saturation point, cm3.
The ADD was calculated with a 12% moisture content for the sample using the formula:
ADD = m w V w [ 1 0.01 ( 1 K ) ( W 12 ) ]
ADD : Air-dry density, g/cm3. K: Volume shrinkage coefficient, %. W: Moisture content of the sample, %. m w : Mass when the moisture content of the sample is W, g. V w : Volume when the moisture content of the sample is W, mm3.
The formula for the volume shrinkage coefficient was as follows:
K = V w V 0 V 0 W
K: Volume shrinkage coefficient, %. V 0 : Oven-dried volume, mm3. W: Moisture content of the sample, %. V w : Volume when moisture content of the sample is W, mm3.

2.3.3. Compression Strength Parallel to the Grain of the Wood

A universal mechanical testing machine (RGM-4100, Reger, Shenzhen, China) was used to measure the compressive strength parallel to the wood grain (CSP). Thirty-four wood samples (30 mm × 20 mm × 20 mm) per individual of each clone were used for testing. Briefly, each sample was placed in the center of the testing machine, and the load was added at a uniform speed. The sample was broken within 1.5~2.0 min, and the data were recorded accurate to 100 N. After the sample was destroyed, the whole sample was weighed, accurate to 0.001 g, and the moisture content of the sample was measured. See the standard method [22] for the detailed steps. The CSP was calculated with a 12% moisture content for the sample using the formula:
CSP = P m a x b t [ 1 + 0.05 ( W 12 ) ]
CSP : Compression strength parallel to the grain, MPa. P m a x : Breaking load, N. B: Test piece width, mm. t: Test piece length, mm. W: Moisture content of the test piece, %.

2.4. Statistical Analysis

2.4.1. Mixed Linear Models and Genetic Parameters

The significance of the factor effects was tested using the F test with ANOVA in R. The ASReml statistical software package [23] was used to perform variance component estimation for the genetic analysis.
The following linear model was used to analyze the growth traits:
y i j k = μ + C i + B j + C B i j + e i j k
where y i j k is the observed value of an individual tree k of clone i in block j; μ is the overall mean; C i is the genetic effect (random) of clone i; B j is the effect (fixed) of block j; C B i j is the interaction effect (random) of clone i and block j; and e i j k is the random error.
Due to the difference in the quantity and testing methods for the cloned materials, different linear models were used to analyze the genetic parameters of the wood properties. The following linear model was used to analyze the wood traits:
y i j k = μ + C i + I ( C ) i j + e i j k
where y i j k is the observed value of measurement k for individual tree j within clone i; μ is the overall mean; C i is the genetic effect (random) of clone i; I ( C ) i j is the individual effect (random) of tree j within clone i; and e i j k is the random error.
The formula for the phenotypic variation coefficient (PVC) was as follows:
C V = S D X ¯ × 100 %
where S D is the standard deviation of the mean value of a trait and X ¯ is the mean value of the trait.
The formulas for the repeatability of growth traits and wood properties were as follows:
Repeatability for growth traits:
R = σ C 2 σ C 2 + σ B C 2 / B + σ e 2 / B N
where R is the repeatability; σ C 2 is the clone variance; σ B C 2 is the interaction of the block and the clone variance; σ e 2 is the residual variance; B is the number of blocks; and N is the number of individuals.
Repeatability for wood properties:
R = σ C 2 σ C 2 + σ I ( C ) 2 / N + σ e 2 / N n
where R is the repeatability; σ C 2 is the clone variance; σ I ( C ) 2 is the individual variance; σ e 2 is the residual variance; N is the number of individuals; and n is the number of measurements within an individual.
A multitrait analysis was performed to estimate the genetic correlation coefficients using ASReml-R software [23]. The “US” variance-covariance structure was used in ASReml. The formula was as follows:
r x y = C o v ( x ,   y ) σ x 2 · σ y 2
where C o v ( x ,   y ) is the genetic covariance between traits x and y, and σ x 2 and σ y 2 are the genetic variance components for traits x and y, respectively.

2.4.2. The Selection of Optimal Clones under Different Selection Scenarios

The membership function value method (MFV) was used to assess the clones [24]. In this method, first, the corresponding values of each trait within the closed interval (0,1) are given, which is called the “single factor membership degree”, and each trait is individually evaluated. Then, the weighted arithmetic average of each single factor membership degree is determined to calculate the comprehensive membership degree, and the comprehensive evaluation value is obtained. The closer this value is to 0, the lower the performance of the clone, and the closer this value is to 1, the better the performance of the clone. The formula was as follows:
MFV = X X m i n X m a x X m i n
The formula below applies to growth traits, wood density, hardness and compressive strength:
MFV = 1 X X m i n X m a x X m i n
where MFV is the membership function value; X is the observed value of a trait; X m i n is the minimum value in the clones; and X m a x is the maximum value in the clones.
Principal component analysis (PCA) can be used to perform a low-dimensional linear transformation of the data [25]. Thus, principal components (PCs) can be used as indices to comprehensively evaluate tree clones for multiple traits and simplify their selection. PCA was performed using the “prcomp ()” function in R software, and the loading diagram and biplot were drawn in the “corrplot ()” and “fviz_pca_biplot ()” functions of the “factoextra” program package in R software, respectively.
The genetic gain was estimated using the following formula:
Δ G = S × R X ¯ × 100 %
where R is the repeatability; S is the deviation between the selected mean and the general mean; and X ¯ is the general mean.

3. Results

3.1. Variation in Growth Traits and Wood Properties in Catalpa bungei Clones

The variations in growth and wood properties among clones were the basis for our selection (Table 2 and Table 3). The results showed that there were significant differences in height and DBH at the individual clone level. There were also significant effects of block and genotype and environment interactions on height and DBH. The PVCs of height and DBH were 8.73% and 10.23%, respectively (Table 4). The repeatability of height and DBH were both 0.76. Among the clones, clone 1-4 had the highest height (9.46 m) and DBH (11.47 cm), while clone DY had the lowest height (6.45 m) and DBH (7.86 cm).
In addition, the HES, HTS, HRS, CSP, BD and ADD showed significant differences at p < 0.01 among clones and among individuals within clones (Table 2). Table 4 shows that the PVCs of wood hardness, CSP and wood density ranged from 7.95% (CSP) to 16.70% (HRS). The repeatability of the wood properties ranged from 0.66 (HRS) to 0.89 (BD and ADD). It is worth noting that the error of the repeatability of wood hardness (HES, HTS and HRS) was high, so the accuracy of their assessment is questionable. Among the clones, clone 008-1 had the highest HES (4200.94 N), and clone 002-1 had the highest HTS (3625.41 N), HRS (3214.43 N), CSP (46.00 MPa), BD (0.48 g·cm−3) and ADD (0.59 g·cm−3). In contrast, the HTS, HRS, CSP, BD and ADD of clone 001-1 were the lowest of all clones, at 2195.26 N, 1815.62 N, 33.84 MPa, 0.35 g·cm−3 and 0.41 g·cm−3, respectively.

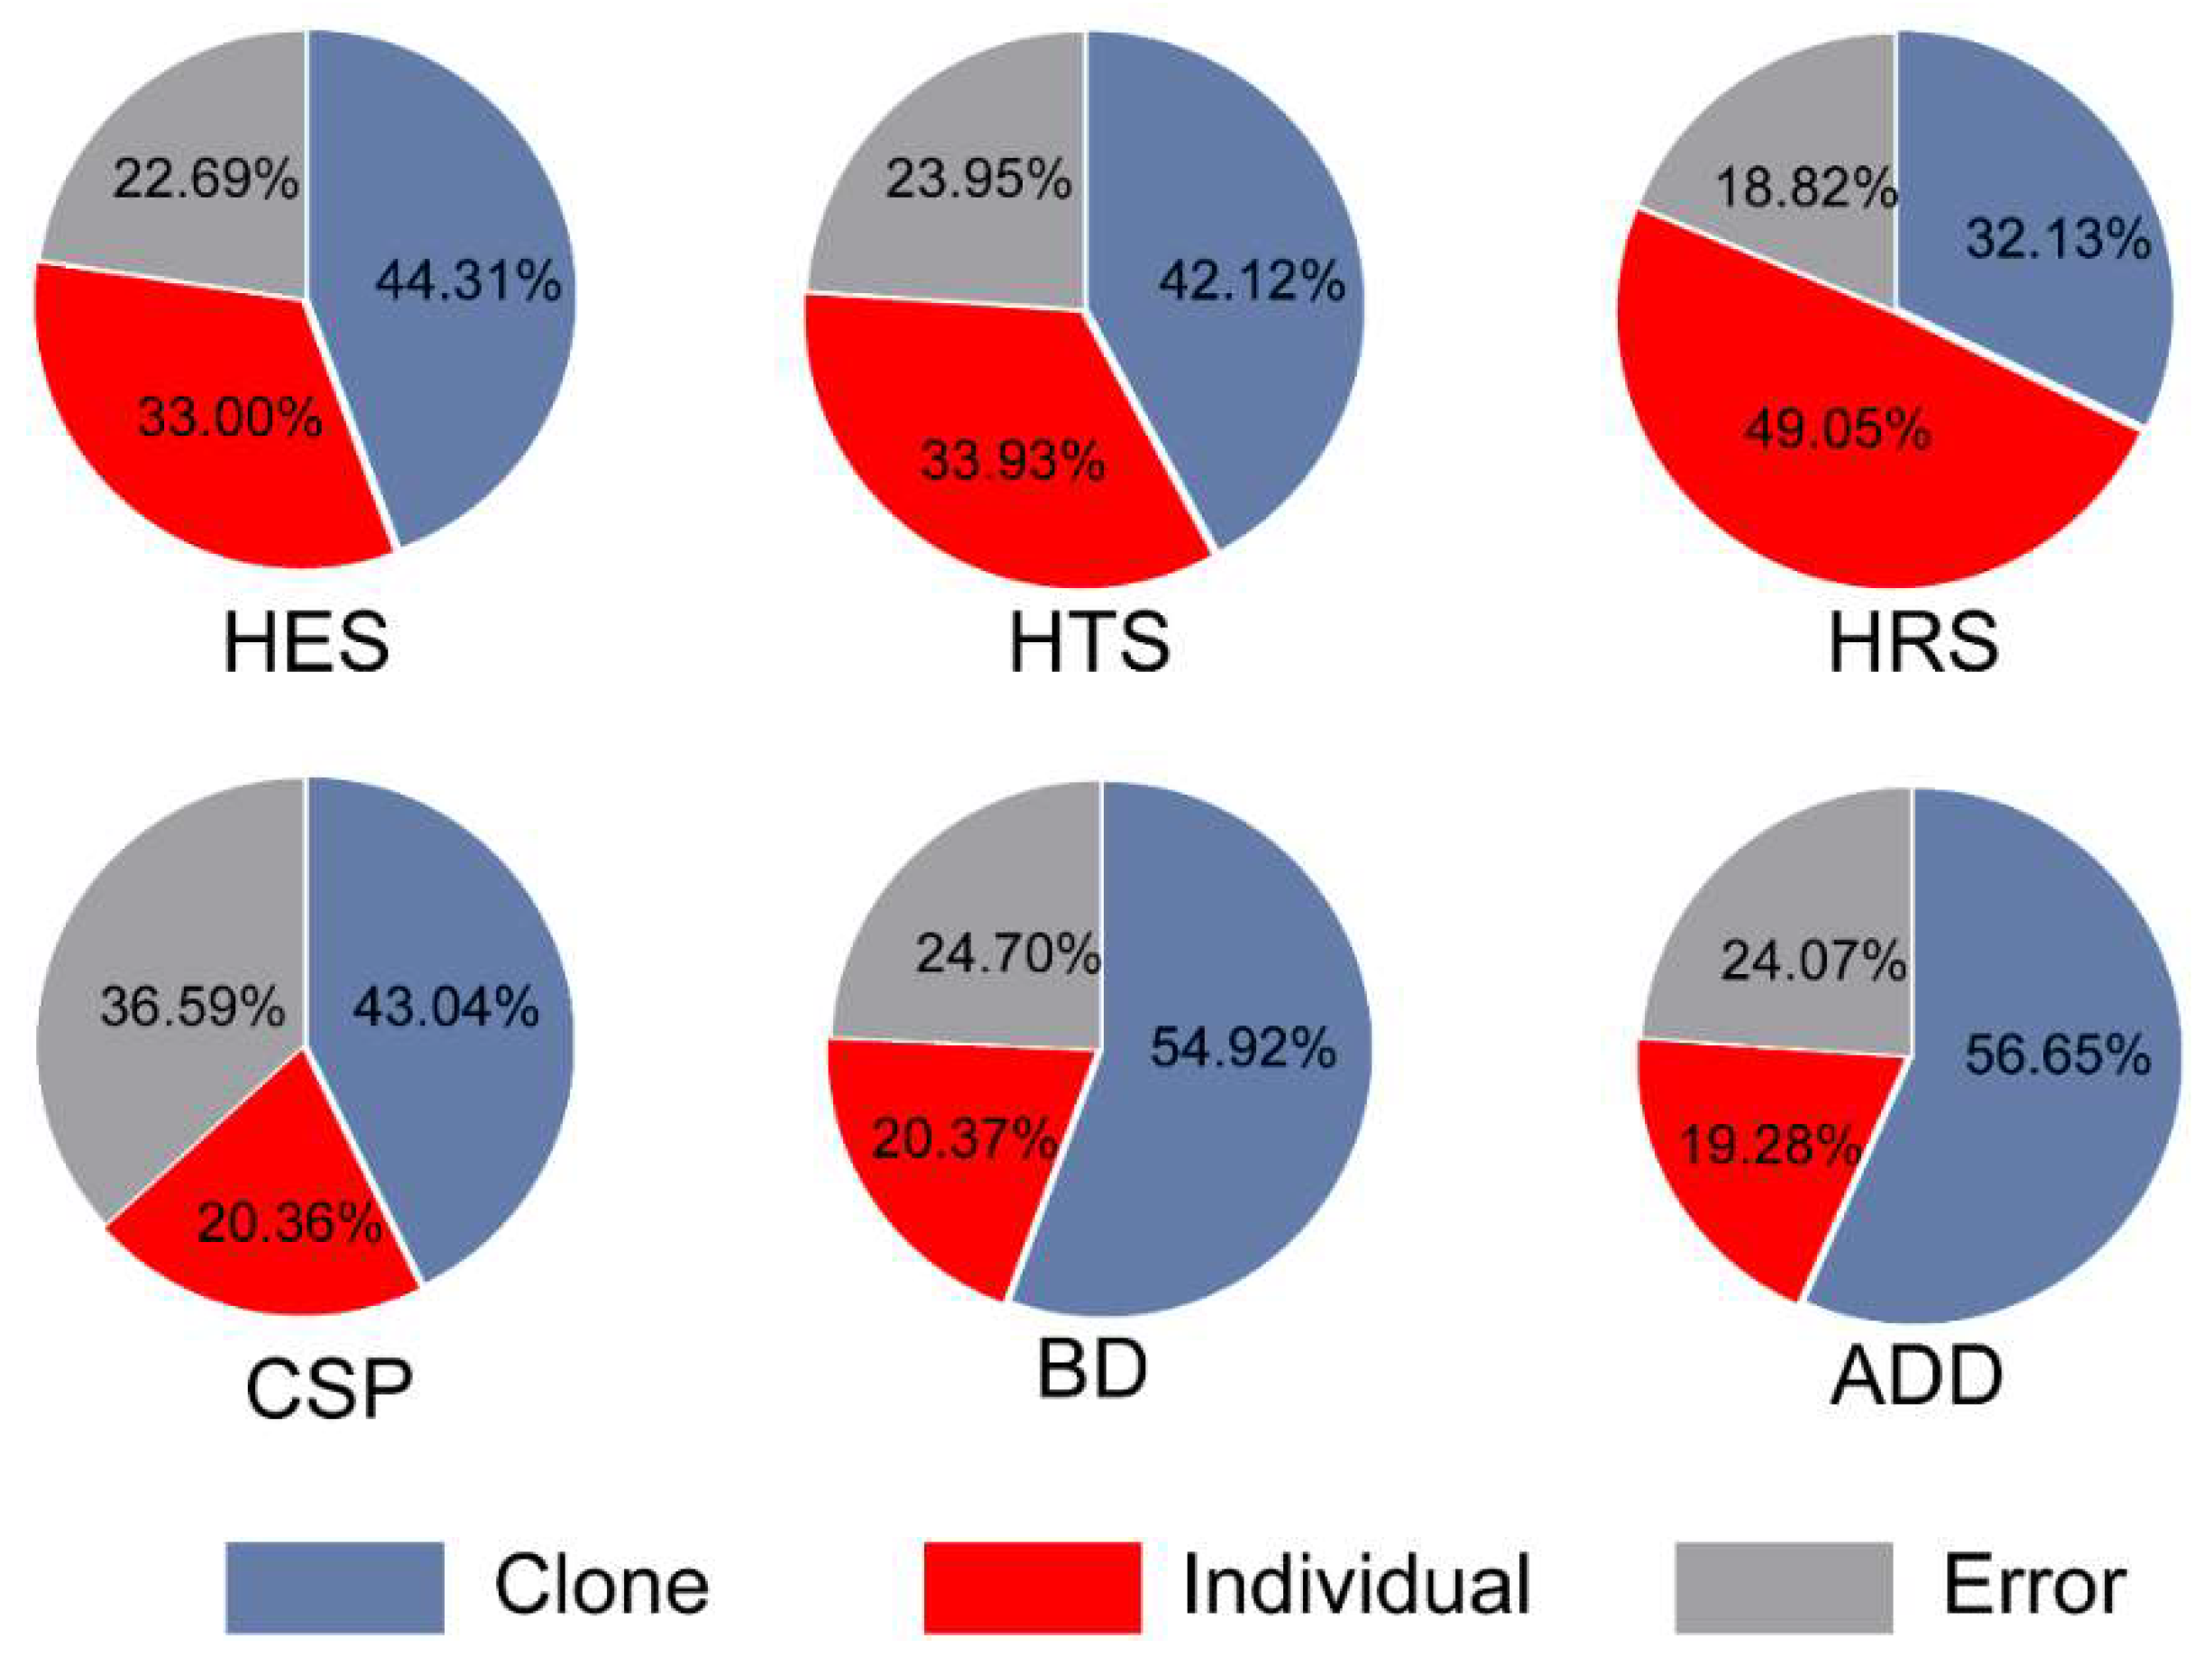
3.2. Variance Component Proportion for Wood Properties

The proportions of the variance in wood properties attributed to the effects of clones and of individuals within clones were estimated to assess their impact on wood properties (Figure 1). Higher proportions of the variance in HES, HTS, CSP, BD and ADD were attributed to clones than to individuals. For BD and ADD, the variance component proportions of clones were as high as 55.61% and 56.62%, respectively. For wood hardness, the variance component proportion of individuals was more than 30%. Furthermore, the individual effect on HTS was 49.05%, which was 16.92% larger than the clone effect. These results indicated that clone and individual effects were the main sources of hardness variation and that individual effects made considerable contributions to the variation in HRS.

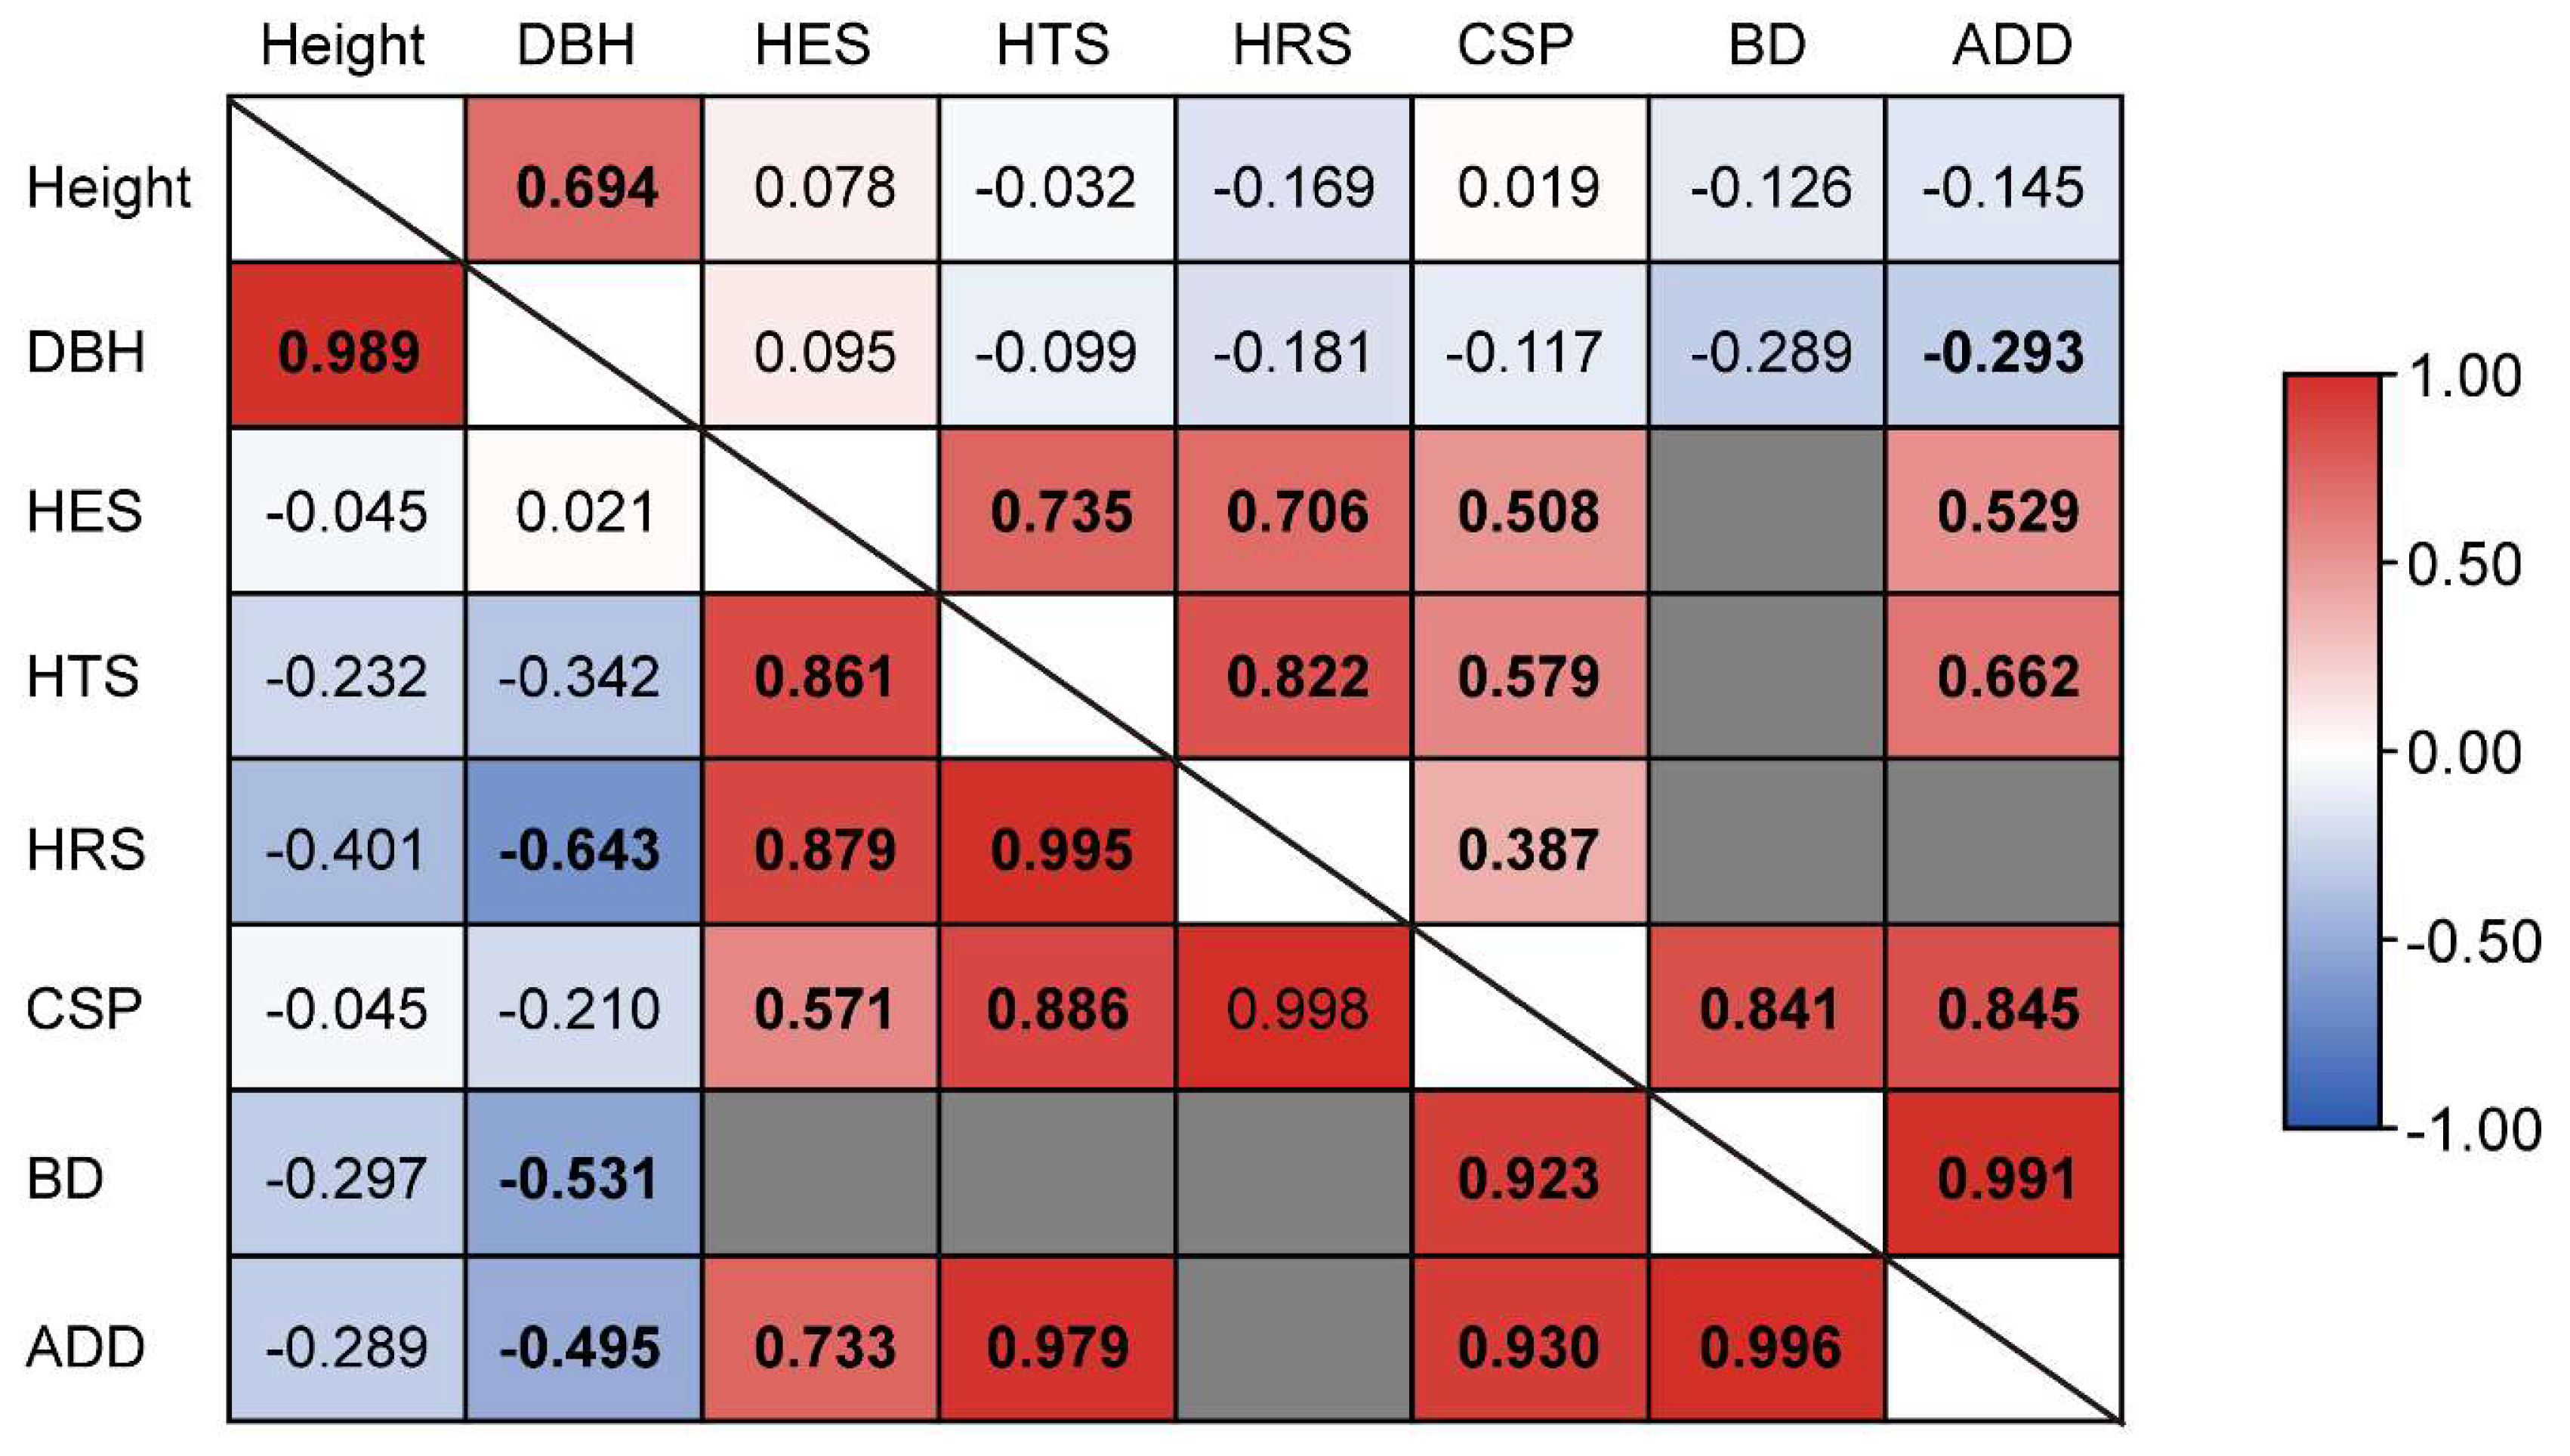
3.3. Genetic and Phenotypic Correlation Analysis

The correlations between traits are important for multitrait and multiobjective breeding. In this study, we estimated the genetic and phenotypic correlations between growth traits and wood properties (Figure 2). The results showed weak phenotypic correlations between height and HES, HTS, HRS, CSP, BD and ADD. The phenotypic correlation coefficient between CSP and wood hardness ranged from 0.387 to 0.579, which indicated a moderate to weak correlation. In contrast, CSP and wood density (BD and ADD) had strongly positive phenotypic correlations, and their correlation coefficients were 0.841 and 0.845, respectively.
A weak negative genetic correlation was observed between height and HTS (−0.232), HRS (−0.401), BD (−0.297) and ADD (−0.289). Similarly, DBH had a significant negative genetic correlation with HRS (−0.643), BD (−0.531) and ADD (−0.495), which was moderate to strong. There were significant strong positive genetic correlations between CSP and HTS (0.886), BD (0.923) and ADD (0.996). ADD also had a strong positive genetic correlation with HES (0.733) and HTS (0.979).

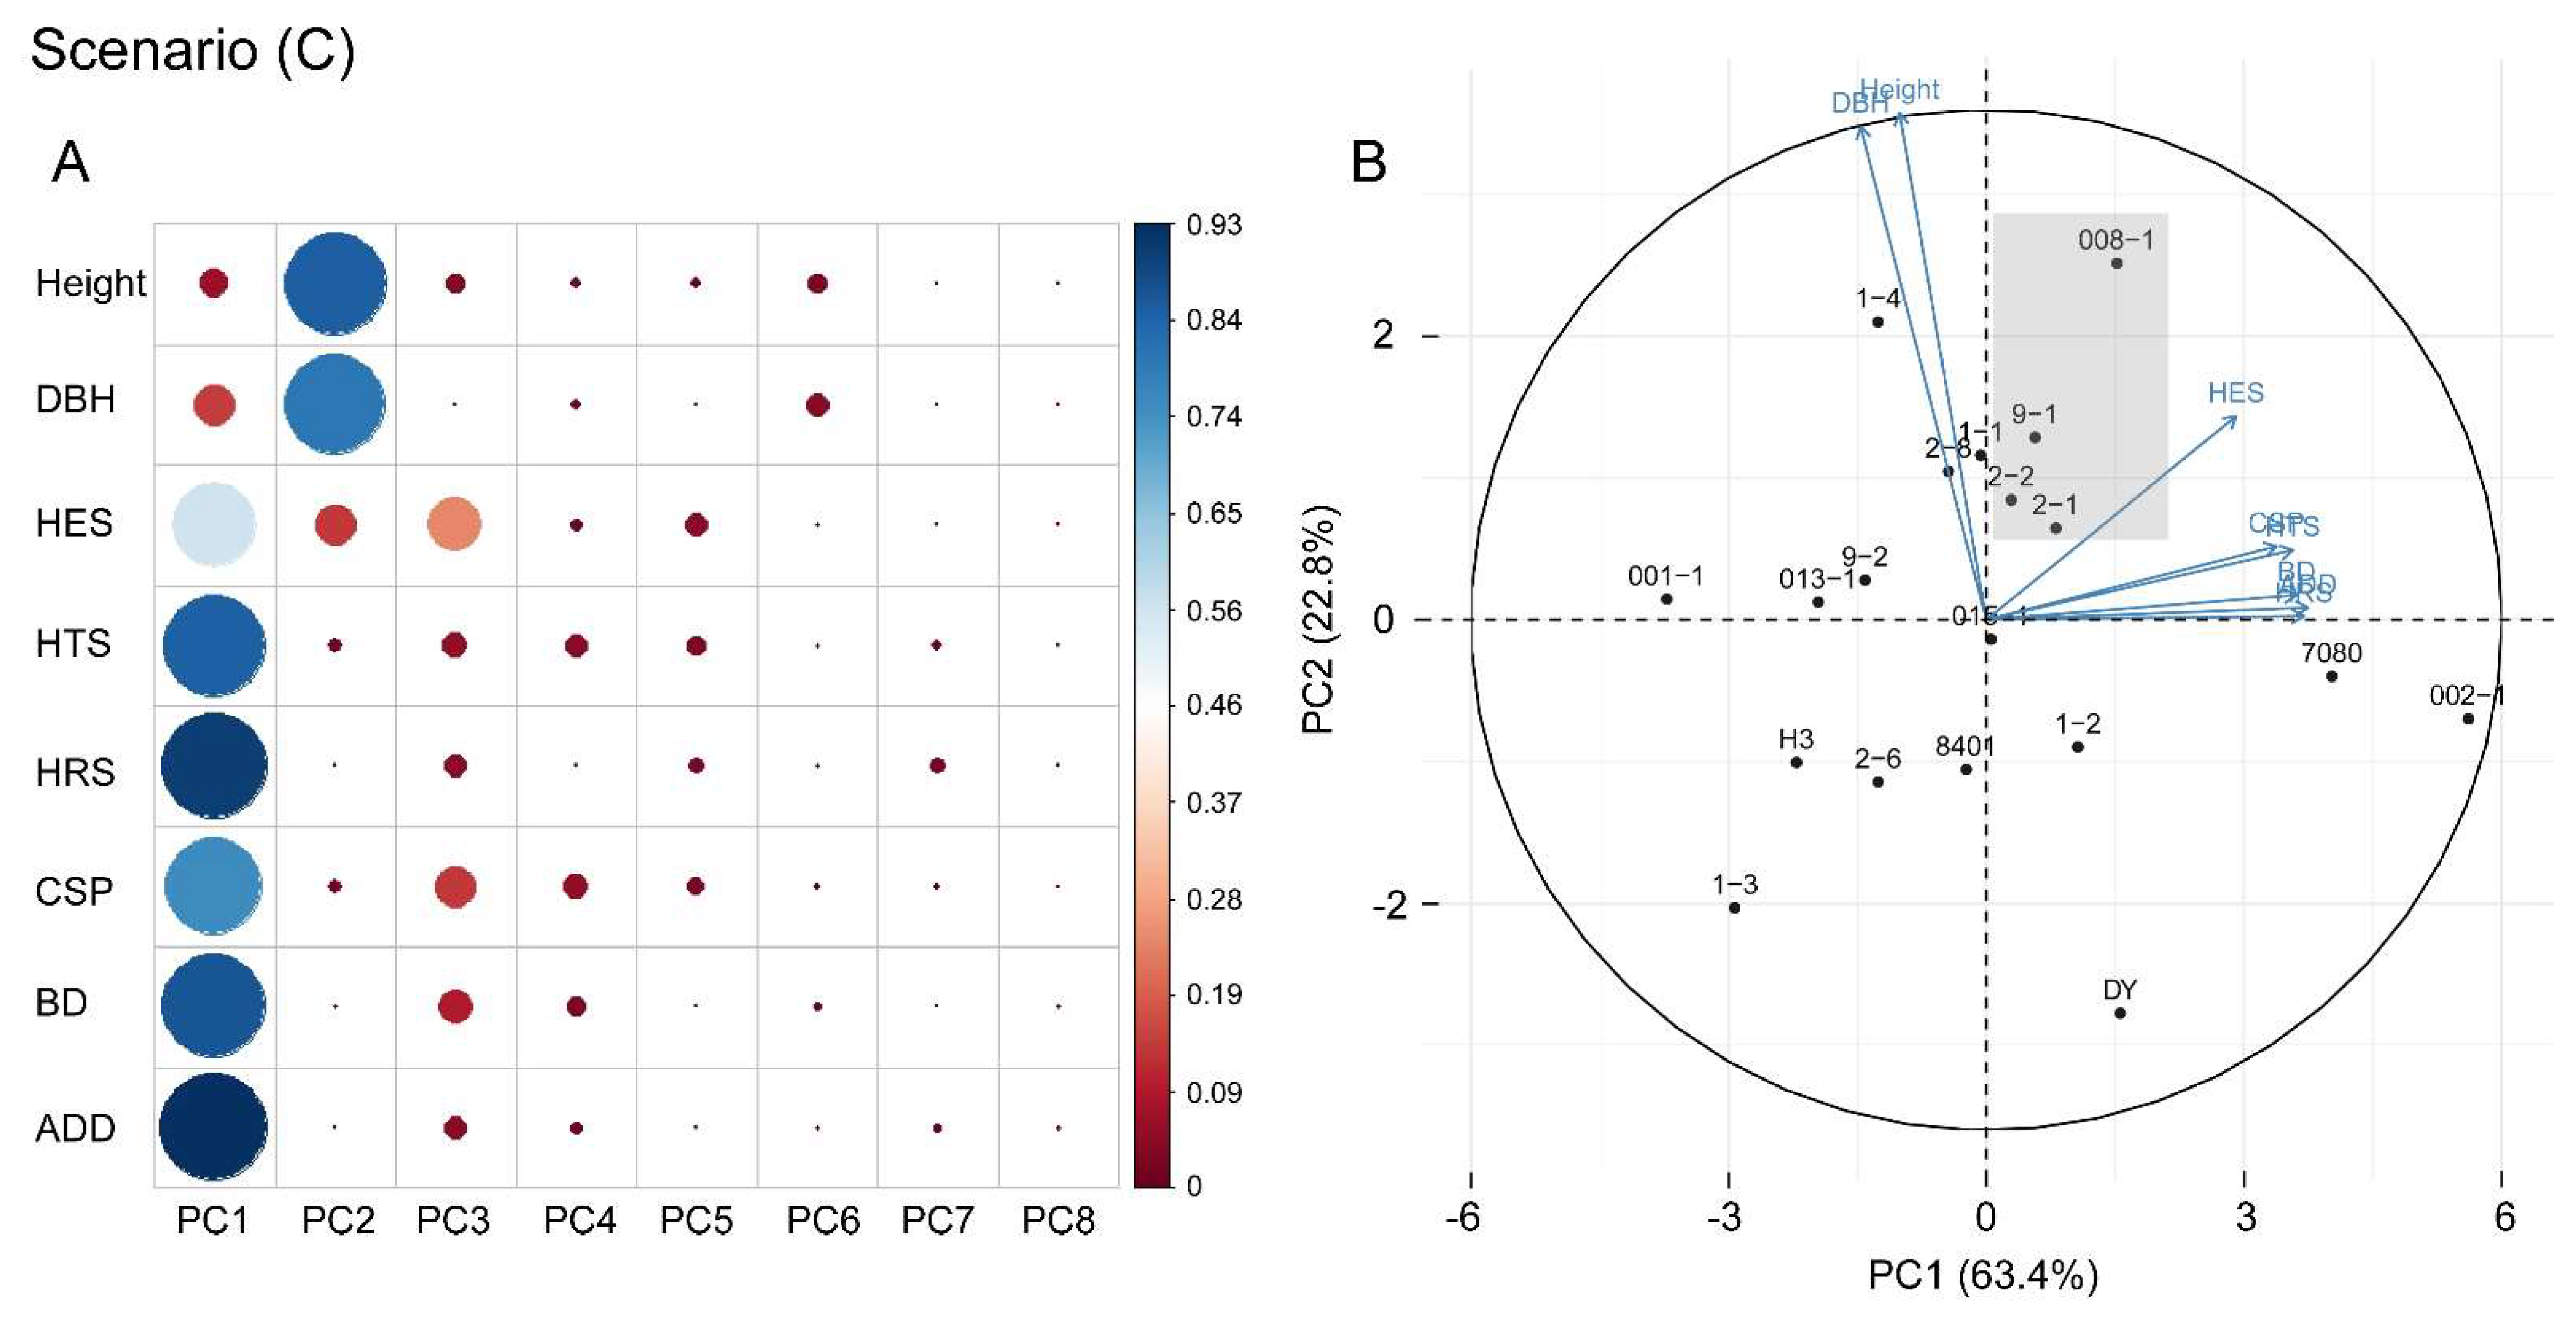
3.4. Selection of Optimal Clones

We used the membership function evaluation method and PCA to evaluate the clones for the selection of optimal clones and to achieve high genetic gains. A 20% intensity was the threshold for selection, i.e., the four best clones were selected as superior clones (Table 5). The selected clones for scenario (A) were clones 1-4, 008-1, 1-1 and 9-1. Among them, 1-4 had the highest scores for all growth traits. The average MFV of clone DY in scenario (A) was 0, indicating that it scored the lowest on growth traits.
Clones 002-1, 7080, 008-1 and DY were selected for scenario (B). Clone 002-1 had the highest score (0.995) of all clones, which meant that the wood properties of clone 002-1 were best in this study under scenario (B). However, in terms of growth traits, 002-1 was ranked second from last. This was similar to the situation for clone DY; the wood properties of DY were good, but its growth traits were poor. Among the clones, 001-1 had the poorest wood properties according to the rankings in scenario (B).
PCA was used to comprehensively evaluate the growth traits and wood properties of the clones. The PCA results showed that the standard deviations of PC1 and PC2 were 2.252 and 1.349, respectively. PC1 and PC2 explained 63.4% and 22.8% of the variation among clones, respectively, and together they explained 86.2% (Supplementary Table S1). Thus, PC1 and PC2 contained most of the information on all traits and were representative of the clone variation. HES, HTS, HRS, CSP, BD and ADD contributed greatly to PC1, while height and DBH contributed to PC2 (Figure 3A). The factors loaded on PC1 contributed positively to wood properties, and the factors loaded on PC2 contributed positively to growth traits (Supplementary Table S2). These results mean that higher values of PC1 and PC2 represent better wood properties and growth, respectively. Biplots were drawn according to the scores for PC1 and PC2 (Figure 3B, Supplementary Table S3). The average scores of PC1 and PC2 were used as threshold values for evaluation. Clones with PC1 and PC2 scores greater than the selected threshold were selected. According to this approach, clones 008-1, 9-1, 2-2 and 2-1 were selected as candidates for genetic gain analysis.

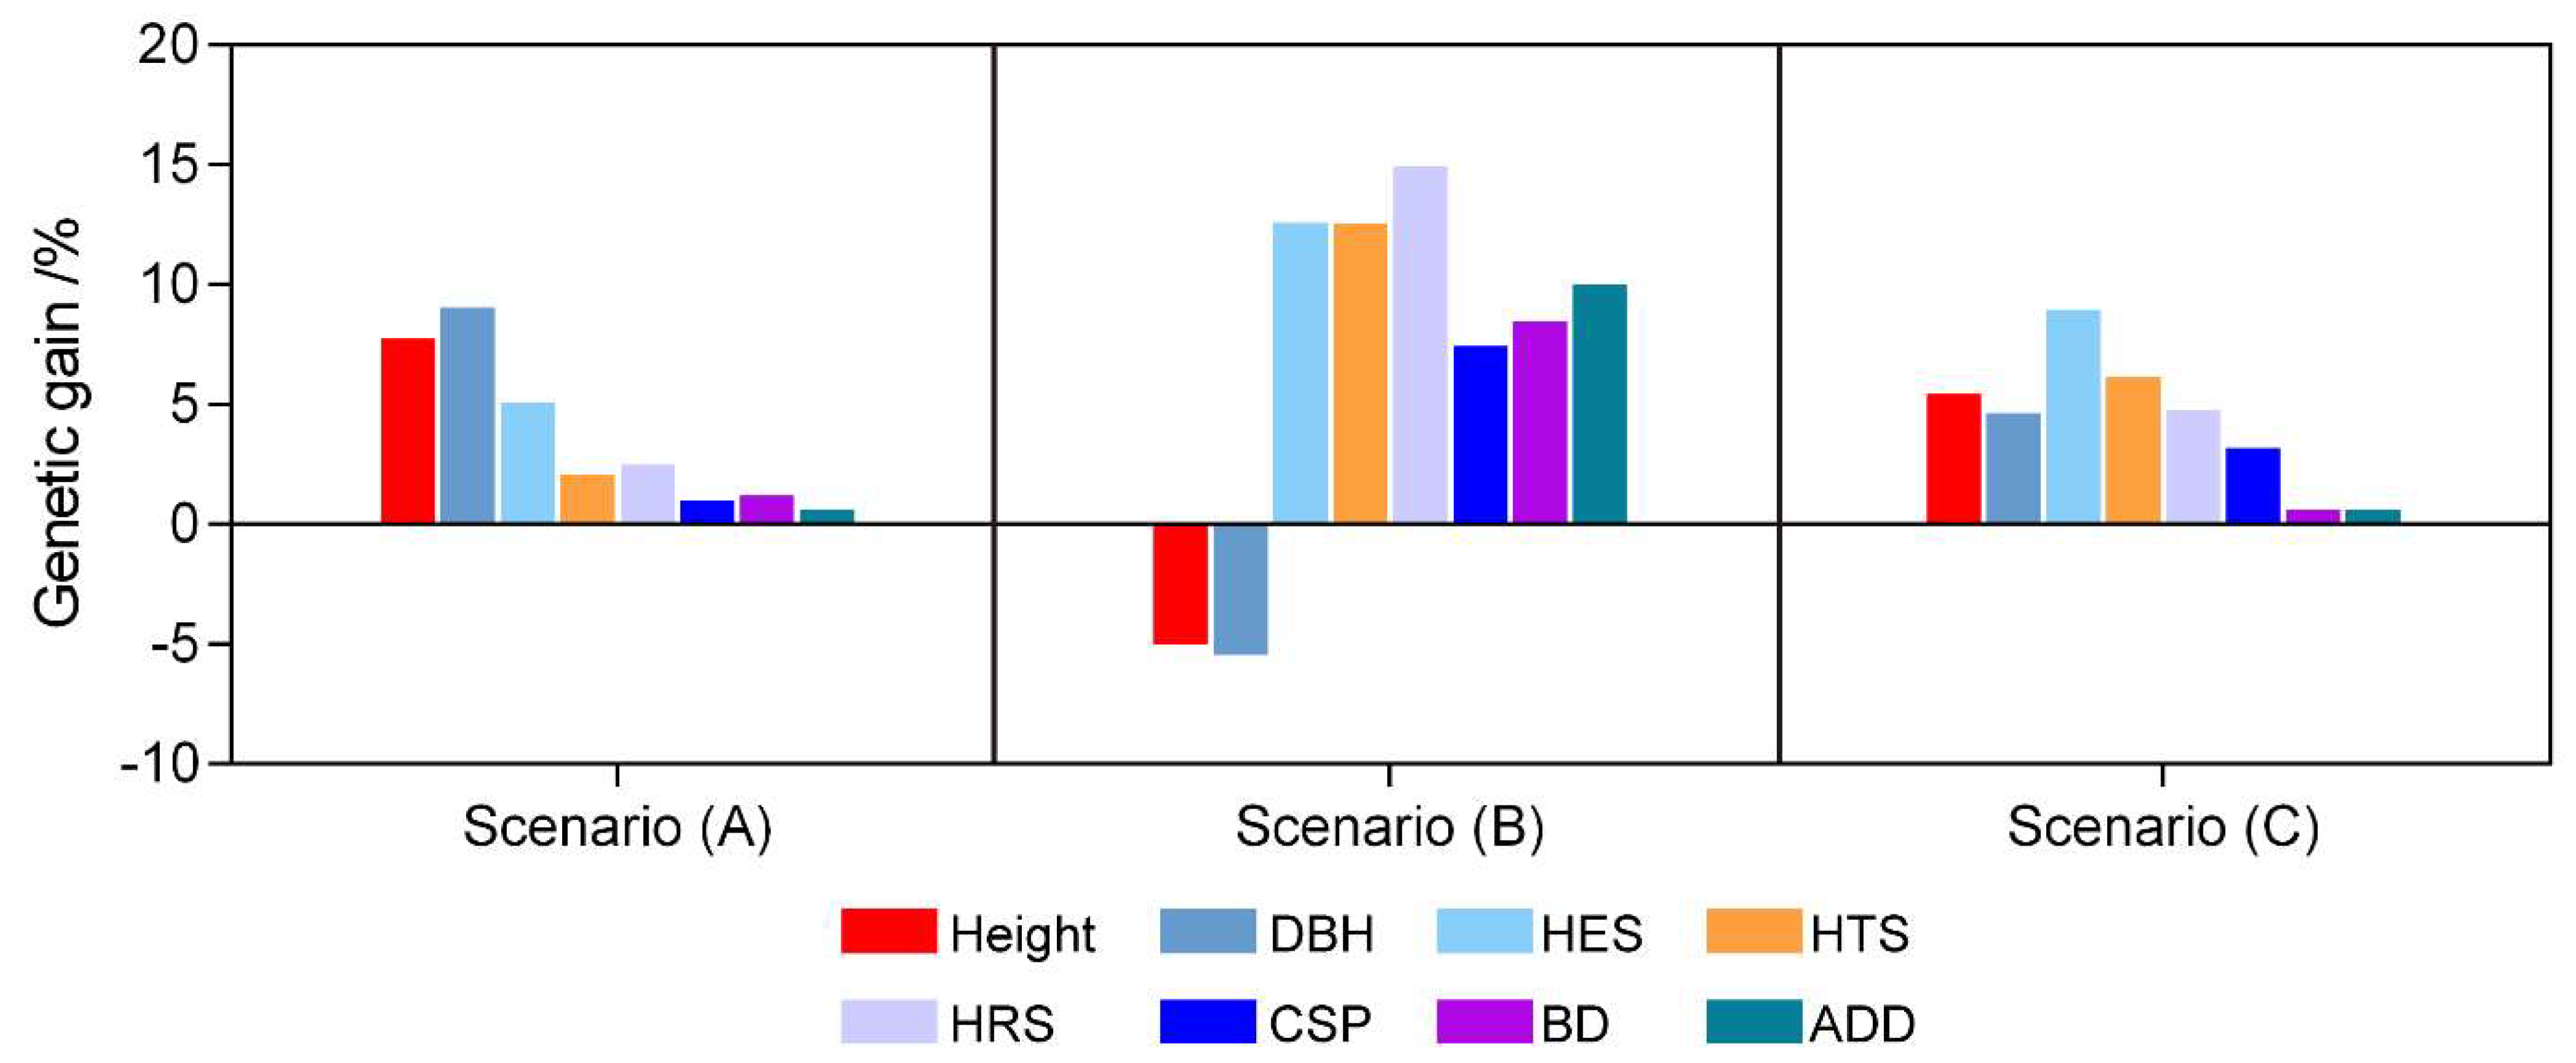
3.5. Genetic Gains under Different Selection Scenarios

We further evaluated the genetic gains in growth traits and wood properties obtained by the three selection methods (Figure 4, Supplementary Table S4). The genetic gains for height and DBH were 7.75% and 9.06% in scenario (A), respectively. However, the genetic gains for wood properties in scenario (A) ranged from 0.62% (ADD) to 5.08% (HES), and the average gain was 2.08%. Under scenario (B), the genetic gains for wood properties ranged from 7.43% (CSP) to 12.58% (HES). In contrast, the genetic gains for height and DBH were −5.03% and −5.45%, respectively. Under scenario (C), the genetic gains for height and DBH were 5.43% and 4.66%, respectively, and the genetic gains for wood properties were approximately 4%. However, the wood density did not improve substantially, and the genetic gains for BD and ADD were only 0.63% and 0.69%, respectively.

4. Discussion

4.1. Genetic Variation and Genetic Parameters

Unlike traditional, seedling-based silviculture, clonal forestry utilizes the most significant genetic gain of individuals in the population for selection, rather than considering the average of the population. Thus, the genetic gains from clonal forestry are significantly higher than those from seeded orchards [26]. Moreover, the genetic backgrounds of individuals within clones are completely consistent, and their traits, especially those related to wood properties, are consistent. Therefore, the use of clones guarantees the quality of the resultant wood products [27]. In this study, clones of C. bungei were taken as the research object. There were highly significant differences in growth traits and wood properties among the clones. A recent study found significant differences in wood anatomical characteristics among C. bungei clones [28], which may be one reason for the differences in wood mechanical properties observed in this study.
The significant differences in wood properties at the clone level lay a theoretical foundation for wood quality improvement. However, it is necessary to understand the genetic parameters of target traits to determine the potential for improvement. In our study, the PVC of growth traits was approximately 10%, and height and DBH had high repeatability (0.76). The PVC of wood density (including BD and ADD) was approximately 8%, and its repeatability (0.89) was higher than that of growth traits. This result agreed with a previous report on other tree species. It was also observed that the heritability or repeatability of wood density was higher than that of growth traits [3,15]. Additional reports have also shown that wood density possesses high heritability or repeatability [9,11,29]. The genetic control of wood density was shown to be stronger than that of wood stiffness and strength [30]; these results are similar to those in our study. These results indicate that wood density variation exhibits high genetic control and is one of the preferred traits for wood quality improvement. In particular, one study found that ADD provided more accuracy and higher explanatory power than BD when used as an evaluation index for wood physical properties [31]. This finding implies that it is important to select suitable traits for genetic evaluation.

4.2. Genetic Correlation between Growth Traits and Wood Properties

Correlations between traits are key factors involved in breeding strategy design. Improving one trait will sometimes weaken another key trait. Wood quality is evaluated based on a variety of traits, including hardness, stiffness, strength and density. Thus, it is important to determine the correlations among wood properties. In this study, we found a significant positive correlation between wood density and other wood properties; this is consistent with the results of Fujimoto [32]. This result showed that using wood density as a target trait for genetic selection would result in strong genetic responses in other wood quality traits.
Unfortunately, most studies have confirmed that wood density has a negative and unfavorable genetic correlation with growth traits [4,33,34,35,36]. This increases the difficulty of simultaneously improving tree growth and wood properties. In this study, BD and ADD showed significant negative genetic correlations with DBH. In addition, the genetic correlations of HTS, HRS and CSP with DBH were also negative. Similarly, Hayatgheibi et al. [19] found that the modulus of elasticity and DBH have strongly negative genetic correlations. These results imply that increasing the growth rate of C. bungei clones would weaken the wood properties, especially the HRS and wood density. In contrast to our results, a positive genetic correlation of wood density with height and a weak correlation of wood density with DBH were found in hybrid eucalyptus clones [37]. A nonsignificant correlation of stem diameter with wood properties was detected in Acacia melanoxylon at the stand level [38]. These results indicated that the different genetic backgrounds of different tree species greatly affect the genetic correlations between tree growth and wood properties. Moreover, several reports in eucalyptus and radiata pine clones found that growth and wood density showed significantly different genetic correlations in different environments [27,39]. These results highlight that improved breeding for multiple traits requires not only the evaluation of genetic parameters but also the consideration of genotype and environment interaction effects. Therefore, it is necessary to perform multisite tests to evaluate the wood properties of C. bungei clones.

4.3. Different Selection Scenario for C. bungei Clones

Breeding strategies have a great influence on the genetic improvement of trees. Breeding scientists have proposed various selection methods. These include index selection [16], the equal weight method [40] and comprehensive assessment [5]. The actual economic weights for breeding target traits in C. bungei have not yet been defined. Thus, in this study, the MFV method and PCA were used to comprehensively evaluate the clones. It was found that the height and DBH of clone 1-4 were the highest among all the clones but that clone 1-4 ranked 13th in terms of wood properties. The clones in the top 20% based on scenario (A) were 1-4, 008-1, 1-1 and 9-1. In this selection scenario, the genetic gains for height and DBH were 7.75% and 9.06%, respectively. However, the genetic gains for wood properties were decreased slightly. Clone 002-1 was the optimal clone with the best wood properties, and it was ranked first in scenario (B). However, it was ranked second to last in scenario (A). The clones selected using wood properties as target traits were clones 002-1, 7080, 008-1 and DY. In this selection scenario, HES, HTS, HRS, CSP, BD and ADD achieved genetic gains of 12.58%, 12.57%, 14.94%, 7.43%, 8.48% and 10.02%, respectively, but tree growth did not improve; its genetic gain was negative. Through PCA, we selected the clones that exhibited good growth and wood properties, which were 008-1, 9-1, 2-1 and 2-2. In this scenario, small genetic gains could be achieved for growth traits, wood hardness and CSP.

5. Conclusions

There were significant differences in tree growth and wood properties among clones of C. bungei. Growth traits and wood properties exhibited high repeatability. Most of the variation in wood properties came from clones rather than from individuals within clones of C. bungei. Negative genetic correlations of DBH with wood hardness, density and CSP were observed. The selection scenario that considered only the improvement of wood properties achieved an approximately 10% genetic gain for wood properties but resulted in negative genetic gains for growth traits. A combined selection for both growth traits and wood properties could obtain positive genetic gains for tree growth and wood properties. Clone 008-1 was the optimal clone, as it had high values for both growth traits and wood properties.

Supplementary Materials

The following are available online at https://www.mdpi.com/article/10.3390/f12070868/s1, Table S1: Principal component statistics of the growth traits and wood properties in 19 Catalpa bungei clones. Table S2: Loading of principal component. Table S3: Principal component scores of 19 clones. Table S4: Genetic gain for different scenario.

Author Contributions

J.W. and W.M. designed the experiments; Y.X., H.Y., G.Y. and J.M. performed the experiments; G.Q. and W.M. carried out manuscript revision; Y.X. wrote the paper. All authors have read and agreed to the published version of the manuscript.

Funding

The work was financially supported by the Fundamental Research Funds of Chinese Academy of Forestry (CAFYBB2020SZ003).

Institutional Review Board Statement

Not applicable.

Informed Consent Statement

Not applicable.

Data Availability Statement

The data presented in this study are available on request from the corresponding author.

Acknowledgments

We thank the research assistant Tianqing Zhu (Chinese Academy of Forestry) for assistance in revising the manuscript.

Conflicts of Interest

The authors declare no conflict of interest.

Abbreviations

ADDAir-dry density
AWDArea-weighted average wood density of the entire disk at breast height
BDBasic density
CSPCompressive strength parallel to the wood grain
DBHDiameter at breast height
HESHardness of transverse section
HRSHardness of radial section
HTSHardness of tangential section
MFVMembership function value method
MOEtofModulus of elasticity using time-off-light
PCAPrincipal component analysis
PVCPhenotypic variation coefficient
RD5Average wood density of outer most five rings at breast height

References

  1. Ma, W.J.; Zhang, S.G.; Wang, J.H.; Zhai, W.J.; Cui, Y.Z.; Wang, Q.X. Timber Physical and Mechanical Properties of New Catalpa bungei Clones. Sci. Silvae Sin. 2013, 49, 126–134. [Google Scholar]
  2. Wei, X.M.; Borralho, N.M.G. Objectives and Selection Criteria for Pulp Production of Eucalyptus urophylla Plantations in South East China. For. Genet. 1999, 6, 181–190. [Google Scholar]
  3. Antony, F.; Schimleck, L.R.; Jordan, L.; Hornsby, B.; Dahlen, J.; Daniels, R.F.; Clark, A.; Apiolaza, L.A.; Huber, D. Growth and Wood Properties of Genetically Improved Loblolly Pine: Propagation Type Comparison and Genetic Parameters. Can. J. For. Res. 2014, 44, 263–272. [Google Scholar] [CrossRef]
  4. Hannrup, B.; Cahalan, C.; Chantre, G.; Grabner, M.; Karlsson, B.; Bayon, I.L.; Jones, G.L.; Müller, U.; Pereira, H.; Rodrigues, J.C.; et al. Genetic Parameters of Growth and Wood Quality Traits in Picea abies. Scand. J. For. Res. 2004, 19, 14–29. [Google Scholar] [CrossRef]
  5. Wang, F.; Zhang, Q.H.; Tian, Y.G.; Yang, S.C.; Wang, H.W.; Wang, L.K.; Li, Y.L.; Zhang, P.; Zhao, X.Y. Comprehensive Assessment of Growth Traits and Wood Properties in half-sib Pinus koraiensis families. Euphytica 2018, 214, 202. [Google Scholar] [CrossRef]
  6. Ma, W.; Zhang, S.; Wang, J.; Zhang, J.; Zhao, K. Growth Traits of One-Year-Old Catalpa bungei Clones in Seedling Stage. For. Res. 2012, 25, 657–663. [Google Scholar]
  7. Xiao, Y.; Ma, W.J.; Lu, N.; Wang, Z.; Wang, N.; Zhai, W.J.; Kong, L.S.; Qu, G.Z.; Wang, Q.X.; Wang, J.H. Genetic Variation of Growth Traits and Genotype-by-Environment Interactions in Clones of Catalpa bungei and Catalpa fargesii f. duclouxii. Forests 2019, 10, 57. [Google Scholar] [CrossRef] [Green Version]
  8. Zhai, W.J.; Ma, W.J.; Wang, Q.X.; Wang, P.; Wang, J.H. Combined Selection of Excellent Families and Plus Trees of Catalpa bungei at Nursery Stage. J. Northwest For. Univ. 2012, 27, 68–71. [Google Scholar]
  9. Fukatsu, E.; Hiraoka, Y.; Matsunaga, K.; Tsubomura, M.; Nakada, R. Genetic Relationship Between Wood Properties and Growth Traits in Larix kaempferi Obtained from a Diallel Mating Test. J. Wood Sci. 2015, 61, 10–18. [Google Scholar] [CrossRef]
  10. Rozenberg, P.; Cahalan, C. Spruce and Wood Quality: Genetic Aspects (A review). Silvae Genet. 1997, 46, 72–82. [Google Scholar]
  11. Zhang, S.Y.; Yu, Q.B.; Chauret, G.; Koubaa, A. Selection for Both Growth and Wood Properties in Hybrid Poplar Clones. For. Sci. 2003, 49, 901–908. [Google Scholar]
  12. Burdon, R.D.; Paul, K.R.; Walker, J.C.F.; Megraw, R.A.; Robert, E.; Cown, D.J. Juvenile Versus Mature Wood: A New Concept, Orthogonal to Corewood Versus Outerwood, with Special Reference to Pinus radiata and P. taeda. For. Sci. 2004, 50, 399–415. [Google Scholar]
  13. Zhou, H.; Anders, F.; Wu, H.X. High Negative Genetic Correlations Between Growth Traits and Wood Properties Suggest Incorporating Multiple Traits Selection Including Economic Weights for The Future Scots pine Breeding Programs. Ann. For. Sci. 2014, 71, 463–472. [Google Scholar]
  14. Li, C.R.; Weng, Q.J.; Chen, J.B.; Li, M.; Zhou, C.P.; Chen, S.K.; Zhou, W.; Guo, D.Q.; Lu, C.X.; Chen, J.C.; et al. Genetic Parameters for Growth and Wood Mechanical Properties in Eucalyptus cloeziana F. Muell. New For. 2016, 48, 33–49. [Google Scholar] [CrossRef]
  15. Apiolaza, L.A.; Raymond, C.A.; Yeo, B.J. Genetic Variation of Physical and Chemical Wood Properties. Silvae Genet. 2005, 54, 4–5. [Google Scholar]
  16. Cotterill, P.P.; Dean, C.A. Successful Tree Breeding with Index Selection; CSIRO Publications: Clayton, Australia, 1990. [Google Scholar]
  17. Hayatgheibi, H.; Fries, A.; Kroon, J.; Wu, H.X. Estimation of Genetic Parameters, Provenance Performances, and Genotype by Environment Interactions for Growth and Stiffness in Lodgepole Pine (Pinus contorta). Scand. J. For. Res. 2018, 34, 1–11. [Google Scholar] [CrossRef]
  18. Li, L.; Wu, H.X. Efficiency of Early Selection for Rotation-aged Growth and Wood Density Traits in Pinus radiata. Can. J. For. Res. 2005, 35, 2019–2029. [Google Scholar] [CrossRef]
  19. Hayatgheibi, H.; Fries, A.; Kroon, J.; Wu, H.X. Genetic Analysis of Fiber-dimension Traits and Combined Selection for Simultaneous Improvement of Growth and Stiffness in Lodgepole Pine (Pinus contorta). Can. J. For. Res. 2019, 49, 500–509. [Google Scholar] [CrossRef]
  20. GB-T 1941–1991, Method of Testing in Hardness of Wood. Beijing, China. 1992. Available online: http://openstd.samr.gov.cn/bzgk/gb/newGbInfo?hcno=AABA7A552DBD6D91817E79D3F4CEE3C2 (accessed on 8 May 2021).
  21. Cheng, J.Q. Science of Wood, 2nd ed.; China Forestry Publishing House: Beijing, China, 1985. [Google Scholar]
  22. GB-T 1935–1991, Method of Testing in Compressive Strength Parallel to Grain of Wood. Beijing, China. 1992. Available online: https://www.codeofchina.com/standard/GBT1935-1991.html (accessed on 8 May 2021).
  23. Gilmour, A.R.; Gogel, B.; Cullis, B.; Thompson, R.; Butler, D. ASReml User Guide Release 3.0; VSN International Ltd.: Hemel Hempstead, UK, 2009. [Google Scholar]
  24. Chen, X.; Min, D.; Yasir, T.A.; Hu, Y.-G. Evaluation of 14 Morphological, Yield-related and Physiological Traits as Indicators of Drought Tolerance in Chinese Winter Bread Wheat Revealed by Analysis of the Membership Function Value of Drought Tolerance (MFVD). Field Crops Res. 2012, 137, 195–201. [Google Scholar] [CrossRef]
  25. Agrawal, A.; Chiu, A.M.; Le, M.; Halperin, E.; Sankararaman, S. Scalable Probabilistic PCA for Large-scale Genetic Variation Data. PLoS Genet. 2020, 16, e1008773. [Google Scholar] [CrossRef]
  26. Isik, F.; Li, B.; Frampton, J.; Goldfarb, B. Efficiency of Seedlings and Rooted Cuttings for Testing and Selection in Pinus taeda. For. Sci. 2004, 50, 44–53. [Google Scholar]
  27. Osorio, L.F.; White, T.L.; Huber, D.A. Age–age and Trait–trait Correlations for Eucalyptus grandis Hill ex Maiden and Their Implications for Optimal Selection Age and Design of Clonal Ttrials. Theor. Appl. Genet. 2003, 106, 735–743. [Google Scholar] [CrossRef]
  28. Liu, Y.M.; Zhou, L.; Zhu, Y.Q.; Liu, S.Q. Anatomical Features and Its Radial Variations among Different Catalpa bungei Clones. Forests 2020, 11, 824. [Google Scholar] [CrossRef]
  29. Wu, S.J.; Xu, J.M.; Li, G.Y.; Risto, V.; Du, Z.H.; Lu, Z.H.; Li, B.Q.; Wang, W. Genotypic Variation in Wood Properties and Growth Traits of Eucalyptus Hybrid Clones in Southern China. New For. 2011, 42, 35–50. [Google Scholar] [CrossRef]
  30. Missanjo, E.; Matsumura, J. Genetic Improvement of Wood Properties in Pinus kesiya Royle ex Gordon for Sawn Timber Production in Malawi. Forests 2016, 7, 253. [Google Scholar] [CrossRef] [Green Version]
  31. Zhu, J.L.; Shi, Y.; Fang, L.Q.; Liu, X.E.; Ji, C.J. Patterns and Determinants of Wood Physical and Mechanical Properties across Major Tree Species in China. Sci. China Life Sci. 2015, 58, 602–612. [Google Scholar] [CrossRef]
  32. Fujimoto, T.; Akutsu, H.; Nei, M.; Kita, K.; Kuromaru, M.; Oda, K. Genetic Variation in Wood Stiffness and Strength Properties of Hybrid Larch (Larix gmelinii var. japonica × L. kaempferi). J. For. Res. 2017, 11, 343–349. [Google Scholar] [CrossRef]
  33. Steffenrem, A.; Kvaalen, H.; H⊘ib⊘, O.A.; Edvardsen, Ø.M.; Skr⊘ppa, T. Genetic Variation of Wood Quality Traits and Relationships with Growth in Picea abies. Scand. J. For. Res. 2009, 24, 15–27. [Google Scholar] [CrossRef]
  34. Gapare, W.J.; Baltunis, B.S.; Ivković, M.; Wu, H.X. Genetic Correlations among Juvenile Wood Quality and Growth Traits and Implications for Selection Strategy in Pinus radiata D. Don. Ann. For. Sci. 2009, 66, 606. [Google Scholar] [CrossRef] [Green Version]
  35. Hayatgheibi, H.; Anders, F.; Kroon, J.; Wu, H.X. Genetic Analysis of Lodgepole Pine (Pinus contorta) Solid-wood Quality Traits. Can. J. For. Res. 2017, 47, 1303–1313. [Google Scholar] [CrossRef] [Green Version]
  36. Wang, T.L.; Aitken, S.N.; Philippe, R.; Carlson, M.R. Selection for Height Growth and Pilodyn Pin Penetration in Lodgepole Pine: Effects on Growth Traits, Wood Properties, and Their Relationships. Can. J. For. Res. 1999, 29, 434–445. [Google Scholar] [CrossRef]
  37. Yang, H.Y.; Weng, Q.J.; Li, F.; Zhou, C.P.; Li, M.; Chen, S.K.; Ji, H.X.; Gan, S.M. Genotypic Variation and Genotype-by-Environment Interactions in Growth and Wood Properties in a Cloned Eucalyptus urophylla × E. tereticornis Family in Southern China. For. Sci. 2018, 64, 225–232. [Google Scholar] [CrossRef]
  38. Bradbury, G.J.; Potts, B.M.; Beadle, C.L. Genetic and Environmental Variation in Wood Properties of Acacia melanoxylon. Ann. For. Sci. 2011, 68, 1363–1373. [Google Scholar] [CrossRef] [Green Version]
  39. Baltunis, B.S.; Gapare, W.J.; Wu, H.X. Genetic Parameters and Genotype by Environment Interaction in Radiata Pine for Growth and Wood Quality Traits in Australia. Silvae Genet. 2010, 59, 2–3. [Google Scholar] [CrossRef] [Green Version]
  40. Wu, H.X.; Ying, C.C. Genetic Parameters and Selection Efficiencies in Resistance to Western Gall Rust, Stalactiform Blister Rust, Needle Cast, and Sequoia Pitch Moth in Lodgepole Pine. For. Sci. 1997, 43, 571–581. [Google Scholar]
Figure 1. Variance component proportions of wood properties.
Forests 12 00868 g001
Figure 2. Genetic (below diagonal) and phenotypic (above diagonal) correlations between growth traits and wood property traits. Bold text indicates statistical significance (p < 0.05). The parameters in the gray area could not be accurately estimated.
Forests 12 00868 g002
Figure 3. Principal component analysis of the growth traits and wood properties of Catalpa bungei clones. (A): The representation of the principal components for the traits. (B): The principal component score biplot based on PC1 and PC2.
Forests 12 00868 g003
Figure 4. Genetic gains under different selection scenarios with a selection intensity of 20%.
Forests 12 00868 g004
Table 1. The sources of the clones.
No.CloneParental CombinationOrigin of CloneStyle of Propagation
11-16-8 × CGQHybridCutting
21-26-8 × CGQHybridCutting
31-36-8 × CGQHybridCutting
41-46-8 × CGQHybridCutting
52-16-7 × CGQHybridCutting
62-26-7 × CGQHybridCutting
72-66-7 × CGQHybridCutting
82-86-7 × CGQHybridCutting
9001-18-5 × CGQHybridCutting
10002-16-8 × CGQHybridCutting
11008-17-8 × 10⁻¹HybridCutting
12013-1\HybridCutting
13015-17-8 × 6-7HybridCutting
149-18-5 × 6-7HybridCutting
159-28-5 × 6-7HybridCutting
167080\Excellent natural individualCutting
178401\Excellent natural individualCutting
18H3\Excellent natural individualCutting
19DY\Excellent natural individualCutting
The pedigree of 013-1 clone was not available.
Table 2. Analysis of variance of growth traits.
TraitsBlockCloneClone × Block
DfMSF-Valuep-ValueDfMSF-Valuep-ValueDfMSF-Valuep-Value
Height34.01118.948<0.0001183.95118.664<0.0001530.9434.455<0.0001
DBH326.10732.520<0.0001188.54410.643<0.0001532.1582.689<0.0001
Df: Degrees of freedom; MS: Mean square.
Table 3. Analysis of variance of wood properties.
TraitsCloneIndividual
DfMSF-Valuep-ValueDfMSF-Valuep-Value
HES187,532,606.004.73<0.0001371,594,249.0023.66<0.0001
HTS187,286,269.004.36<0.0001371,672,308.0023.57<0.0001
HRS187,067,767.002.760.0044372,561,230.0041.87<0.0001
CSP18977.306.69<0.000137146.1019.15<0.0001
BD180.099.23<0.0001380.0124.47<0.0001
ADD180.159.88<0.0001380.0223.82<0.0001
Df: Degrees of freedom; MS: Mean square.
Table 4. Mean, minimum, maximum, phenotypic variation coefficient and repeatability of the traits of the clones.
No.CloneHeight/mDBH/cmHES/NHTS/NHRS/NCSP/MpaBD/g·cm3ADD/g·cm3
11-18.24 (0.70)11.33 (1.30)3407.13 (243.39)2991.43 (301.07)2331.35 (304.70)40.31 (2.81)0.40 (0.02)0.48 (0.02)
21-27.81 (1.11)8.99 (0.94)3051.34 (285.24)3069.31 (415.87)2452.78 (309.65)42.77 (3.41)0.42 (0.03)0.50 (0.03)
31-37.23 (0.84)9.17 (1.22)2754.22 (455.92)2316.38 (273.34)1933.20 (153.20)36.29 (2.42)0.35 (0.02)0.42 (0.03)
41-49.46 (0.12)11.47 (2.52)3070.44 (225.58)2622.69 (272.88)2214.44 (273.42)39.54 (2.57)0.40 (0.03)0.47 (0.03)
52-18.33 (0.37)10.07 (1.31)3681.39 (251.33)3102.43 (495.89)2641.26 (521.04)40.41 (2.34)0.40 (0.01)0.48 (0.02)
62-28.39 (0.94)10.40 (0.97)3453.06 (295.46)3113.52 (319.32)2243.71 (459.89)43.57 (4.16)0.39 (0.01)0.47 (0.02)
72-67.38 (1.42)9.49 (2.40)3371.86 (308.93)2671.43 (298.35)2318.53 (304.20)36.32 (2.48)0.37 (0.03)0.44 (0.03)
82-88.58 (0.59)10.66 (0.65)3480.83 (448.58)2905.65 (227.99)2266.66 (528.99)39.46 (2.27)0.39 (0.03)0.47 (0.03)
9001-18.18 (0.60)10.89 (0.95)3110.21 (520.27)2195.26 (275.43)1815.62 (487.58)33.84 (4.48)0.35 (0.02)0.41 (0.03)
10002-17.34 (1.11)8.34 (0.95)4158.87 (207.47)3625.41 (549.93)3214.43 (539.30)46.00 (3.62)0.48 (0.02)0.59 (0.02)
11008-18.90 (0.19)11.39 (1.47)4200.94 (288.84)2989.05 (274.36)2587.08 (260.32)44.11 (3.54)0.41 (0.02)0.50 (0.03)
12013-18.26 (0.42)10.48 (1.03)2929.75 (519.98)2401.46 (610.65)1908.87 (547.79)40.14 (2.64)0.38 (0.03)0.45 (0.04)
13015-18.05 (0.72)10.05 (0.94)2934.16 (352.56)2694.13 (328.22)2300.77 (343.43)43.41 (3.50)0.41 (0.03)0.49 (0.04)
149-18.68 (0.43)10.62 (0.83)3584.20 (261.50)3068.26 (260.01)2699.06 (331.34)40.93 (2.39)0.40 (0.02)0.47 (0.02)
159-27.95 (0.68)10.70 (1.19)3315.36 (393.89)2835.67 (147.73)2115.97 (353.41)39.36 (4.09)0.36 (0.04)0.44 (0.05)
1670807.20 (0.77)9.54 (1.38)3770.25 (431.34)3530.58 (442.09)3150.36 (475.47)45.69 (4.48)0.45 (0.04)0.54 (0.05)
17017.69 (0.50)9.31 (0.94)2933.40 (253.03)2380.76 (345.48)2116.11 (372.63)42.78 (2.76)0.42 (0.02)0.49 (0.03)
18H37.93 (0.60)9.31 (1.59)2999.67 (366.58)2374.22 (328.37)1900.33 (343.01)37.71 (3.15)0.37 (0.02)0.44 (0.02)
19DY6.45 (1.13)7.86 (1.82)3413.84 (536.56)3084.87 (539.89)2733.25 (584.45)41.36 (2.97)0.40 (0.03)0.49 (0.03)
Mean8.0010.013348.472840.662365.4640.740.400.48
Minimum6.457.862754.222195.261815.6233.840.350.41
Maximum9.4611.474200.943625.413214.4346.000.480.59
Phenotypic variation coefficient 8.73%10.23%12.16%14.03%16.70%7.95%8.21%8.63%
Repeatability0.76 (0.09)0.76 (0.09)0.79 (22.36)0.78 (25.27)0.66 (15.91)0.84 (0.06)0.89 (0.05)0.89 (0.04)
Note: The numbers in parentheses are standard deviations; the bold numbers represent the maxima of traits among clones; the underlined numbers represent the minima of traits among clones.
Table 5. Ranking of the membership functions for the clones under different selection scenarios.
Scenario (A)Scenario (B)
RankCloneAverage Membership Function ValueRankCloneAverage Membership Function Value
11-41.0001002-10.995
2008-10.896270800.841
31-10.7783008-10.646
49-10.7534DY0.533
52-80.74252-10.531
6001-10.70769-10.520
72-20.67471-20.511
8013-10.66482-20.487
99-20.64391-10.439
102-10.61810015-10.415
11015-10.569112-80.408
12H30.4471284010.359
1384010.407131-40.326
141-20.382149-20.296
152-60.380152-60.273
1670800.35716013-10.213
171-30.31117H30.159
18002-10.214181-30.078
19DY0.00019001-10.041
Note: (A) Selection using height and DBH as target traits; (B) Selection using HES, HTS, HRS, CSP, BD and ADD as target traits.
Publisher’s Note: MDPI stays neutral with regard to jurisdictional claims in published maps and institutional affiliations.

