Abstract
Accurate information on tree species is in high demand for forestry management and further investigations on biodiversity and environmental monitoring. Over regional or large areas, distinguishing tree species at high resolutions faces the challenges of a lack of representative features and computational power. A novel methodology was proposed to delineate the explicit spatial distribution of six dominant tree species (Pinus tabulaeformis, Quercus mongolia, Betula spp., Populus spp., Larix spp., and Armeniaca sibirica) and one residual class at 10 m resolution. Their spatial patterns were analyzed over an area covering over 90,000 km2 using the analysis-ready large volume of multisensor imagery within the Google Earth engine (GEE) platform afterwards. Random forest algorithm built into GEE was used together with the 20th and 80th percentiles of multitemporal features extracted from Sentinel-1/2, and topographic features. The composition of tree species in natural forests and plantations at the city and county-level were performed in detail afterwards. The classification achieved a reliable accuracy (77.5% overall accuracy, 0.71 kappa), and the spatial distribution revealed that plantations (Pinus tabulaeformis, Populus spp., Larix spp., and Armeniaca sibirica) outnumber natural forests (Quercus mongolia and Betula spp.) by 6% and were mainly concentrated in the northern and southern regions. Arhorchin had the largest forest area of over 4500 km2, while Hexingten and Aohan ranked first in natural forest and plantation area. Additionally, the class proportion of the number of tree species in Karqin and Ningcheng was more balanced. We suggest focusing more on the suitable areas modeling for tree species using species’ distribution models and environmental factors based on the classification results rather than field survey plots in further studies.
1. Introduction
A clear understanding of the spatial distribution of tree species is crucial for afforestation decision-making, carbon cycle estimation, biodiversity assessment [1,2], and further analysis of tree–environment interactions [3,4]. Conventional forestry inventories, though time-consuming and inefficient, are the established standard. Remote sensing technology has greatly improved efficiency, because it is able to capture forest type composition and forest structure information over larger and inaccessible areas through multiband and multimode sensors compared to conventional field works [1]. This brings possible solutions to the challenging but promising topic of tree species identification.
Remotely sensed imagery data with very high spatial resolution (lower than 5 m or even submeter class) have been used for tree species identification, because they can assist in reducing the impact of the occurrence of mixed pixels on tree species classification [5,6,7,8].This is an inherent characteristic determined by remote sensing imaging mechanisms, especially in heterogeneous forests [9,10]. However, the operational applications of imagery with high resolution are limited due to the high cost. The high similarity of features captured by sensors among trees is another challenge that many studies have tried to address using hyperspectral sensors [11,12]. They provide narrow and contiguous spectral curves capable of characterizing small differences in the biochemical components of vegetation that cannot be captured by multispectral sensors [13,14] as has been demonstrated in many studies [15,16]. However, the processing of hyperspectral imagery is a delicate and time-consuming process due to its large volume [17] and thus requires a professional background to filter out the optimal bands from the large amount of high-correlation bands characteristic of hyperspectral imagery. Besides, it is not freely available though it is useful for tree species classification [18]. With the rapid development of airborne laser scanning (ALS) and unmanned aerial vehicle (UAV), light detection and ranging (LiDAR) data is also used in conjunction with high resolution multispectral and hyperspectral images for tree species mapping and individual trees identification studies, leading to a high accuracy achievement. ALS is the most expensive option, but UAV can only be used for small area application [19,20,21,22,23,24].
Although these data mentioned above possess good potential for species identification, they are practically restricted owing to limited availability. Instead, the cost-free multispectral Landsat and Sentinel-2 images appear to be the best solution to vegetation studies, especially in large regional areas where distribution range of tree species is preferred to individual trees extraction [1]. Landsat data have been useful in many typical studies relevant to vegetation mapping [25,26,27,28]. Increasingly, scholars begin to focus on the identification of coniferous forest, broad-leaved forest, evergreen forest, and deciduous forest without detailed in tree species composition in collaboration with Landsat and other data [29,30]. Moreover, the single-species (e.g., mangrove, bamboo, and eucalyptus) studies were also undertaken based on time-series Landsat imagery [31,32,33,34]. Since the launch of Sentinel-2 mission in 2015, as another freely available data, it has brought new opportunities for fine monitoring of vegetation owing to its unique red-edge band and excellent spatial and temporal resolution [1]. The high potential of red-edge and shortwave infrared (SWIR) bands of Sentinel-2 data for vegetation mapping was confirmed by Immitzer et al. in 2016 when they assessed the capabilities of preoperational (August 2015) Sentinel-2 data for mapping tree species in Austria [35]. In addition, adequate studies have shown that, consistent with Landsat data [36], the time-series metrics of multispectral Sentinel-2 are crucial for tree species classification [37]. A case study realized the identification of complex tree species composition in mountains areas, and proved that using time-series Sentinel-2 features instead of single-date images can improve accuracy by 5–10% [1]. Active imaging radar, because of its all-weather and all-day working advantages, has become one of the important data types for forest monitoring. However, most previous studies focused on the discrimination of broad forest types (i.e., coniferous, broadleaf, evergreen, and deciduous forests) using synthetic aperture radar (SAR) omitting the species level [2].
Regarding the methodology used for tree species identification, the object-based method is generally used for research that uses only extremely high spatial resolution images [38,39] or collaborates with other remotely sensed data [20]. Furthermore, the multitemporal approaches are indispensable to delineate tree species with multispectral images [36,40]. Machine learning algorithms have been commonly applied for tree species classification because of their convenience in coordinating multisource features. Relevant studies have given evidence that among machine learning models, random forest (RF) and support vector machines (SVM) outperformed others [41]. Therefore, the two models have been widely used to map tree species together with imagery data of a multisensor [16,42,43]. The accuracy of the machine learning model is very dependent on feature engineering affected by prior knowledge, while the deep learning model can directly implement end-to-end image classification based on the original image [44]. Recently deep learning algorithms have been applied in studies on tree species classification based on high spatial resolution and hyperspectral images due to their strong capability of feature mining [45,46,47,48,49,50]. However, deep learning models can only be driven by a large number of labeled samples and great computational power, which is the major obstacle to widespread usage [51]. The advent of a wide variety of tools facilitated the geospatial data processing on a large-scale with the development of high-performance computing systems [52], among which GEE has been widely used in vegetation monitoring by remote sensing in large and even global regions with its easy-to-use advantages [53,54,55,56,57].
All the previous studies provided different solutions to tree species mapping, but they focused on the small-scale without detailed analysis of the spatial pattern of tree species composition. This is the first attempt to achieve tree species classification over such a large area with high spatial resolution using GEE. We built on previous studies using RF algorithm, but also proposed a promising methodology for tree species mapping within the GEE cloud-computing platform that is simple and can be scaled for processing larger datasets. The objectives were: (i) to map the targeted seven forest types composed of six tree species (Pinus tabulaeformis, Quercus mongolia, Betula spp., Populus spp., Larix spp., and Armeniaca sibirica) and one remaining category with high resolution (10 m), (ii) to figure out the tree species composition of large regional area on the basis of at different scales, and (iii) to assess the distribution of natural forests versus plantations within GEE.
2. Materials and Methods
2.1. Study Area
Chifeng city, one prefecture-level city, centered at 119°22′58.38″ E, 60°35′07.2″ N extends over 90,000 km2 of ten counties in the southeast of Inner Mongolia in Northeastern China (Figure 1). The topography is complex and diverse with only small mountain flats and alluvial plains along the many rivers. The abundant forest resources and diversity tree species are deciduous-dominated by Quercus mongolia, Betula spp., Populus spp., Larix spp., and Armeniaca sibirica trees, and the evergreen trees are mainly Pinus tabulaeformis.
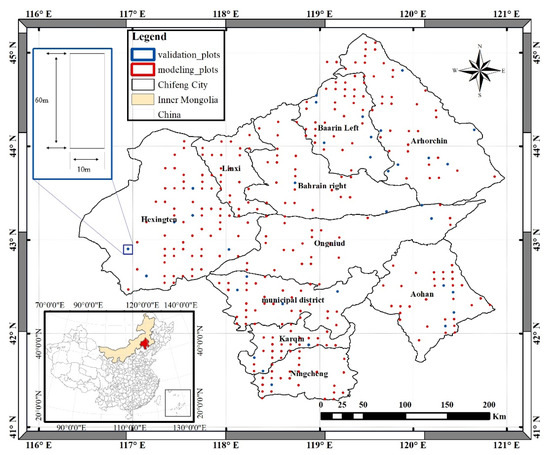
Figure 1.
The study area (the blue plots represent the field measurements and the enlarged one is the shape of the rectangular plots).
2.2. Field Measurements
The forest resources inventory sample plots from the eighth National Forest Inventory (NFI) were used as the ground-truth of the seven forest classes in this study, and a total of 342 rectangular plots (60 × 10 m) surveyed in 2018 were distributed throughout the area (Figure 1). These plots are enabled to function as a reliable modeling and validation data because they have a positioning accuracy higher than 98% and their attribute information is updated every five years during which one full cycle of investigation is completed. Additional measurements of natural forests and plantations polygons from NFI were also used as a mask layer to delineate the study area for natural and plantation forests.
2.3. Satellite Data in the Google Earth Engine
The Google Earth engine (GEE) is a big data cloud platform with high performance computing where a petabyte analysis-ready dataset is freely available and the programming interface is also quite access-friendly [52,53,58]. The study was conducted based on the Sentinel-1A (S1) ground range detected (GRD) scenes, Sentinel-2 (S2) surface reflectance (SR) images, and the shuttle radar topography mission (SRTM) digital elevation model (DEM) dataset of GEE platform. The S1 GRD data was processed by thermal noise removal, radiation correction, and terrain correction, and the 10 m dual band VV+VH and HH+HV of interferometric wide swath (IW) mode was selected for further processing to match the resolution of Sentinel-2. For the S2 SR image geometric, radiation, and atmospheric correction were performed, and the final SR image composites consisted of 10 bands with two spatial resolutions, including 10 m visible and 20 m infrared and red-edge bands. Additionally, cloud mask (QA60) band was also used to help mask clouds in image scenes, leaving only cloudless pixels with good quality. To reflect the temporal characteristics of different tree species in the four seasons of spring, summer, autumn, and winter, the S1 and S2 images of four months (March, June, September, and December) in 2019 were selected. The 30 m SRTM DEM data was used to depict the varied topographic feature, generating aspect and slope variables. Table 1 provided details regarding the parameter of the satellite data in this study.

Table 1.
Details of adopted satellite dataset in the Google Earth engine.
2.4. Methods
2.4.1. Tree Species Classification Overview
Our goal was to leverage the powerful computing ability of the GEE platform for producing a high resolution typical tree species distribution map across Chifeng and figure out the spatial pattern of each tree species. We proposed and implemented the novel methodology within the GEE cloud-computing platform, which was split into four processes including field sample plots processing, mining multitemporal feature, optimizing RF model, and classification and analyzing. Figure 2 is an overview of our workflow described in detail in subsequent sections.
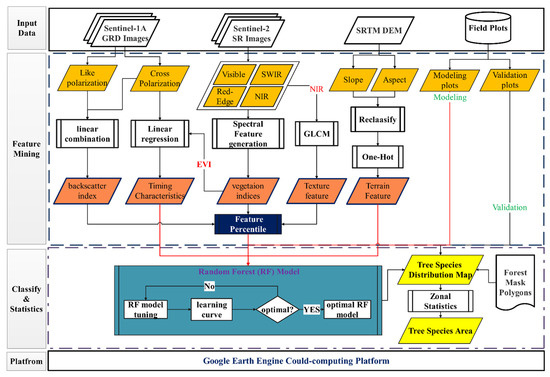
Figure 2.
Workflow overview (GLCM means grey-level co-occurrence matrix).
2.4.2. Field Plots Processing
These plots were not built-in data on the GEE platform. Instead, they were made up of 307 modeling and independent 35 validation plots, of which the spatial distribution was provided in Figure 1. Taking the differentiation of regional scales into account, modeling and verification points are reasonably distributed throughout the study area to better represent the local characteristics of each tree species and reduce the systematic errors in modeling and accuracy assessment. All pixel values extracted fall inside the polygons, not only the geometric center pixels, were used in the subsequent analysis.
2.4.3. Mining Multitemporal Features from SENTINEL-1/2 Imagery
The multitemporal features were all derived from the S1 and S2 products using GEE on line. We imported the S1 and S2 datasets from the data catalog of GEE and filtered out all the images covering the entire study area in March, June, September, and December according to the image acquisition date. Figure 3 provided the visual characteristic changes reflected by S2 surface reflectance images of four seasons. Cloud occlusion seriously affects the application of optical satellite images. Therefore, the cloud-mask operation was performed on each S2 scene afterwards, while GRD images of S1 were further screened leaving only image scenes of the IW mode.
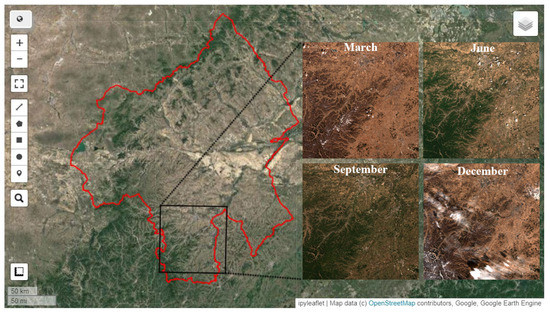
Figure 3.
The enlarged Sentinel-2 images of four months in south Chifeng city (each scene was the image with the least cloudiness in the same area that month and was displayed in true color).
When all four months of S1 and S2 images were analysis-ready for further procedures, we made full use of the advantages of the GEE platform to integrate the three-dimensional (time, space, and spectrum) features mined from these multitemporal images. Specifically, 23 metrics derived from S1 and S2 dataset (Table 2) were divided into seven categories, of which 16 were from SR images and the remains from S1 GRD images (Figure 4). For the S2 spectral index, we calculated eight commonly used indices incorporating the visible, near-infrared, and red-edge bands, including infrared percentage vegetation index (IPVI) [59], transformed normalized difference vegetation index (TNDVI) [60], green normalized difference vegetation index (GNDVI) [61], the second brightness index (BI2) [62], Meris terrestrial chlorophyll index (MTCI) [63], red-edge inflection point index (REIP) [64], inverted red-edge chlorophyll index (IRECI) [64,65], normalized difference vegetation index (NDVI), and enhanced vegetation index (EVI) [66]. To take full use of the high spatial resolution, grey-level co-occurrence matrix (GLCM) was performed on the NIR bands with highest resolution (10 m) and sensitivity to vegetation to generate four texture features (the second moment, contrast, homogeneity, and entropy) of S1 scenes. Furthermore, we addressed the like-polarization (VV/HH) and cross-polarization (VH/HV) yielding four radar indices (division, difference, amplitude, and normalization). Finally, we applied linear regression on the EVI and VH variables to capture the gradient of spectral and radar back scatter over time in one month as well.

Table 2.
Detailed description of all the features generated from the satellite images in GEE and used for random forest classification.
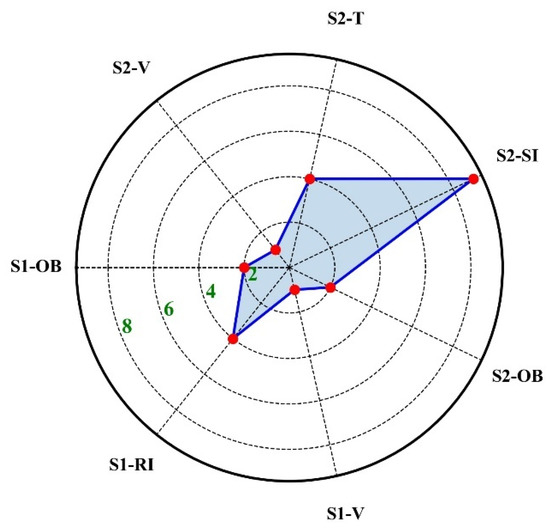
Figure 4.
Monthly features composition extracted from S1/2 data in GEE (S1-OB = S1-original bands, S1-RI = S1-radar index, S1-V = S1-variation, S2-OB = S2-original bands, S2-SI = S2-spectral index, S2-T = S2-textures, and S2-V = S2-variation).
Table 2 summarized all the monthly variables, of which, aside from the four characteristics of slope, aspect, EVI_scale, and VH_scale, we used the 20th and 80th percentiles of the remaining monthly characteristics instead for subsequent analysis. This can reduce sensitivity of features to noise such as residual cloud and shadows, and unify the same features used in the four seasons [67]. The original 30 m terrain features were resampled to 10 m to be consistent with the spatial resolutions of S1 and S2. A total of 176 features from four months including March, June, September, and December were finally derived.
2.4.4. Additional Ancillary Features
Topographic factors (slope and aspect) closely related to the vegetation distribution were derived from SRTM DEM data, which was widely used in forestry research [68]. We used the built-in terrain algorithm of GEE to calculate the additional two features (Table 2), which were then reclassified to convert the two continuous variables to categorical variables according to the technical regulations for continuous inventory of forest resources. Table 3 lists the criteria used for slope and aspect reclassification. The result of one-hot encoding of the two reclassified variables was used as the final topographic feature.

Table 3.
Summary of criteria used for slope and aspect reclassification.
2.4.5. Optimizing Random Forest Classifier
Machine learning algorithm tuning is of great importance in obtaining a stable and high-performance classifier. Here, the random forest algorithm built-in GEE platform named “smileRandomForest” (RF) was leveraged for capturing regional tree species distribution. A tree-based RF model was one of the most commonly used typical bagging learning algorithms [42,43]. RF merges multiple decision trees to obtain a more accurate and stable model, of which the predicted results are based on the results of each decision tree by voting. The critical hyperparameter “numberOfTrees” in the RF classifier was optimized by balancing model complexity and model generalization accuracy. The learning curves were used to characterize the generalization capability of the RF model with “numberOfTrees” increasing from 1 to 100 (Figure 8). Moreover, the RF built-in attribute of out-of-bag score (oob) was used in the model tuning process, which takes advantage of the unused samples during the random decision tree generation process to evaluate the accuracy of each tree, thus yielding the quantified performance of RF algorithms by taking the average accuracy value of all trees. The smaller the difference between kappa detailed in Equation (1) and oob learning curves, the better the robustness of the model given a specific parameter value.
2.4.6. Classification, Accuracy Assessment, and Zonal Statistics
To map the spatial distribution of the six targeted tree species (Pinus tabulaeformis, Quercus mongolia, Betula spp., Populus spp., Larix spp., and Armeniaca sibirica) and one residual class, a bagging learning model was carried out using the optimal RF classifier based on multitemporal features within the GEE cloud-computing platform. Quality evaluation of the classification result is always indispensable in remote sensing because it proves how well the used classifier is capable of identifying the desired objects from a given image. Here, we applied two accuracy measures on the classification validation and one additional metric on model optimization. As a preliminary evaluation Cohen’s kappa coefficient (kappa), expressed as Equation (1), measures the consistency of assigned and reference classification assuming they are equally reliable and independent. Another accuracy measure overall accuracy (OA), expressed as Equation (2), gives quantified evidence of the proportion of all correctly classified reference samples; that is, the class assignment of the classification agrees with the reference classification. To quantitatively clarify the tree species composition in whole areas and local districts on the basis of the spatial distribution area, the zonal statistics of each tree species of the whole area and of local regions was carried out respectively leading to assessment of the natural forest and plantation forest areas.
where n is the number of reference class, is the number of the correctly classified pixels of the i-th category, N is the total number of the reference pixels, and and represents the total number of the i-th category of reference classification and assignment of classification respectively.
3. Results
3.1. Multisource Feature Composition
The feature dataset was composed of 176 multitemporal features (e.g., original image bands, spectral/radar indices, textures, and gradient) and additional two one-hot encoded topographic features (slope and aspect). The multitemporal features were listed as Figure 5, of which the ordinate and abscissa individually represent the feature name and feature score, which were computed by the importance attribute built into RF classifier within GEE and was proportional to the contribution of the corresponding feature to RF model. Additional two terrain features were represented as Figure 6 and Figure 7 where the grayscale pictures on the left were the unprocessed continuous numeric features extracted from terrain data, while the classified color images were their corresponding reclassification results according to the criteria in Table 3.
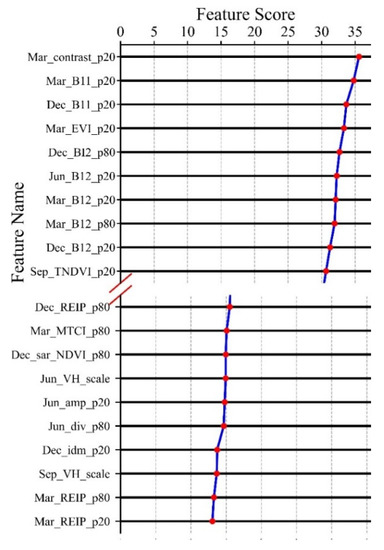
Figure 5.
Multitemporal feature collection (the suffixes p20 and p80 of characteristic variables individually denote 20th and 80th percentiles, and the prefixes March, June, September, and December are the abbreviations of March, June, September, and December, respectively).
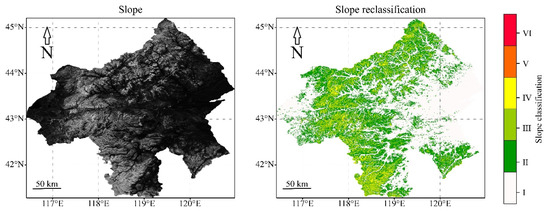
Figure 6.
The slope feature extracted from topographic data (the slope: VI>V>IV>III>II>I).
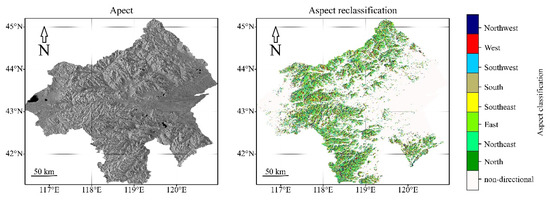
Figure 7.
The aspect feature extracted from topographic data.
3.2. Optimization of Random Forest Model
Figure 8 implies the accuracy of the RF classifier generally increased with the increase of the parameter ‘numberOfTrees’. The growth rate increased at first and then decreased, finally stabilizing with small fluctuations. The two learning curves (kappa and out_bag_score) had the minimum difference (0.06). This shows the RF model had the best generalization capability and robustness when the key hyperparameter ‘numberOfTrees’ reached 71. Therefore, we built a random forest model with 71 trees as the optimal model for tree species classification.
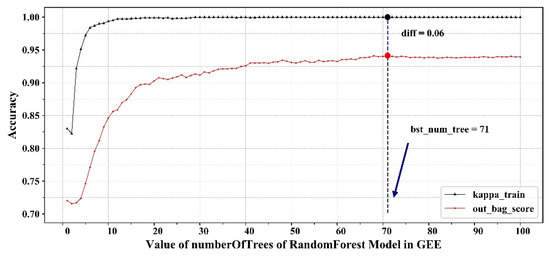
Figure 8.
Learning curve of the random forest classifier tuning process.
3.3. Tree Species Classification and Accuracy Assessment
The spatial distribution mapping of target tree species across Chifeng city was presented as Figure 9, of which the spatial pattern clearly depicts that Pinus tabulaeformis was mainly distributed in the southern four districts, while Quercus mongolia was concentrated in the northernmost part of Chifeng. Additionally, Armeniaca sibirica and Populus spp. trees were found in the central region and in the western and eastern regions, respectively. As for Betula spp. it was found along the western and northwestern forest margins, and Larix spp. was mainly distributed in the western and southwestern regions.
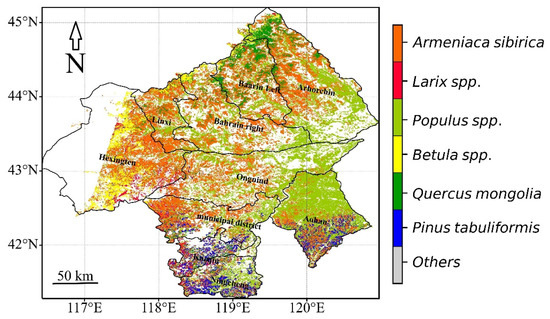
Figure 9.
Spatial distribution of the six target tree species in Chifeng city.
There were significant differences in the distribution range and tree species composition between natural forests and plantations Figure 10. The planted forests were distributed in a wider area compared to natural forests. The former was distributed almost throughout the area but mostly in the south, while the latter was dominant in the north. In addition, the planted trees in this region were composed of Pinus tabulaeformis, Populus spp., and Larix spp., while the natural tree species mainly consisted of Quercus mongolia, Betula spp., and Armeniaca sibirica.
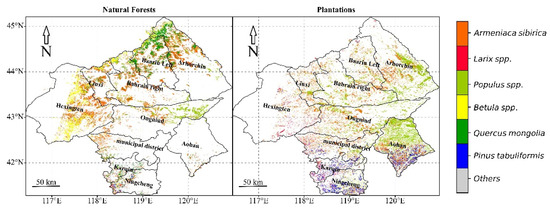
Figure 10.
Spatial distribution of the six target tree species in natural forest and plantation forest, respectively in Chifeng city.
The classification accuracy assessment was carried out to yield the confusion matrix as in Figure 11, from which the quantified accuracy of the classification results was calculated according to the accuracy evaluation metrics of OA and kappa that are detailed in Section 2.4.6. The overall accuracy (OA) = 77.5% and kappa = 0.71 for the seven classes in Chifeng are based on the RF classifier with multitemporal features within GEE.
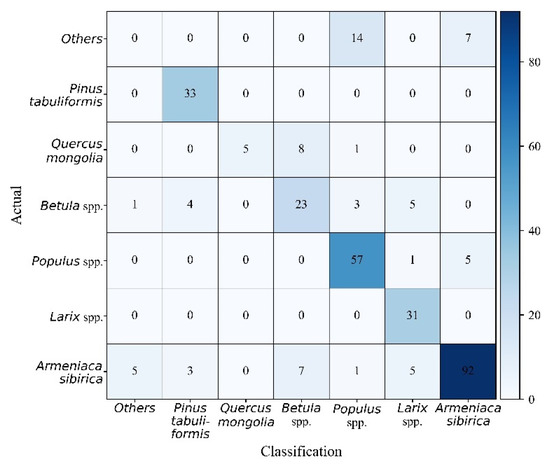
Figure 11.
The confusion matrix of six target tree species and one remaining categories.
3.4. Quantitative Analysis on the Tree Species Distribution
The tree species area results of the entire region revealed that natural forests and plantations separately accounted for 47% and 53% of the total forest area Figure 12. Moreover, Armeniaca sibirica was roughly equal in proportion to natural and cultivated trees, and it had the largest distribution area of more than 10,000 km2, followed by the Populus spp. trees covering an area over 8000 km2. Almost all Pinus tabulaeformis(84%) and Populus spp. (80%) were planted trees, whereas Quercus mongolia (91%) and Betula spp. (94%) occurred mainly in natural forest.
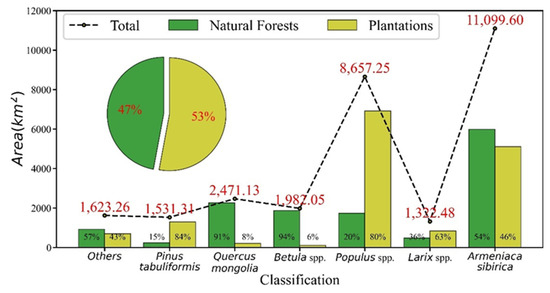
Figure 12.
Area statistics of tree species according to the planting mode in Chifeng city.
The statistical results of tree species composition and spatial area at the county-level are summarized in Figure 13. It quantitatively revealed the regional differences of forest resources among districts in Chifeng. In terms of total forest resources, Arhorchin and Aohan ranked first and second with total forest area of more than 4800 and 4100 km2 respectively, and the proportion of natural forest to plantation forest in the former was relatively balanced, while the latter was mainly plantation forest. In addition, Linxi and Ningcheng are dominated by plantations having the smallest total forest area, but both were less than 2000 km2. From the perspective of diversity of tree species, the distribution area of these typical tree species in Kalaqin Banner and Ningcheng was more balanced with both having only slightly more Pinus tabulaeformis, of which each area was respectively about 280 and 480 km2. Pinus tabulaeformis, Populus spp., and Armeniaca sibirica trees were dominant in multiple regions, and the regions of Pinus tabulaeformis were Karqin and Ningcheng, of Populus spp. were Aohan, Arhorchin, and Ongniud, and of Armeniaca sibirica were Bahrain left and right, Hexingten, Linxi, and the municipal district.
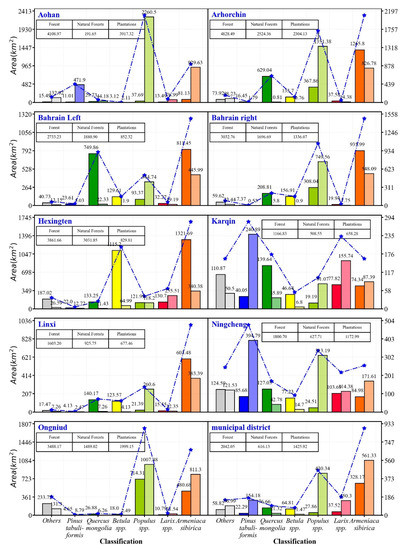
Figure 13.
Quantitative description of spatial distribution of typical tree species at the county level (the high saturation in the same color was the natural forests, the light color represented the plantations, and the blue polyline denoted the total area of the same tree species).
4. Discussion
Tree species identification by use of the remote sensing technique is a fairly challenging task due to the mixed pixels and low separability among trees [2]. There are numerous studies that have been dedicated to tree species mapping using remotely sensed data, but the classification results dealt with a lower number of targeted categories, covered a small area, and required high spatial or spectral images. These images are less practical to assist in forestry inventories, environmental monitoring, or carbon cycle estimation, all of which require working over large areas [2]. Sufficient computing capacity to handle a large volume of satellite images is a prerequisite for large geographic regions, but it is generally not available locally.
This study explored the use of a non-parametric RF classifier built into the GEE cloud computing platform to classify the dominant tree species over a regional area of more than 90,000 km2 to assess the potential of GEE in the identification of forest fine categories over large areas. Two main critical points were undertaken in this workflow: (i) taking the 20th and 80th percentiles of multisource indicators for the same month and scene, to reduce the noise effect of the maximum and minimum values of the images [67]; and (ii) making full use of the computing power provided by the GEE platform on the repeated observations of S2 satellite over the studied area.
The results obtained in this study revealed that most of the natural forests and plantations were locally concentrated, and different dominant tree species, which plainly indicated the heterogeneity of forest site conditions between the northern and southern regions. Four of the six tree species are typically found in mountainous areas. Quercus mongolia grows in the northern areas, Betula spp. is distributed along the western high altitude montane areas, while Pinus tabulaeformis and Larix spp. grows under a similar site condition and are mostly found in southwestern areas in mixed plantings. The main difference is that Pinus tabulaeformis has a wide distribution range while Larix spp. is only concentrated in steep areas. The other two species, including Armenniaca sibirica and Populus spp. have a wider suitable area. They are distributed in both mountainous and flat terrain areas, but the former is mainly in mountainous areas, while the latter mostly grows in relatively flat areas.
The tree species classification achieved an acceptable accuracy (kappa = 0.71, OA = 77.5%), which was comparable to existing related studies. For example, one similar study for seven different deciduous and coniferous tree species covering an area about 100 km2 in Germany based on RF and Sentinel-2 images achieved a lower accuracy (OA = 65%) [35], and another for regional single tree species (Shorea robusta) classification using time series MODIS data had also obtained lower accuracy (OA = 69.9%, kappa = 0.58) [69]. Using object-based methods together with multitemporal and multispectral images acquired with UAV resulted in overall accuracies greater than 73% [70,71,72,73]. Furthermore, some of previous studies obtained better accuracy on tree species classification. Their study areas were relatively small, such as one case using time series Sentinel-2 data for an area of 11.8 km2 with nine tree species achieving an 82% classification accuracy [74] and another in an area of 9 km2 with two tree species achieved 88% accuracy [41]. Furthermore, very high spatial or spectral resolution images were required, e.g., using Sentinel-2 together with Hyperion images for the classification of two tree species over 11.2 km2, which exhibited an overall accuracy of 97% [75].
The present study mainly focused on tree species classification with high spatial resolution imagery using the GEE platform without analyzing the driving factors of tree species distribution. Further work may perform in suitable areas (ecological envelope) modeling of tree species using species’ distribution models and environmental factors including climate, soil, and terrain attributes based on the classification results rather than field survey plots. This could assist in analyzing the projection of tree species in future climate scenarios.
5. Conclusions
High spatial resolution maps of tree species composition over large areas are key to support afforestation decision-making, to monitor deforestation, and assess biodiversity. A novel methodology was proposed for tree species identification over an area covering 90,000 km2 using Sentinel-1/2 images acquired from four months (once per season within the same year) within the GEE platform.
To our knowledge, this is the first attempt to achieve tree species classification over such a large area with high spatial resolution using GEE. We produced a 10 m spatial map of six dominant trees species (Pinus tabulaeformis, Quercus mongolia, Betula spp., Populus spp., Larix spp., and Armeniaca sibirica) and found that Pinus tabulaeformis and Populus spp. were mainly present as plantation forests, while Quercus mongolia and Betula spp. were typically found in natural forest areas. Additionally, the areas of Populus spp. and Armeniaca sibirica occupied the largest area across the study area.
The reliable accuracy demonstrated that the proposed cloud-computing workflow is capable of classifying forest types and analyzing spatial pattern over large areas when using only freely-accessible Sentinel-1/2 imagery instead of more expensive high resolution or hyperspectral data. We conclude that the novel design is well-suited to be applied on larger geographic areas to assist in helping forestry inventories.
Author Contributions
Conceptualization, B.X., C.C., and M.X.; methodology, B.X. and C.C.; software, B.X.; validation, B.X. and Y.C.; formal analysis, B.X. and X.Y.; investigation, X.Y., B.B., R.S.D., and K.W.; resources, C.C.; data curation, C.C. and M.X.; writing—original draft preparation, B.X.; writing—review and editing, C.C., R.S.D. and B.B.; visualization, B.X., X.Y. and Y.C.; supervision, C.C.; project administration, B.X. and C.C.; funding acquisition, C.C. and M.X. All authors have read and agreed to the published version of the manuscript.
Funding
This study was funded by the National Key Research and Development Program of China (NO. 2017YFD0600903) and the National Natural Science Foundation of China (No. 41971394).
Data Availability Statement
Not available.
Acknowledgments
The authors thank Yongfeng Dang of National Forestry and Grassland Administration for his guidance of field data processing. The authors are grateful to the anonymous reviewers for their valuable comments on improving the quality of the manuscript.
Conflicts of Interest
The authors declare no conflict of interest.
References
- Grabska, E.; Hostert, P.; Pflugmacher, D.; Ostapowicz, K. Forest Stand Species Mapping Using the Sentinel-2 Time Series. Remote Sens. 2019, 11, 1197. [Google Scholar] [CrossRef]
- Fassnacht, F.E.; Latifi, H.; Stereńczak, K.; Modzelewska, A.; Lefsky, M.; Waser, L.T.; Straub, C.; Ghosh, A. Review of studies on tree species classification from remotely sensed data. Remote Sens. Environ. 2016, 186, 64–87. [Google Scholar] [CrossRef]
- Turner, W.; Spector, S.; Gardiner, N.; Fladeland, M.; Sterling, E.; Steininger, M. Remote sensing for biodiversity science and conservation. Trends Ecol. Evol. 2003, 18, 306–314. [Google Scholar] [CrossRef]
- Blaschke, T. Object based image analysis for remote sensing. ISPRS J. Photogramm. Remote Sens. 2010, 65, 2–16. [Google Scholar] [CrossRef]
- Yang, X.H.; Rochdi, N.; Zhang, J.K.; Banting, J.; Rolfson, D.; King, C.; Staenz, K.; Patterson, S.; Purdy, B. Mapping tree species in a boreal forest area using rapideye and lidar data. In Proceedings of the 2014 IEEE International Geoscience and Remote Sensing Symposium, Quebec City, QC, Canada, 13–18 July 2014. [Google Scholar]
- Adelabu, S.; Mutanga, O.; Adam, E.; Cho, M.A. Exploiting machine learning algorithms for tree species classification in a semiarid woodland using RapidEye image. J. Appl. Remote Sens. 2013, 7. [Google Scholar] [CrossRef]
- Karlson, M.; Ostwald, M.; Reese, H.; Bazie, H.R.; Tankoano, B. Assessing the potential of multi-seasonal WorldView-2 imagery for mapping West African agroforestry tree species. Int. J. Appl. Earth Obs. Geoinf. 2016, 50, 80–88. [Google Scholar] [CrossRef]
- Wangda, P.; Hussin, Y.A.; Bronsveld, M.C.; Karna, Y.K. Species stratification and upscaling of forest carbon estimates to landscape scale using GeoEye-1 image and lidar data in sub-tropical forests of Nepal. Int. J. Remote Sens. 2019, 40, 7941–7965. [Google Scholar] [CrossRef]
- Xie, Y.C.; Sha, Z.Y.; Yu, M. Remote sensing imagery in vegetation mapping: A review. J. Plant Ecol. 2008, 1, 9–23. [Google Scholar] [CrossRef]
- Griffiths, P.; Kuemmerle, T.; Baumann, M.; Radeloff, V.C.; Abrudan, I.V.; Lieskovsky, J.; Munteanu, C.; Ostapowicz, K.; Hostert, P. Forest disturbances, forest recovery, and changes in forest types across the Carpathian ecoregion from 1985 to 2010 based on Landsat image composites. Remote Sens. Environ. 2014, 151, 72–88. [Google Scholar] [CrossRef]
- Tian, X.M.; Zhang, X.L.; Wu, Y.S. Classification of planted forest species in southern China with airborne hyperspectral and LiDAR data. J. For. Res. 2020, 25, 369–378. [Google Scholar] [CrossRef]
- Vangi, E.; D’Amico, G.; Francini, S.; Giannetti, F.; Lasserre, B.; Marchetti, M.; Chirici, G. The New Hyperspectral Satellite PRISMA: Imagery for Forest Types Discrimination. Sensors 2021, 21, 1182. [Google Scholar] [CrossRef] [PubMed]
- Van Coillie, F.M.B.; Liao, W.; Kempeneers, W.; Vandekerkhove, K.; Gautama, S.; Philips, W.; De Wulf, R.R. Optimized feature fusion of lidar and hyperspectral data for tree species mapping in closed forest canopies. In Proceedings of the 2015 7th Workshop on Hyperspectral Image and Signal Processing: Evolution in Remote Sensing, Tokyo, Japan, 2–5 June 2015. [Google Scholar]
- Ghosh, A.; Fassnacht, F.E.; Joshi, P.K.; Koch, B. A framework for mapping tree species combining hyperspectral and LiDAR data: Role of selected classifiers and sensor across three spatial scales. Int. J. Appl. Earth Obs. Geoinf. 2014, 26, 49–63. [Google Scholar] [CrossRef]
- Dudley, K.L.; Dennison, P.E.; Roth, K.L.; Roberts, D.A.; Coates, A.R. A multi-temporal spectral library approach for mapping vegetation species across spatial and temporal phenological gradients. Remote Sens. Environ. 2015, 167, 121–134. [Google Scholar] [CrossRef]
- Ballanti, L.; Blesius, L.; Hines, E.; Kruse, B. Tree Species Classification Using Hyperspectral Imagery: A Comparison of Two Classifiers. Remote Sens. 2016, 8, 445. [Google Scholar] [CrossRef]
- Shukla, A.; Kot, R. An Overview of Hyperspectral Remote Sensing and its applications in various Disciplines. IRA Int. J. Appl. Sci. 2016, 5, 85. [Google Scholar] [CrossRef]
- George, R.; Padalia, H.; Kushwaha, S.P.S. Forest tree species discrimination in western Himalaya using EO-1 Hyperion. Int. J. Appl. Earth Obs. Geoinf. 2014, 28, 140–149. [Google Scholar] [CrossRef]
- Shi, Y.F.; Wang, T.J.; Skidmore, A.K.; Heurich, M. Important LiDAR metrics for discriminating forest tree species in Central Europe. ISPRS J. Photogramm. Remote Sens. 2018, 137, 163–174. [Google Scholar] [CrossRef]
- Sasaki, T.; Imanishi, J.; Ioki, K.; Morimoto, Y.; Kitada, K. Object-based classification of land cover and tree species by integrating airborne LiDAR and high spatial resolution imagery data. Landsc. Ecol. Eng. 2012, 8, 157–171. [Google Scholar] [CrossRef]
- Wang, K.P.; Wang, T.J.; Liu, X.H. A Review: Individual Tree Species Classification Using Integrated Airborne LiDAR and Optical Imagery with a Focus on the Urban Environment. Forests 2019, 10, 1. [Google Scholar] [CrossRef]
- Burai, P.; Beko, L.; Lenart, C.; Tomor, T.; Kovacs, Z. Individual tree species classification using airborne hyperspectral imagery and lidar data. In Proceedings of the 2019 10th Workshop on Hyperspectral Imaging and Signal Processing—Evolution in Remote Sensing, Amsterdam, The Netherlands, 24–26 September 2019. [Google Scholar]
- Dalponte, M.; Frizzera, L.; Gianelle, D. Individual tree crown delineation and tree species classification with hyperspectral and LiDAR data. Peerj 2019, 6. [Google Scholar] [CrossRef]
- Wu, Y.S.; Zhang, X.L. Object-Based Tree Species Classification Using Airborne Hyperspectral Images and LiDAR Data. Forests 2020, 11, 32. [Google Scholar] [CrossRef]
- Chowdhury, S.; Peddle, D.R.; Wulder, M.A.; Heckbert, S.; Shipman, T.C.; Chao, D.K. Estimation of land-use/land-cover changes associated with energy footprints and other disturbance agents in the Upper Peace Region of Alberta Canada from 1985 to 2015 using Landsat data. Int. J. Appl. Earth Obs. Geoinf. 2021, 94. [Google Scholar] [CrossRef]
- Adams, B.T.; Matthews, S.N. Enhancing Forest and Shrubland Mapping in a Managed Forest Landscape with Landsat-LiDAR Data Fusion. Nat. Areas J. 2018, 38, 402–418. [Google Scholar] [CrossRef]
- Hobbs, R.J.; Wallace, J.F.; Campbell, N.A. Classification of vegetation in the western australian wheatbelt using landsat mss data. Vegetatio 1989, 80, 91–105. [Google Scholar] [CrossRef]
- Permana, D.S.; Nakajima, T.; Yuasa, T.; Akatsuka, T. A vegetation classification method with a spectral, spatial and temporal variability for Landsat/TM imagery. In Applications of Digital Image Processing Xxi; Tescher, A.G., Ed.; International Society for Optics and Photonics: Bellingham, WA, USA, 1998; Volume 3460, pp. 834–843. [Google Scholar]
- Immitzer, M.; Bock, S.; Einzmann, K.; Vuolo, F.; Pinnel, N.; Wallner, A.; Atzberger, C. Fractional cover mapping of spruce and pine at 1 ha resolution combining very high and medium spatial resolution satellite imagery. Remote Sens. Environ. 2018, 204, 690–703. [Google Scholar] [CrossRef]
- Townshend, J.R.; Masek, J.G.; Huang, C.Q.; Vermote, E.F.; Gao, F.; Channan, S.; Sexton, J.O.; Feng, M.; Narasimhan, R.; Kim, D.; et al. Global characterization and monitoring of forest cover using Landsat data: Opportunities and challenges. Int. J. Digit. Earth 2012, 5, 373–397. [Google Scholar] [CrossRef]
- Khairuddin, B.; Yulianda, F.; Kusmana, C. Degradation mangrove by using Landsat 5 TM and Landsat 8 OLI image in Mempawah Regency, West Kalimantan Province year 1989–2014. Procedia Environ. Sci. 2016, 33, 460–464. [Google Scholar] [CrossRef]
- Long, J.B.; Giri, C. Mapping the Philippines’ Mangrove Forests Using Landsat Imagery. Sensors 2011, 11, 2972–2981. [Google Scholar] [CrossRef]
- Zhao, Y.Y.; Feng, D.L.; Jayaraman, D.; Belay, D.; Sebrala, H.; Ngugi, J.; Maina, E.; Akombo, R.; Otuoma, J.; Mutyaba, J.; et al. Bamboo mapping of Ethiopia, Kenya and Uganda for the year 2016 using multi-temporal Landsat imagery. Int. J. Appl. Earth Obs. Geoinf. 2018, 66, 116–125. [Google Scholar] [CrossRef]
- Soares, V.P.; Hoffer, R.M. Eucalyptus forest change classification using multi-date landsat tm data. In Multispectral and Microwave Sensing of Forestry, Hydrology, and Natural Resources; International Society for Optics and Photonics: Bellingham, WA, USA, 1995; Volume 2314, pp. 281–291. [Google Scholar]
- Immitzer, M.; Vuolo, F.; Atzberger, C. First Experience with Sentinel-2 Data for Crop and Tree Species Classifications in Central Europe. Remote Sens. 2016, 8, 166. [Google Scholar] [CrossRef]
- Mickelson, J.G.; Civco, D.L.; Silander, J.A. Delineating forest canopy species in the northeastern United States using multi-temporal TM imagery. Photogramm. Eng. Remote Sens. 1998, 64, 891–904. [Google Scholar]
- Misra, G.; Cawkwell, F.; Wingler, A. Status of Phenological Research Using Sentinel-2 Data: A Review. Remote Sens. 2020, 12, 2760. [Google Scholar] [CrossRef]
- Wang, D.Z.; Wan, B.; Qiu, P.H.; Su, Y.J.; Guo, Q.H.; Wu, X.C. Artificial Mangrove Species Mapping Using Pleiades-1: An Evaluation of Pixel-Based and Object-Based Classifications with Selected Machine Learning Algorithms. Remote Sens. 2018, 10, 294. [Google Scholar] [CrossRef]
- Agarwal, S.; Vailshery, L.S.; Jaganmohan, M.; Nagendra, H. Mapping Urban Tree Species Using Very High Resolution Satellite Imagery: Comparing Pixel-Based and Object-Based Approaches. ISPRS Int. J. Geo-Inf. 2013, 2, 220–236. [Google Scholar] [CrossRef]
- Hoscilo, A.; Lewandowska, A. Mapping Forest Type and Tree Species on a Regional Scale Using Multi-Temporal Sentinel-2 Data. Remote Sens. 2019, 11, 929. [Google Scholar] [CrossRef]
- Wessel, M.; Brandmeier, M.; Tiede, D. Evaluation of Different Machine Learning Algorithms for Scalable Classification of Tree Types and Tree Species Based on Sentinel-2 Data. Remote Sens. 2018, 10, 1419. [Google Scholar] [CrossRef]
- Raczko, E.; Zagajewski, B. Comparison of support vector machine, random forest and neural network classifiers for tree species classification on airborne hyperspectral APEX images. Eur. J. Remote Sens. 2017, 50, 144–154. [Google Scholar] [CrossRef]
- Lv, J.; Ma, T. Discrimination of tree species using random forests from the Chinese high-resolution remote sensing satellite GF-1. In Hyperspectral Remote Sensing Applications and Environmental Monitoring and Safety Testing Technology; Liu, W., Wang, J., Eds.; SPIE: Bellingham, WA, USA, 2016; Volume 10156. [Google Scholar]
- Xi, Z.X.; Hopkinson, C.; Rood, S.B.; Peddle, D.R. See the forest and the trees: Effective machine and deep learning algorithms for wood filtering and tree species classification from terrestrial laser scanning. ISPRS J. Photogramm. Remote Sens. 2020, 168, 1–16. [Google Scholar] [CrossRef]
- dos Santos, A.A.; Marcato, J.; Araujo, M.S.; Di Martini, D.R.; Tetila, E.C.; Siqueira, H.L.; Aoki, C.; Eltner, A.; Matsubara, E.T.; Pistori, H.; et al. Assessment of CNN-Based Methods for Individual Tree Detection on Images Captured by RGB Cameras Attached to UAVs. Sensors 2019, 19, 3595. [Google Scholar] [CrossRef]
- Fricker, G.A.; Ventura, J.D.; Wolf, J.A.; North, M.P.; Davis, F.W.; Franklin, J. A Convolutional Neural Network Classifier Identifies Tree Species in Mixed-Conifer Forest from Hyperspectral Imagery. Remote Sens. 2019, 11, 2326. [Google Scholar] [CrossRef]
- Schiefer, F.; Kattenborn, T.; Frick, A.; Frey, J.; Schall, P.; Koch, B.; Schmidtlein, S. Mapping forest tree species in high resolution UAV-based RGB-imagery by means of convolutional neural networks. ISPRS J. Photogramm. Remote Sens. 2020, 170, 205–215. [Google Scholar] [CrossRef]
- Zhang, B.; Zhao, L.; Zhang, X.L. Three-dimensional convolutional neural network model for tree species classification using airborne hyperspectral images. Remote Sens. Environ. 2020, 247, 1938. [Google Scholar] [CrossRef]
- Nezami, S.; Khoramshahi, E.; Nevalainen, O.; Polonen, I.; Honkavaara, E. Tree Species Classification of Drone Hyperspectral and RGB Imagery with Deep Learning Convolutional Neural Networks. Remote Sens. 2020, 12, 1070. [Google Scholar] [CrossRef]
- Hartling, S.; Sagan, V.; Sidike, P.; Maimaitijiang, M.; Carron, J. Urban Tree Species Classification Using a WorldView-2/3 and LiDAR Data Fusion Approach and Deep Learning. Sensors 2019, 19, 1284. [Google Scholar] [CrossRef] [PubMed]
- Ball, J.E.; Anderson, D.T.; Chan, C.S. Feature and Deep Learning in Remote Sensing Applications. J. Appl. Remote Sens. 2018, 11. [Google Scholar] [CrossRef]
- Gorelick, N.; Hancher, M.; Dixon, M.; Ilyushchenko, S.; Thau, D.; Moore, R. Google Earth Engine: Planetary-scale geospatial analysis for everyone. Remote Sens. Environ. 2017, 202, 18–27. [Google Scholar] [CrossRef]
- Mutanga, O.; Kumar, L. Google Earth Engine Applications. Remote Sens. 2019, 11, 591. [Google Scholar] [CrossRef]
- Yang, A.X.; Zhong, B.; Wu, J.H. Monitoring winter wheat in ShanDong province using Sentinel data and Google Earth Engine platform. In Proceedings of the 2019 10th International Workshop on the Analysis of Multitemporal Remote Sensing Images (MultiTemp), Shanghai, China, 5–7 August 2019. [Google Scholar]
- Srinet, R.; Nandy, S.; Padalia, H.; Ghosh, S.; Watham, T.; Patel, N.R.; Chauhan, P. Mapping plant functional types in Northwest Himalayan foothills of India using random forest algorithm in Google Earth Engine. Int. J. Remote Sens. 2020, 41, 1–14. [Google Scholar] [CrossRef]
- Venkatappa, M.; Sasaki, N.; Anantsuksomsri, S.; Smith, B. Applications of the Google Earth Engine and Phenology-Based Threshold Classification Method for Mapping Forest Cover and Carbon Stock Changes in Siem Reap Province, Cambodia. Remote Sens. 2020, 12, 3110. [Google Scholar] [CrossRef]
- Wu, Q. geemap: A Python package for interactive mapping with Google Earth Engine. J. Open Source Softw. 2020, 5, 2305. [Google Scholar] [CrossRef]
- Kumar, L.; Mutanga, O. Google Earth Engine Applications Since Inception: Usage, Trends, and Potential. Remote Sens. 2018, 10, 1509. [Google Scholar] [CrossRef]
- Crippen, R.E. Calculating the vegetation index faster. Remote Sens. Environ. 1990, 34, 71–73. [Google Scholar] [CrossRef]
- Senseman, G.; Tweddale, S.; Anderson, A.; Bagley, C. Correlation of Land Condition Trend Analysis (LCTA) Rangeland Cover Measures to Satellite-Imagery-Derived Vegetation Indices; 1996; p. 33. Available online: https://books.google.com.hk/books?id=B1P6p1J3t-wC&pg=PP1&lpg=PP1&dq=Correlation+of+Land+Condition+Trend+Analysis+(LCTA)+Rangeland+Cover+Measures+to+Satellite-Imagery-Derived+Vegetation+Indices&source=bl&ots=c85XbDjnXC&sig=ACfU3U0lH5gyJ9ib19a5IVSEm2AOIaveqQ&hl=zh-CN&sa=X&ved=2ahUKEwir4ayUsKXwAhXPdd4KHXTvBqAQ6AEwBXoECAcQAw#v=onepage&q&f=false (accessed on 31 October 1996).
- Gitelson, A.A.; Kaufman, Y.J.; Merzlyak, M.N. Use of a green channel in remote sensing of global vegetation from EOS-MODIS. Remote Sens. Environ. 1996, 58, 289–298. [Google Scholar] [CrossRef]
- Escadafal, R.; Girard, M.C.; Courault, D. Munsell soil color and soil reflectance in the visible spectral bands of Landsat MSS and TM data. Remote Sens. Environ. 1989, 27, 37–46. [Google Scholar] [CrossRef]
- Dash, J.; Curran, P.J. The MERIS terrestrial chlorophyll index. Int. J. Remote Sens. 2004, 25, 5403–5413. [Google Scholar] [CrossRef]
- Guyot, G.; Frederic, B.; Major, D. High spectral resolution: Determination of spectral shifts between the red and the near infrared. Int. Arch. Photogramm. Remote Sens. 1988, 11, 750–760. [Google Scholar]
- Clevers, J.G.; Jong, H.; Epema, G.F.; van der Meer, F.; Bakker, W.; Skidmore, A.; Scholte, K. The use of the MERIS standard band setting for deriving the red edge index. In Proceedings of the ISSSR International Symposium Sensors and Systems for the New Millennium, Las Vegas, NV, USA, 31 October–5 November 1999. [Google Scholar]
- Huete, A.; Didan, K.; Miura, T.; Rodriguez, E.P.; Gao, X.; Ferreira, L.G. Overview of the radiometric and biophysical performance of the MODIS vegetation indices. Remote Sens. Environ. 2002, 83, 195–213. [Google Scholar] [CrossRef]
- Zhang, H.K.; Roy, D.P. Using the 500 m MODIS land cover product to derive a consistent continental scale 30 m Landsat land cover classification. Remote Sens. Environ. 2017, 197, 15–34. [Google Scholar] [CrossRef]
- Xie, B.; Cao, C.; Xu, M.; Bashir, B.; Singh, R.P.; Huang, Z.; Lin, X. Regional Forest Volume Estimation by Expanding LiDAR Samples Using Multi-Sensor Satellite Data. Remote Sens. 2020, 12, 360. [Google Scholar] [CrossRef]
- Ghimire, B.R.; Nagai, M.; Tripathi, N.K.; Witayangkurn, A.; Mishara, B.; Sasaki, N. Mapping of Shorea robusta Forest Using Time Series MODIS Data. Forests 2017, 8, 384. [Google Scholar] [CrossRef]
- Liu, Y.A.; Gong, W.S.; Hu, X.Y.; Gong, J.Y. Forest Type Identification with Random Forest Using Sentinel-1A, Sentinel-2A, Multi-Temporal Landsat-8 and DEM Data. Remote Sens. 2018, 10, 946. [Google Scholar] [CrossRef]
- Michez, A.; Piegay, H.; Lisein, J.; Claessens, H.; Lejeune, P. Classification of riparian forest species and health condition using multi-temporal and hyperspatial imagery from unmanned aerial system. Environ. Monit. Assess. 2016, 188. [Google Scholar] [CrossRef] [PubMed]
- Franklin, S.E.; Ahmed, O.S. Deciduous tree species classification using object-based analysis and machine learning with unmanned aerial vehicle multispectral data. Int. J. Remote Sens. 2018, 39, 5236–5245. [Google Scholar] [CrossRef]
- Apostol, B.; Petrila, M.; Lorent, A.; Ciceu, A.; Gancz, V.; Badea, O. Species discrimination and individual tree detection for predicting main dendrometric characteristics in mixed temperate forests by use of airborne laser scanning and ultra-high-resolution imagery. Sci. Total Environ. 2020, 698. [Google Scholar] [CrossRef] [PubMed]
- Denisova, A.Y.; Kavelenova, L.M.; Korchikov, E.S.; Prokhorova, N.V.; Terentyeva, D.A.; Fedoseev, V.A. Tree species classification for clarification of forest inventory data using Sentinel-2 images. In Seventh International Conference on Remote Sensing and Geoinformation of the Environment; Themistocleous, K., Papadavid, G., Michaelides, S., Ambrosia, V., Hadjimitsis, D.G., Eds.; International Society for Optics and Photonics: Bellingham, WA, USA, 2019; Volume 11174. [Google Scholar]
- Lim, J.; Kim, K.M.; Jin, R. Tree Species Classification Using Hyperion and Sentinel-2 Data with Machine Learning in South Korea and China. ISPRS Int. J. Geo-Inf. 2019, 8, 150. [Google Scholar] [CrossRef]
Publisher’s Note: MDPI stays neutral with regard to jurisdictional claims in published maps and institutional affiliations. |
© 2021 by the authors. Licensee MDPI, Basel, Switzerland. This article is an open access article distributed under the terms and conditions of the Creative Commons Attribution (CC BY) license (https://creativecommons.org/licenses/by/4.0/).