Article

Socio-Economic Analysis of Wood Charcoal Production as a Significant Output of Forest Bioeconomy in Africa

1
Department of Forestry Technologies and Constructions, Faculty of Forestry and Wood Sciences, Czech University of Life Sciences Prague, Kamýcka 129, 165 00 Prague 6, Suchdol, Czech Republic
2
Department of Environmental Management, School of Environmental Sciences, Federal University of Technology, Owerri, P.M.B. 1526, Owerri 460114, Imo State, Nigeria
3
Department of Forest Protection and Entomology, Faculty of Forestry and Wood Sciences, Czech University of Life Sciences, Prague, Kamýcka 129, 165 00 Prague 6, Suchdol, Czech Republic
*
Author to whom correspondence should be addressed.
Forests 2021, 12(5), 568; https://doi.org/10.3390/f12050568
Submission received: 11 April 2021 / Revised: 27 April 2021 / Accepted: 28 April 2021 / Published: 1 May 2021
(This article belongs to the Section Wood Science and Forest Products)

Abstract

:
Wood charcoal (WCH) is a sustainable biofuel for rural and urban users because of its higher energy density and emission of marginal smoke when compared with firewood. Besides helping the poor majority who cannot afford kerosene, electricity or liquid petroleum gas (LPG), WCH is a key source of income and livelihood. This work aimed at quantifying the volume of WCH production as well as appraising its socio-economics, including environmental impacts, especially the impact of long-term deforestation and forest degradation in Africa. Historically robust data from the databases of UN-FAO, FAOSTAT, International Energy Agency (IEA), United Nations Statistics Division, UN-DESA energy statistics yearbook, and the Forest Resources Assessment (FRA) were used. The data analysis involved descriptive statistics, multivariate analysis, and geospatial techniques. The result revealed that East Africa had the highest average wood charcoal production which was 32,058,244 tonnes representing 43.2% of the production whereas West Africa had 23,831,683 tonnes denoting 32.1%. Others were North Africa (8,650,207 tonnes), Middle Africa (8,520,329 tonnes), and South Africa (1,225,062 tonnes) representing 11.6%, 11.5% and 1.6% respectively. The correlation matrix showed that WCH production for the three decades had a significant positive correlation with all the measured parameters (such as areas of forest cover, export quantity, export value, GDP, human population, climate season, average income per citizen, and literacy rate). Wood charcoal is an essential livelihood support system. New policies including commercial wood charcoal production and licensing for revenue and ecological sustainability are required. Enterprise-based approaches for poverty reduction, smallholders’ tree-growing, wood charcoal-energy conserving technologies, improved electricity supply and agricultural productivity are encouraged. The novelty of this study can also be explained by the diverse parameters examined in relation to WCH production which no other studies in the region have done.

1. Introduction

Wood charcoal (WCH) can be defined as the solid residue generated from the process of carbonization, distillation, pyrolysis and/or torrefaction of the trunks and branches of trees, and wood by-products, by continuous or batch systems of earth kilns (pit, mound and brick) or metal kilns [1]. Wood charcoal production has been an essential anthropogenic activity since the prehistoric era [2,3], and charcoal is known as the foremost synthetic matter developed by humans. Wood charcoal production has always sustained the peoples’ livelihood since the medieval period. The uniqueness of WCH such as affordability, supply-reliability and availability made it more preferable to other renewable and non-renewable energy sources [4,5]. Wood charcoal is also value-added energy for rural and urban users because of its higher energy density and emission of marginal smoke than firewood. Socioeconomically, the importance of the WCH sector in Africa cannot be overemphasized. For example, the WCH industry has provided direct and indirect employment to millions of people and thousands of groups as manufacturers, transporters and traders and their families [6]. In various countries in the region, the WCH sector has increased the economic value of the people at the local and national level and is reported to rival some other highly valued sectors in most countries. For instance, the WCH sector in Kenya has equivalent worth to the tea sector and employs as many people as the educational sector [7]. In Tanzania, the WCH industry produces greater revenue (worth USD 650 million) which is 5.8 times more than the combination of tea and coffee industries [6]. In Nigeria, it generates more income for the local people when compared with groundnut, cocoa and palm oil in the north, west and eastern part of the country respectively [8]. In Sudan, South Sudan and Uganda, WCH is recently an economic sector that has got almost equivalent rating with the cotton industry [9]. Woodfuels including WCH contributed to about 3.5% of Malawi’s GDP, and 160,000 in direct and indirect employment in 2008 [10]. In addition, WCH production shares a high percentage in the Gross Domestic Product (GDP) of many other countries including India, Ethiopia, Ghana, Brazil, Zambia, and Rwanda [11].
The wood charcoal production process involves getting the wood heated in the absence of air or partially combusted with a finite or restricted oxygen supply [12,13]. By applying any of the processes (such as carbonization, distillation, pyrolysis or torrefaction) WCH is produced in Africa, and the region accounted for an estimated 65% of global charcoal production [5]. Nigeria, Ethiopia, Ghana, Senegal, Tanzania and Madagascar are the top producers [5,14,15]. The annual average WCH production in Africa showed a drastic increase since the 1970s ranging from 629,083.33 tonnes in 1970, 2,769,416.66 tonnes in 2017, to more than 3 million tonnes in 2019 [14]. This increase was prompted by the need to satisfy the high demand for cooking and heating energy from urban and sub-urban households [6]. It has been reported that about 40% of the charcoal used in Europe was imported from Africa [16].
In exemption of the afore-mentioned benefits of WCH, its production and consumption in Africa are associated with many ecological and health challenges [4,17,18]. The commonly reported consequences of WCH production were a decline in forest and forest degradation especially in countries such as Nigeria, Ethiopia, Ghana and others which have extremely high demands for charcoal without policies. In such places, completely deforested land is visible because sustainable selectivity of trees for size and species has been supplanted by economic incentives [19].
Most of the studies on WCH production in Africa focused on either one to few countries, or their studies were only related with a singly selected parameter such as biofuel implication [4,5], tree species and wood quality [20,21], political issues and policies [22,23], environmental and health implications [4,8,17,18,24], impacts on food safety [25], and socioeconomic [6,7,8,9,10,11]. A study with a holistic approach that integrates most of these factors as they relate to WCH production is lacking in Africa. Therefore, the novelty of this work is obvious because it aimed at quantifying the volume of WCH production in Africa as well as appraising its socio-economics, including environmental impacts, especially the impact of long-term deforestation and forest degradation. The inclusion of multiple variables (such as, areas of forest cover, export quantity, export value, GDP, human population, climate season, average income per citizen, and literacy rate) which were simultaneously examined in relation to WCH production was also remarkable. At present, there is no record of any studies that have performed such robust investigation on this topical issue in the region (Africa).

2. Materials and Methods

2.1. Description of Study Area

Africa as a continent is currently having 54 countries with a total area of 30,368,609 km2 (11,725,385 sq mi). Africa measures about 5000 miles (8000 km) from north to south and about 4600 miles (7400 km) from east to west. The landmass of the continent accounts for 20% of the Earth’s land surface. The human population is approximately 1.2 billion, and is increasing at a rapid pace which is almost thrice faster when compared with other continents. According to [26], Africa’s population will triple or quadruple by the end of this century. In terms of climate, Africa lies mainly within the inter-tropical zone and is therefore a regularly hot continent. The various climate belts are principally influenced by their rainfall trends. The major climatic zones are classified into six major categories namely, Equatorial, Humid Tropical, Tropical, Sahelian, Desert, and Mediterranean climate. The primary soil types in the continent are Oxisols, Ultisols, Alfisols, Etisols, Gelisols, Vertisols and Aridisols.

2.2. Wood Charcoal Production and Markets in Africa

Wood charcoal is traditionally produced in Africa in earth, brick, metals or steel drum kilns in batches from about 1 to 5 tons. The production methods are detailed in much of the literature [1,27].
There are three markets identifiable for WCH production in Africa. These are domestic, overland and overseas. The domestic charcoal markets in Africa are strongly linked with high population, urban and sub-urban areas. Besides the rapidly growing human population, these areas are denoted by a class of citizens that can afford WCH products [6]. The overland markets involve WCH trading between the countries within the region. As some countries (e.g., those in the Sahel belts) have little or no trees and shrubs due to geographical location and climate, they depend on their neighbors in the south for WCH. For instance, Burkina Faso, Niger Republic, Mali, and Chad rely on Nigeria and Ghana for their WCH [28]. The overseas markets flourish mainly between Nigeria, Ghana, Ethiopia and Tanzania selling to the developed nations, mostly the European countries [14,29]. Africa accounts for about 65% of global charcoal production with 21% of its charcoal output being exported [5].

2.3. Data Collection

The study evaluated and mapped wood charcoal production and the associated parameters in Africa for three decades (1990–2019) focusing on all countries. The study also compared WCH production based on regions and top producing countries. Historically robust data from the databases of UN-FAO, FAOSTAT [14], International Energy Agency-IEA, United Nations Statistics Division, UN-DESA energy statistics yearbook 2019, and the Forest Resources Assessment (FRA) were visited and relevant data were downloaded. Microsoft Excel was employed to compute the relative WCH parameters of countries in Africa. Additional data were acquired from the United Nations Statistics Division (UNdatabase) on WCH for respective countries. Other sources of data for the study were the official National Bureau of Statistics of various countries covering the relevant study periods, as well as online literature and publications. Data were also collected from interviews focusing on the top four producing countries (Nigeria, Ghana, Ethiopia, and Senegal) as case studies. The interview involved the WCH producers, the marketers, transporters and the consumers. Primarily, WCH producers in the sub-region exploit trees and shrubs that are available within their area. The commonly preferred tree species are the hardwoods such as Dialium bipindense, Diospyros spp., Pentaclethra macrophlla, Letestua durissima, Lophira alata, Milicia excels, Baphia kirkii, Cleistanthus mildbraedii, Cylicodiscus gabonensis, Desbordesia pierreana, Manilkara cuneifolia, and Parinari glabra. Others are Strombosia glaucescens, Swartzia fistuloides, Tessmania Africana, Klainedoxa gabonensis, Afzelia Africana spp., and Piptadeniastrum Africanum. Furthermore, some softwood species such as Triplochiton scleraxylon, Gmelina arborea, Juniperus procera, Pinus halepensis, Pinus pinaster, Cedrus atlantica, Hagenia abyssinica, Taxus baccata, Hevea brasiliensis, and Celba pentandra are also commonly used for WCH production in Africa. This information was derived from online sources and literature [5]. Data on income and literacy rate were collected from World Development Indicators and World Literacy rate of the World Bank [30], World Bank data on, and World Income Inequalities Database [31]. The income per citizen was in inflation-adjusted dollars. The year 2010 was used as the base year because the inflation rates for more than 80% of countries in the continent became exacerbated from 2010. This does not mean that no inflation before 2010. There was inflation in some countries but the inflation rate became high from 2010. The collected data covered three decades, namely Decade 1 which includes 1990–1999, Decade 2 represents 2000–2009, and Decade 3 stands for 2010–2019. In this work, the decades and their respective year ranges were used interchangeably to mean the same.

2.4. Data Analysis

The data analysis involved the use of descriptive and multivariate statistics as well as geospatial techniques. The descriptive statistics performed in Microsoft Excel included percentages, sum and average for WCH productions, forest area cover, export quantity and export value. The multivariate methods used were correlation, principal component analysis (PCA) and redundancy analysis (RDA). For the geospatial data analysis, we employed spatial analytical tools of ArcGIS which was used to map the distributional trend during the years. In this study, the PCA was introduced to reduce the parameters associated with wood charcoal production to the most significant ones [32]. The parameters were reduced from 20 to 10 most significant including forest area cover, export quantity, export value, GDP, climatic Season, tree species, population, income, years (in decades), and Literacy rate. The RDA was used to show the study periods (in decades) and the commonly available tree species for the wood charcoal production. Redundancy analysis permits the examination of the relationships between these groups of variables and their directions [33]. All statistical analyses were performed in Canoco 5 [33] and Statistica 13 [34], while the spatial analysis and mapping were done using ArcGIS 10.7.1 [35].

3. Results and Discussion

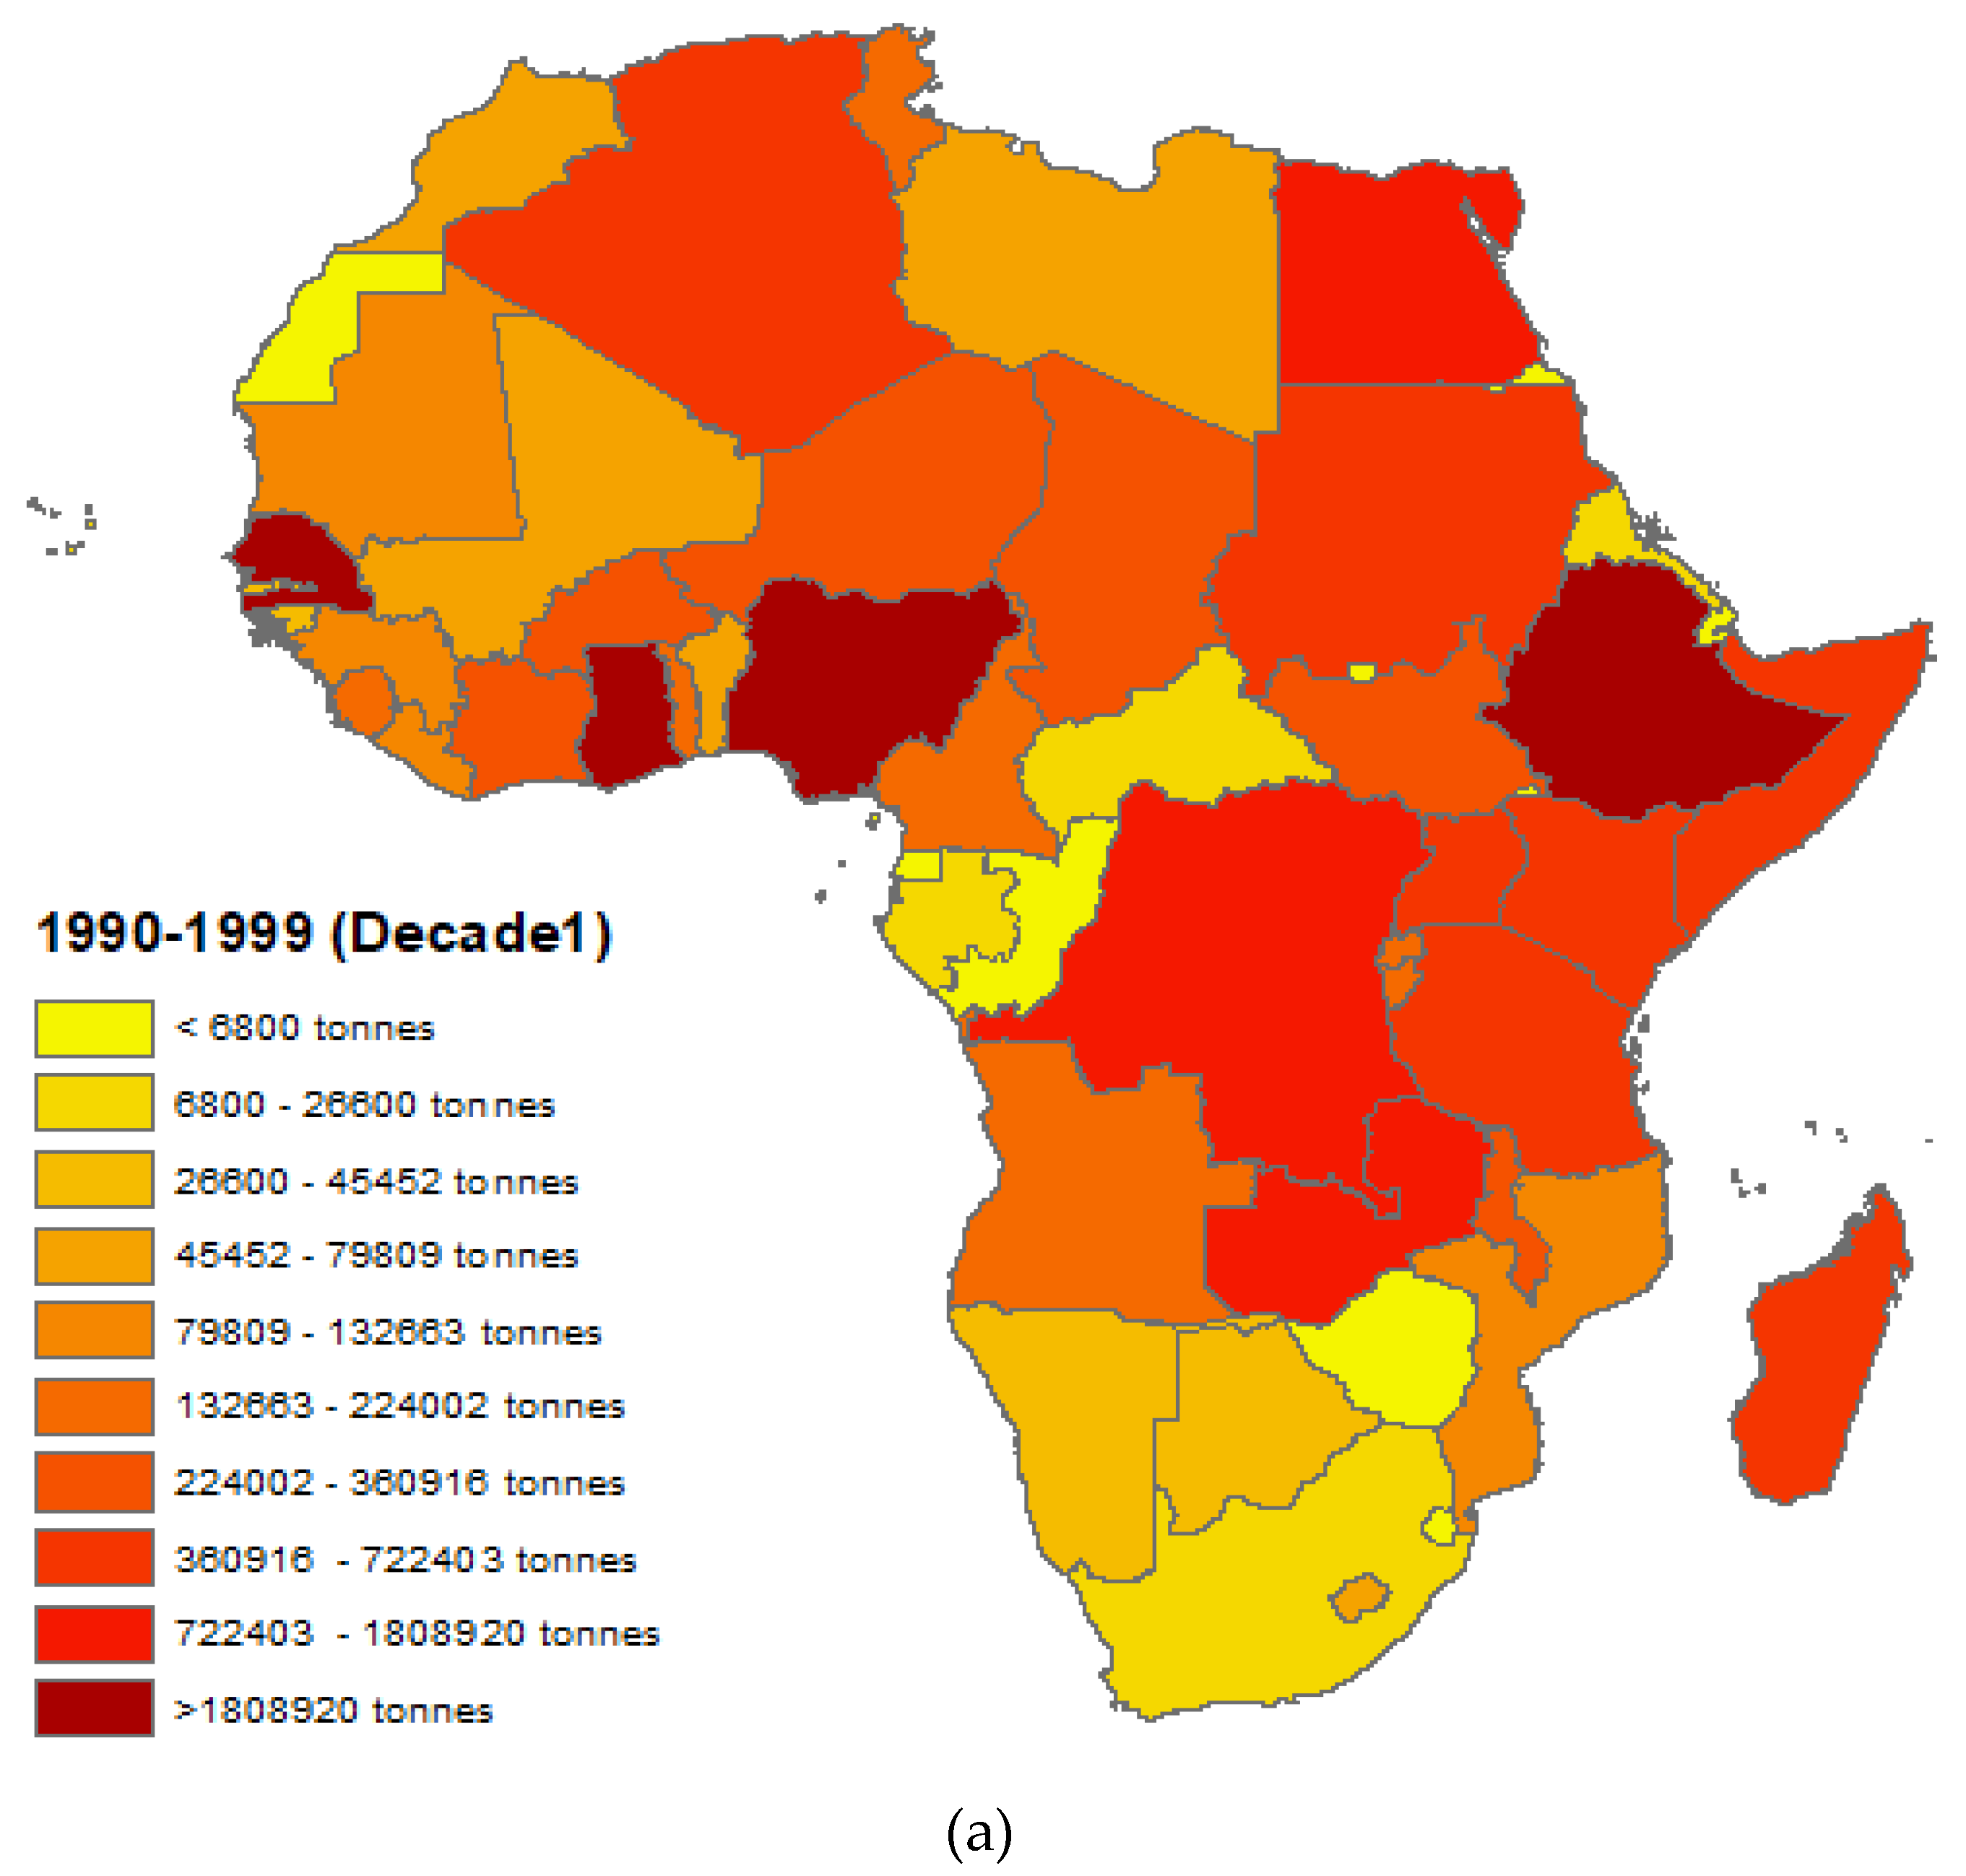
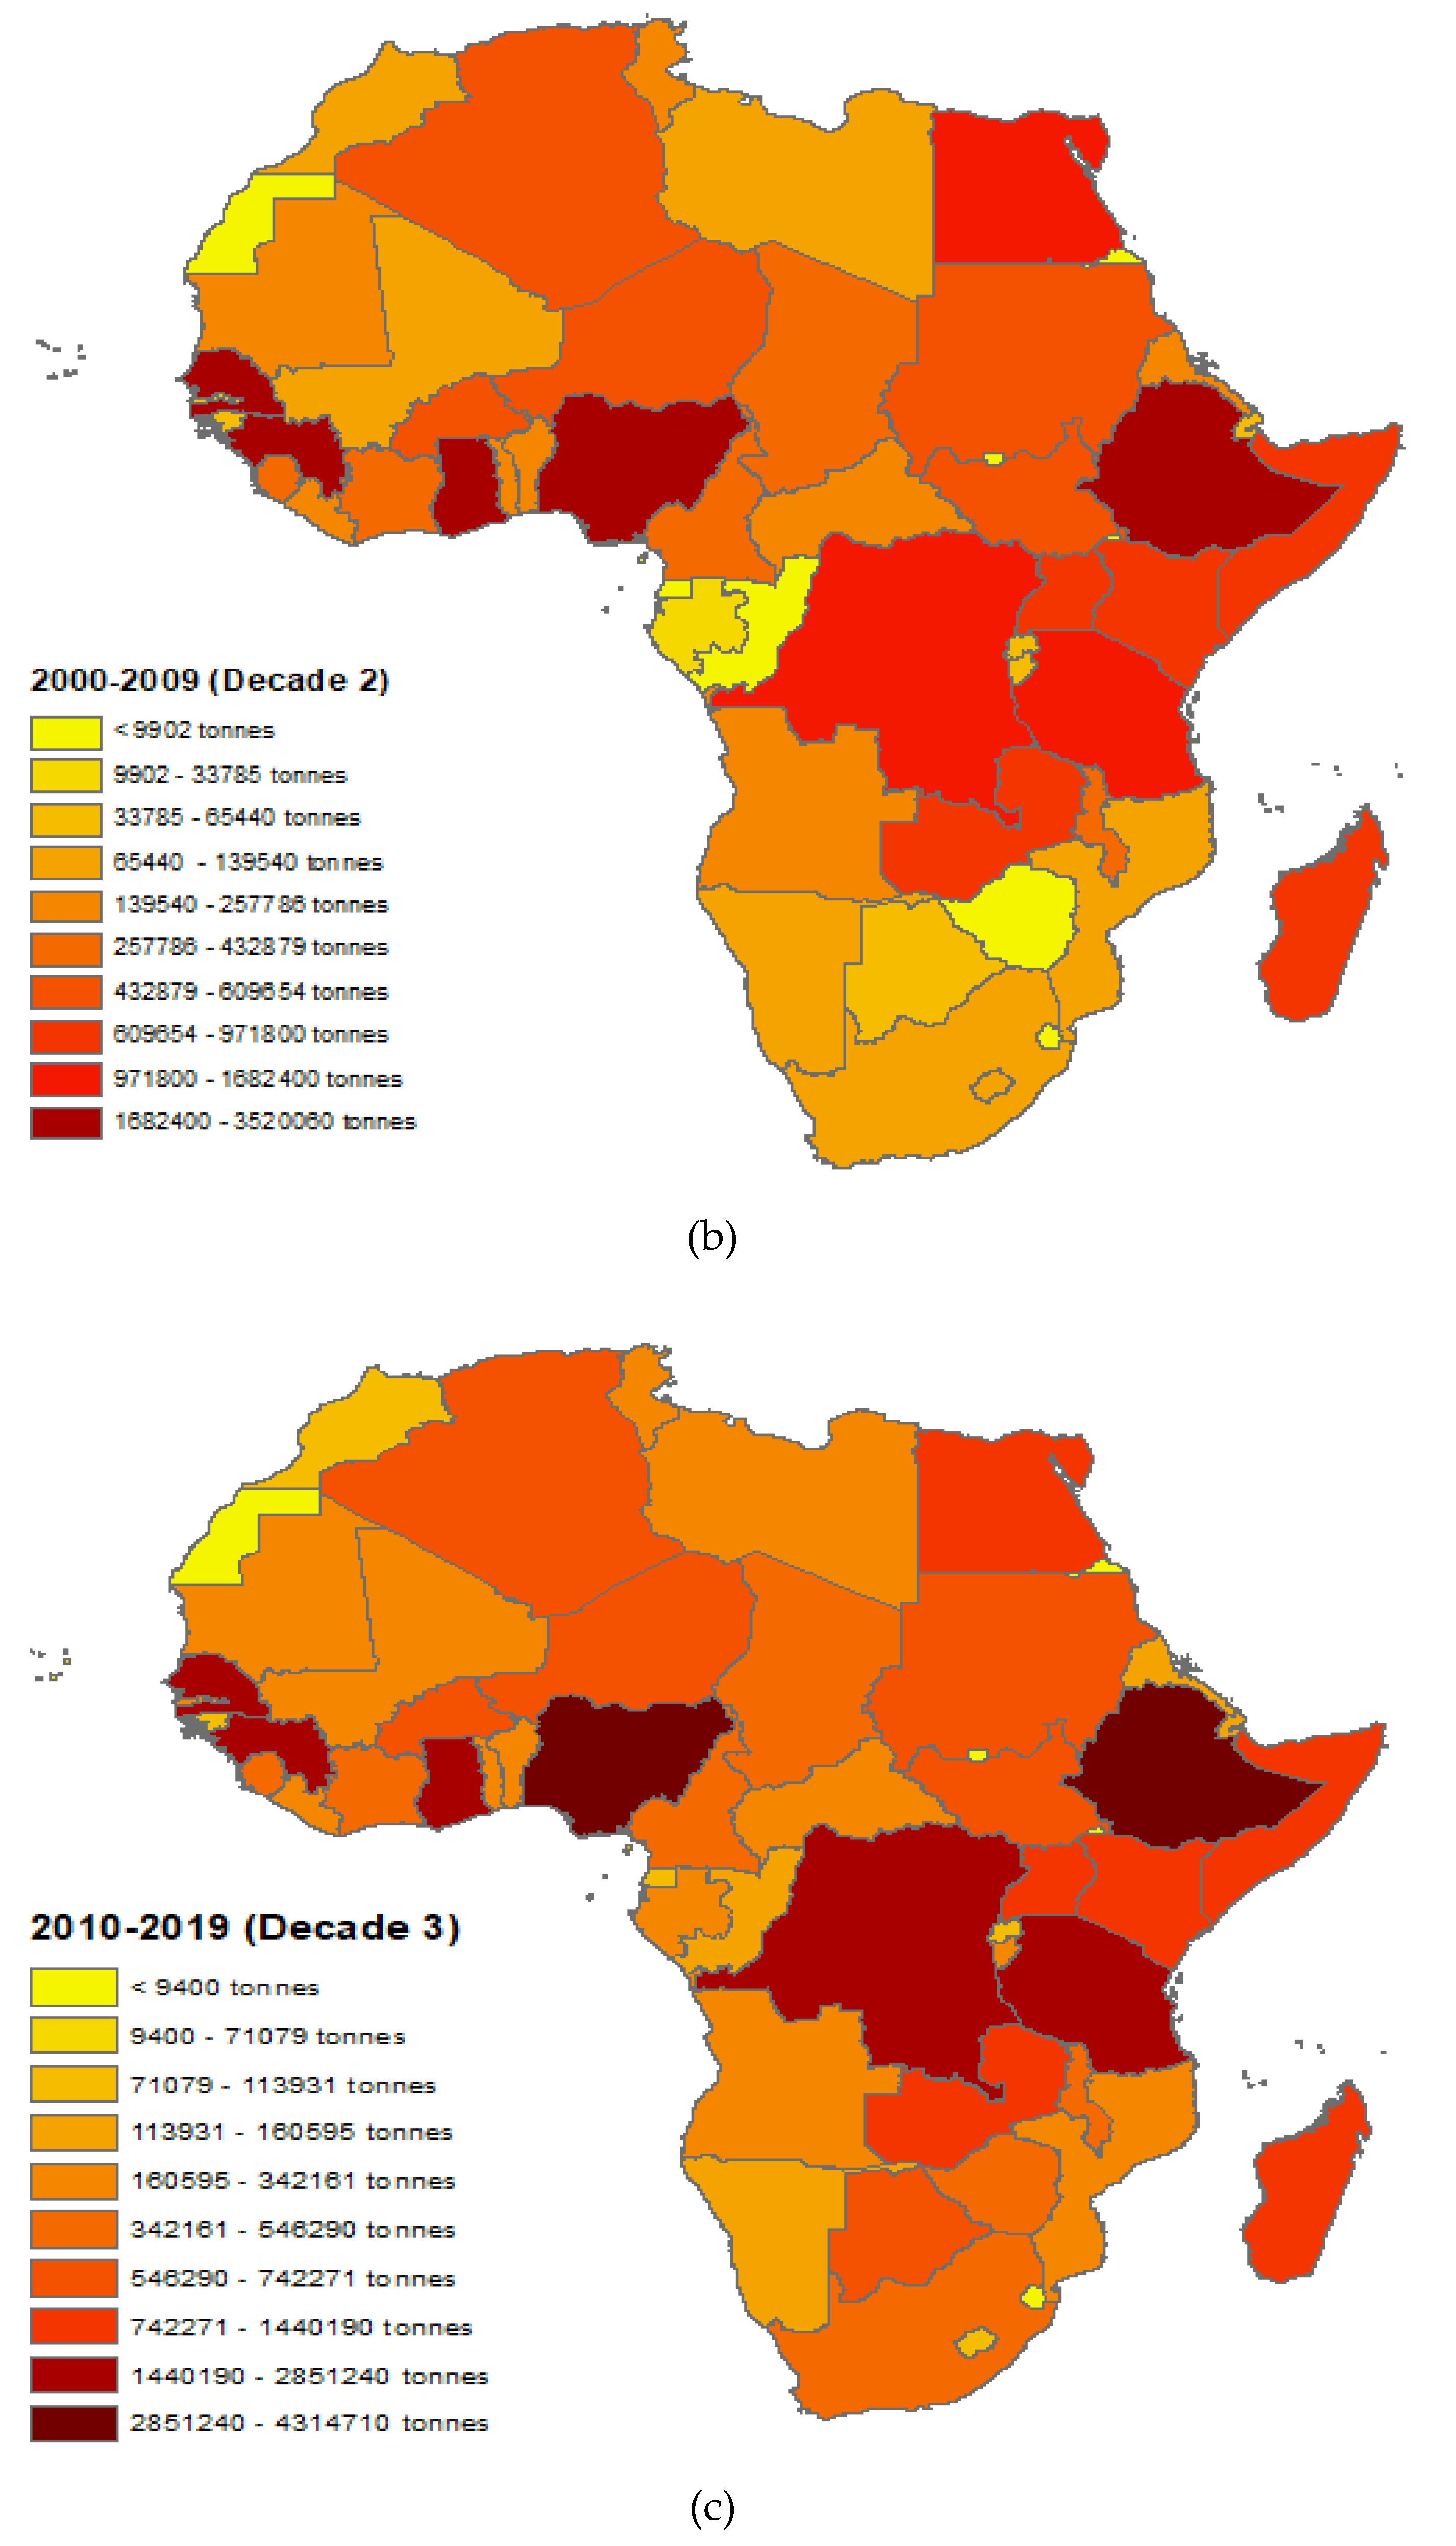
3.1. Wood Charcoal Production

The results of the average wood charcoal production for the last three decades (1990–2019) among the African countries revealed that the production was not evenly distributed (Figure 1a–c; Table S1). In Decade 1 (1990–1999), the highest wood charcoal producers in descending order were Nigeria (2,783,277 tonnes), Ethiopia (2,623,545 tonnes), Ghana (1,808,920 tonnes), Senegal (1,801,641 tonnes), and Congo DR (1,123,898 tonnes) while the lowest producers were Congo (1592 tonnes), and Mauritius (330 tonnes) (Figure 1a). The countries which had the highest production in Decade 2 (2000–2009) were Nigeria (3,464,538 tonnes), Ethiopia (3,520,064 tonnes), Ghana (1,780,732 tonnes), Congo DR (1,682,395 tonnes), Guinea (1,615,133 tonnes), and Senegal (1,610,208 tonnes) (Figure 1b). The lowest producers were Congo (3336 tonnes), and Mauritius (55 tonnes). In Decade 3 (2010–2019), Nigeria, Ethiopia, Congo DR, Ghana, Tanzania, and Senegal produced the highest wood charcoal of 4,314,708, 3,721,971, 2,362,240, 1,851,235, 1,845,625, and 1,430,607 tonnes respectively (Figure 1c). The lowest producers in Decade 3 were Cabo Verde, and Mauritius which had 921 and 3 tonnes respectively. There are many studies that focused on the high rate of wood charcoal production in Nigeria [4], in Ethiopia [36], Ghana [5,37], Senegal [38], Tanzania [39], Mozambique [40], Uganda [17], Malawi [41], Zambia [42], and other African countries [7].
On the regional basis, East Africa had the highest average wood charcoal production from 1990 to 2019 which was 32,058,244 tonnes representing 43.2% of the production in the region for the three decades (Table 1). West Africa had 23,831,683 denoting 32.1%, while North Africa (8,650,207 tonnes), Middle Africa (8,520,329 tonnes, and South Africa (1,225,062 tonnes) representing 11.6%, 11.5% and 1.6% respectively. Across the region, Decade 3 (31.58 million tonnes) recorded the highest wood charcoal production when compared with Decade 1 and Decade 2. The production in Decade 3 is 43% and 22% higher than the production in Decade 1 and Decade 2 respectively (Figure 2). The increase in wood charcoal production from 1990 to 2019 might be attributed to an increase in demand due to an increase in human population and urbanization in the continent.

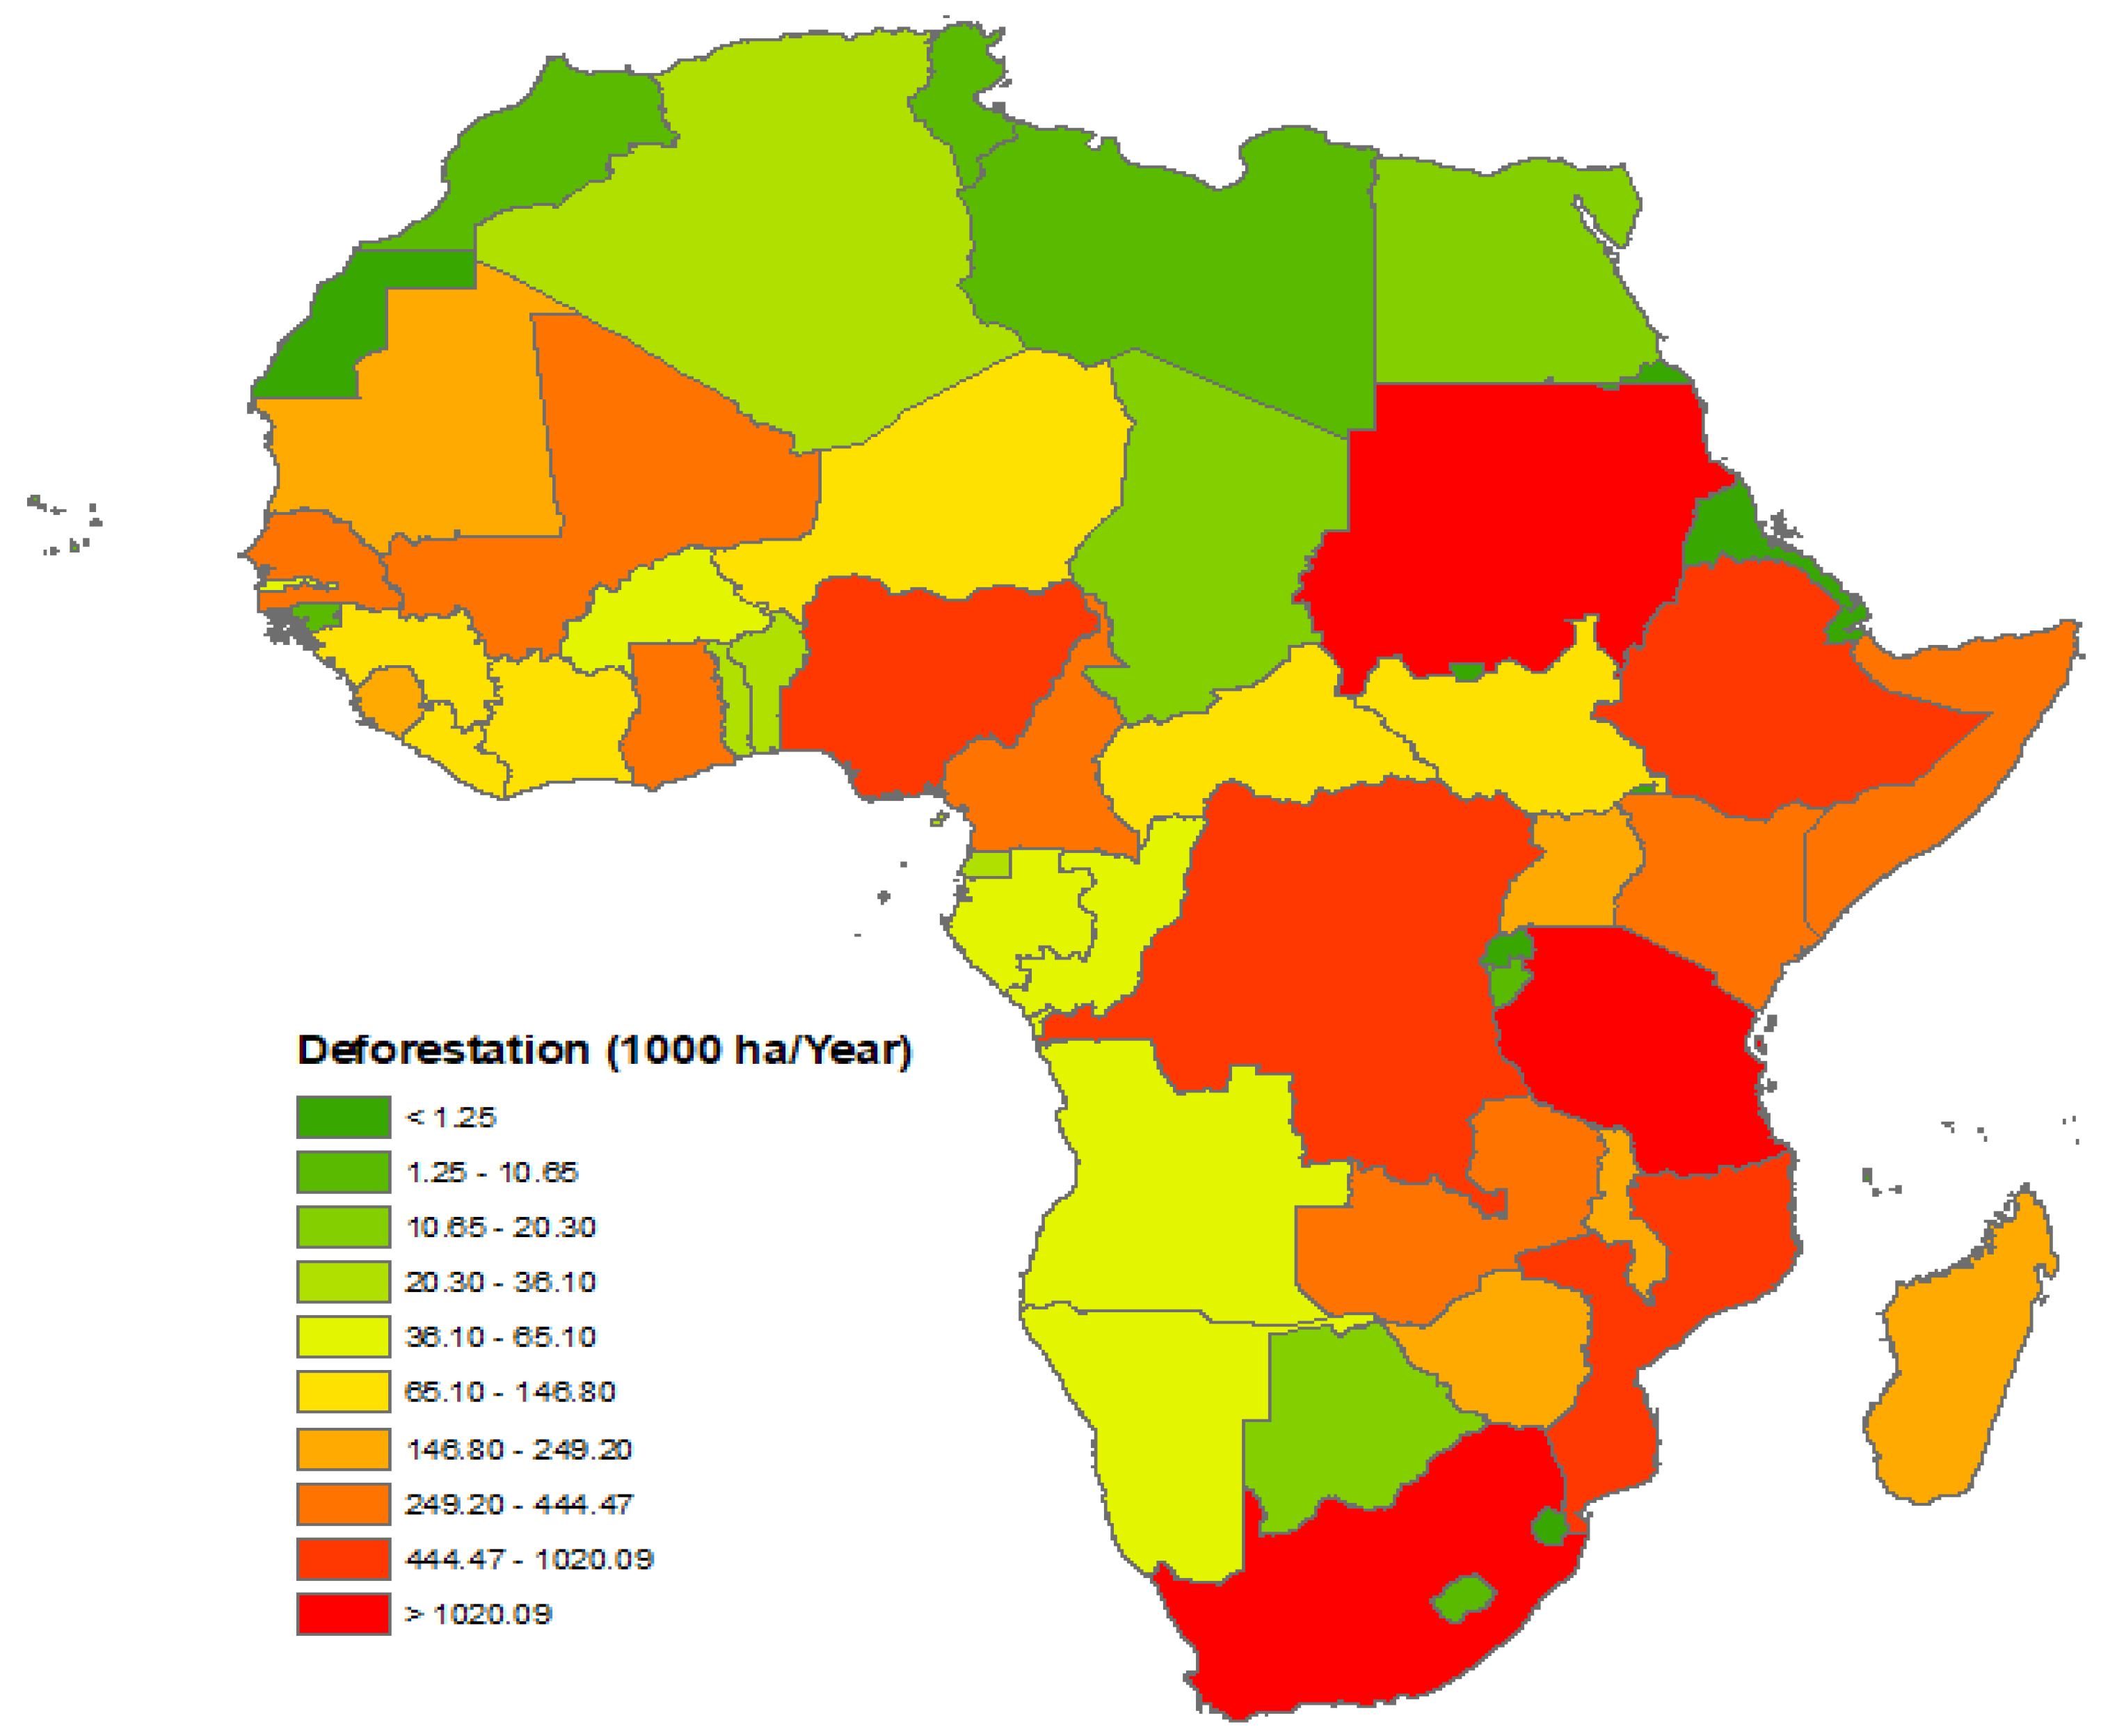
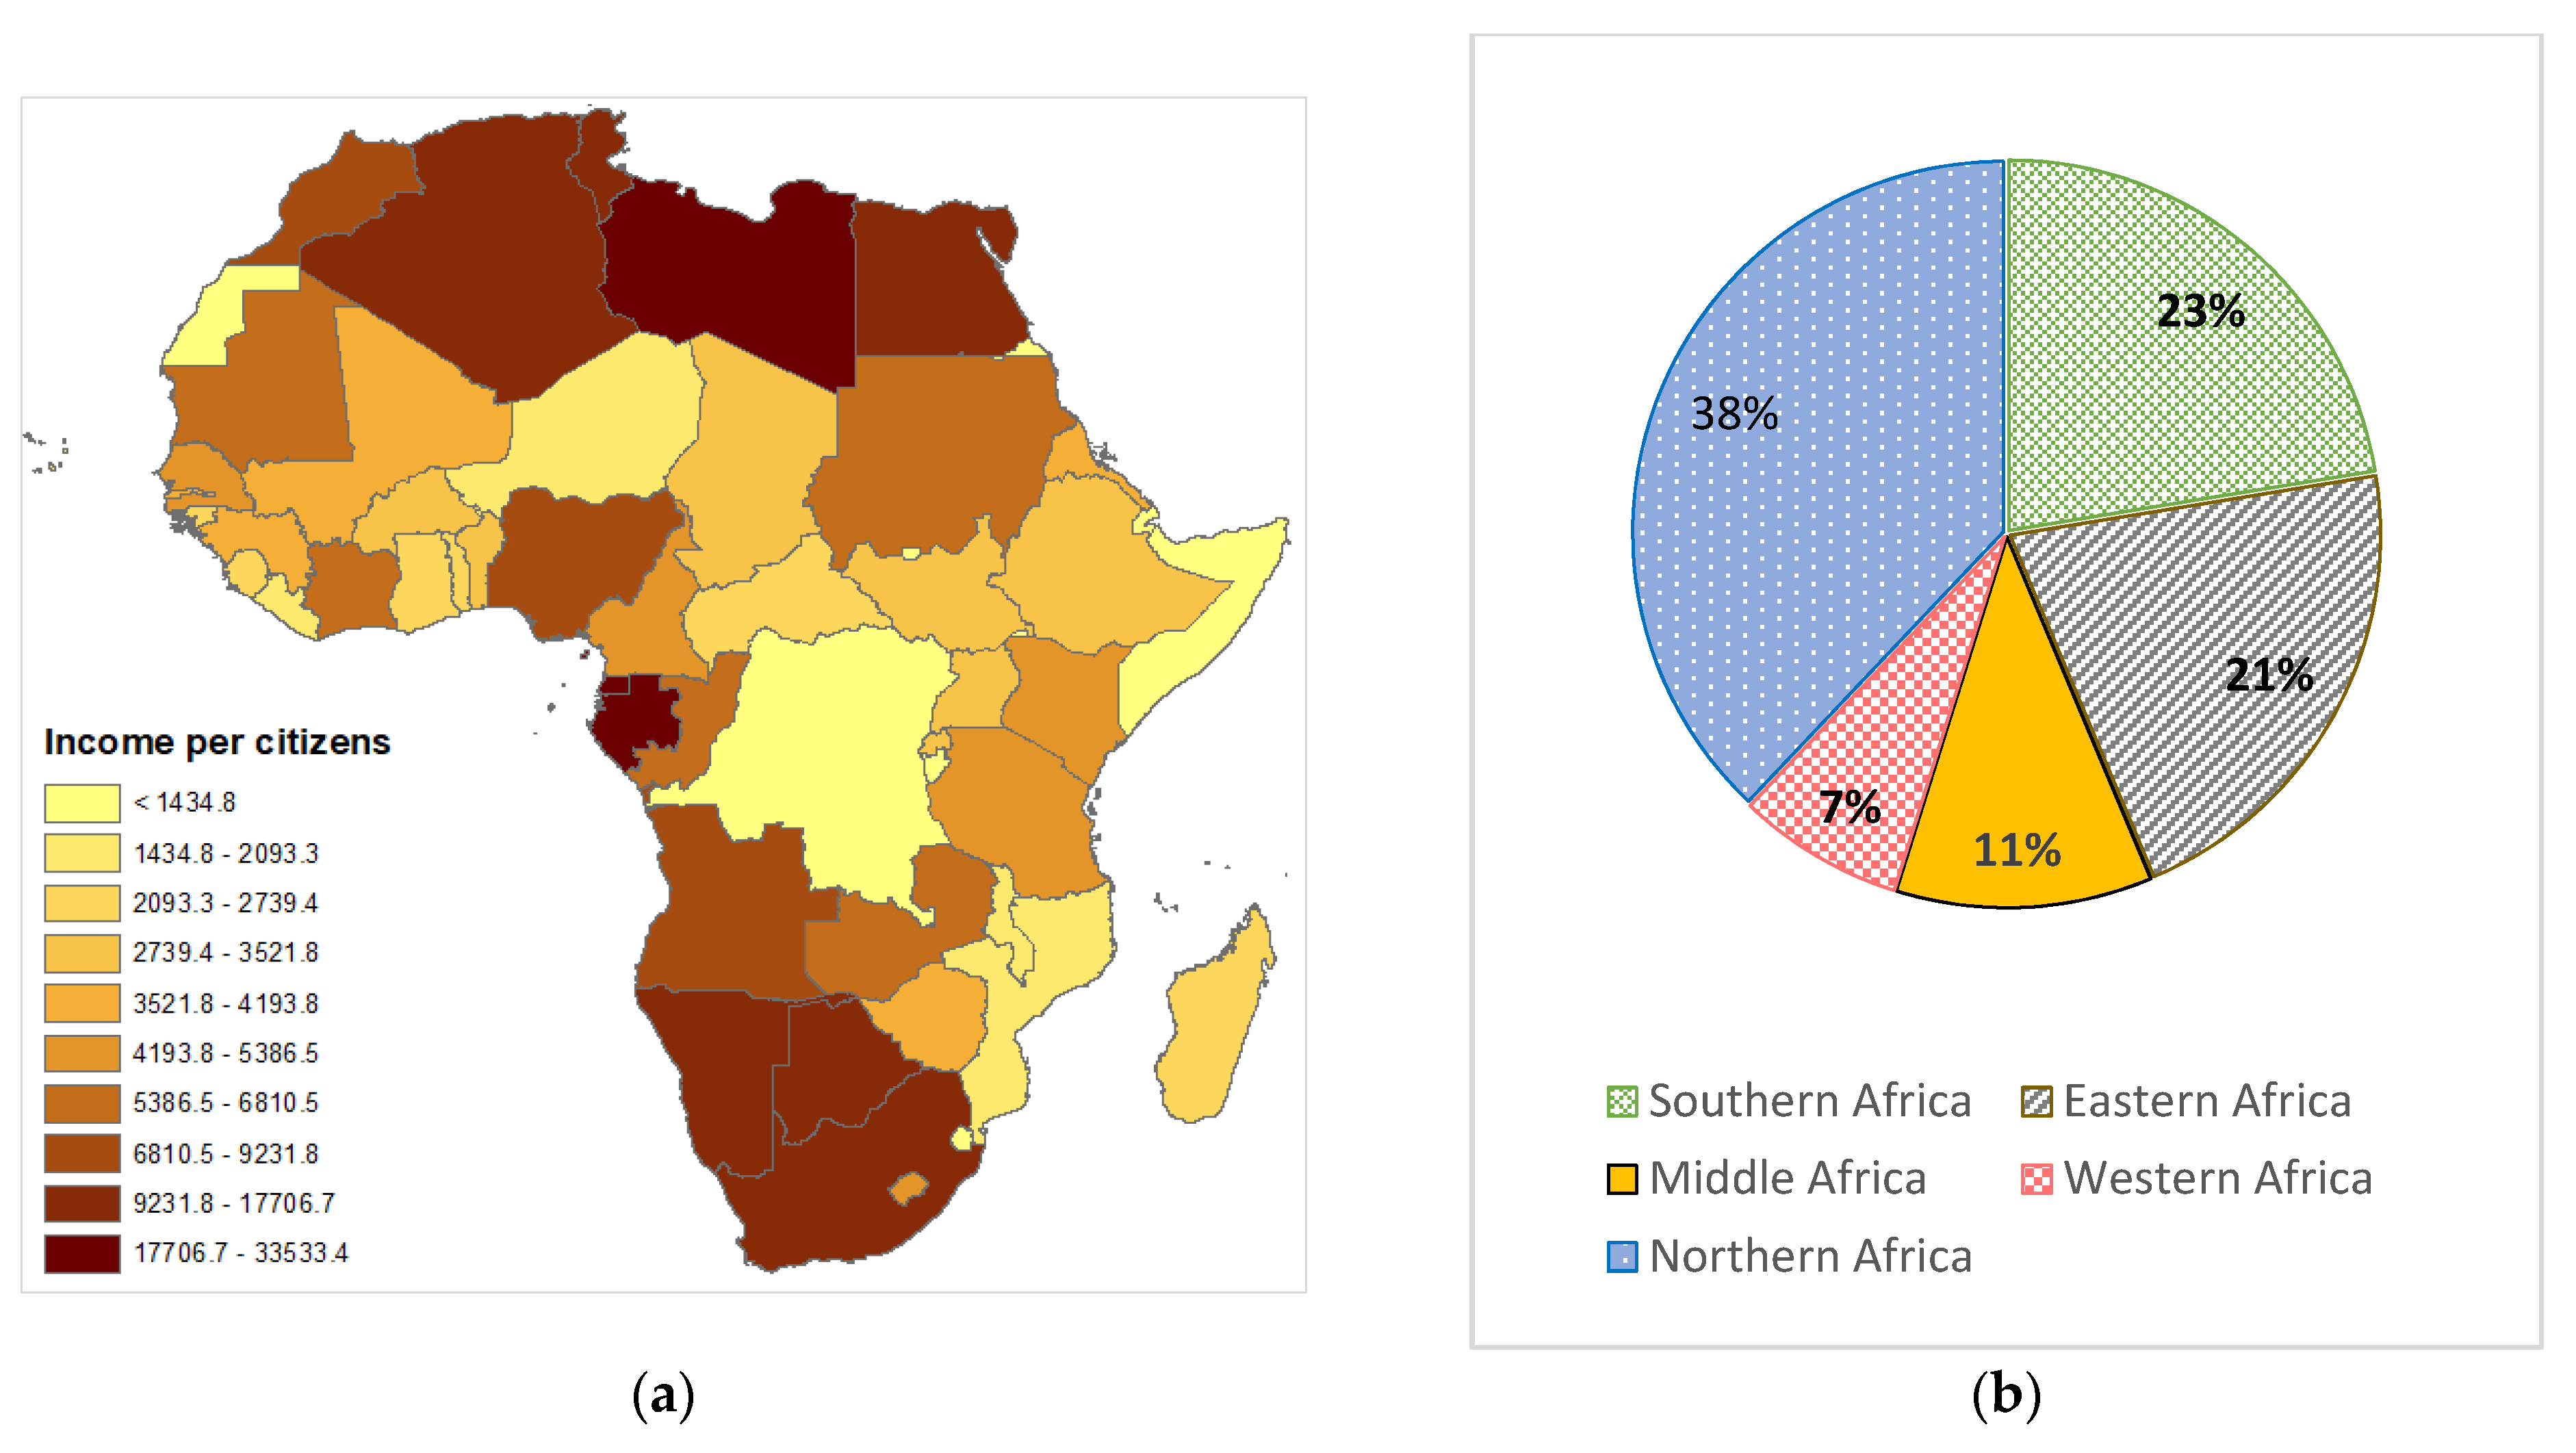
3.2. Relationships Between Wood Charcoal Production, Income and Forest Area Change (Deforestation Rate)

The countries in the East African region recorded the largest deforestation (i.e., forest area change) in Africa during the study period (Figure 3). On the other hand, the North African countries accounted for the lowest forest area change during the past three decades. Ethiopia, Congo DR, Tanzania, Nigeria, Egypt and South Africa had the highest deforestation rate while, Western Sahara, Tunisia, Libya, Morocco and had at most 20,000 ha/year as forest area change. The average income per citizen varied greatly among the countries and regions (Figure 4a,b). The Northern Africa (22,057.1 USD/per citizen) and Southern Africa (13,040.6 USD/citizen) countries had the highest income per citizen while, Eastern Africa, Middle Africa and Western Africa accounted for the lowest income rate having 12,342.4 USD, 6496.5 USD and 4209.2 USD respectively per citizen (Figure 4a). On the country bases, Libya, Egypt, Algeria, Tunisia, Gabon, South Africa, Namibia and Botswana recorded the highest average income per citizen while Congo DR, Niger Rep, Somalia, Western Sahara recorded the lowest (Figure 4b). It is important to state that income per citizen was highly associated with wood charcoal production and deforestation. The result revealed that most of the countries which have higher income per citizen tend to have low wood charcoal production and low deforestation during the study period. For example, all the countries that had a higher income per citizen including Morocco, Tunisia, Algeria, Libya, Egypt, Namibia, Angola, Botswana, and Gabon showed relatively low deforestation except South Africa (Figure 3 and Figure 4a). Additionally, refer to Table 2 where charcoal production from 1990–2019 (Decade 1–3) indicated a significant correlation with income (r = 0.53), while income was significantly correlated with forest cover (r = 0.40). This might probably be attributed to the reason that with higher income, citizens were able to afford other sources of energy than wood charcoal. This consequently, reduced their deforestation rate in comparison with their poor counterparts. Thus, in agreement with this study, [43] concluded that by using charcoal and firewood, the poor majority (72.9%) in Nigeria adapted to the increase in prices of kerosene, cooking gas and electricity. In contrast, other authors revealed that charcoal consumption increased with income [44]. Another study reported that charcoal is not mainly consumed by low-income households rather, it is used across a wide range of income levels with less variation in per capita consumption [17].

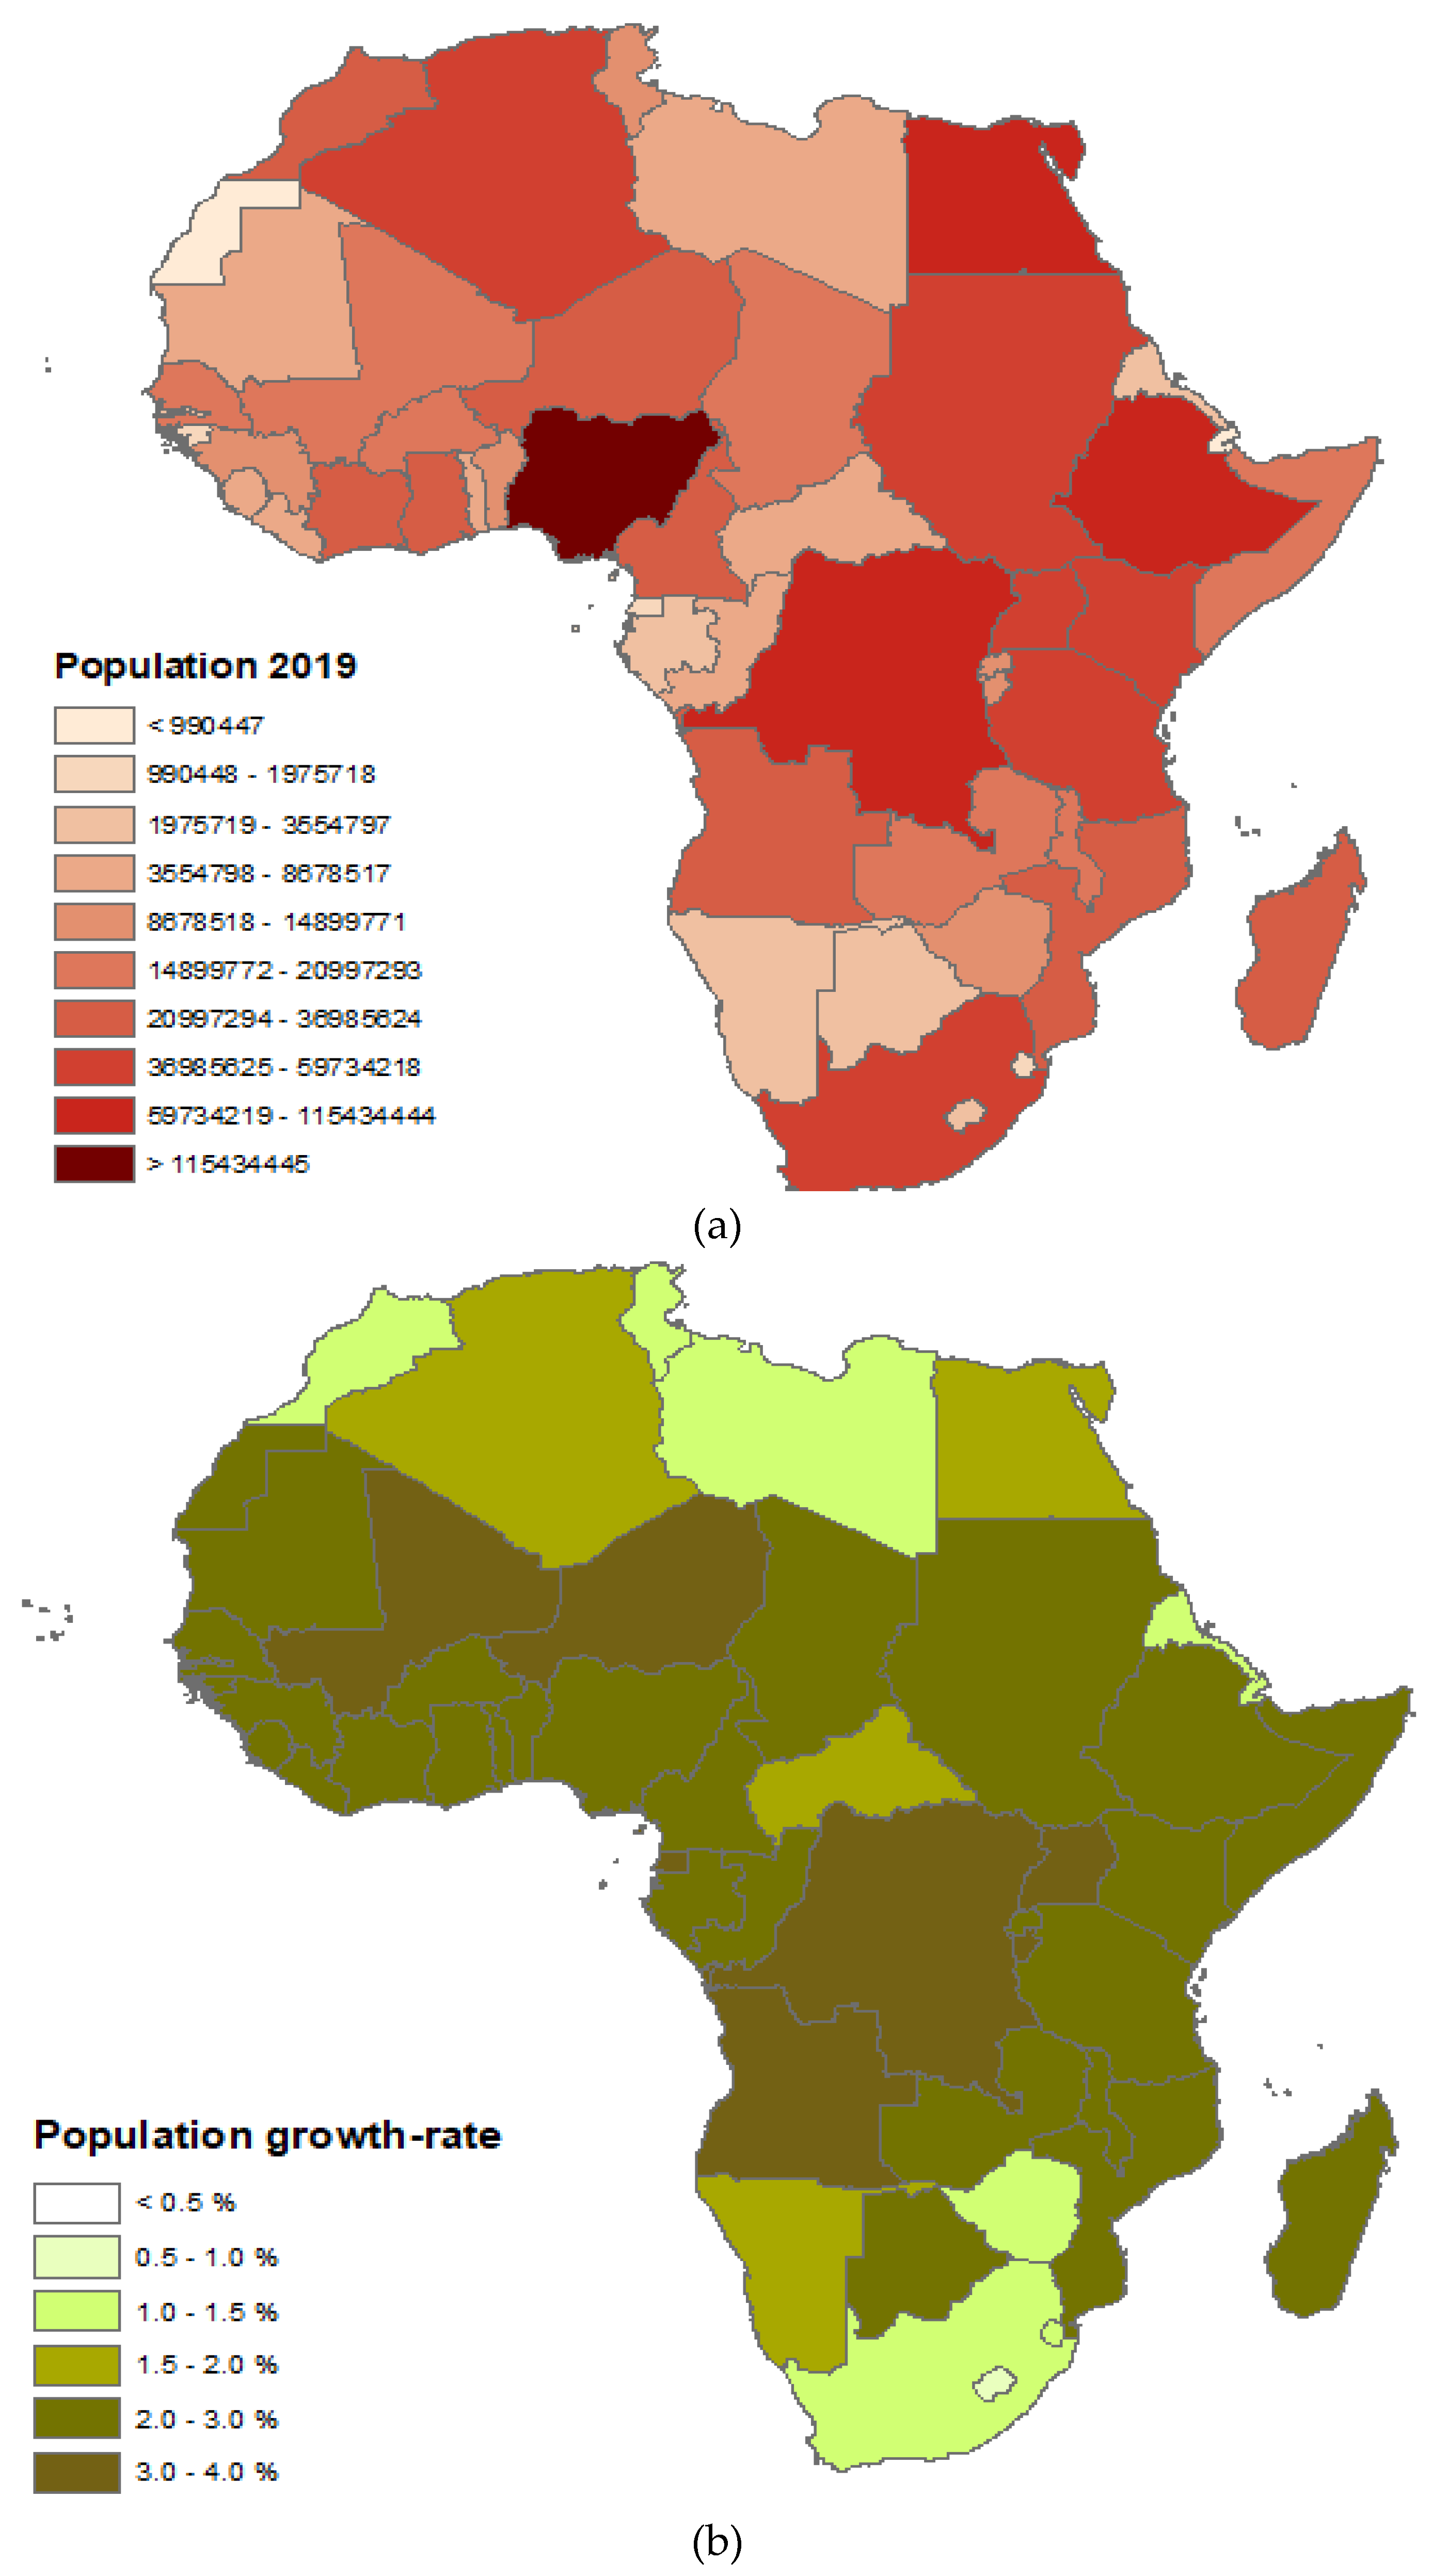
3.3. Population, Export Quantity and Wood Charcoal Production Nexus

The countries with the highest population were Nigeria, Ethiopia, and Congo DR (Figure 5a). In terms of population growth rate, the countries in Western Africa, Eastern Africa and Middle Africa had the highest population growth rate while the Northern African and Sothern African countries had relatively low growth rate (Figure 5b). It could be inferred that the population trend has a clear relationship with wood charcoal production in Africa during the past three decades. The result in Figure 5a,b supports the information in Table 1, which revealed that population and wood charcoal production are strongly correlated. The larger the population, the higher the quantity of wood charcoal produced and consumed by countries [45].
Export quantity is another parameter that showed a significant relationship with wood charcoal production. The result on the export quantity as shown in Table 3 reported that Nigeria, Congo DR, Egypt, Ghana and Tanzania have the highest quantity of wood charcoal export. It could be deduced from the result that most countries that have higher wood charcoal production also had high export quantity. Exceptional cases were Mozambique, Namibia and Somalia which did not record very high wood charcoal production yet were among the countries which had high export quantity. Other exceptional cases were Ethiopia and Senegal which showed high wood charcoal production but had low export quantity. This finding might probably be explained by the quantity of wood charcoal consumed locally. Ethiopia and Senegal were among the countries with a high population, there is the likelihood that because of their large populations, most of their produced wood charcoal is utilized locally for domestic and industrial purposes. Nigeria and Ghana are the only densely populated countries that have high wood charcoal production as well as high export quantity.

3.4. Correlation Matrix between Wood Charcoal Production, Environment and Socioeconomic Factors

The study examined the status of some factors and how they correlate with wood charcoal production in Africa (Table 3). Wood charcoal production in Decade 2 showed a significantly positive correlation with Decade 3. In exemption of the major tree species, the production for the three decades indicated a significant positive correlation with all the measured parameter (such as areas of forest cover, export quantity, export value, GDP, human population, climate season, average income (PPP) per citizen, and literacy rate). Significantly strong negative correlations were recorded between forest cover and wood charcoal production [27,46]. The strong negative correlation of population with the decades agreed with the report by [45], showing that an increase in population leads to an increase in demand for charcoal which in turn has a negative effect on the forest. The export quantity and GDP revealed a strong positive correlation (r = 0.67).

3.5. Dynamics in Wood Charcoal Production and Consumption

Climatic seasonality has been reported as a factor that has a significant effect on forest products especially wood charcoal production [47,48,49,50,51]. Results from the four countries (i.e., Nigeria, Ghana, Senegal and Ethiopia) which recorded high wood charcoal production in the three decades revealed that production was higher in the dry season when compared with the wet season (Table 4). This might be because the dry season is easier to cut trees, transport them, gather the wood in logs, and produce charcoal through traditional kiln-building processes. In the wet season, most roads or forest paths are difficult to access. Further, some landscapes and soils become waterlogged and flooded in the rainy season, and heavy rainstorms are common during the wet season especially in West African countries. Thus, the charcoal processing sites are drenched by rainwater. On the contrary, some authors reported that WCH production is highest during the wet season because of higher demand as firewood is less useful when it rains [42].
With respect to location, the rural areas had higher records for wood charcoal production. The reason is probably linked to larger forest land in the rural areas which has the most suitable tree species for wood charcoal than in the urban centres. In terms of the consumption rate, most poor-urban dwellers use charcoal for their daily energy activities. The rural populace has a higher number in the use of firewood than charcoal. This could be attributed to many reasons including (i) poor or zero electricity source in the rural areas, and/or (ii) lack of money or low income to process the charcoal among the rural people. This finding was consistent with the report by [37], that charcoal consumption accounts for 61% of the fuel (as opposed to 13% in rural households) urban households in Ghana. In sum, though wood charcoal is produced in rural areas, yet its consumption is higher in urban areas where it is used to supplement energy from LPG, electricity and/or kerosene. In Africa and many other developing countries, the rural people who produce charcoal are relatively too poor to use charcoal. This might be highly associated with the fact that charcoal is in high demand in the cities where the price is high and the local producers prefer selling them to increase their income [52]. In Nigeria, Ghana, Senegal and Ethiopia reports have also linked higher wood charcoal usage to the urban centres when compared with the rural areas where most productions are performed [4,5,38,53]. A greater percentage of the total population of most African countries live in rural areas.
Studies have shown that at least 60% of the people in Africa reside in the rural areas. For instance, about 64% (of Nigerians), 70% (of Ghanians), 60% (of Ethiopians), 75% (of Tanzanians), and 78% (of Senegalese) live in rural areas where there is little or no electricity. Therefore, most people depend on wood charcoal and firewood for their domestic cooking and household activities [4,5,37,38]. Besides the rural areas, the majority in urban areas who cannot afford other more expensive energy sources (such as kerosene, Liquefied Petroleum Gas (LPG), and electricity) resort to wood charcoal as an alternative. The difference is that in the urban areas, wood charcoal is the peoples’ preference to other sources of biomass energy while the reverse is the case in the rural areas [16,43].
Pentaclethra macrophlla, Diospyros spp., Letestua durissima, Lophira alata, Milicia excels, and Baphia kirkii were the commonly used tree species in Decade 1 (Figure 6). These tree species available in Decade 1 became very scarce in Decade 3 because it takes a longer time for their propagation, maturity and usage for charcoal. Gmelina arborea, Juniperus procera, Pinus halepensis, Pinus pinaster, Cedrus atlantica, Hagenia abyssinica, Taxus baccata, Hevea brasiliensis and Celba pentandra were the primary tree species in Decade 3. The possibility of easy planting and shorter growing seasons could be the reason for the flourishing of most soft trees in Decade 3 when compared with the slow-growing hardwood species in Decade 1 [54]. The majority of the wood species in Decade 1 are of hardwood and have high fixed carbon content [55], while many in Decade 3 are categorized as either softwoods or pseudo-hardwoods which are considered to produce lower quality charcoal [12]. Decade 2 had a mixture of both hardwood and softwood because there were still some available stands of the hardwood in Decade 2. As the human population increases with a decrease in income (r = −0.58; Table 3), exacerbated use of wood charcoal becomes rampant leading to a decline in hardwood stands. It is also important to mention that in most cases tree species are not as paramount as the tree size [56].

3.6. Implications of the Wood Charcoal Production

The socioeconomics and environmental impacts of wood charcoal production can never be overemphasized as this has recently drawn the attention of many studies [48,50]. Wood charcoal has increased and supported the livelihood, income and revenue of households, individuals and governments of various countries in Africa and other developing countries. In most rural and urban poor, charcoal is a cheap, reliable, convenient and accessible source of energy for households and commercial cooking. Though Kerosene, electricity and LPG may be considered the most desired cooking energy sources in urban areas, their affordability and availability of necessary resources to use these forms of energy are outside the reach of many citizens. Therefore, many households resort to using charcoal.
In contrast to the benefits of wood charcoal production, the negative effects recently associated with wood charcoal are given great concern to decision-makers [8]. In this study, for example, Decade 3 produced higher fumes and CO2, while Decade 2 showed moderate fume and CO2 emissions, and Decade 1 discharged low fumes and CO2 (Figure 6a). The quantities of toxic compound emissions are attributed to the various tree species available in each of the ten-year periods. For example, the common trees used for wood charcoal in Decade 1 were of extremely hardwood type, thus releases low fumes and low CO2 when compared with the softwood species that were predominant in Decade 3. A greater proportion of wood charcoal in Decade 3 including Juniperus procera, Pinus halepensis, Pinus pinaster, Cedrus atlantica, Hagenia abyssinica, Taxus baccata, and Hevea brasiliensis were softwood (Figure 6b). On the other hand, Decade 2 had a mixture of both hardwood and softwood. In 2000, it was reported that overnight carbon monoxide poisoning due to charcoal burning causes thousands of deaths worldwide annually. In Africa, several studies have reported the public health risks associated with smoke and other greenhouse gases (GHGs) released from burning wood charcoal [8,36,57]. In addition to the production of noxious elements, wood charcoal production can contribute to deforestation, global warming, and degradation of forest ecosystem which leads to loss of biodiversity, poor soil quality and consequently low agricultural production [8,17]. Wood charcoal production can also cause the scarcity of some important food sources. Field observations in Africa reported that tree species, such as the Dacryodes edulis (Africa plum), Psidium guajava (Guava tree), Chrysophyllum albidum (African star apple), Artocarpus heterophyllus (Jackfruit tree), Mangifera indica (Mango tree), and Icacina senegalensis are sources of food, yet their trunks are often used for charcoal production [16].

4. Conclusions

During the three decades studied, Nigeria, Ethiopia and Ghana had the highest wood charcoal production in Africa. Most countries that have higher wood charcoal production also had high export quantity. The exceptional cases were Mozambique, Namibia and Somalia which did not record very high wood charcoal production yet were among the countries which had high export quantity. Population and quantity of wood charcoal consumed locally to a large extent affect countries’ export quantity.
Most of the wood species in Decade 1 (i.e., between 1990–1999) were hardwood and have high fixed carbon content whereas, the wood species in Decade 2 (2000–2009) were either softwoods or pseudo-hardwoods which produce lower quality charcoal. Decade 2 comprised both hardwood and softwood tree species. As the human population increases with a decrease in income, exacerbated use of wood charcoal becomes rampant leading to a decline in hardwood stands. This was clearly expressed in the result where softwoods formed more than 85% of the wood species which were dominant in Decade 3 (2010–2019). Wood charcoal is a sustainable livelihood support system for people living in rural, urban and sub-urban areas. Sustainable government policies on commercial wood charcoal production and licensing for revenue and ecological sustainability are necessary to ameliorate excessive deforestation and associated consequences. In addition, enterprise-based approaches for poverty reduction, smallholders’ tree-growing, wood charcoal-energy conserving technologies, improved electricity supply and agricultural productivity are also recommended.

Supplementary Materials

The following are available online at https://www.mdpi.com/article/10.3390/f12050568/s1, Table S1: Average Wood Charcoal Production in tonnes from 1990–2019.

Author Contributions

Conceptualization, I.N. and H.M.; Methodology, C.N.; Software, C.N.; Validation, I.N., C.N., H.M. and P.O.P.; Formal Analysis, C.N.; Investigation, I.N. and C.N.; Resources, I.N. and C.N.; Data Curation, C.N.; Writing—Original Draft Preparation, C.N. and I.N.; Writing—Review & Editing, I.N., C.N, H.M., and P.OP.; Visualization, All authors; Supervision, H.M.; Project Administration, I.N., and H.M.; Funding Acquisition, I.N., and H.M. All authors have read and agreed to the published version of the manuscript.

Funding

This work was supported by the Operational Program Research, Development and Education, the Ministry of Education of the Czech Republic, grant no. CZ.02.1.01/0.0/0.0/16_019/0000803.

Institutional Review Board Statement

Not applicable.

Informed Consent Statement

Not applicable.

Data Availability Statement

The data presented in this study are available on request from the corresponding author. The data are not publicly available due to the processing of data relative to different sources, some of them retrieved throughout extensive interview campaign, others through institutional databases, while some from published literature.

Acknowledgments

The Faculty of Forestry and Wood Sciences, Czech University of Life Sciences is acknowledged. Support from individuals who were interviewed in some of the countries is also acknowledged.

Conflicts of Interest

The authors declare no conflict of interest.

References

  1. Demirbas, A. Carbonization ranking of selected biomass for charcoal, liquid and gaseous products. Energy Convers. Manag. 2001, 42, 1229–1238. [Google Scholar] [CrossRef]
  2. Deforce, K.; Boeren, I.; Adriaenssens, S.; Bastiaens, J.; de Keersmaeker, L.; Haneca, K. Selective woodland exploitation for charcoal production. A detailed analysis of charcoal kiln remains (ca. 1300–1900 AD) from Zoersel (Northern Belgium). J. Archaeol. Sci. 2013, 40, 681–689. [Google Scholar] [CrossRef]
  3. Alcaide, M.Á.M.; Torti, J.L.S.; Peña, L.Z. Lighting the dark: Wood charcoal analysis from Cueva de Nerja (Málaga, Spain) as a tool to explore the context of Palaeolithic rock art. Comptes Rendus Palevol 2015, 14, 411–422. [Google Scholar] [CrossRef]
  4. Jekayinfa, S.O.; Orisaleye, J.I.; Pecenka, R. An Assessment of Potential Resources for Biomass Energy in Nigeria. Resources 2020, 9, 92. [Google Scholar] [CrossRef]
  5. Mensah, K.E.; Damnyag, L.; Kwabena, S.N. Analysis of charcoal production with recent developments in Sub-Sahara Africa: A review. Afr. Geogr. Rev. 2020. [Google Scholar] [CrossRef]
  6. Mwampamba, T.H.; Ghilardi, A.; Sander, K.; Chaix, K.J. Dispelling common misconceptions to improve attitudes and policy outlook on charcoal in developing countries. Energy Sustain. Develop. 2013, 17, 75–85. [Google Scholar] [CrossRef]
  7. Ngahane, M.B.H.; Afane, Z.E.; Chebu, C. Effects of cooking fuel smoke on respiratory symptoms and lung function in semi-rural women in Cameroon. Int. J. Occup. Environ. Health 2015, 21, 61–65. [Google Scholar] [CrossRef] [PubMed] [Green Version]
  8. Bede-Ojimadu, O.; Orisakwe, O.E. Exposure to Wood Smoke and Associated Health Effects in Sub-Saharan Africa: A Systematic Review. Ann. Glob. Health 2020, 86, 1–27. [Google Scholar] [CrossRef] [PubMed] [Green Version]
  9. Okello, G.; Devereux, G.; Semple, S. Women and girls in resource-poor countries experience much greater exposure to household air pollutants than men: Results from Uganda and Ethiopia. Environ. Int. 2018, 119, 429–437. [Google Scholar] [CrossRef]
  10. Zulu, L.C. The forbidden fuel: Charcoal, urban woodfuel demand and supply dynamics, community forest management and woodfuel policy in Malawi. Energy Policy 2020, 38, 3717–3730. [Google Scholar] [CrossRef]
  11. Zulu, L.C.; Richardson, R.B. Charcoal, livelihoods, and poverty reduction: Evidence from Sub-Saharan Africa. Energy Sustain. Dev. 2013, 17, 127–137. [Google Scholar] [CrossRef]
  12. Ankona, E.; Multanen, V.; Nisnevitch, M.; Billig, M.; Anker, Y. Investigation of pyrolysis kinetics and gaseous compounds emitted during charcoal production from woods commonly used in the Eastern Mediterranean. Biofuelsbioprod. Bioref. 2021. [Google Scholar] [CrossRef]
  13. UN-DESA. Energy Statistics Yearbook; United Nations, Department of Economic and Social Affairs: New York, NY, USA, 2019; Available online: https://digitallibrary.un.org/record/3846782 (accessed on 15 January 2021).
  14. FAOSTAT Comparative Data. 2019. Available online: http://www.fao.org/faostat/en/#compare (accessed on 15 January 2021).
  15. FAOSTAT and Energy Statistics Database; United Nations Statistics Division, 2019; Available online: http://www.fao.org/faostat/en/#home (accessed on 9 December 2020).
  16. Nabukalu, C.; Gieré, R. Charcoal as an Energy Resource: Global Trade, Production and Socioeconomic Practices Observed in Uganda. Resources 2019, 8, 183. [Google Scholar] [CrossRef] [Green Version]
  17. Bamwesigye, D.; Kupec, P.; Chekuimo, G.; Pavlis, J.; Asamoah, O.; Samuel, A.; Darkwah, S.A.; Hlaváčková, P. Charcoal and Wood Biomass Utilization in Uganda: The Socioeconomic and Environmental Dynamics and Implications. Sustainability 2020, 12, 8337. [Google Scholar] [CrossRef]
  18. Nkengfack, H.; Fotio, H.K. Anthropogenic CO2 emission and climate change in the Congo basin countries. Eur. J. Comp. Econs. 2020, 17, 205–227. [Google Scholar]
  19. Ahrends, A.; Burgess, N.D.; Milledge, S.A.H.; Bulling, M.T.; Fisher, B.; Smart, J.C.R. Predictable waves of sequential forest degradation and biodiversity loss spreading from an African city. Proc. Natl. Acad. Sci. USA 2010, 107, 14556–14561. [Google Scholar] [CrossRef] [PubMed] [Green Version]
  20. Habel, J.C.; Zamora, C.; Rödder, D.; Teucher, M.; Cuadros Casanova, I.; Fischer, C. Using indicator species to detect high quality habitats in an East African forest biodiversity hotspot. Biodiv. Conserv. 2021, 30, 903–915. [Google Scholar] [CrossRef]
  21. Massuque, J.; De Assis, M.R.; Loureiro, B.A.; Matavel, C.; Trugilho, P.F. Influence of lignin on wood carbonization and charcoal properties of Miombo woodland native species. Eur. J. Wood Prod. 2021. [Google Scholar] [CrossRef]
  22. Agyei, F.K.; Hansen, C.P.; Acheampong, E. Forestry officials don’t have any land or rights here: Authority of politico-legal institutions along Ghana’s charcoal commodity chain. J. Rural Stud. 2019, 72, 264–272. [Google Scholar] [CrossRef]
  23. Sola, P.; Schure, J.; Atyi, R.E.; Gumoo, D.; Okeyo, I.; AwoNo, A. Woodfuel policies and practices in selected countries in Sub-Saharan Africa—A critical review. Bois For. Des Trop. 2019, 340, 27–41. [Google Scholar] [CrossRef]
  24. Wassie, Y.T.; Adaramola, M.S. Potential environmental impacts of small-scale renewable energy technologies in East Africa: A systematic review of the evidence. Renew. Sustain. Energy Rev. 2019, 111, 377–391. [Google Scholar] [CrossRef]
  25. Chidumayo, E.N. Long term impacts of crop cultivation and tree shading on Piliostigma thonningii (Schumach) Milne-Redhead population, growth and biomass production after charcoal production in central Zambia. Glob. Ecol. Conserv. 2018, 13, e00373. [Google Scholar] [CrossRef]
  26. World Bank Groups Database on Literacy Rate. 2020. Available online: https://data.worldbank.org/indicator/SE.ADT.LITR.ZS (accessed on 21 February 2021).
  27. Ndegwa, G.; Anhuf, D.; Nehren, U.; Ghilardi, A.; Iiyama, M. Charcoal contribution to wealth accumulation at different scales of production among the rural population of Mutomo District in Kenya. Energy Sustain. Develop. 2016, 33, 167–175. [Google Scholar] [CrossRef]
  28. Marfo, E.; Owusu, F.W.; Damnyag, L.; Adeyiga, G.; Karambiri, M. Domestic Timber Markets and Trade in Ghana; Tropenbos International: Wageningen, The Netherlands, 2016. [Google Scholar]
  29. United Nations Statistics Division, UNdata. Wood Charcoal Report in African Countries: UNdata. 2019. Available online: https://data.un.org/ (accessed on 11 January 2021).
  30. World Bank. World Development Indicators 2019. Available online: http://data.worldbank.org/datacatalog (accessed on 27 December 2020).
  31. World Income Inequalities Databases (WID). 2019. Available online: https://wid.world/ (accessed on 4 January 2021).
  32. Nguyen, L.H.; Holmes, S. Ten quick tips for effective dimensionality reduction. PLoS Comput. Biol. 2019, 15, e1006907. [Google Scholar] [CrossRef] [PubMed] [Green Version]
  33. Ter Braak, C.J.F.; Smilauer, P. Canoco 5, Windows Release (5.12). Software for Multivariate Data Exploration, Testing, and Summarization; Biometris, Plant Research International: Wageningen, The Netherlands, 2012. [Google Scholar]
  34. TIBCO Software Inc. Statistica (Data Analysis Software System); Version 13.3; Statsoft Inc.: Tulsa, OK, USA, 2017. [Google Scholar]
  35. ESRI. ArcGIS Desktop: Release 10; Environmental Systems Research Institute: Redlands, CA, USA, 2019. [Google Scholar]
  36. Downward, G.S.; van der Zwaag, H.P.; Simons, L. Occupational exposure to indoor air pollution among bakery workers in Ethiopia: A comparison of electric and biomass cookstoves. Environ Pollut. 2018, 233, 690–697. [Google Scholar] [CrossRef] [PubMed]
  37. Anang, B.T.; Akuriba, M.A.; Alerigesane, A.A. Charcoal production in Gushegu District, Northern Region, Ghana: Lessons for sustainable forest management. Int. J. Environ. Sci. 2011, 1, 1944–1953. [Google Scholar]
  38. Wurster, K.W. Management Matter? Effects of Charcoal Production Management on Woodland Regeneration in Senegal. Ph.D. Dissertation, University of Maryland, Maryland, USA, 2010; p. 10. Available online: http://drum.lib.umd.edu/bitstream/1903/10307/1/Wurster_umd_0117E_11139.pdf (accessed on 3 February 2021).
  39. Rahma, M.M. Increase in deforestation: A key challenge to household charcoal supply—A case of Tanga urban, Tanzania. Eur. J. Soc. Sci. Stud. 2017, 2, 132–152. [Google Scholar]
  40. Sedano, F.; Silva, J.A.; Machoco, R.; Meque, C.H.; Sitoe, A.; Ribeiro, N.; Anderson, K.; Ombe, Z.O.; Baule, S.H.; Tucker, C.J. The impact of charcoal production on forest degradation: A case study in Tete, Mozambique. Environ. Res. Lett. 2016, 11, 094020. [Google Scholar] [CrossRef]
  41. Kambewa, P.; Mataya, B.; Sichinga, K.; Johnson, T. Charcoal: The Reality—A Study of Charcoal Consumption, Trade and Production in Malawi; Small and Medium Forestry Enterprise Series No. 21; International Institute for Environment and Development: London, UK, 2007. [Google Scholar]
  42. CHAPOSA. Charcoal Potential in Southern Africa: Final report for Tanzania. 2001. Available online: /http://www.sei.se/chaposa/documents/final_report/S (accessed on 14 January 2021).
  43. Adelekan, I.O.; Jerome, A.T. Dynamics of household energy consumption in a traditional African city, Ibadan. Environmentalist 2006, 26, 99–110. [Google Scholar] [CrossRef]
  44. Arnold, J.E.M.; Köhlin, G.; Persson, R. Woodfuels, livelihoods, and policy interventions: Changing perspectives. World Develop. 2006, 34, 596–611. [Google Scholar] [CrossRef]
  45. Food and Agriculture Organization. The Global Forest Assessment (FAO-GFA) from Frederick, A.B. Meyerson, “Population, Biodiversity and Changing Climate,” Advances in Applied Biodiversity Science 4; Population Bulletin: Washington, DC, USA, 2003. [Google Scholar]
  46. Chiteculo, V.; Lojka, B.; Surov, P.; Verner, V. Value chain of charcoal production and implications for forest degradation: Case study of Bi é Province, Angola. Environments 2018, 5, 113. [Google Scholar] [CrossRef] [Green Version]
  47. Mba, E.H. Assessment of Charcoal Production Processes and the Environment Impact in Kaduna, Nigeria. Res. Environ. 2018, 8, 223–231. [Google Scholar]
  48. Udali, A.; Andrighetto, N.; Grigolato, S.; Gatto, P. Economic Impacts of Forest Storms—Taking Stock of After-Vaia Situation of Local Roundwood Markets in Northeastern Italy. Forests 2021, 12, 414. [Google Scholar] [CrossRef]
  49. Liu, Y.; Li, S.; Wang, Y.; Liu, P.; Han, W. De novo assembly of the seed transcriptome and search for potential EST-SSR markers for an endangered, economically important tree species: Elaeagnus mollis. Diels. J. For. Res. 2020, 31, 759–767. [Google Scholar] [CrossRef]
  50. Crespo-Cuaresma, J.; Danylo, O.; Fritz, S.; McCallum, I.; Obersteiner, M.; See, L.; Walsh, B. Economic Development and Forest Cover: Evidence from Satellite Data. Sci. Rep. 2017, 7, 40678. [Google Scholar] [CrossRef] [PubMed] [Green Version]
  51. Seidl, R.; Thom, D.; Kautz, M.; Martin-Benito, D.; Peltoniemi, M.; Vacchiano, G.; Wild, J.; Ascoli, D.; Petr, M.; Honkaniemi, J.; et al. Forest disturbances under climate change. Nat. Clim. Chang. 2017, 7, 395–402. [Google Scholar] [CrossRef] [Green Version]
  52. Kammen, D.M.; Lew, D.J. Review of Technologies for the Production and Use of Charcoal; Renewable and Appropriate Energy Laboratory Report; Energy and Resources Group & Goldman School of Public Policy, University of California: Berkeley, CA, USA, 2005. [Google Scholar]
  53. Kindu, M.; Schneider, T.; Teketay, D.; Knoke, T. Drivers of land use/land cover changes in Munessa-Shashemene landscape of the south-central highlands of Ethiopia. Environ. Monitor. Assess. 2015, 187, 1–17. [Google Scholar] [CrossRef] [PubMed]
  54. Iiyama, M.; Neufeldt, H.; Dobie, P.; Jamnadass, R.; Njenga, M.; Ndegwa, G. The potential of agroforestry in the provision of sustainable woodfuel in subSaharan Africa. Curr. Opin. Environ Sustain. 2014, 6, 138–147. [Google Scholar] [CrossRef] [Green Version]
  55. Chandrasekaran, A.; Subbiah, S.; Bartocci, P.; Yang, H.; Fantozzi, F. Carbonization using an Improved Natural Draft Retort Reactor in India: Comparison between the performance of two woody biomasses, Prosopis juliflora and Casuarina equisetifolia. Fuel 2021, 285, 119095. [Google Scholar] [CrossRef]
  56. Herd, A.R.C. Exploring the Socio-Economic Role of Charcoal and the Potential for Sustainable Production in the Chicale Regulado, Mozambique. Unpublished Master’s Dissertation, University of Edinburgh, Edinburgh, UK, 2007. [Google Scholar]
  57. PrayGod, G.; Mukerebe, C.; Magawa, R.; Jeremiah, K.; Torok, M.E. Indoor air pollution and delayed measles vaccination increase the risk of severe pneumonia in children: Results from a case-control study in Mwanza, Tanzania. PLoS ONE 2016, 11, e0160804. [Google Scholar] [CrossRef] [PubMed]
Figure 1. Average Wood Charcoal Production from 1990–2019, (a) Decade 1 (1990–1999), (b) Decade 2 (2000–2009), and (c) Decade 3 (2010–2019). Sources: Authors’ compilation, analysis and mapping from FAOSTAT database.
Forests 12 00568 g001aForests 12 00568 g001b
Figure 2. Total wood charcoal production in Africa from 1990 to 2019. Sources: Authors’ compilation, analysis and mapping from FAOSTAT database.
Forests 12 00568 g002
Figure 3. Deforestation (forest area change) in African countries from 1990 to 2020 in 1000 ha/year. Sources: Authors’ compilation, analysis and mapping from FAO, FAOSTAT, and FRA databases.
Forests 12 00568 g003
Figure 4. Average income (PPP) per citizens in USD* from 1990–2019 (a) for all African countries, (b) proportion on regional basis. * The income per citizen was in “inflation-adjusted dollars” based on 2010. The reason for choosing 2010 is explained in the material and method. Sources: Authors’ compilation, analysis and mapping from WID, WB, and WDI databases.
Forests 12 00568 g004
Figure 5. Africa Population in million (a), and Population growth rate (b). Sources: Authors’ compilation, analysis and mapping from UN-DESA, WB, and WDI databases.
Forests 12 00568 g005
Figure 6. Biplot from the multivariate analysis of ordination showing the study decades and their associated common tree species for the wood charcoal production in the four countries (Nigeria, Ghana, Senegal and Ethiopia). (a) Indicated the distribution of species and their pollution emission (fumes and CO2) status for each decade, (b) showed the proportion of species for each decade. Description of the plant species abbreviations is shown in Table 4.
Forests 12 00568 g006
Table 1. Wood charcoal production (in tonnes) and percentages (%) by African regions in three decades (1990–2019).
Regions1990–1999 (Decade 1)2000–2009 (Decade 2)2010–2019 (Decade 3)1990–2019 (Decade 1–3)
Average (%)Average (%)Average (%)Average (%)
West Africa5,614,359 (31.0%)7,862,442 (31.9%)10,354,880 (32.8%)23,831,683 (32.1%)
East Africa7,930,171 (43.8%)10,610,042 (43.1%)13,518,030 (42.8%)32,058,244 (43.2%)
North Africa2,562,088 (14.2%)2,880,039 (11.7%)3,208,079 (10.2%)8,650,207 (11.6%)
Middle Africa1,791,318 (9.9%)2,836,268 (11.5%)3,892,742 (12.3%)8,520,329 (11.5%)
South Africa205,734 (1.1%)426,917 (1.7%)592,411 (1.9%)1,225,062 (1.6%)
Sources: Authors’ compilation and analysis.
Table 2. Summary of Correlation analyses among the studied parameters. Decade 1 (1990–1999), Decade 2 (2000–2009), and Decade 3 (2010–2019), Decade 1-3 (1990–2019).
Decade 1Decade 2Decade 3Decade 1-3Forest CovExport QttyExport ValGDPClim SesonTree SppPopIncomeLit Rate
Decade11.00
Decade20.551.00
Decade30.410.59 *1.00
Decade1-30.63 *0.680.44 *1.00
ForestCov−0.65 **−0.74 **−0.81 **−0.77 **1.00
ExportQtty0.60 *0.57 *0.72 **0.59 *−0.88 **1.00
ExportVal0.68 *0.63 *0.52 *0.62 *−0.75 **0.59 *1.00
GDP0.340.500.65 *0.54 *0.280.67 **0.471.00
ClimSeson−0.47 *−0.55 *−0.71 **−0.58 *−0.61 *−0.090.00−0.161.00
TreeSpp0.080.010.090.170.220.000.020.00−0.64 **1.00
Pop−0.52 *−0.64 *−0.71 *−0.91 *−0.83 **0.01−0.05−0.73 *0.000.001.00
Income0.210.190.080.53 *0.40 *0.320.280.60 *−0.230.07−0.58 *1.00
LitRate0.040.000.010.45 *0.270.000.000.51 **0.000.00−0.79 **0.53 *1.00
Sources: Authors’ analysis. * Correlation is statistically significant at p < 0.05; ** Correlations is statistically significant at p < 0.01. Description of Abbreviations: ForestCov = Forest cover; ExportQtty = Export quantity; ExportVal = Export Value; GDP = Gross Domestic Product; ClimSeason = Climatic season; TreeSpp = Tree species; Pop = Population; LitRate = Literacy rate.
Table 3. Wood charcoal export (in tonnes) by African countries for three decades (1990–2019).
CountryExport QuantityCountryExport Quantity
Algeria4200Madagascar334,467
Angola2910Malawi1938
Benin6220Mali1597.5
Botswana1321Mauritania540
Burkina Faso360,000Mauritius390
Burundi159Morocco5106
Cameroon1875Mozambique1,025,724
C.A.R660Namibia1,422,746
Chad60Niger2354
Comoros0Nigeria1,544,945
Congo360Rwanda19,314
Côte d’Ivoire58,344Sao Tome and Principe0
DRC Congo1,592,357Senegal95,909
Djibouti264,046Seychelles150
Egypt1,620,884Sierra Leone1443
Equ. Guinea6060Somalia2,015,899
Eswatini27,131South Africa892,399
Ethiopia1575Sudan30,009
Gabon324South Sudan464
Gambia8982Togo1485
Ghana964,991Tunisia4789
Guinea4393.5Tanzania1,174,089
Guinea-Bissau1573.5Uganda3349
Kenya6322Western Sahara0
Liberia10,224Zambia8790
Libya450Zimbabwe53,876
Sources: Authors’ research, compilation and analysis based on data from FAO/FRA, and Annual Reports from individual countries.
Table 4. Common tree species used for the production of wood charcoal in Africa (1990–2019).
Scientific Name of Tree SpeciesSpecies Structural Production Season
AbbreviationsCompositionWetDry
Dialium bipindenseDialBipiExtremely hardLowHigh
Diospyros spp.DiospSppExtremely hardLowHigh
Pentaclethra macrophllaPentMacroExtremely hardLowHigh
Letestua durissimaLeteDuriExtremely hardLowHigh
Lophira alataLophAlatExtremely hardLowHigh
Milicia excelsaMiliExceExtremely hardLowHigh
Baphia kirkiiBaphKirkExtremely hardLowHigh
Cleistanthus mildbraediiCleiMildVery hardLowHigh
Cylicodiscus gabonensisCyliGaboHardLowHigh
Desbordesia pierreanaDesbPierHardLowHigh
Manilkara cuneifoliaManiCuneHardLowHigh
Parinari glabraPariGlabHardLowHigh
Strombosia glaucescensStroGlauHardLowHigh
Swartzia fistuloidesSwarFistHardLowHigh
Tessmania africanaTessAfriHardLowHigh
Klainedoxa gabonensisKlaiGabohardLowHigh
Afzelia africana sppAfzeAfriHardLowHigh
Piptadeniastrum africanumPiptAfriHardLowHigh
Triplochiton scleraxylonTripScleLightly hardLowHigh
Gmelina arboreaGmelArboSoftFairly highHigh
Juniperus proceraJuniProcsoftLowHigh
Pinus halepensisPinuHalesoftLowHigh
Pinus pinasterPinuPinasoftLowHigh
Cedrus atlanticaCedrAtlasoftLowHigh
Hagenia abyssinicaHageAbyssoftLowHigh
Taxus baccataTaxuBaccsoftLowHigh
Hevea brasiliensisHeveBrasVery softLowHigh
Celba pentandraCelbPentExtremelysoftLowHigh
Sources: Online publications, National statistics of various countries. Interview with the loggers, foresters, wood charcoal producers and other stakeholders.
Publisher’s Note: MDPI stays neutral with regard to jurisdictional claims in published maps and institutional affiliations.

