Abstract
Few studies have evaluated the application of biochar to forest ecosystems and their responses under field conditions. We manually spread grounded biochar on the forest floor, at rates of 0 (control), 5, and 10 Mg ha−1 (C0, C5 and C10, respectively), of an oak forest in central Japan to test the effects of biochar on tree growth and productivity. The relative growth rate of the diameter at breast height (dbh) of canopy oak trees (dbh > 20 cm) significantly increased in C10 compared with that of the control (C0), but not in C5, in the second to third years after application. Despite the increasing growth rate of canopy trees, foliage production (NPPF) and woody production (NPPW) did not respond to biochar application. Conversely, the production of reproductive organs (NPPR, mainly oak acorns) increased in line with the biochar application rate gradients (1.04 ± 0.09 Mg ha−1 yr−1 in C0, 1.30 ± 0.08 Mg ha−1 yr−1 in C5, and 1.47 ± 0.13 Mg ha−1 yr−1 in C10). Since the contribution of NPPR to total NPP was fairly small, there were no significant differences in total NPP (=NPPW + NPPF + NPPR) for C5 (14.57 ± 0.20 Mg ha−1 yr−1) or C10 (16.11 ± 0.73 Mg ha−1 yr−1) compared with the control (15.07 ± 0.48 Mg ha−1 yr−1).
1. Introduction
Biochar is a product of the thermal degradation of organic matter, such as plant residues, in the absence of oxygen; this process is known as pyrolysis [1]. Many types of organic matter, such as trees, grasses, and crop residues, can be converted into biochar. Since biochar has a long life span, the application of biochar to soil for the purpose of storing carbon (C) has been suggested as one possible means of reducing atmospheric CO2 concentrations [2]. Recently, biochar has been commonly applied to arable land not only for the purpose of C storage in soil, but also for soil amendment, to enhance crop productivity. Numerous studies have addressed the effects of the addition of biochar on soil properties, crop growth, and productivity [1,3,4,5]. Biochar soil amendment experiments have demonstrated an 11.0% increase in productivity over controls on average, with a much higher increase in crop productivity when applied to sandy and/or acidic soils [4]. On the other hand, the effects of biochar on crop growth are highly variable when viewed in individual cases, with responses ranging from increased growth to decreased growth [6] or no response [7]. Jeffery et al. [8] also revealed that biochar has no effect on crop yield in temperate latitudes, yet elicits a 25% average increase in yield in the tropics.
Sequestration of CO2 through afforestation and the use of woody biomass as bio-energy have been accepted as carbon neutral methods, because a forest ecosystem naturally sequesters CO2 through their biomass or in soil organic matter. Lehman [9] recently demonstrated the potential of turning bioenergy into a carbon-negative industry by using biochar in forest ecosystems. He suggested that the ability of forest ecosystems to sequester C can be taken a step further via the pyrolysis of plant biomass into biochar. Although half of the C in the litter is released into the atmosphere as CO2 with pyrolysis, pyrolysis converts woody materials at a twofold higher carbon content and biochar locks rapidly decomposable C from plant biomass into a much durable form. Moreover, the storage capacity of biochar is not limited in the same way as biomass sequestration [9]. In addition to C storage in biochar, if biochar application has a positive effect on forest productivity as well as arable lands, it may be possible to strengthen the C negative effect by increasing the absorption rate of CO2 from the atmosphere by trees.
There have been some reviews of the application of biochar to examine its effects on tree growth and productivity, mainly using pot experiments [10,11]. For example, Heiskanen et al. [12] measured the growth of Norway spruce seedlings after transplantation into pots with soil enhanced with biochar. Biochar was mixed into alluvial silty soil in volume proportions of 0, 15, 30, 45, and 60%. There was an unclear trend of seedling growth with the application rate gradients, although no negative effect of the addition of biochar was noted, even at the highest application rate. Lin et al. [13] conducted a mesocosm experiment of the effects of biochar application on tree seedling growth. Soil was collected at a depth of 100 cm from open land in a forest, and two 2-year-old pine trees (Pinus elliottii) were transplanted to each mesocosm. The study revealed that chicken manure biochar provided at 2.4 kg m−2 increased tree net primary production (NPP; aboveground biomass plus litterfall) by approximately 180%. In contrast, Saruer and Coleman [14,15] showed that using biochar did not improve Douglas fir seedling growth when the seedlings were grown in containers with biochar-amended peat-based growing media in greenhouses. Nonetheless, each of these previous studies reported the effect of biochar on tree seedlings or saplings, yet few studies have been conducted using direct forest site investigation [16,17].
Until the 1960s, Japanese forests near and around human settlements were used as an energy source, such as for charcoal or firewood. These forests were later abandoned to become secondary forests, because of the rapid decline in the demand for woody energy, or were transformed into plantations. Consequently, Japan has the third-highest forest rate (68.4%) among OECD member countries, well above the world average of 31.0% [18]. Japanese forests are 41% plantations (mainly evergreen coniferous forest) and 59% natural forests, including secondary forests [19]. Secondary forests of abandoned coppice oak (Quercus serrata Thunb. ex Murray) are widely distributed throughout the rural area of the subtropical/warm-temperate regions in central Japan. We have conducted multiple direct large-scale field manipulations to detect the effects of the application of biochar on these secondary forests. Minamino et al. [20] investigated the effect of the application of biochar on leaf litter decomposition, using a litter bag technique, on the present study site, concluding that the addition of biochar enhanced the litter decomposition. Now, we hypothesize that biochar addition will increase tree growth and plant productivity through increasing litter decomposition. This study aimed to evaluate the effects of biochar on growth rate and forest productivity, including woody parts, foliage, and reproductive organs, using a large-scale field experiment in a deciduous forest conducted over the first three years after application.
2. Materials and Methods
2.1. Study Site
A field experiment was conducted in a secondary deciduous forest in Honjo Waseda Research Park, central Japan (36°12′ N, 139°10′ E); it was previously a coppice oak forest used for charcoal production. This deciduous forest is predominated by oak (Quercus serrata Thunb. ex Murray) with an area of approximately 78 ha. The primary climax vegetation around the area is dominated by subtropical/warm-temperate evergreen broad-leaved trees, such as Castanopsis sieboldii (i.e., lucidophyllous forests) [21]; however, these climax forests have been largely replaced by coppice oak forests for charcoal production. These oak forests were abandoned in the 1970s, but have since naturally regenerated into secondary oak forests with ca. 20 m canopy trees. The study site has a warm-temperate monsoon humid climate with an annual mean air temperature and precipitation of 15.0 °C and 1286.3 mm, respectively (1981–2010). The soil was originally derived from alluvion volcanic ash, classified as Alic Hapludands [22].
2.2. Experimental Design
A total of 12 experimental plots (numbered from 1 to 12, 20 m × 20 m each) were established in a randomized design across the deciduous forest. In July 2015, all stems of tree species with a height of more than 1.3 m were identified at the species level and measured to evaluate their diameter at breast height (dbh) to determine the differences in community attributes among the treatment plots before biochar application. The relative dominance of each species was calculated as the relative total basal area (RBA) of each species in each plot. The diversity index (H′) of each plot was calculated using the Shannon-Wiener formulation:
where pi is the RBA of species i.
H′ = −Σpi log2 pi
Biochar was spread manually on top of the organic layer on the forest floor at rates of 0 (control), 5, and 10 Mg ha−1 (plots C0, C5, and C10, respectively). Each treatment was applied to four replicate plots in November 2015. The grounded biochar (particle size <5 mm) was made from broad-leaved and coniferous wood chips pyrolyzed at 600 °C–700 °C (Shiratori Super MOKUTAN C, Shiratori Mokuzai Kakoh Cooperative Society, Gifu, Japan). The proportion of C in the biochar was about 71% (i.e., 3.6 and 7.1 Mg C ha−1 was used as the amount of C input to plots C5 and C10, respectively). The forest floor was densely covered by an evergreen dwarf bamboo community (Pleioblastus chino) approximately 0.5 m high. The aboveground biomass of the dwarf bamboo was measured by cutting the aboveground parts (1 m2 area and 4 replications in each plot) in July 2017.
2.3. Net Primary Production (NPP)
The dbh of all tree stems greater than or equal to 5 cm was measured in November 2016 (the first year after biochar application) to estimate the NPP. A number tag was attached to each trunk at a height of 1.3 m using a stapler. The dbh of these stems was re-measured in November 2018 (the third year after biochar application) at the same position on the trunks, together with those of any recruitment stems that reached the 5 cm threshold or died during the 2 y interval. To estimate the above and belowground biomass of the trees, the common allometric equations for Japanese deciduous forest sites were used, as follows [23]:
where ρ is the stem wood density with bark (kg m−3), D is the dbh (cm), and WTop and WCr are the dry weights (kg) of the aboveground parts (stems and branches) and coarse roots, respectively. The stem wood density of Q. serrata (0.5540 ± 0.08719 kg m−3) [23] was used for all tree stems in the study plot, because the mean relative biomass of Q. serrata for all plots was more than 88%.
WTop = 0.1853 ρ D2.491, and WCr = 0.1074 ρ D2.189
The biometric-based NPP (Mg dry weight ha−1 yr−1) of the deciduous forest was calculated using the following equation [24]:
where NPPW is the annual production of the woody parts of aboveground and coarse roots, NPPF is the annual production of foliage, and NPPR is the annual production of re- productive organs (flowers and seeds, mainly Q. serrata acorns). We defined NPPW to be the net increase in the aboveground (stems and branches) and belowground (coarse roots) matter of all trees during the measuring interval, as follows:
where BIs represents the woody increments of surviving trees in the plot and BIi represents the woody increments of ingrowth trees that reached the minimum diameter (5 cm) for 2 y (from November 2016 to November 2018). BIs was calculated as the difference between the estimated WTop and WCr in November 2016 and November 2018 using the allometric equations. The increments of ingrowth trees (BIi) were calculated as the difference between the estimated WTop and WCr of a tree in November 2018 and the minimum measured diameter (5 cm) [25].
NPP = NPPW + NPPF + NPPR
NPPW = Σ BIs + Σ BIi
NPPF is defined as the aboveground leaf litter; it was included to accommodate for the loss of new leaves produced by plants during an interval. Litter fall production was estimated using five litter traps (1 m2 in area) set in each plot. The litter traps were installed in June 2016, and litter fall was collected every month during the study period. Annual leaf litter volume was accumulated from April to the following March (e.g., from April 2017 to March 2018 for the year 2017), because almost all trees (mainly Q. serrata) were deciduous species, which normally open leaves in April and shed leaves in December. In 2017, we divided litter fall into foliage, woody materials (twigs and bark), and other materials (including reproductive organs). In 2018, we divided litter fall into foliage, woody materials, reproductive organs (flowers and seeds), and other materials (e.g., broken pieces of bark and insect excrement). These materials were oven-dried to a constant mass and then weighed.
NPPR is defined as the flowers and seeds (mainly Q. serrata acorns) found in the litter. We included reproductive organs as other materials in 2017; thus, we could not estimate the actual NPPR. However, the litter fall of materials other than reproductive organs was relatively small in 2018; the ratio of reproductive organs/(reproductive organs + others) ranged from 81% to 94% for each month. Thus, we estimated NPPR for the year 2017 using the ratio of reproductive organs to other materials for each month in 2018.
2.4. Statistical Analysis
One-way analysis of variance followed by Tukey’s test was used to test differences in community attributes prior to biochar application, and differences in forest NPP parameters after biochar application, across the three treatments. Means ± standard error for each treatment, including the four plots, are shown.
A linear mixed model (LMM) was fitted to clarify whether there was a difference in the relative growth rate of tree dbh (RGRd) in C5 and C10 compared to the control plot (C0). We used RGRd instead of the growth rate (annual diameter growth) to test the biochar effect on plant growth, because the growth rate of the dbh of tree stems depends on the initial diameter. The RGRd of each tree stem was calculated as follows:
where D2018 and D2016 are the dbh in November 2018 and November 2016, respectively. This analysis was conducted with Q. serrata, which was the dominant tree species in each plot (more than 88% of the mean relative biomass for all plots), to eliminate species-dependent responses to biochar from the model. Moreover, we excluded trees under the canopy with a dbh of <20 cm to eliminate the shading effect for plant growth rather than the biochar effect. In the model, the RGRd of the individual tree stem was set as the objective variable, with the normal distribution used as the error distribution, the type of treatment was set as the explanatory variable (fixed effect), and each plot was set as a random effect, as follows:
where μ indicates the expected value (=mean) of RGRd. R 3.6.1 [26] and the lmerTest package [27] were used for the analyses. Significant differences for all statistical analyses were evaluated at the level of p = 0.05.
RGRd (cm cm−1 yr−1) = (ln D2018 − ln D2016)/2
RGRd ~ Normal (μ, variance)
μ = intercept + treatment [C0, C5, C10] + random effect [each plot]
3. Results
3.1. Community Structures before Biochar Application
Prior to biochar application, there were no significant differences in community attributes between the treatments (Table 1). Coppice oak trees naturally regenerated in the plots, and other species invaded the plots; thus, the species number in each plot ranged from two to nine, although there were no significant differences in the species number between treatments. The Shannon-Wiener diversity index ranged from 0.08 to 1.09, and Q. serrata mono-dominated (i.e., the relative dominance (RBA) of Q. serrata in each plot was >69.7%). The basal area (BA) of the plots ranged from 19.1 to 32.1 m2 ha−1, with no significant difference in BA across treatments. The mean aboveground tree biomass before biochar application was 178.3 Mg ha−1, 156.7 Mg ha−1, and 166.8 Mg ha−1, in C0, C5, and C10, respectively; there was no significant difference. The aboveground biomass of the understory dwarf bamboo ranged from 61.2 to 219.3 g m−2 in each plot.

Table 1.
Community structures and attributes of the experimental plots in an oak (Q. serrata) forest prior to biochar application. All tree stems with a height ≥1.3 m were measured in each plot (20 m × 20 m).
3.2. Effects of Biochar Application on Tree Growth
The annual biomass increment (BIs and BIi) of each stem (i.e., growth rate of trees) increased exponentially with the stem diameter (Figure 1a–c) over two years. Some trees decreased in biomass, as the decreasing diameter reflected weak and dying stems. To eliminate the size-dependent growth rate, we used the relative growth rate of dbh (RGRd) to detect the biochar effect on plant growth. The RGRd varied substantially for all species other than Q. serrata (Figure 1d–f), although the biomass increments for these species were low because of their small dbh. Table 2 shows a summary of the results of the LMM analysis for tree RGRd. The fixed effects of C5 and C10 were compared with that of the control (C0), which was set as 0. The mean RGRd of the canopy oak trees increased by 6.6% in C5, with no significant difference from the control plots. Conversely, the mean RGRd was significantly greater in C10 (increased by 22%) than in the control plots.
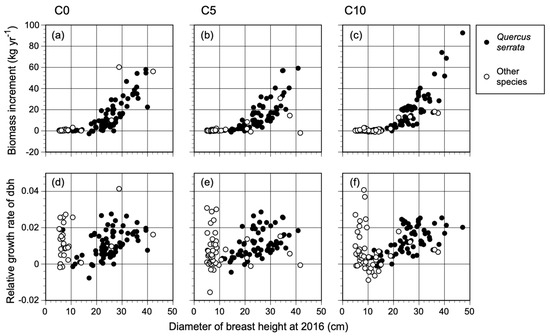
Figure 1.
Size-dependent growth rate (annual biomass increments; (a–c)) and relative growth rate of the dbh (d–f) of all tree stems (dbh > 5 cm) in C0 (control), C5 (5 Mg ha−1), and C10 (10 Mg ha−1) treatments after biochar application to an oak (Q. serrata) forest.
Table 2.
Summary of the results of a LMM to examine the difference in the relative growth rates of the dbh (RGRd) of canopy oak trees (dbh > 20 cm) across treatments (C0, C5, and C10). The fixed effect of the control (C0) was set to zero (*).
3.3. Effects of Biochar Application on NPP
C5 and C10 tended to have lower and higher woody NPP (NPPW), including coarse roots, respectively, compared with the control plots (Figure 2a), but these differences were not significant (F2,9 = 3.51, p = 0.075). NPPF was nearly the same for all treatments (Figure 2b), with no significant differences across treatments (F2,9 = 0.95, p = 0.419). By contrast, NPPR increased along the application rate gradients, corresponding to 1.04 Mg ha−1 yr−1, 1.30 Mg ha−1 yr−1, and 1.47 Mg ha−1 yr−1 in the control, C5, and C10, respectively (Figure 2c). NPPR in C10 was significantly higher than the control (F2,9 = 4.65, p = 0.041). The total NPP in C10 was slightly higher than that of the control plots, mainly because of the higher NPPR (Figure 2d). However, this difference was not significant across treatments (F2,9 = 2.29, p = 0.157), because the contribution of NPPR to total NPP was fairly small.
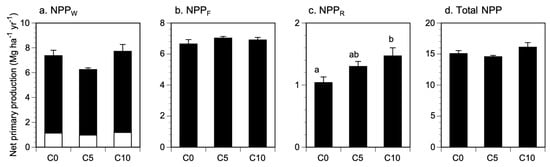
Figure 2.
Effect of the application of biochar on net primary production and components in an oak (Q. serrata) forest. NPPW (a) included woody growth of aboveground (black part) and coarse root (white part). Total NPP (d) was the sum of NPPW (a), NPPF (b), and NPPR (c). Lower cases represent significant differences among biochar treatments based on one-way ANOVA followed by Tukey’s test.
4. Discussion
4.1. Effect of Biochar on Woody Tree Growth
There was a significant increase in the RGRd for canopy oak trees of 22% in C10 compared to that of the control in our study site (Table 2). Relatively few studies have examined the effect of biochar on tree growth. Thomas and Gale [10] reviewed existing data on the growth responses of woody plants to the addition of biochar. They analyzed a total of 17 studies examining the responses of 36 woody plant species and found a consistent, strong overall pattern of a positive growth response to the addition of biochar; these responses corresponded to a 41% increase in biomass, although almost all studies were pot trials.
A few direct field experiments examined the effects of biochar application on tree growth. Omil et al. [28] applied mixed wood ash (MWA), a mixture of fly ash and charcoal generated from power plants, to two young Pinus radiata plantations with different soil textures at a rate of 4.5 Mg ha−1 over three consecutive years (13.5 Mg ha−1 total). They found that MWA led to increased tree growth from the second year of treatment onward. Sovu et al. [29] also applied rice husk biochar to swidden fallows in Laos (a total biochar application equivalent to 4 Mg ha−1) to investigate its effects on planted tree seedling growth over four years. In the first year after planting, no significant growth responses were observed for most of the species; however, biochar boosted growth in terms of the diameter and height of saplings for all species in the fourth year. Sherman et al. [16] examined the impacts of biomass retention-level treatments with soil amendment biochar, fertilizer, and combined fertilizer and biochar treatments in two Idaho mixed-conifer forests. Fertilizer increased the basal area growth and total stem volume growth, because nitrogen was limited in the region. However, biochar had no effect on tree growth. Sarauer et al. [17] also applied biochar amendments of 0, 2.5, or 25 Mg ha−1 to the soil surfaces of five types of forests in the western US. They concluded that biochar amendment increased the soil C content by 41% but did not affect tree growth. These studies suggest that tree growth response to biochar amendment is variable, but that growth of a tree species is potentially increased by the application of biochar under field conditions over the short term.
Several mechanisms promote plant growth and productivity. Biochar improves soil nutrient conditions, especially P and K availability [30], decreases Al toxicity [31], and reduces leaching nutrient losses [32]. Biochar can also improve soil water-holding capacity. Biochar-amended soils retained more water at gravity drained equilibrium (up to 15%) in Midwestern Mollisols, in Iowa [32]. Minamino et al. [20], who used our study sites, revealed that the addition of biochar at C10 enhanced litter decomposition above biochar for one year after application because of the biochar increasing the moisture content and microbial activity and also because of the enhanced litter decomposition below biochar for two years after its application. Moreover, Tanazawa et al. [33] found that the photosynthetic parameters (Pmax and Vcmax) of oak saplings (ca. 10 y old) adjacent to our study site increased with the biochar application rate gradients, up to 10 Mg ha−1 for three years. Thus, the application of biochar to the forest ecosystem changed soil properties, such as nutrient availability and water-holding capacity, soon after its addition, and could enhance the photosynthetic and growth rates of oak trees.
4.2. Effect of Biochar on Forest NPP
Even in significant increments of RGRd for canopy oak trees in C10 (Table 2), woody NPP (NPPw) did not respond to biochar application in our study site (Figure 2a). Actual woody biomass increment (growth rate of trees) in each stem was size dependent (Figure 1a–c). Therefore, it is difficult to detect differences in woody NPP (integrated values of woody biomass increments) over the short term in natural forests with trees of various sizes compared to the even-aged artificial forests. Foliage NPP also did not respond to biochar application (Figure 2b). Foliage biomass (i.e., foliage productivity in deciduous forests) is normally a function of forest age. It recovers soon after clear cutting in coppice forests, compared with woody biomass. For example, foliage biomass in the 18 y coppice young deciduous forest (dominated by Betula platyphylla var. japonica and Castanea crenata) was nearly the same as in the mature deciduous forests nearby, whereas woody biomass and NPP were still quite low [34]. Thus, the saturated foliage biomass of mature forests with closed canopies could not easily respond to biochar application.
Nevertheless, there were significant increases in the production of reproductive organs (mainly Q. serrata acorns), amounting to 25% in C5 and 41% in C10, compared with the control (Figure 2c). In contrast to foliage production, the productivity of acorns in forest ecosystems may easily respond to nutrient conditions. The masting phenomenon, in which dominant tree species exhibit interannual variation in resource allocation toward reproduction, is known to occur in mature Japanese forests, especially for Fagaceae species that have acorns [35]. Recent studies have shown that mass flowering does not depend on the amount of stored carbohydrates in trees, and masting trees mainly use current-year photosynthates rather than stored carbohydrates [35,36]; thus, the trees require more nutrients than in a normal year. Aoyagi et al. [37] also found that tropical trees require extraordinary amounts of P and K for masting and may re-translocate stored nutrients to meet the elevated nutrient demands of masting. Biochar can improve soil properties by increasing soil pH via a liming effect [38], leading to an increased availability of K and P as soil pH increases [30]. Therefore, abrupt nutrient fluxes that are affected by the addition of biochar should increase the productivity of Q. serrata reproductive organs in the same manner as masting phenomena.
It is important to note that there were no negative effects of biochar on plant growth and woody production. Nakagawa et al. [39] noted that, in a tropical rain forest, general flowering had a negative effect on tree growth and aboveground biomass increment at the community level because tree growth and reproduction are subject to trade-offs in resource allocation. Therefore, masting in forest ecosystems normally reduces tree growth and woody NPP [40]. In our study site, NPPR was significantly greater in C10 than in the control plots (Figure 2c). Nevertheless, there were no differences in the foliage and woody production in C10. This suggests that biochar application might stimulate the strength of C capture in forest ecosystems through increased seed production in C10.
In our study site, the quantitative effect of the biochar application rate on plant growth and productivity is not clear. Crop productivity changes due to biochar application were not shown to be proportional to the biochar application rate (up to 20–40 Mg ha−1), although crop productivity was saturated at biochar application rates >40 Mg ha−1 [4]. Tanazawa et al. [33] tested the effects of the application of biochar on the photo-synthetic parameters of oak saplings in a manner similar to those used in our field experiments (5, 10, and 20 Mg ha−1) in locations adjacent to the present study sites. They concluded that photosynthetic parameters increased with application rate gradients up to 10 Mg ha−1, but with no biochar effect at 20 Mg ha−1. Khorram et al. [41] applied biochar, compost, or a mixture of both to an apple orchard at an application rate of 10, 25, and 10 + 25 Mg ha−1, respectively, in northeastern Iran. Biochar and compost were beneficial in improving soil quality, mainly by increasing soil nutrient content and decreasing soil bulk density; thus, trunk diameter and the number of apple tree shoots increased by 23%–26% by the end of the first year. Nevertheless, there were no significant changes in fruit weight or the starch pattern index, as indices of productivity. Thus, the effect of the biochar application rate on forest NPP differs depending on the components in forest ecosystems. Additional long-term studies of the response of NPP components in forest ecosystems, especially that of fine root production, and trade-offs in resource allocation for each component are necessary.
5. Conclusions
The application of biochar significantly increased the relative growth rate of canopy oak trees by 22% in the second to third years after application in C10. Responses to biochar application differed depending on the NPP components, although there was no effect on total NPP. The production of reproductive organs (mainly oak acorns) increased by 25% and 41% in C5 and C10, respectively, compared with the control, but there were no effects on foliage or woody production. Nevertheless, we noted positive effect on plant growth and no effect on woody NPP in C10 compared with the control, unlike masting in natural forest ecosystems, which are subject to trade-offs between tree growth and reproduction. This suggests that biochar application might stimulate the strength of C capture for forests in field conditions with the addition of 10 Mg ha−1.
Author Contributions
Conceptualization: T.O., S.Y. and H.K.; investigation: M.T., Y.T. and H.K.; data curation: M.A.; formal analysis: T.O., M.T., M.A. and Y.T.; writing––original draft preparation: T.O., M.T. and M.A.; writing––review and editing: S.Y.; funding acquisitions: S.Y. and H.K. All authors have read and agreed to the published version of the manuscript.
Funding
This work was supported by JSPS (Japan Society for the Promotion of Science) KAKENHI Grant Number 15H01730 for H.K., and 10H04237 for S.Y.
Data Availability Statement
Data sharing is not applicable to this article.
Acknowledgments
We thank the members of the Laboratory for Environmental Ecology, Waseda University, for their cooperation.
Conflicts of Interest
The authors declare no conflict of interest.
References
- Spokas, K.A.; Cantrell, K.B.; Jeffery, M.N.; Archer, D.W.; Ippolito, J.A.; Collins, H.P.; Boateng, A.A.; Lima, I.M.; Lamb, M.C.; McAloon, A.J.; et al. Biochar: A synthesis of its agronomic impact beyond carbon sequestration. J. Environ. Qual. 2012, 41, 973–989. [Google Scholar] [CrossRef] [PubMed]
- Woolf, D.; Amonette, J.E.; Street-Perrott, F.A.; Lehmann, J.; Joseph, S. Sustainable biochar to mitigate global climate change. Nat. Commun. 2010, 1, 56. [Google Scholar] [CrossRef] [PubMed]
- Jeffery, S.; Vehrijen, F.G.A.; van der Velde, M.; Bastos, A.C. A quantitative review of the effects of biochar application to soils on crop productivity using meta-analysis. Agric. Ecosyst. Environ. 2011, 144, 175–187. [Google Scholar] [CrossRef]
- Liu, X.; Zhang, A.; Ji, C.; Joseph, S.; Bian, R.; Li, L.; Pan, G.; Paz-Ferreiro, J. Biochar’s effect on crop productivity and the dependence on experimental conditions- a meta-analysis of literature data. Plant Soil 2013, 373, 583–594. [Google Scholar] [CrossRef]
- Biederman, L.A.; Harpole, W.S. Biochar and its effect on plant productivity and nutrient cycling: A meta-analysis. GCB Bioenergy 2013, 5, 202–214. [Google Scholar] [CrossRef]
- Hammond, J.; Shackley, S.; Prendergast-Miller, M.; Cook, J.; Buckingham, S.; Pappa, V.A. Biochar field testing in the UK: Outcomes and implications for use. Carbon Manag. 2013, 4, 159–170. [Google Scholar] [CrossRef]
- Schulz, H.; Dunst, G.; Glaser, B. No effect level of co-composted biochar on plant growth and soil properties in a greenhouse experiment. Agronomy 2014, 4, 34–51. [Google Scholar] [CrossRef]
- Jeffery, S.; Abalos, D.; Prodana, M.; Bastos, A.C.; van Groenigen, J.W.; Hungate, B.A.; Verheijen, F. Biochar boosts tropical but not temperate crop yields. Environ. Res. Lett. 2017, 12, 053001. [Google Scholar] [CrossRef]
- Lehman, J. A handful of carbon. Nature 2007, 447, 143–144. [Google Scholar] [CrossRef]
- Thomas, S.C.; Gale, N. Biochar and forest restoration: A review and meta-analysis of tree growth responses. New For. 2015, 46, 931–946. [Google Scholar] [CrossRef]
- Li, Y.; Hu, S.; Müller, K.; Li, Y.; Fu, W.; Lin, Z.; Wang, H. Effects of biochar application in forest ecosystems on soil properties and greenhouse gas emissions: A review. J. Soils Sediments 2018, 18, 546–563. [Google Scholar] [CrossRef]
- Heiskanen, J.; Tammeorg, P.; Dumroese, R.K. Growth of Norway spruces seedlings after transplanting into silty soil amended with biochar: A bioassay in a growth chamber-short communication. J. For. Sci. 2013, 59, 125–129. [Google Scholar] [CrossRef]
- Lin, Z.; Liu, Q.; Liu, G.; Cowie, A.L.; Bei, Q.; Liu, B.; Wang, X.; Ma, J.; Zhu, J.; Xie, Z. Effects of different biochars on Pinus elliottii growth, N use efficiency, soil N2O and CH4 emissions and C storage in a subtropical area of China. Pedosphere 2017, 27, 248–261. [Google Scholar] [CrossRef]
- Sarauer, J.L.; Coleman, M.D. Biochar as a growing media component for containerized production of Douglass-fir. Can. J. For. Res. 2018, 48, 581–588. [Google Scholar] [CrossRef]
- Sarauer, J.L.; Coleman, M.D. Douglas-fir seedling quality in biochar-amended peat substrates. Reforesta 2019, 7, 1–14. [Google Scholar] [CrossRef]
- Sherman, L.A.; Page-Dumroese, D.; Coleman, M.D. Idaho forest growth response to post-thinning energy biomass removal and complementary soil amendments. GCB Bioenergy 2018, 10, 246–261. [Google Scholar] [CrossRef]
- Sarauer, J.L.; Page-Dumroese, D.; Coleman, M.D. Soil greenhouse gas, carbon content, and tree growth response to biochar amendment in western United States forests. GCB Bioenergy 2018, 11, 660–671. [Google Scholar] [CrossRef]
- FAO. Global Forest Resources Assessments 2020, Food and Agriculture Organization of the United Nations. 2020. Available online: http://www.fao.org/forest-resources-assessment/en/ (accessed on 10 October 2020).
- Forestry Agency Japan. 2012. Available online: https://www.rinya.maff.go.jp/j/keikaku/genkyou/h24/index.html (accessed on 10 October 2020).
- Minamino, Y.; Fujitake, N.; Suzuki, T.; Yoshitake, S.; Koizumi, H.; Tomotsune, M. Effect of biochar addition of leaf-litter decomposition at soil surface during three years in a warm-temperate secondary deciduous forest, Japan. Sci. Rep. 2019, 9, 16961. [Google Scholar] [CrossRef]
- Chen, S.; Komiyama, A.; Kato, S.; Cao, R.; Yoshitake, S.; Ohtsuka, T. Stand dynamics and biomass increment in a lucidophyllous forest over a 28-year period in central Japan. Forests 2017, 8, 397. [Google Scholar] [CrossRef]
- Soil Survey Staff. Keys to Soil Taxonomy, 12th ed.; USDA-Natural Resources Conservation Service: Washington, DC, USA, 2014.
- Komiyama, A.; Nakagawa, M.; Kato, S. Common allometric relationships for estimating tree biomasses in cool temperate forest of Japan. J. Jpn. For. Soc. 2011, 93, 220–225, (In Japanese with English Summary). [Google Scholar] [CrossRef]
- Ohtsuka, T.; Saigusa, N.; Iimura, Y.; Muraoka, H.; Koizumi, H. Biometric-Based Estimations of Net Primary Production (NPP) in Forest Ecosystems; Canopy Photosynthesis: From Basics to Applications Volume 42 of the series Advances in Photosynthesis and Respiration; Hikosaka, K., Niinemets, Ü., Anten, N., Eds.; Springer: Dordrecht, The Netherlands, 2016; pp. 333–351. [Google Scholar]
- Clark, D.A.; Brown, S.; Kicklighter, W.; Chambers, J.Q.; Thomlinson, J.R.; Ni, J. Measuring net primary production in forests: Concepts and field methods. Ecol. Appl. 2001, 11, 356–370. [Google Scholar] [CrossRef]
- R Core Team. R: A Language and Environment for Statistical Computing; R Foundation for Statistical Computing: Vienna, Austria, 2019; Available online: https://www.R-project.org/ (accessed on 23 June 2020).
- Kuznetsova, A.; Brockhoff, P.B.; Christensen, R.H.B. lmerTest Package: Tests in Linear Mixed Effects Models. J. Stat. Softw. 2017, 82, 1–26. [Google Scholar] [CrossRef]
- Omil, B.; Piñeiro, V.; Merino, A. Soil and tree responses to the application of wood ash containing charcoal in two soils with contrasting properties. Ecol. Manag. 2013, 295, 199–212. [Google Scholar] [CrossRef]
- Sovu, M.T.; Savadogo, P.; Odén, P.C. Facilitation of forest landscape restoration on abandoned swidden fallows in Laos using mixed-species planting and biochar application. Silva Fenn. 2012, 46, 39–51. [Google Scholar]
- Asai, H.; Samson, B.K.; Stephan, H.M.; Songyikhangsuthor, K.; Homma, K.; Kiyono, Y.; Inoue, Y.; Shiraiwa, T.; Horie, T. Biochar amendment techniques for upland rice production in Northern Laos 1. Soil physical properties, leaf SPAD and grain yield. Field Crop. Res. 2009, 11, 81–84. [Google Scholar] [CrossRef]
- Yamato, M.; Okimori, Y.; Wibowo, I.F.; Anshori, S.; Ogawa, M. Effects of the application of charred bark of Acacia mangium on the yield of maize, cowpea and peanut, and soil chemical properties in South Sumatra, Indonesia. Soil Sci. Plant Nutr. 2006, 52, 489–495. [Google Scholar] [CrossRef]
- Laird, D.A.; Fleming, P.; Davis, D.D.; Horton, R.; Wang, B.; Karlen, D.L. Impact of biochar amendments on the quality of a typical Midwestern agricultural soil. Geoderma 2010, 158, 443–449. [Google Scholar] [CrossRef]
- Tanazawa, Y.; Tomotsune, M.; Suzkuki, T.; Koizumi, H.; Yoshitake, S. Photosynthetic response of young oaks to biochar amendment in field conditions over 3year. J. For. Res. 2021. [Google Scholar] [CrossRef]
- Ohtsuka, T.; Shizu, Y.; Nishiwaki, A.; Yashiro, Y.; Koizumi, H. Carbon cycling and net ecosystem production at an early stage of secondary succession in an abandoned coppice forest. J. Plant Res. 2010, 123, 393–401. [Google Scholar] [CrossRef]
- Ichie, T.; Igarashi, S.; Yoshida, S.; Kenzo, T.; Masaki, T.; Tayasu, I. Are stored carbohydrates necessary for seed production in temperate deciduous trees. J. Ecol. 2013, 101, 525–531. [Google Scholar] [CrossRef]
- Igarashi, S.; Shibata, M.; Masaki, T.; Tayasu, I.; Ichie, T. Mass flowering of Fagus crenate done not depend on the amount of stored carbohydrates in trees. Trees 2019, 33, 1399–1408. [Google Scholar] [CrossRef]
- Aoygagi, R.; Imai, N.; Hidaka, A.; Samejima, H.; Kitayama, K. Abrupt increase in phosphorus and potassium fluxes during a masting event in a Bornean tropical forest. Ecol. Res. 2018, 33, 1193–1205. [Google Scholar] [CrossRef]
- Glaser, B.; Lehmann, J.; Zech, W. Ameliorating physical and chemical properties of highly weathered soils in the tropics with charcoal—A review. Biol. Fertil. Soils 2002, 35, 210–230. [Google Scholar] [CrossRef]
- Nakagawa, M.; Matsushita, M.; Kurokawa, H.; Samejima, H.; Takeuchi, Y.; Aiba, M.; Katayama, A.; Tokumoto, Y.; Kume, T.; Yoshifuji, N.; et al. Possible negative effect of general flowering on tree growth and aboveground biomass increment in a Bornean Tropical Rain Forest. Biotropica 2012, 44, 715–719. [Google Scholar] [CrossRef]
- Hacket-Pain, A.; Ascoli, D.; Berretti, R.; Mencuccini, M.; Motta, R.; Nola, P.; Piussi, P.; Ruffinatto, F.; Vacchiano, G. Temperature and masting control Norway spruce growth, but with high individual tree variability. Ecol. Manag. 2019, 438, 142–150. [Google Scholar] [CrossRef]
- Khorram, M.S.; Zhang, G.; Fatemi, A.; Kiefer, R.; Maddah, K.; Baqar, M.; Zakaria, M.P.; Li, G. Impact of biochar and compost amendment on soil quality, growth and yield of a replanted apple orchard in a 4-year field study. J. Sci. Food Agric. 2019, 99, 1862–1869. [Google Scholar] [CrossRef]
Publisher’s Note: MDPI stays neutral with regard to jurisdictional claims in published maps and institutional affiliations. |
© 2021 by the authors. Licensee MDPI, Basel, Switzerland. This article is an open access article distributed under the terms and conditions of the Creative Commons Attribution (CC BY) license (http://creativecommons.org/licenses/by/4.0/).