Article

Spatiotemporal Changes and Obstacle Factors of Forest Ecological Security in China: A Provincial-Level Analysis

1
College of Economics and Management, Nanjing Forestry University, Nanjing 210037, China
2
Networks Financial Institute, Donald W. Scott College of Business, Indiana State University, 30 N 7th St., Terre Haute, IN 47809, USA
*
Author to whom correspondence should be addressed.
Forests 2021, 12(11), 1526; https://doi.org/10.3390/f12111526
Submission received: 12 October 2021 / Revised: 29 October 2021 / Accepted: 2 November 2021 / Published: 5 November 2021
(This article belongs to the Section Forest Economics, Policy, and Social Science)

Abstract

:
Under the background of China’s proposal to achieve “carbon neutralization and carbon peak”, it is an important task for each province to clarify their forest ecological security (FES) status. However, there is little understanding of the temporal and spatial evolution of forest ecological security and its influencing factors. Based on the Pressure-State-Response (PSR) model, this paper constructed a comprehensive evaluation index system for forest ecological security and used the CRITIC method and panel data to estimate the dynamic changes in FES for 31 provinces in China (excluding Hong Kong, Macao, and Taiwan) between 2009 and 2018. Furthermore, the obstacle degree model was used to determine the important obstacle factors affecting FES. The results showed that: (1) The comprehensive indices of FES of most provinces in mainland China were increasing, showing a good development trend during the study period; (2) subject to the limitations of resources and economic conditions, the FES at the provincial level showed significant spatial heterogeneity, which generally presents a distribution characteristic of “low in the western region and high in the central and eastern regions”; and (3) the primary obstacles restricting the improvement of FES level in most provinces of China were forest state indicators or input response indicators, followed by pressure indicators. Therefore, it is recommended to take targeted measures to reduce the intensity of forest cutting and the incidence of forest disasters, improve the utilization efficiency of forest resources, the productivity of forestland and the input-output level of forestry industry, and strengthen the training of professional talents and technical input according to the resource endowment condition of each province so as to improve the level of forest ecological security.

1. Introduction

China aims to reach a carbon peak by 2030 and achieve carbon neutrality by 2060. Forest resources have played a positive role in protecting biodiversity and reducing carbon emissions. Ensuring forest ecological security (FES) is a prerequisite for maintaining national ecological security, promoting green development, and effectively responding to climate change [1]. In the process of human economic development, forest resources continue to provide raw materials for forestry-related industries, which has increased the pressure on FES [2]. In addition, the increase of human industrial occupation and unplanned deforestation has continuously reduced forest area and stock [3], resulting in soil erosion, abnormal climate, frequent disasters, and other consequences [4], which adversely affect the sustainable development of human beings [1]. In order to alleviate the environmental problems and promote the harmonious coexistence of man and nature, the Chinese government has implemented ecological projects such as the Natural Forest Protection Program, the Conversion of Cropland into Forests Program, and the Key Shelterbelt Development Programs in the Three-North Region [5]. In these endeavors, the development of FES measurement and the diagnosis of obstacle factors are helpful for the government to formulate forest ecological security monitoring and early warning standards so as to provide decision-making references for the realization of sustainable economic and social development.
The term ecological security first appeared in the 1970s [6] and has since attracted the attention of domestic and foreign scientists. As a cross-discipline of natural and social sciences, ecological security has not yet come by a unified definition. However, scientists generally agree that it can be understood either broadly or narrowly. In a broad sense, ecological security includes natural, economic, and social ecological security [7]. In a narrower sense, ecological security refers to the security of natural and semi-natural ecosystems, which is the overall level of ecosystem integrity and health [8,9]. Most evaluations of ecological security are aimed at a particular ecosystem either at the country level [10], at the administrative regional level [11,12,13], or at a certain field level, involving land [14,15,16], forest [17], forestry [18], wood [19], etc., as the target ecosystem category. As the largest ecosystem on land, the forest has been evaluated extensively by scientists. In particular, since China’s reform and opening up in 1978, the speed of economic development and urbanization has accelerated [20], which has had a serious negative impact on the ecological environment [21], resulting in the degradation of the forest ecosystem services [22]. Under this background, how to scientifically and reasonably evaluate FES in China has become a research hotspot in the academic circle.
FES includes not only the state that the forest ecosystem can generate ecological benefits, improve the human living environment, and support economic and social development through self-regulation and recovery, but also the state under which mankind can take active measures to make the forest ecosystem provide continuous and stable ecological and forest resources to support sustainable development of the human society [23,24]. The current FES assessment studies mainly are based on regions [25], specific areas [26], or counties [27,28]. Scientists generally select three or four sets of forest ecology-related data with a time interval of five years to study the dynamic changes [29], but due to the relatively long selected time interval these studies cannot accurately determine the detailed change process of FES. In terms of research content, scientists have quantitatively analyzed the important influencing factors based on certain comprehensive index of FES. For example, Cai et al. introduced the obstacle degree model to quantitatively calculate the influencing factors of FES in China [30], but they failed to further analyze the specific influencing factors of FES in each province.
The establishment of an FES evaluation index system is a complex task, with the central idea being to clarify the relationship between the forest ecological environment and human society [31]. At this stage, there is no unified standard for the index system construction of FES. Scientists mainly establish an evaluation index system based on the pressure-state-response (PSR) theoretical framework [12,32,33]. However, most of these index systems selected forest disasters and resource endowment as indicators [34], largely ignoring the impact of the forestry industrial development on FES. For the response aspect, the existing literature mainly considers capital investment responses [23], largely ignoring the human resource and technological development responses.
Based on the review of the existing literature, we propose the following research hypotheses: firstly, there is obvious heterogeneity of FES in various provinces; secondly, the level of FES is gradually improving; thirdly, the spatial distribution of FES level in China exhibits dynamic changes over time; and finally, there are certain differences in the important factors that hinder the improvement of FES levels in each province.
The main goal of this paper is to construct an FES evaluation index system based on the traditional definition of FES and the PSR framework that also takes into account the impact of the forestry industry and the support responses from talents and technology development on the FES. Using the constructed index, we compared and analyzed the FES status of 31 provinces in China (excluding Hong Kong, Macao, and Taiwan) from 2009 to 2018, and explored the changes and spatial distribution of FES in different provinces. Furthermore, the obstacle degree model was used to analyze the key factors affecting FES in China’s provinces. We believe that the results herein provide an important reference for the formulation of forest ecological strategic planning in related areas.

2. Research Methods

2.1. The Forest Ecological Security Evaluation Index System

Canadian statisticians David J. Rapport and Tony Friend first proposed the framework of pressure-state-response (later referred to as the PSR model) to analyze the interactions between environmental pressures, the state of the environment, and environmental responses. The PSR model is based on an intuitive notion of causality and response: mankind’s economic and social activities exert pressure on the environment, thus influencing the quantity and quality of natural resources (i.e., the state, and hence the society takes actions in response to these environmental changes). It was further developed by the Organization for Economic Cooperation and Development (OECD) and the United Nations Environment Program (UNEP) in the 1980s to study environmental issues and evaluate the health of ecosystems [35]. Based on the PSR model, this paper constructed a forest ecological security evaluation indicator system, which draws on the relevant research results [19,26,36,37,38,39], and takes into account the consulting opinions of experts in forestry and ecology.
The forest ecological pressure indicators reflect the effects of human behavior on the forest ecological quality in the process of economic and social development, including mainly three types of indicators covering the social pressure, economic pressure, and ecological pressure, respectively. The social pressure indicator was measured by the urbanization ratio which represents the urbanization level of a region. The higher the urbanization rate of a region, the higher social pressure it imposes on the FES. The process of economic development requires consumption of forest resources, which has a negative impact on the FES. The amount of wood consumed per unit of GDP was used to indicate the economic pressure faced by the forest ecosystem. At the same time, the high wood consumption and overharvesting of forests engenders increasingly higher ecological pressure. The above indicators were all negative indicators.
The forest ecological state indicators reflect the health of the forest and the development progress of related forestry industries. They were mainly composed of resource indicators, disaster indicators, and industrial status indicators. Resource indicators reflect the quantity and quality of forest resources, including the forest coverage and forest stock volume per unit area. The former reflects the number of forests, and the latter reflects the quality of the forest. The above two indicators are positive measurement of the forest ecological security. In the process of growth, forests may suffer from man-made or natural disasters such as fire, pests and rodents. If it cannot be controlled in time, it may reduce forest area and have a negative impact on the FES. Therefore, the disaster rate of forest fires and the rate of forest pests and rodents were selected as the disaster indicators. In addition, mankind uses forest resources to develop the forestry industry. How to use limited resources to create more benefits is the goal pursued by mankind. For this respect, the forestry output value per unit forest area and tourism income index per unit forest park area were selected to evaluate the efficiency of forest resource utilization.
With the development of human economy and society, forest resources have been drastically reduced and natural disasters have occurred frequently. In order to maintain the stability and safety of the forest ecosystem, mankind has adopted a series of measures or programs to alleviate the conflict between the forest ecological construction and economic development. To reflect these responses, the forest ecological response indicators were constructed to measure human maintenance actions from the three aspects of talents, technology, and funds, respectively. Among these, the response intensity of talents was measured by the proportion of the number of forestry science and technology exchange and promotion personnel in the total personnel of forestry units. Forest product technology progress index and forestry pest control rate were used to measure the degree of technical response. The degree of input response was reflected by the intensity of forestry investment and the proportion of new afforestation.

2.2. The CRITIC Method

The existing literature has used both subjective and objective weighting methods to determine the index weight. The subjective weighting method is based on the analytic hierarchy process (AHP) [40,41], which requires highly the experience background of experts but at the same time entails strong subjectivity of results. Objective weighting methods include the entropy weight method [42] and the principal component analysis method [43], which determine the weight of indicators from the objective relationship between variables and consider the degree of correlation among indicators, but these methods ignore the influence of the difference of each indicator on the weight. In this paper, the CRITIC (criteria importance though inter-criteria correlation) method was used to determine the weights of FES evaluation indicators (Table 1). CRITIC, as a method to determine the weight of an indicator, has the advantage that it not only explores the variability within the indicator, but also considers the conflict between the indicators [44]. The variability within an indicator represents the difference between the same indicator in different evaluation objects, which is expressed by the standard deviation (the smaller the standard deviation is, the smaller the contrast intensity of different evaluation objects is). The conflict between indicators represents the difference between different indicators (the smaller the conflict is, the smaller the difference between the indicators is). The calculation processes of the CRITIC method are as follows.
(1) Standardization of the original data. To account for the different nature of the selected indicators, we adopted different processing methods for the positive and negative indicators.
positive   indicators   ( + ) :   X i j = x i j m i n   ( x j ) m a x ( x j ) m i n x j
negative   indicators   ( ) :   X i j = m a x x j x i j m a x ( x j ) m i n x j
where xij is the original value of the jth index of the ith province, and Xij is the standardized value.
(2) The degree of variation of each indicator is calculated as follows:
σ j = i = 1 n X i j X j ¯ 2 n
where σ j represents the standard deviation of the jth index, ands X j ¯ represents the average value of the jth index.
(3) The conflict between each indicator is calculated as follows:
R j = t = 1 m 1 c o v j , t σ j σ t
where c o v j , t represents the covariance of the jth index and the tth index.
(4) The amount of information that comprehensively incorporates the standard deviation and conflict between the indicators is computed as follows:
C j = σ j × R j
(5) The weight of each indicator is calculated as follows:
w j = C j j = 1 m C j
where w j represents the weight of the jth index.

2.3. The Levels of FES

Based on the existing studies [45,46] and the analysis of the historical statistical data of FES evaluation indicators of 31 provinces in China from 2009 to 2018, this paper divided the FES level of 31 provinces into five categories by combining the non-equal spacing method and the natural breakpoint method in ArcMap, including the unsafe state, critically safe state, comparatively safe state, safe state, and ideal state (Table 2). The closer the FES index is to 1, the higher the forest ecological security level is, the better the regional forest ecological security status is. In particular, this paper selected the years 2009, 2012, 2015, and 2018 as the time nodes, and used the ArcGIS 10.7 software to visualize the comprehensive index of China’s FES (in Section 3.2 below).

2.4. The Obstacle Degree Model

Based on the assessment of the level of FES, the determination of obstacle factors is conducive to diagnosing the restrictive factors of FES in various provinces. Referring to Cai’s results [30], the diagnosis of obstacle factors is carried out by utilizing three indicators: factor contribution, index deviation and obstacle degree. The obstacle model is as follows:
M i j = R j × 1 x i j j = 1 n R j × 1 x i j ,
where Mij is the obstacle degree of the jth index to forest ecological security in the ith year, Rj is the weight of the jth index, xij is the normalized value of the original data.

2.5. Data Sources

Data used in this study were obtained from China Forestry and Grassland Statistical Yearbook (2009–2018) and China Statistical Yearbook (2010–2019). Some missing data were calculated by using the interpolation method. Among them, the data of Shanghai’s timber production have been missing too much in the past ten years, so the arithmetic average of the existing data was calculated as the used statistics. In addition, China conducts a forest resource census every five years, so the data of forest coverage, forestland area, and forest area in the statistical yearbook are updated every five years. In order to better compare and analyze the changes in FES in different years, this paper calculated the arithmetic averages of the changes in forest coverage, forestland area, forest area and other data every five years to keep the dynamic changes of the annual data.

3. Results and Discussions

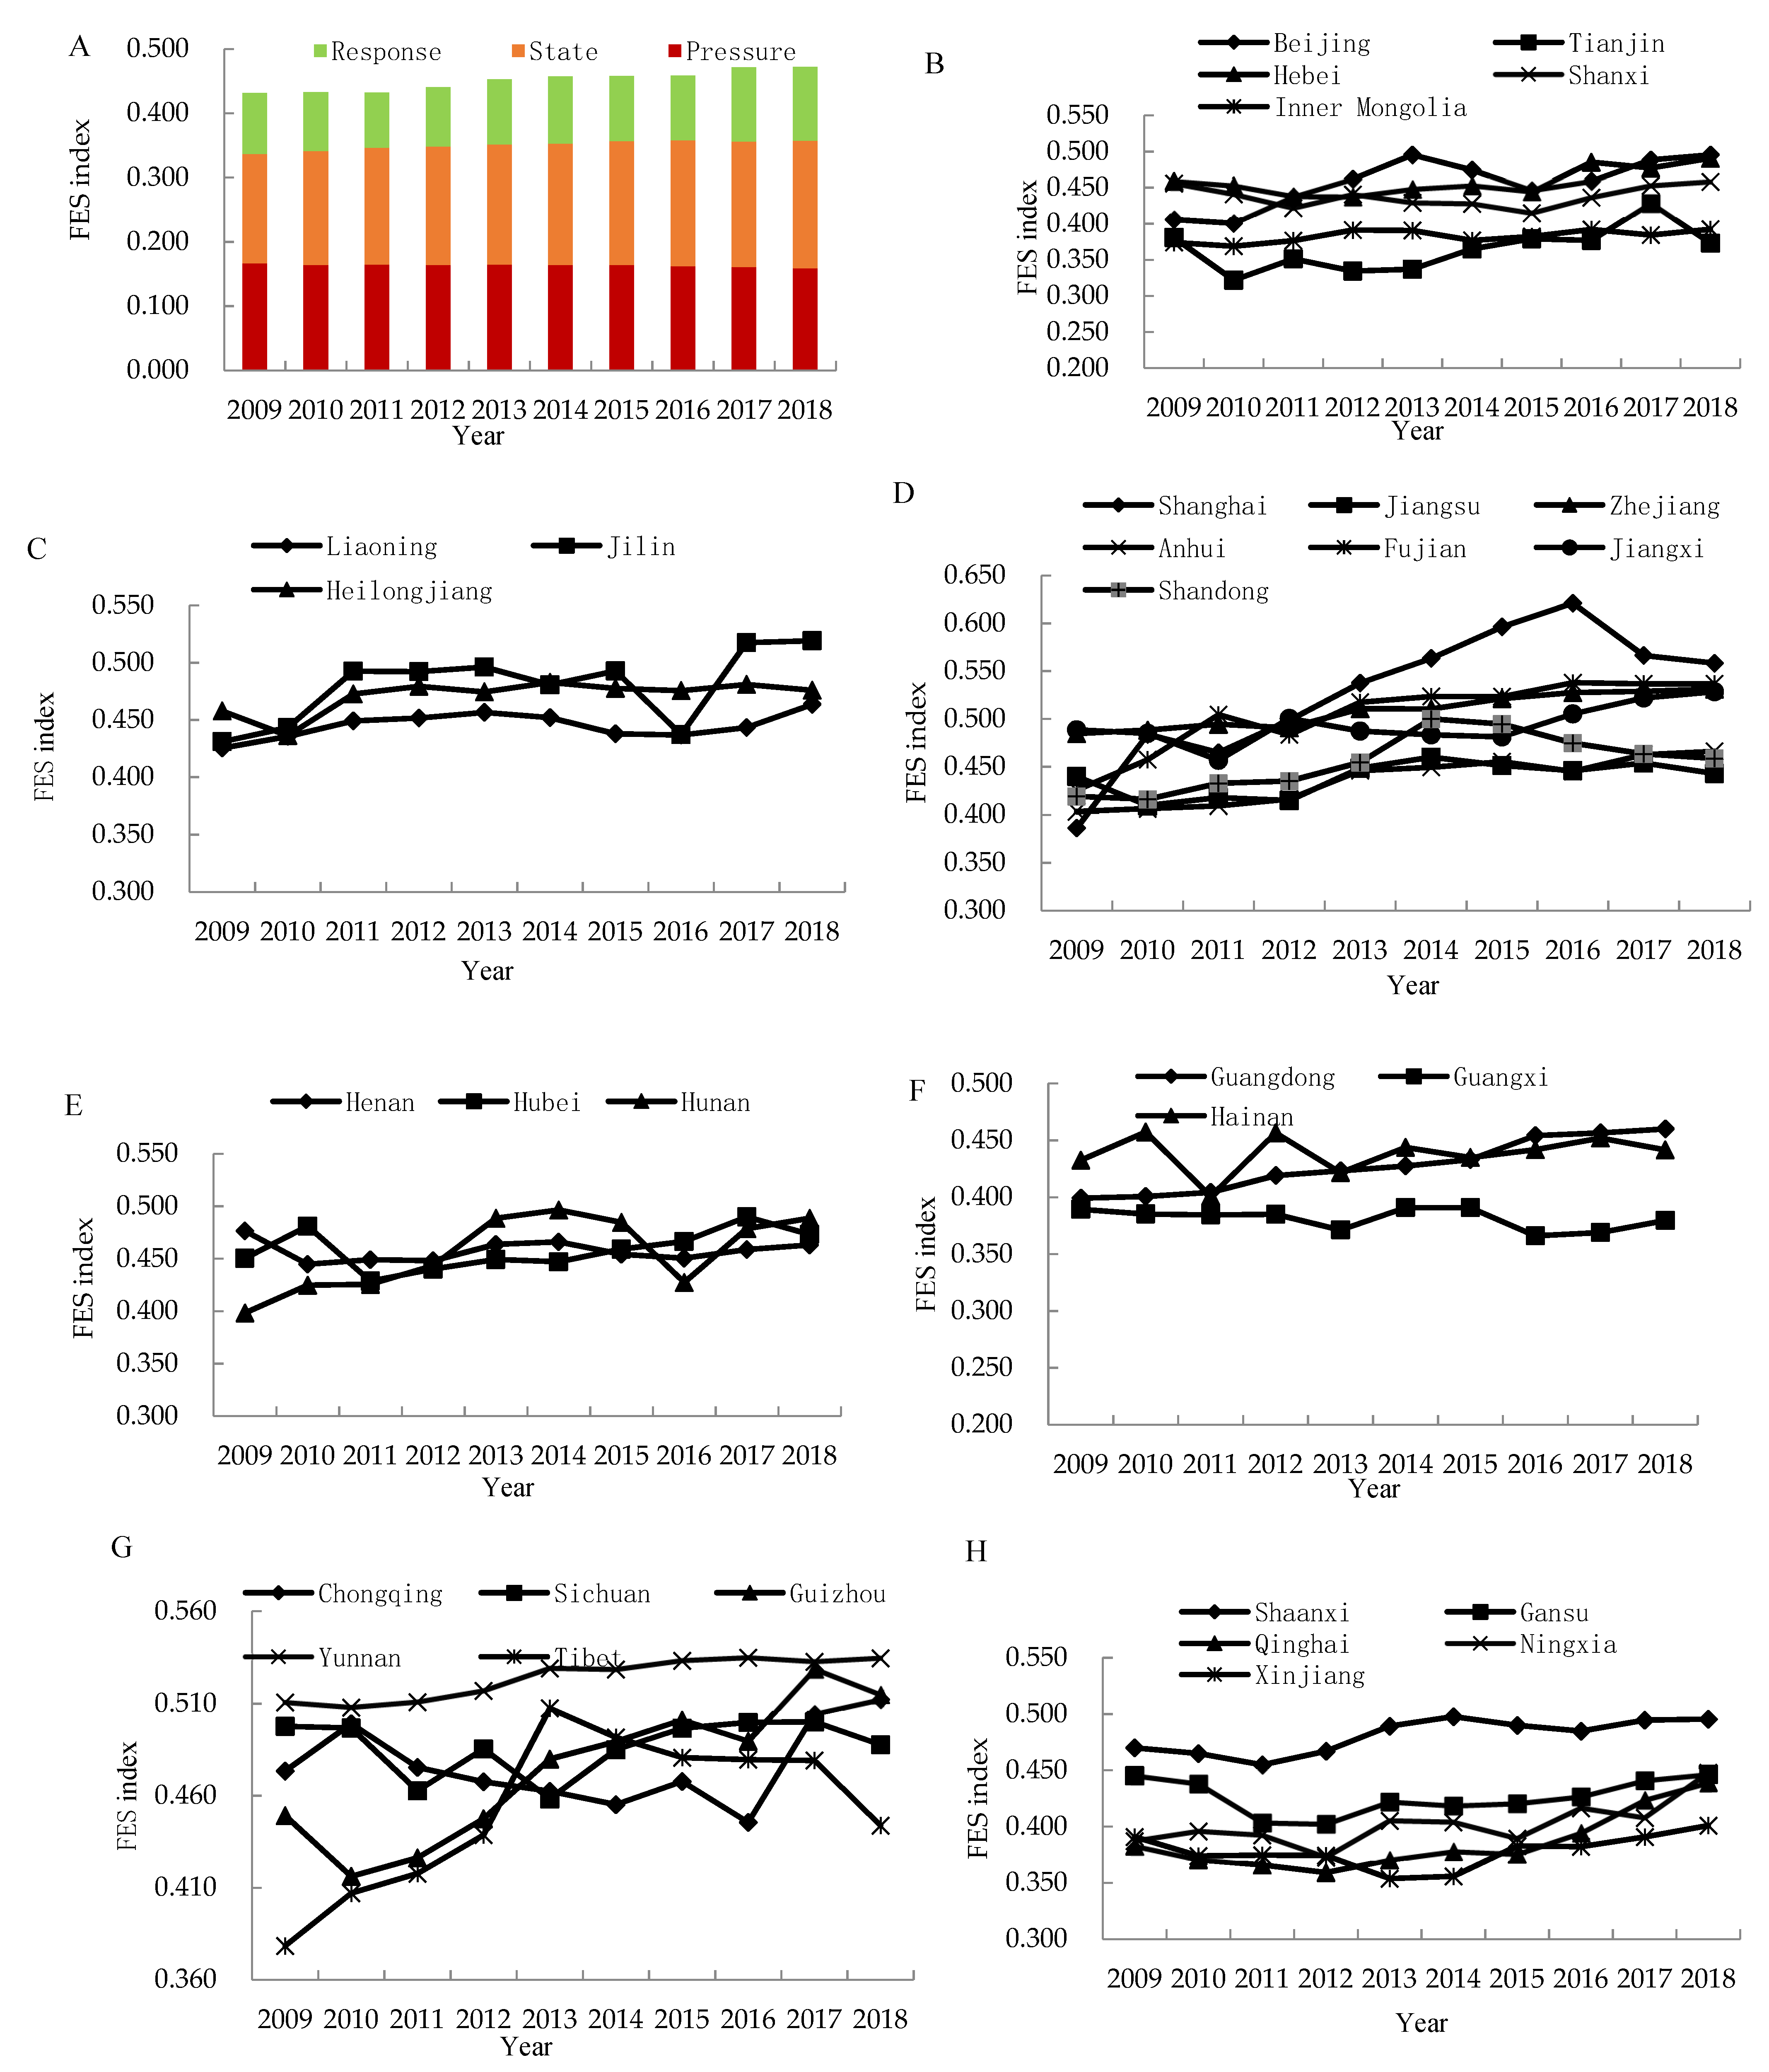
3.1. Time-Series Change Characteristics of Regional FES Levels

According to administrative divisions, China’s 31 provinces are divided into 7 areas: the north area, northeast area, east area, central area, south area, southwest area, and northwest area. The FES status and dynamic changes in China and its seven areas during 2009–2018 were depicted in Table 3 and Figure 1 below.
As can be seen from the last row of Table 3, the comprehensive index of China’s FES has increased from 0.431 to 0.472 from 2009 to 2018 (i.e., has improved from a critically safe state to a comparatively safe state), indicating that the FES index in China shows a slow upward trend but there is still a large room for progress. The improvement of the comprehensive FES index was mainly due to the improvement in the FES state index and response index. This shows that people have been increasingly aware of the importance of protecting forest ecology and that they have gradually increased investment in human resource, financial, and material input to rectify the ecological environmental problems, thus further improving the state index and response index of FES. At the current stage of economic development, it is difficult to reduce the ecological pressure by reducing the speed of economic development. At the same time, technological bottlenecks also limit the further improvement of the utilization efficiency of forest resources. Therefore, the change range of the FES pressure index has been small (Figure 1A).
The overall FES index in the north area had been slowly increasing. The FES level of Beijing, Hebei, and Shanxi provinces upgraded from a critically safe state to a comparatively safe state, but Tianjin and Inner Mongolia’s FES levels fluctuated slightly during the observation period and were still in a critically safe state (Figure 1B).
The FES situation in the northeast area, which is rich in forest resources, is generally good. The comprehensive FES indexes of Jilin and Heilongjiang were slightly higher than that of Liaoning, most of which were at the comparatively safe level. The FES level of Liaoning was basically at the critical safety level, but it also reached a comparatively safe level in 2018 (Figure 1C).
The comprehensive index of FES in the east area shows an overall upward trend, indicating that the FES status in the east area greatly improves during the study period. The comprehensive index of Shanghai’s FES was much higher than that of other provinces in the east area, with its FES level rising from a critically safe state to a safe state due to the fact that Shanghai’s response index scores were higher than other regions. With relatively better economic development, Shanghai invested a lot in human resources, capital, and technology, which made up for Shanghai’s deficiency in forest resources. However, it should be noted that the man-made ecosystem built with heavy investment in Shanghai has a certain vulnerability. In addition, the comprehensive indexes of FES in Zhejiang, Fujian, and Jiangxi are generally higher than that in Jiangsu and Shandong. This is due to the fact that the former are all provinces with large forest resources that also attach higher importance to forest ecological protection (Figure 1D).
The overall change of FES index in Hubei and Henan are similar, showing a slow growth trend. The FES situation in Henan was better than that in Hubei in the early stage, but it turned around in 2015 and after due to the improvement of the quality of forest resources and the rapid increase of FES state index in Hubei. The provinces in Central area were basically in a comparatively safe state during the study period (Figure 1E).
The comprehensive index of FES in Guangxi decreases year by year and remains in a critically safe state. With the acceleration of the urbanization level in Guangxi, forest cutting and wood consumption increases year by year, and the disturbance of economic development to forest ecology intensifies continuously, resulting in the decrease of FES index. In addition, the comprehensive index of FES in Guangdong and Hainan are generally on the rise. Guangdong and Hainan revised the Regulations of Guangdong Province on Forestland Protection and Management and the Regulations of Hainan Special Economic Zone on Forestland Management respectively in 2014, gradually paying attention to forestland protection. Their state of ecological security gradually has improved (Figure 1F).
The comprehensive index of FES in Yunnan is relatively high due to the rich virgin forest resources and natural forest protection measures, being improved from a comparatively safe level to a safe level. The FES index of Tibet and Guizhou have increased greatly. Guizhou has carried out a lot of work in improving forest resources and increasing forestry investment to increase the FES index. They had actively implemented ecological projects such as afforestation and forest tending, as well as constructed forestry industrial bases such as industrial raw material forest and national reserve forest, leading to the improvement of Guizhou’s FES index year by year. In recent years, Tibet has concentrated on the development of eco-tourism, characteristic animal husbandry, and processing industries of agricultural and pastoral products. The forest resources are therefore occupied less, and the pressure on the FES is gradually reduced, further improving its FES status. The FES levels of Chongqing and Sichuan have always been in a comparatively safe state, due to the rich forest resources in the two provinces. However, the rapid development of high-tech industries, service industries, characteristic agriculture, and other industries in Chongqing and Chengdu have put much pressure on their FES. At the same time, the inclination of funds in related industries has led to reduced intensity of forestry investment, resulting in greater changes in the comprehensive index of FES in Chongqing and Sichuan, indicating that the policy has great impact on the FES (Figure 1G).
The comprehensive index of FES in the northwest area was in a downward trend from 2009 to 2011, and began to rise gradually in 2012, indicating that the overall FES situation has been gradually improving recently. Among them, Shaanxi has always been in a comparatively safe state, and its comprehensive index of FES is far higher than that of other provinces in the region, largely due to the fact that Shaanxi has accelerated the construction of forest ecology through implementation of national forestry projects such as the natural forest resource protection project, the three north Yangtze River shelterbelt project, and the Returning farmland to forest (grassland) projects. The FES index of Gansu is slightly higher than that of Qinghai, Ningxia, and Xinjiang, due to the fact that Gansu’s investment in forestry science and technology talents and afforestation is much higher than other provinces in the region, which also testifies that it is necessary for regions to take active measures to improve the ecosystem (Figure 1H).

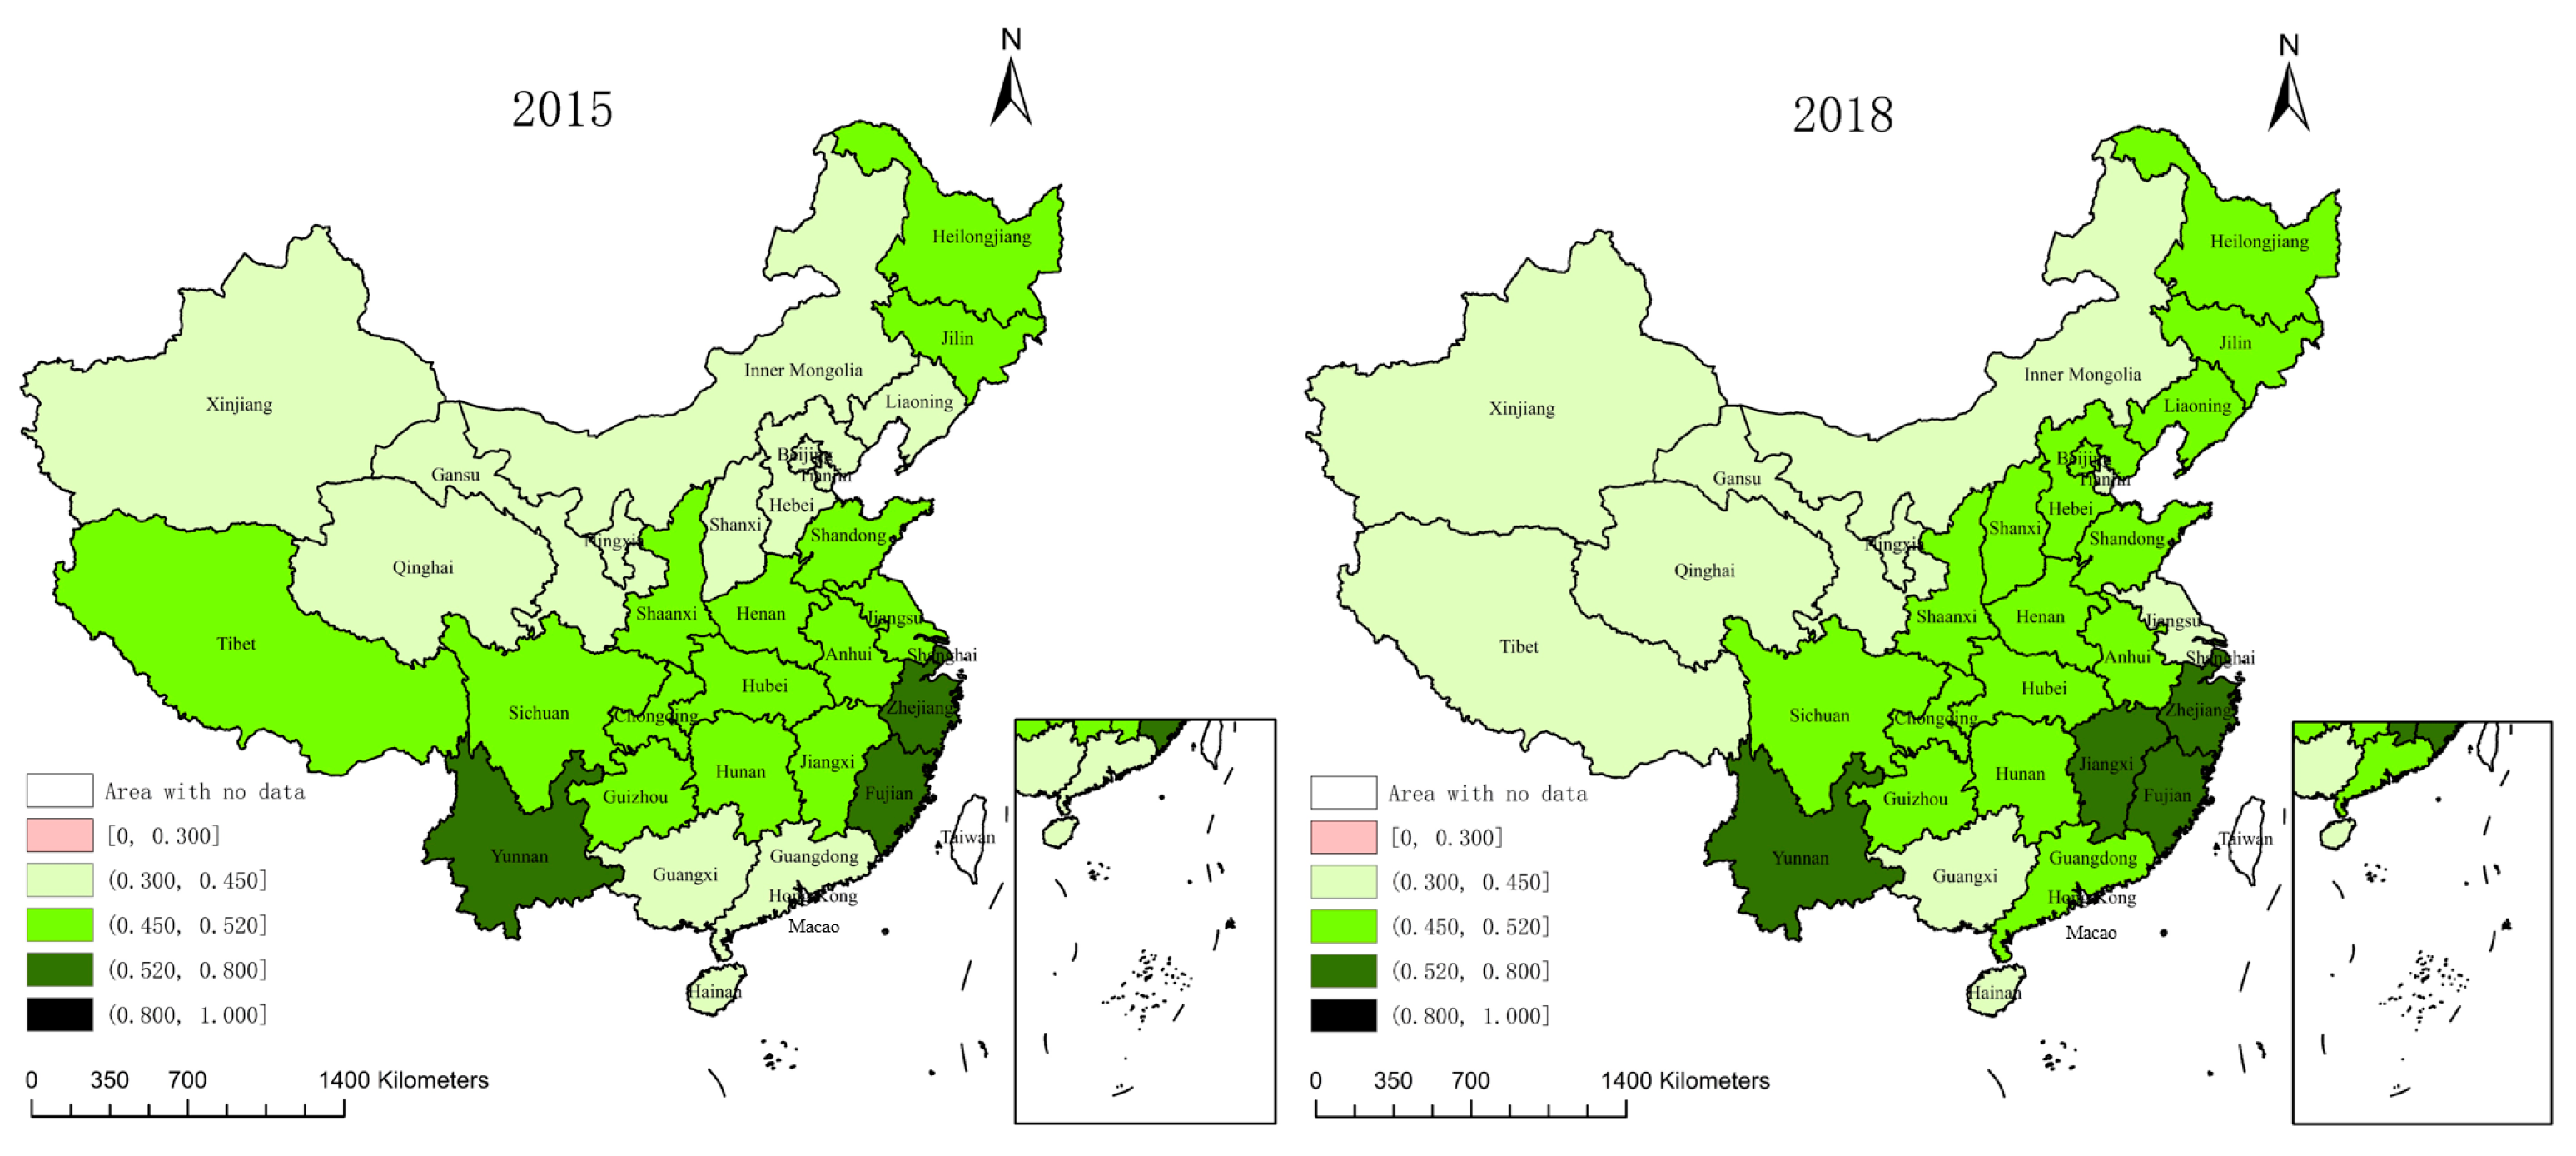
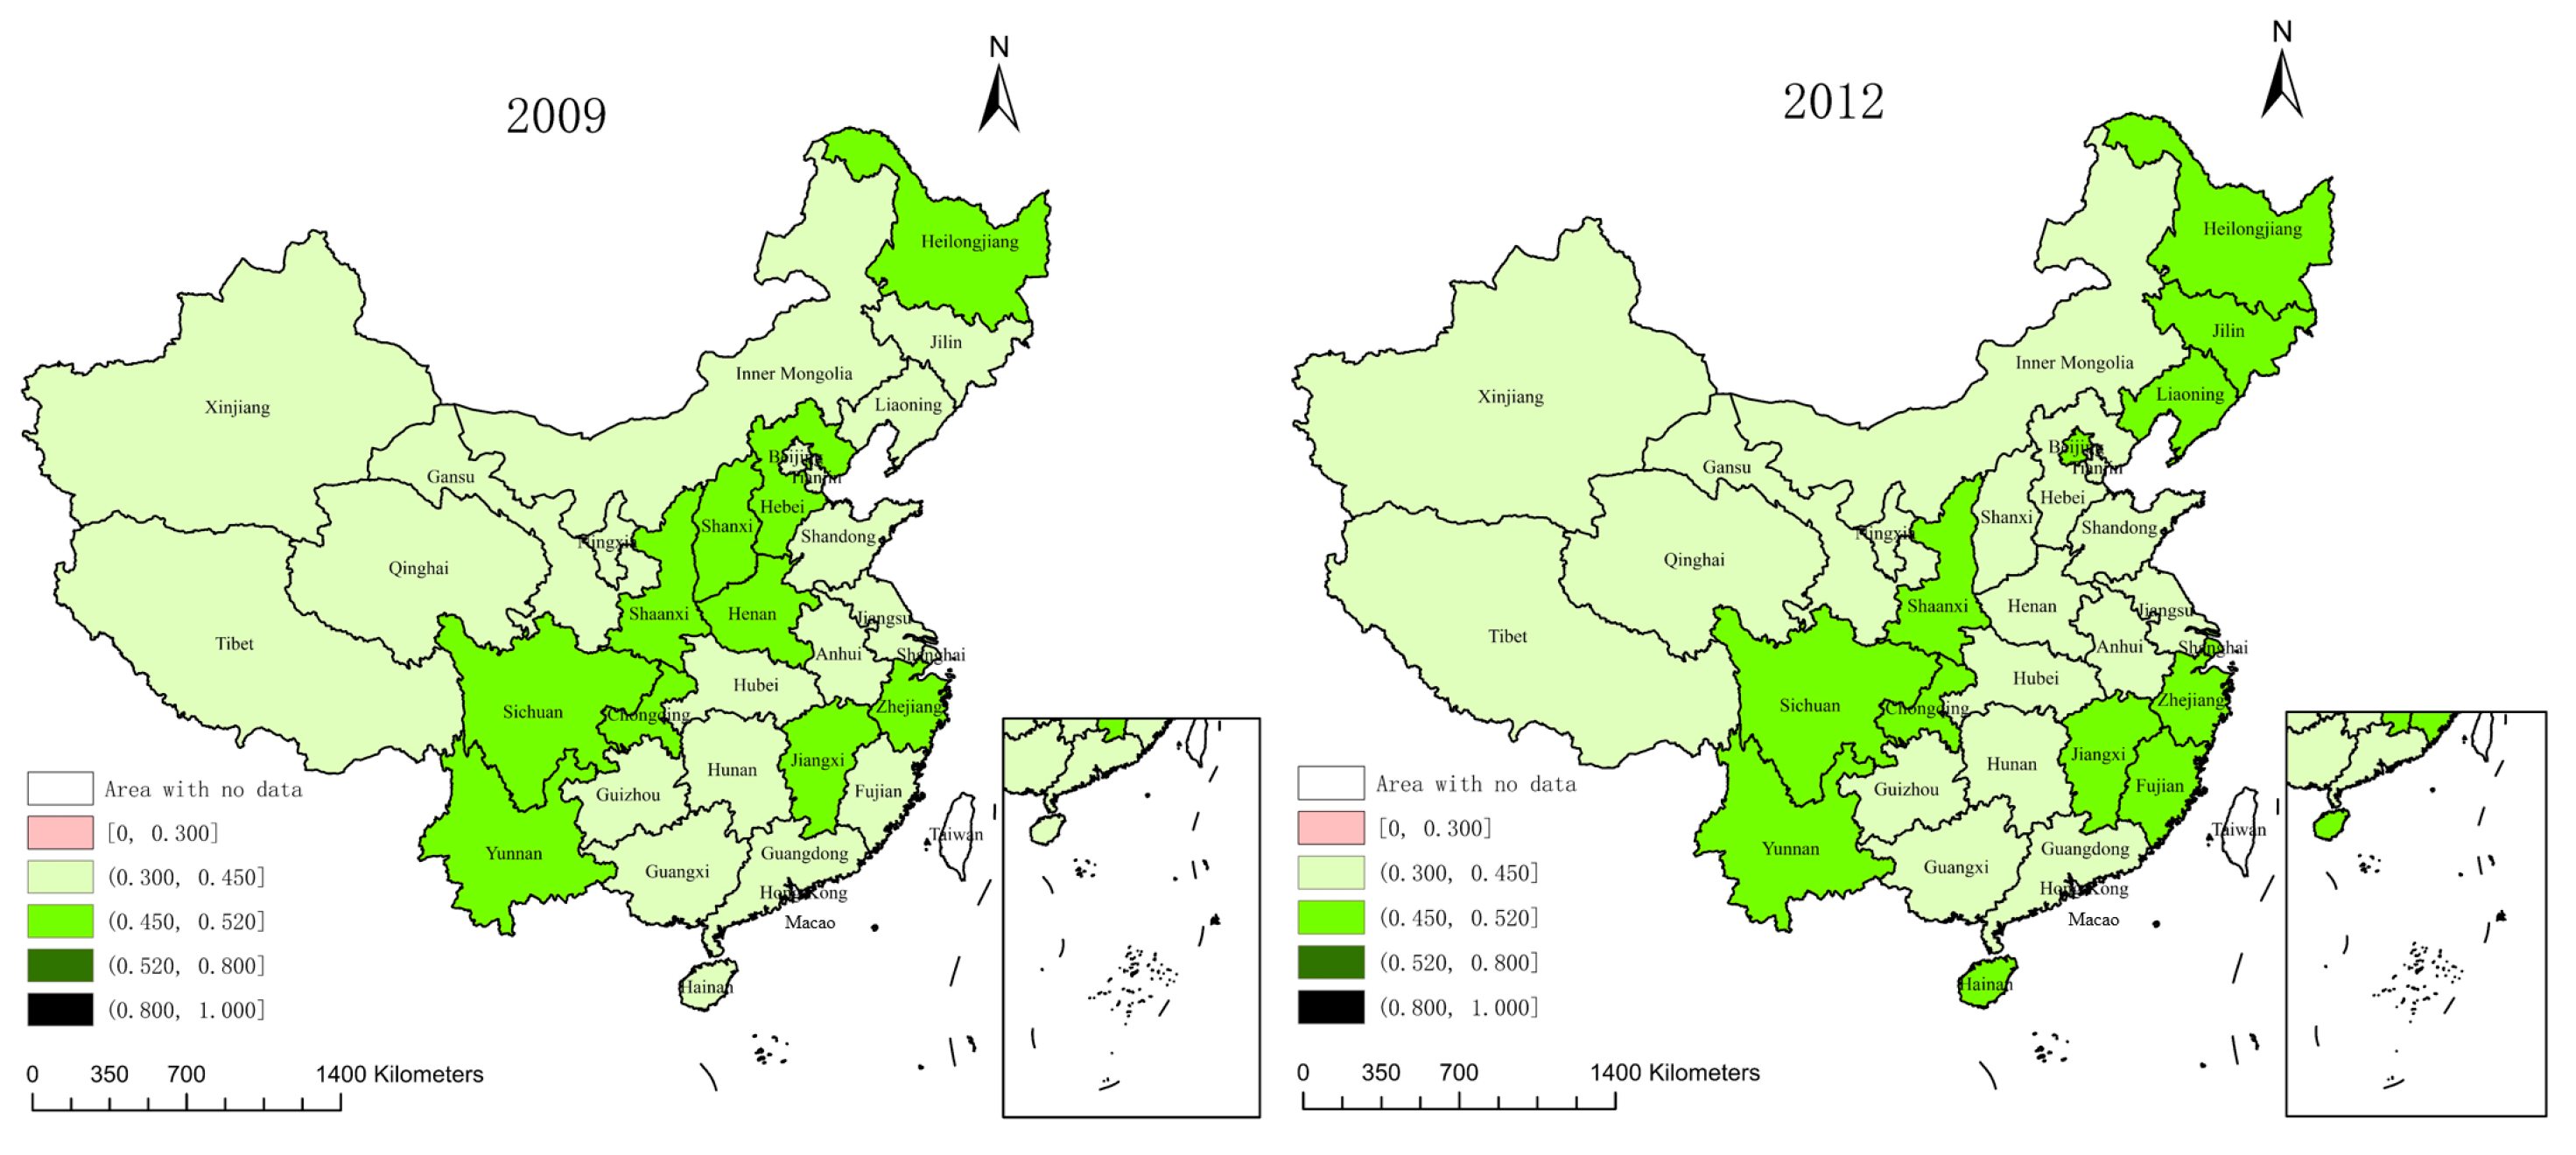
3.2. Spatial Differences of FES in Provinces

Our results also showed that China’s FES levels exhibited a spatial distribution pattern of low in the western region and high in the middle and east (Figure 2). In 2009, the (FES) comparatively safe provinces were mainly distributed in the central region, as well as parts of southwest and east China. By 2018, comparatively safe levels were basically spread over the central and eastern regions, showing an overall trend of expansion and evolution from the inland to the surrounding areas. However, some provinces at comparatively safe levels are still confronted with some problems such as the reduction of forest resources and the deterioration of the ecological environment, and some provinces still have a high risk of degrading into a critical safety level. Therefore, such areas should increase investment in ecological protection and increase resource utilization to maintain and improve their FES levels.
During the observation period, the regions at a critical safety level of FES have gradually reduced from the zonal distribution in the western area and the patchy distribution in the northeast, southwest and east area to the northwest area, showing that the improvement of FES levels in the northwest area is relatively low, which may be related to the level of local economic development. Restricted by their economic resources, the forest ecological maintenance in the northwest area has been inadequate. Thus, relevant government agencies should attach importance to the sustainable development of forests, so as to control and reduce the pressure that human activities put on the forest ecosystem. At the same time, according to the characteristics of the large area and sparse population in the northwest area, the planting area of artificial forests should be increased to improve the richness of forest resources. It is worth noting that, as the province with the highest forest coverage rate in China, Tibet’s FES level entered a critically safe level again from the comparatively safe level in 2015. This was due to the reduction of its response index, which indicated that Tibet’s forest ecological system maintenance work still needed to be further strengthened.
The FES levels of Yunnan, Fujian, and Zhejiang began to reach the safe level in 2015, and Jiangxi was added to that list in 2018. The above-mentioned provinces are scattered in southwest and east areas. In general, with the passage of time, the levels of FES in China have improved significantly, but there still is some regional polarization.

3.3. Diagnosis of Barrier Factor

Considering the large number of obstacle factors, this paper sorted out the top five indicators in each province as the main obstacle factors according to the ranking of obstacles. At the same time, due to the large sample size, the data in 2018 were selected for the analysis (Table 4). In order to analyze the obstacles of FES of the 31 provinces in China, this paper analyzed the situation of each province according to the administrative division. In North China, as the economic, political and cultural center of China, Beijing’s urbanization rate is the primary obstacle factor that affects its FES. The reduction of the proportion of new afforestation has a strong hindering effect on FES in Tianjin, Hebei, Shanxi, and Inner Mongolia. Among them, the proportion of new afforestation has a stronger hindering effect on FES in Tianjin, Hebei, and Shanxi than that in Inner Mongolia due to the more abundant forest resources in the latter. The decreased indicators including forest stock volume per unit area, the forestry output value per unit forest area, and the proportion of the number of forestry technological exchange personnel to the total number of forestry units are the main factors hindering the improvement of FES levels in north area. Although restricted by economic and resource conditions, achieving high quality development of forest-related industries and increasing forestry science and technology talents could effectively improve their forest ecological security status.
The low proportion of new afforestation is the main obstacle factor of FES in the northeast area, showing that the decrease of new afforestation area in the northeast area is not conducive to the improvement of its FES level. Although forest resources are relatively abundant in the region, the high rate of deforestation in the northeast area threatens the local FES. In addition, the low level of the proportion of forestry science and technological exchange personnel to the total number of forestry units and the low intensity of forestry investment are important factors restricting the improvement of the FES level in Jilin and Heilongjiang. Therefore, to improve the forestry scientific and technological personnel and increase investment in ecological construction funds would be effective ways to improve the FES situation in Jilin and Heilongjiang.
In the east area, the forest coverage rate is the top obstacle factor of FES in Shanghai, Jiangsu, Anhui, and Shandong, indicating that the low forest coverage rate has the greatest impact on FES in these regions. Due to the limited forest resources, it is not in line with reality to significantly increase the forest coverage rate in the short term. Therefore, FES levels could be effectively advanced by increasing the proportion of new afforestation and forest stock per unit area and slowing down the urbanization process. The proportion of newly increased afforestation is the primary obstacle factor of FES in Zhejiang, Fujian, and Jiangxi, which indicates that the low level of the proportion of new afforestation is the primary factor restricting the improvement of their FES levels. The low level of the stock volume per forest area, forestry output value per forest area, and forestry investment intensity are all important factors restricting the improvement of FES in the above-mentioned areas. In general, Zhejiang, Fujian, and Jiangxi are rich in forest resources, especially some areas are the pilot provinces for China’s forestry policy reform. By increasing the afforestation area, enhancing forest management and protection level, changing industrial development mode, and increasing capital investment, forest ecological benefits could be effectively improved and the FES levels could be further enhanced.
In the central area, the main obstacle factors affecting FES in Henan are the forest coverage rate, the proportion of new afforestation and the volume of forest per unit area. Henan, as a large food production province with a long history, has few forest resources, so insufficient investment in forest resources could easily have an adverse impact on its FES. The low level of the proportion of new afforestation, forest stock per unit area and forestry investment intensity are the main factors that hinder the improvement of FES in Hubei and Hunan, indicating that the maintenance and improvement of FES response indexes in Hubei and Hunan has not been in place.
The proportion of newly increased afforestation is the primary obstacle factor in South area, showing that the overall afforestation area in the South area needs to be further strengthened. Guangdong’s economy has developed rapidly over years, with urbanization being an important factor that hinders the improvement of its FES. The important obstacle factors of FES in Guangxi and Hainan include the rate of pest control in forestry and the proportion of the number of scientific and technological exchange personnel to the total number of forestry units. Those two provinces have abundant forest resources, but their economic development speeds are slightly backward compared with other provinces, resulting in insufficient technology and talent responses in these two provinces.
In the southwest area, the primary obstacle factor of FES in Chongqing is the ratio of urbanization, indicating that the acceleration of the urbanization process is not conducive to the maintenance of FES. In addition, the decline of forest stock per unit area and forestry investment intensity also restricts the improvement of FES level in Chongqing.
The primary obstacle factor of FES in Sichuan, Guizhou, and Yunnan is the proportion of new afforestation, showing that the reduction of afforestation restricts the improvement of their FES levels. The decline of the intensity of forestry investment, the value of forestry output per unit of forest area, and the proportion of forestry science and technological exchange personnel to the total number of forestry units are also important factors hindering the improvement of FES levels in these provinces. The above-mentioned areas are rich in forest resources, but it is necessary to maintain forest resources and develop forestry industries. The low forest coverage rate is the most important factor restricting the FES in Tibet, the largest forest area in China, indicating that the quality of Tibet’s forests needs to be further improved. At the same time, the reduction of the proportion of new afforestation and the intensity of forestry investment are also the main factors affecting Tibet’s FES, indicating that the response level of FES in Tibet still needs to be further strengthened.
The indicators including forest coverage rate, new afforestation proportion, forest stock per unit area, forestry investment intensity, and forestry output value per unit area are the main factors affecting the FES level in northwest area. The forest resources in the Northwest area are relatively small and the ecology there is relatively fragile. The obstacle factors all involve forest ecological state and response indicators, indicating that it is necessary for northwest area to expand the area of artificial forests, improve the level of forest management and protection, and further enhance the forest quality, so as to alleviate the conflict between forest ecology and economic development in the region.
In general, from our results the primary obstacle factor limiting the improvement of FES level in most provinces is the forest state indicator, which is consistent with the conclusion of Cai [30].

3.4. Discussions

Based on the above research results, this paper puts forward different suggestions about how to improve the FES levels in different regions with different resource endowment conditions and economic levels. The FES levels of provinces with abundant forest resources, such as Jilin, Heilongjiang, Fujian, Zhejiang, Yunnan, Sichuan, etc., are mostly at the comparatively safe level, with some provinces having entered into a safe level. Such areas need to protect their existing forest resources, control forest fires, plagues and other natural disasters, and improve the utilization rate of forest resources, increase output value of forestry, and pay attention to both development and protection of forest resources so as to enhance the ecological carrying capacity of forests. Some provinces with insufficient forest resources and relatively high levels of economic development, such as Shanghai, Jiangsu, Hebei, Hubei and so on, should embrace the notion that green waters and green mountains are golden mountains and silver mountains, and strategically utilize their own capital, technology, labor, and other advantages to create greater economic value and ecological value of forests, thereby alleviating their artificial ecosystem’s vulnerability. They should also actively develop new energy and strengthen industrial emission management in order to reduce the environmental pressure in the region. For regions with scarce forest resources and relatively backward levels of economic development, such as the Northwest area, they should make full use of advantages of large areas and sparse population to increase afforestation efforts and increase forest coverage at the same time as focusing economic development. Moreover, they should also strengthen the cultivation of farmers’ forest management and protection level to ameliorate the quality of forest resources, so as to steadily enhance their FES level. In general, all provinces still need to further strengthen the construction of ecological risk prevention systems to improve FES response capabilities.
It is worth noting that different evaluation index systems and different weight determination methods would affect the difference in the analytical results [47,48]. Based on the connotation of FES, this paper constructed a forest ecological security evaluation index system from the perspective of the internal mechanism of the interactions between human society and forest ecosystems. However, the evaluation index system established in this article is more suitable for the evaluation and comparison of large-scale provincial FES, and it is less targeted toward the evaluation of the FES level within each province. In addition, the weight determination method adopted in this paper not only avoids the subjectivity of experts’ scoring, but also considers the difference between and within indicators [44]. The evaluation results are basically consistent with the actual situation, indicating that the method we adopted to determine the weight of FES evaluation index is scientific and feasible. With that being said, other research methods such as GIS and ecological footprint methods are worth exploring for comparative analysis in the future to supplement the research on the scope of application of various evaluation methods and the causes of differences in the results.

4. Conclusions

Our results of forest ecological security assessment and obstacle factor analysis in various provinces showed the following: (1) during the study period, the comprehensive index of FES in China’s 31 provinces basically showed an increasing trend, from a critically safe state to a comparatively safe state, indicating that the overall FES level in China continued to improve and showed a positive trend. However, there were large differences in the comprehensive indexes of FES in various provinces. There were more provinces at a comparatively safe level than the provinces at a critical safety level, and the number of provinces in the safe level was small, indicating that the vast majority of provinces still needed to further improve their FES level; (2) there was obvious spatial heterogeneity of FES in China during the observation period. The critical safety level was mainly concentrated in northwest area, the comparatively safe level gradually expanded from the central inland region to the eastern coastal region, and the safe level areas were scattered in the southwest and east area with rich forest resources; and (3) different factors had different constraints on the improvement of FES levels in China. For most provinces, the reduction of the forest coverage rate, and the proportion of new afforestation were the primary factors affecting the levels of FES, which indicated that the quantity and quality of forest resources were the basis of maintaining FES. For some provinces, the urbanization ratio, forest stock per unit area, and forestry investment intensity were also important factors affecting the improvement of FES levels, indicating that each area should increase capital investment and pay attention to improving the quality of forest growth so as to alleviate the negative impact of economic development on the FES.

Author Contributions

Data collection, methodology, writing-original draft, formal analysis, visualization, H.Y.; conceptualization, validation, editing, supervision, J.Y.; writing—review, M.Q.; writing—review, editing, Z.L. All authors have read and agreed to the published version of the manuscript.

Funding

This research was funded by the National Social Science Fund of China (grant number 20BGL171) and Six Talent Peaks Project of Jiangsu Province (grant number NY-064).

Institutional Review Board Statement

Not Applicable.

Informed Consent Statement

Not Applicable.

Data Availability Statement

The data used in the article comes from the National Bureau of Statistics (http://www.stats.gov.cn/accessed on 13 March 2021) and the printed statistical yearbooks, please refer to the Section 2.5 for details.

Conflicts of Interest

The authors declare no conflict of interest.

References

  1. Chen, S.; Shahi, C.; Chen, H.Y.H. Economic and ecological trade-off analysis of forest ecosystems: Options for boreal forests. Environ. Rev. 2016, 24, 348–361. [Google Scholar] [CrossRef]
  2. Tidwell, T.L. Nexus between food, energy, water, and forest ecosystems in the USA. J. Environ. Stud. Sci. 2016, 6, 214–224. [Google Scholar] [CrossRef] [Green Version]
  3. Magalhães, J.L.L.; Lopes, M.A.; de Queiroz, H.L. Development of a Flooded Forest Anthropization Index (FFAI) applied to Amazonian areas under pressure from different human activities. Ecol. Indic. 2015, 48, 440–447. [Google Scholar] [CrossRef]
  4. Chen, H.; Zhang, S.M.; Shi, G.H.; Gao, Y.W.; Wang, Q.F.; Zhang, F.C. Mechanism of increased N content in controlling the M-A constituent of low-carbon Mo-V-N steel. Mater. Lett. 2017, 189, 136–139. [Google Scholar] [CrossRef]
  5. Wang, H.; He, M.Y.; Ran, N.; Xie, D.; Wang, Q.; Teng, M.; Wang, P. China’s Key Forestry Ecological Development Programs: Implementation, Environmental Impact and Challenges. Forests 2021, 12, 101. [Google Scholar] [CrossRef]
  6. Solomon, D.; Lehmann, J.; Zech, W. Land use effects on soil organic matter properties of chromic luvisols in semi-arid northern Tanzania: Carbon, nitrogen, lignin and carbohydrates. Agric. Ecosyst. Environ. 2000, 78, 203–213. [Google Scholar] [CrossRef]
  7. Yang, Y.J.; Song, G.; Lu, S. Assessment of land ecosystem health with Monte Carlo simulation: A case study in Qiqihaer, China. J. Clean. Prod. 2020, 250. [Google Scholar] [CrossRef]
  8. Wen, J.; Hou, K. Research on the progress of regional ecological security evaluation and optimization of its common limitations. Ecol. Indic. 2021, 127, 107797. [Google Scholar] [CrossRef]
  9. Wang, D.C.; Chen, J.H.; Zhang, L.H.; Sun, Z.C.; Wang, X.; Zhang, X.; Zhang, W. Establishing an ecological security pattern for urban agglomeration, taking ecosystem services and human interference factors into consideration. PeerJ 2019, 7. [Google Scholar] [CrossRef]
  10. Liu, T.; Wang, H.Z.; Wang, H.Z.; Xu, H. The spatiotemporal evolution of ecological security in China based on the ecological footprint model with localization of parameters. Ecol. Indic. 2021, 126. [Google Scholar] [CrossRef]
  11. Lu, S.S.; Qin, F.; Chen, N.; Yu, Z.Y.; Xiao, Y.M.; Cheng, X.Q.; Guan, X.L. Spatiotemporal differences in forest ecological security warning values in Beijing: Using an integrated evaluation index system and system dynamics model. Ecol. Indic. 2019, 104, 549–558. [Google Scholar] [CrossRef]
  12. Sun, J.; Li, Y.P.; Gao, P.P.; Xia, B.C. A Mamdani fuzzy inference approach for assessing ecological security in the Pearl River Delta urban agglomeration, China. Ecol. Indic. 2018, 94, 386–396. [Google Scholar] [CrossRef]
  13. Hu, M.M.; Li, Z.T.; Yuan, M.J.; Fan, C.; Xia, B.C. Spatial differentiation of ecological security and differentiated management of ecological conservation in the Pearl River Delta, China. Ecol. Indic. 2019, 104, 439–448. [Google Scholar] [CrossRef]
  14. Xie, H.L.; He, Y.F.; Xie, X. Exploring the factors influencing ecological land change for China’s Beijing-Tianjin-Hebei Region using big data. J. Clean. Prod. 2017, 142, 677–687. [Google Scholar] [CrossRef]
  15. Xu, L.Y.; Yin, H.; Li, Z.; Li, S. Land Ecological Security Evaluation of Guangzhou, China. Int. J. Environ. Res. Public Health 2014, 11, 10537–10558. [Google Scholar] [CrossRef] [Green Version]
  16. Wu, L.; Xie, B.G. The variation differences of cultivated land ecological security between flatland and mountainous areas based on LUCC. PLoS ONE 2019, 14, e0220747. [Google Scholar] [CrossRef] [Green Version]
  17. Zhang, Q.; Wang, G.Y.; Mi, F.; Zhang, X.C.; Xu, L.Z.; Zhang, Y.F.; Jiang, X.L. Evaluation and scenario simulation for forest ecological security in China. J. For. Res. 2019, 30, 1651–1666. [Google Scholar] [CrossRef]
  18. Zhang, Z.G. Measuring model and criterion of forestry ecological security by symbiotic coupling method. China Popul. Resour. Environ. 2014, 24, 90–99. (In Chinese) [Google Scholar]
  19. Li, Q.J.; Chen, S.Z.; Zhao, R. Study on Evaluation of Timber Security in China Based on the PSR Conceptual Model. Forests 2020, 11, 517. [Google Scholar] [CrossRef]
  20. Guan, X.L.; Wei, H.K.; Lu, S.S.; Dai, Q.; Su, H.J. Assessment on the urbanization strategy in China: Achievements, challenges and reflections. Habitat Int. 2018, 71, 97–109. [Google Scholar] [CrossRef]
  21. Huang, J.; Hu, Y.; Zheng, F. Research on recognition and protection of ecological security patterns based on circuit theory: A case study of Jinan City. Environ. Sci. Pollut. Res. 2020, 27, 12414–12427. [Google Scholar] [CrossRef]
  22. Peng, J.; Yang, Y.; Liu, Y.X.; Hu, Y.N.; Du, Y.Y.; Meersmans, J.; Qiu, S.J. Linking ecosystem services and circuit theory to identify ecological security pattern. Sci. Total Environ. 2018, 644, 781–790. [Google Scholar] [CrossRef] [PubMed] [Green Version]
  23. Cai, X.T.; Zhang, B.; Lyu, J.H. Endogenous Transmission Mechanism and Spatial Effect of Forest Ecological Security in China. Forests 2021, 12, 508. [Google Scholar] [CrossRef]
  24. Chen, N.; Qin, F.; Zhai, Y.X.; Cao, H.P.; Zhang, R.; Cao, H.P. Evaluation of coordinated development of forestry management efficiency and forest ecological security: A spatiotemporal empirical study based on China’s provinces. J. Clean. Prod. 2020, 260. [Google Scholar] [CrossRef]
  25. Chu, X.; Deng, X.Z.; Jin, G.; Wang, Z.; Li, Z.H. Ecological security assessment based on ecological footprint approach in Beijing-Tianjin-Hebei region, China. Phys. Chem. Earth 2017, 101, 43–51. [Google Scholar] [CrossRef]
  26. Li, F.Z.; Lu, S.S.; Sun, Y.N.; Li, X.; Xi, B.Y.; Liu, W.Q. Integrated Evaluation and Scenario Simulation for Forest Ecological Security of Beijing Based on System Dynamics Model. Sustainability 2015, 7, 13631–13659. [Google Scholar] [CrossRef] [Green Version]
  27. Lu, S.S.; Tang, X.; Guan, X.L.; Qin, F.; Liu, X.; Zhang, D.H. The assessment of forest ecological security and its determining indicators: A case study of the Yangtze River Economic Belt in China. J. Environ. Manag. 2020, 258, 110048. [Google Scholar] [CrossRef]
  28. Tang, X.; Guan, X.L.; Lu, S.S.; Qin, F.; Liu, X.; Zhang, D.H. Examining the spatiotemporal change of forest resource carrying capacity of the Yangtze River Economic Belt in China. Environ. Sci. Pollut. Res. 2020, 27, 21213–21230. [Google Scholar] [CrossRef]
  29. Wang, Y.R.; Zhang, D.H.; Wang, Y.H. Evaluation Analysis of Forest Ecological Security in 11 Provinces (Cities) of the Yangtze River Economic Belt. Sustainability 2021, 13, 4845. [Google Scholar] [CrossRef]
  30. Cai, X.T.; Jiang, Y. Evolution of space-time pattern of Chinese forest ecological security and its obstacle factor diagnosis. Stat. Decis. 2019, 35, 96–100. (In Chinese) [Google Scholar]
  31. Chen, D.J.; Qu, W.L.; Li, Y.C.; Wu, X.Z.; Gou, S.P. Study on forest ecological dynamic security in Gansu province. Acta Prataculturae Sin. 2016, 25, 188–193. (In Chinese) [Google Scholar]
  32. Wang, L.; Bian, Z.F.; Chen, H.Q. Land ecological security assessment for Yancheng city based on catastrophe theory. Earth Sci. Res. J. 2014, 18, 181–187. [Google Scholar] [CrossRef]
  33. Li, Z.T.; Li, M.; Xia, B.C. Spatio-temporal dynamics of ecological security pattern of the Pearl River Delta urban agglomeration based on LUCC simulation. Ecol. Indic. 2020, 114, 106319. [Google Scholar] [CrossRef]
  34. Lu, S.S.; Li, J.P.; Guan, X.L.; Gao, X.J.; Gu, Y.H.; Zhang, D.H.; Mi, F.; Li, D.D. The evaluation of forestry ecological security in China: Developing a decision support system. Ecol. Indic. 2018, 91, 664–678. [Google Scholar] [CrossRef]
  35. Cao, C.X.; Yang, B.; Xu, M.; Li, X.W.; Singh, R.P.; Zhao, X.J.; Chen, W. Evaluation and analysis of post-seismic restoration of ecological security in Wenchuan using remote sensing and GIS. Geomat. Nat. Hazards Risk 2015, 7, 1919–1936. [Google Scholar] [CrossRef] [Green Version]
  36. Liao, B.; Zhang, Z.G. The empirical measurement of coupling from indicators to indexes of forestry ecological security. Resour. Sci. 2017, 39, 1777–1791. (In Chinese) [Google Scholar]
  37. Mi, F.; Tan, Z.H.G.D.; Gu, Y.H.; Lu, S.S.; Zhang, D.H. Difference analysis and evaluation of Chinese forest ecological security. For. Sci. 2015, 51, 107–115. (In Chinese) [Google Scholar]
  38. Feng, Y.; Zhu, L.Y.; Zheng, J.; Xin, S.Y.; Zhang, D.H. County forest ecological security assessment and spatial analysis of Jinlin province based on PSR model and GIS. J. Agric. For. Econ. Manag. 2016, 15, 546–556. (In Chinese) [Google Scholar]
  39. Xu, H.Y.; Zhao, X.J.; Zhang, D.H. Evaluation and difference analysis of provincial forest ecological security in China based on the background of ecological civilization construction. Acta Ecol. Sin. 2018, 38, 6235–6242. (In Chinese) [Google Scholar]
  40. Chen, Y.; Liu, R.; Barrett, D.; Gao, L.; Zhou, M.W.; Renzullo, L.; Emelyanova, I. A spatial assessment framework for evaluating flood risk under extreme climates. Sci. Total Environ. 2015, 538, 512–523. [Google Scholar] [CrossRef]
  41. Zhao, Y.Z.; Zou, X.Y.; Cheng, H.; Jia, H.K.; Wu, Y.Q.; Wang, G.Y.; Zhang, C.L.; Gao, S.Y. Assessing the ecological security of the Tibetan plateau: Methodology and a case study for Lhaze County. J. Environ. Manag. 2006, 80, 120–131. [Google Scholar] [CrossRef]
  42. Wu, X.; Liu, S.; Sun, Y.X.; An, Y.; Dong, S.K.; Liu, G.H. Ecological security evaluation based on entropy matter-element model: A case study of Kunming city, southwest China. Ecol. Indic. 2019, 102, 469–478. [Google Scholar] [CrossRef]
  43. Wang, Z.; Zhou, J.Q.; Loaiciga, H.; Guo, H.C.; Hong, S. A DPSIR Model for Ecological Security Assessment through Indicator Screening: A Case Study at Dianchi Lake in China. PLoS ONE 2015, 10. [Google Scholar] [CrossRef] [PubMed]
  44. Yu, S.; Liu, H.; Bai, L.; Han, F.H. Study on the Suitability of Passive Energy in Public Institutions in China. Energies 2019, 12, 2446. [Google Scholar] [CrossRef] [Green Version]
  45. Feng, Y.; Zheng, J.; Zhu, L.Y.; Xin, S.Y.; Sun, B.; Zhang, D.H. County forest ecological security evaluation and spatial analysis in Hubei province based on PSR and GIS. Econ. Geogr. 2017, 37, 171–178. (In Chinese) [Google Scholar]
  46. Huang, H.P.; Yang, Z.Z. Dynamic changes of forest ecological security based on PSR-entropy fuzzy matter-element model-a case study of six provinces in central China. China Agric. Resour. Reg. Plan. 2018, 39, 42–51. (In Chinese) [Google Scholar]
  47. Chen, Y.D.; Xu, S.; An, X. Construction and demonstration of forestry ecological security evaluation index system. Stat. Decis. Mak. 2021, 37, 36–40. (In Chinese) [Google Scholar]
  48. Li, T.; Chen, T.Y.; Mi, F.; Ma, L.B. Evaluation of China’s forest ecological security based on variable weight theory and DPSIRM. China Environ. Sci. 2021, 41, 2411–2422. (In Chinese) [Google Scholar]
Figure 1. The changes of FES index in China and various regions. (A) The changes of FES index in China; (B) the changes of FES index in the north area; (C) the changes of FES index in the northeast area; (D) the changes of FES index in the east area; (E) the changes of FES index in the central area; (F) the changes of FES index in the south area; (G) the changes of FES index in the southwest area; (H) the changes of FES index in the northwest area.
Forests 12 01526 g001
Figure 2. The spatial layout of China’s FES levels.
Forests 12 01526 g002aForests 12 01526 g002b
Table 1. The evaluation index system of Forest Ecological Security (FES).
Target LayerLevel
Indicators
Factor LayersSpecific Indicators (Unit)FormulaDirectionWeight
Evaluation of forest ecological
security
Pressure Social pressure Urbanization ratio X1 Urban population/total population - 0.100
Economic pressure Wood consumption per unit of GDP X2 Timber consumption/GDP - 0.073
Ecological pressure Forest harvesting intensity X3 Timber production/forest volume*100% - 0.053
State Resource indicators Forest cover rate X4 Forest area/land area + 0.128
Forest stock volume per unit area X5 Forest stock/forest area + 0.091
Disaster indicators Forest fire damage rate X6 Forest fire-affected area/forest area - 0.041
Damage rate of forest pests and rodents X7 Forest pests and rodents occurrence area/forest area - 0.064
Industry status indicators Forestry output value per unit forest area X8 Forestry output value/forest area + 0.060
Forest park tourism income per unit of forest park area X9 Forest park tourism income/forest park area + 0.039
Response Talent response The proportion of forestry science and technology exchange and extension personnel in the total personnel of forestry units X10 Number of forestry science and technology exchange and popularization personnel/total number of forestry units + 0.065
Technical response Forestry Technology Progress Index X11 Forestry output value/timber production + 0.048
Forest pest control rate X12 Forestry pest control area/forest area + 0.088
Input response Forestry investment intensity x13 Forestry completed investment/forest land area + 0.064
New afforestation area per unit forest
area X14
Afforestation area/forest area + 0.087
Table 2. The classification standards of FES levels.
LevelFeatureForest Ecological Security Index
unsafe state IThe forest ecosystem is extremely insecure. The forest ecosystem is close to the edge of collapse and cannot guarantee the basic ecological security of the forest.[0, 0.300]
critically safe state IIThe forest ecosystem is unstable and the ecological function is beginning to degrade.(0.300, 0.450]
comparatively safe state IIIThe forest ecosystem is still stable and can play the basic functions of the forest ecosystem.(0.450–0.520]
safe state IVThe forest ecosystem is in a relatively stable state.(0.520–0.800]
ideal state VThe forest ecosystem is in a stable state.(0.800–1.000]
Table 3. The calculated results of FES indices of 31 provinces in China, 2009–2018.
Area Province 2009 2010 2011 2012 2013 2014 2015 2016 2017 2018
North areaBeijing0.4060.4010.4370.4620.4950.4740.4460.4590.4890.495
Tianjin0.3810.3220.3510.3340.3370.3650.3790.3770.4280.373
Hebei0.4590.4530.4380.4370.4480.4530.4450.4850.4770.491
Shanxi0.4560.4400.4210.4400.4290.4270.4140.4360.4520.458
Inner Mongolia0.3740.3690.3770.3910.3910.3770.3820.3920.3840.392
Northeast areaLiaoning0.4250.4350.4490.4520.4560.4520.4380.4370.4430.463
Jilin0.4310.4430.4930.4920.4960.4810.4930.4370.5170.519
Heilongjiang0.4580.4360.4730.4790.4740.4830.4780.4750.4810.476
East areaShanghai0.3860.4840.4650.4990.5370.5630.5960.6210.5660.558
Jiangsu0.4400.4100.4180.4150.4480.4600.4510.4460.4540.443
Zhejiang0.4850.4880.4940.4910.5110.5100.5210.5280.5290.531
Anhui0.4030.4060.4090.4160.4460.4490.4550.4450.4630.466
Fujian0.4260.4570.5040.4830.5170.5230.5230.5380.5370.537
Jiangxi0.4890.4850.4570.5010.4870.4830.4810.5050.5220.528
Shandong0.4190.4160.4330.4350.4550.5000.4950.4750.4630.459
Central areaHenan0.4760.4450.4490.4480.4640.4660.4540.4510.4590.463
Hubei0.4500.4810.4290.4400.4490.4470.4590.4660.4900.473
Hunan0.3980.4250.4260.4430.4890.4960.4850.4270.4790.489
South areaGuangdong0.3990.4010.4040.4190.4230.4270.4330.4540.4560.460
Guangxi0.3890.3850.3840.3850.3710.3910.3910.3660.3690.379
Hainan0.4330.4570.4010.4570.4220.4440.4350.4420.4520.442
Southwest areaChongqing0.4730.4990.4750.4680.4620.4550.4680.4450.5040.512
Sichuan0.4980.4970.4630.4850.4580.4850.4970.5000.5000.488
Guizhou0.4490.4160.4260.4480.4800.4890.5010.4900.5290.515
Yunnan0.5110.5080.5110.5170.5290.5290.5330.5350.5330.535
Tibet0.3780.4070.4180.4390.5070.4920.4810.4800.4790.444
Northwest areaShaanxi0.4700.4650.4550.4670.4890.4980.4900.4850.4950.496
Gansu0.4450.4380.4040.4020.4220.4190.4210.4270.4410.446
Qinghai0.3830.3710.3660.3590.3700.3780.3750.3940.4240.439
Ningxia0.3870.3960.3920.3730.4050.4040.3890.4160.4080.448
Xinjiang0.3910.3740.3750.3740.3540.3560.3830.3820.3910.401
ChinaChina0.4310.4330.4320.4400.4520.4570.4580.4590.4710.472
Table 4. The obstacle factors and obstacle degrees of FES of the 31 provinces (2018).
ProvinceIndex Ranking (Obstacle Factor/Obstacle Degree)ProvinceIndex Ranking (Obstacle Factor/Obstacle Degree)
1234512345
BeijingX1X5X14X10X8HubeiX14X5X13X1X4
18.8814.9313.3212.4111.2312.4612.4411.1110.6710.52
TianjinX4X1X5X8X14HunanX5X14X13X10X8
17.8014.4112.059.108.9914.1711.8111.2910.8810.74
HebeiX4X5X13X8X10Guang-dongX14X1X5X13X10
16.0315.6311.4211.1110.2713.6713.2912.1611.529.99
ShanxiX4X5X13X10X8GuangxiX14X12X2X5X10
17.4213.1811.1910.7510.7012.8011.9111.0310.789.93
Inner MongoliaX4X14X10X13X5HainanX14X12X13X10X8
14.9912.6110.4610.429.8715.3211.2311.2110.9710.06
LiaoningX14X1X5X13X8Chong-qingX1X5X13X10X8
13.6812.6411.9211.6910.7313.1112.3112.1511.5811.44
JilinX14X10X13X8X1SichuanX14X13X4X8X10
16.7113.3112.8412.0110.8314.9011.9811.4611.2311.21
HeilongjiangX14X10X13X8X1GuizhouX14X5X10X13X8
16.3712.3711.9811.2410.6713.5313.3612.4811.8111.43
ShanghaiX4X1X14X5X9YunnanX14X13X10X8X11
24.3422.1215.8914.705.9117.0513.5213.0112.5910.20
JiangsuX4X14X1X5X10TibetX4X14X12X13X10
18.8913.3312.5912.2710.3520.0415.4112.8211.4711.39
ZhejiangX14X1X5X13X8ShaanxiX14X5X13X8X1
17.6814.7314.3913.0410.8413.5612.4312.1611.5010.49
AnhuiX4X14X5X13X10GansuX4X5X13X8X10
14.5713.2311.5110.959.3820.4111.8510.9910.599.35
FujianX14X1X10X13X8QinghaiX4X5X14X13X8
16.4313.8913.4312.9311.1522.1615.9511.3311.2110.61
JiangxiX14X5X13X10X8NingxiaX4X5X13X8X1
15.4813.8813.0412.6611.6320.0116.0811.1210.339.80
ShandongX4X5X14X1X11XinjiangX4X14X5X13X8
18.5413.8611.1510.628.6921.0812.1811.0210.399.75
HenanX4X14X5X13X8
16.2012.4012.0011.2810.05
Publisher’s Note: MDPI stays neutral with regard to jurisdictional claims in published maps and institutional affiliations.

