Article

Identifying Wood Based on Near-Infrared Spectra and Four Gray-Level Co-Occurrence Matrix Texture Features

1
Research Institute of Wood Industry, Chinese Academy of Forestry, Beijing 100091, China
2
Hubei Technology Exchange, Wuhan 430071, China
3
Department of Sustainable Biomaterials, Virginia Polytechnic Institute and State University, Blacksburg, VA 24060, USA
*
Author to whom correspondence should be addressed.
These authors contributed equally to this work.
Forests 2021, 12(11), 1527; https://doi.org/10.3390/f12111527
Submission received: 18 September 2021 / Revised: 29 October 2021 / Accepted: 1 November 2021 / Published: 5 November 2021
(This article belongs to the Section Wood Science and Forest Products)

Abstract

:
Identifying wood accurately and rapidly is one of the best ways to prevent wood product fakes and adulterants in forestry products. Wood identification traditionally relies heavily on special experts that spend extensive time in the laboratory. A new method is proposed that uses near-infrared (NIR) spectra at a wavelength of 780–2300 nm incorporated with the gray-level co-occurrence (GLCM) texture feature to accurately and rapidly identify timbers. The NIR spectral features were determined by principal component analysis (PCA), and the digital image features extracted with the GLCM were used to create a support vector machine (SVM) model to identify the timbers. The results from fusion features of raw spectra and four GLCM features of 25 timbers showed that identification accuracy by the model was 99.43%. A sample anisotropy and heterogeneity comparative analysis revealed that the wood identification information from the transverse surface had more characteristics than that from the tangential and radial surfaces. Furthermore, short-wavelength pre-processed NIR bands of 780–1100 nm and 1100–2300 nm realized high identification accuracy of 99.43% and 100%, respectively. The four GLCM features were effective for improving identification accuracy by improving the data spatial clustering features.

1. Introduction

The forest products industry, such as the building and furniture manufacturing industries, has become prosperous worldwide. Wood is traded actively and globally as a raw material. Many timbers in the market are not native to the importing country and are difficult for local people to identify. For example, the supply of wood raw material in China is mainly by importation [1]. Consumers know little about exotic wood, and fakes and adulterants of wood products are challenging for the forest products industry. Therefore, an on-site, accurate wood identification technique is necessary for the industry.
The traditional method of identifying wood requires a special expert who spends an extended time identifying a sample. This method needs to be improved for on-site rapid testing in market supervisory agencies [2]. Near-infrared (NIR) spectral analysis and image identification have the potential to be used for the on-site identification of wood because of the advantages of non-destructive testing, fast identification, and instrument portability. Red oak and white oak species have been correctly classified with NIR spectra and soft independent modeling of class analogies [3]. NIR spectra with the aid of partial least squares for discrimination analysis has been used to identify true mahogany (Swietenia macrophylla King.) from three similar-looking types of wood, including crabwood (Carapa guianensis Aubl.), cedar (Cedrela odorata L.), and curupixá (Micropholis melinoniana Pierre), at two conditions of laboratory-processed powder [4] and solid wood block [5]. Eight rosewoods were clearly placed in eight categories by principal component analysis (PCA) based on the NIR spectra [6]. Seven high-value Dalbergia wood species were identified at the species level using portable NIR technology [7]. Softwood and hardwood species from ancient wooden statues were successfully identified by NIR spectra combined with PCA [8].
Wood identification has been carried out based on image analysis. Ibrahim et al. presented an automated wood texture recognition system, in which the pore features are used to assign new images to broad categories, and then the image is classified into a particular species by another set of textural features [9]. In a subsequent study, Ibrahim et al. used 24 statistical features of vessels to successfully identify 30 species [10]. Yusof et al. proposed a Kernel–Genetic algorithm technique to select nonlinear features in macroscopic images of wood for a tropical wood species recognition system [11]. Rajagopal et al. introduced an image quality assessment module in a wood identification system to improve identification accuracy [12]. Kobayashi et al. constructed a wood recognition system using the textural features of a low-resolution computed tomography image [13]. Based on the textural features extracted using gray-level co-occurrence (GLCM), Bremananth et al. developed a wood identification system to classify 10 species of Indian woods [14]. Yousof et al. introduced a fuzzy logic-based pre-classifier mechanism in a 52 species tropical wood recognition system. The method pre-classified the species into groups based on pore characteristics extracted using the statistical properties of the pore distribution and identified the wood species using the features extracted with the basic gray-level aura matrix [15].
Those studies indicated that the use of NIR spectra and image identification are effective methods for wood identification. However, increasing the quality and quantity of the spectral database are key steps to improve the identification accuracy of the NIR spectral model, but it is unlikely to be accomplished in the short term. Previous reports have indicated that the pore and textural characteristics are two main useful features for identifying wood images, but the pore features are only suitable for pre-classifying where the wood species are classified into groups in some cases. There is no precise boundary between categories. Wood texture varies within similar species, as it is influenced by the growing location, weather, age, and different parts of the wood. Introducing better features with more discriminative power is a challenge for wood image identification.
A novel method based on a fusion of NIR spectral features and digital image texture features is proposed in this study to improve the robustness and accuracy of wood identification. The innovation in this study is that the information obtained from the NIR spectra and digital wood image can be used to identify wood that overcomes the limitations of a single feature. PCA was used to reduce the dimensions and extract the NIR spectral data features. GLCM was used to extract the textural features of the wood digital images. In this study, the NIR spectra and textural features were combined at the feature level, and a support vector machine (SVM) model was created to identify 25 common timbers widely used in solid wood flooring. The effectiveness of the proposed method was evaluated. The identification efficiencies of three different wood surfaces (transverse, radial, and tangential sections) were compared, and identification accuracy was analyzed.

2. Materials and Methods

2.1. Sample Preparation

In total, 25 timbers, commonly used for flooring, were studied (Table 1). They were acquired from the Beijing Dongba wood market at different times. The boards were randomly collected to represent timbers in general. Five 900 × 160 × 18 mm boards were purchased for every timber. The wood samples anatomical analysis and the consistency ascertain were conducted in the Research Institute of Wood Industry, Chinese Academy of Forestry. A total of 42 cubes with sides of 15 mm along the longitudinal, tangential, and radial directions were prepared from the heartwood of the 25 timbers using the planer and circular saws. Among them, 28 samples were randomly used as the training set, and 14 were in the test set. The wood samples were equilibrated in a chamber before the experiment at a constant temperature of 20 °C and relative humidity of 65%. The samples were considered to reach equilibrium moisture content when the difference between wood samples weights determined every 24 h was less than 0.5% of the wood samples mass.

2.2. NIR Spectra and Digital Image Collection

The NIR spectra were measured with an ASD Field Spec® spectrometer (Analytical Spectral Devices, Boulder, CO, USA) in diffuse reflectance mode at 1 nm intervals over the wavelength range of 350 to 2500 nm. The fiber optic probe with an 8 mm light spot was set perpendicularly to the surface of the solid wood cube sample when the spectrum was acquired. The distance between the fiber optic probe and the surface of the wood sample was 5 mm. A commercial Teflon® background (Boulder, CO, USA) was used as a calibration whiteboard. The spectrometer was recalibrated with the whiteboard after 30 min. The sample count/average was set to 30 (30 scans were performed), and they were averaged into a single spectrum. The NIR spectra were measured on the transverse, radial, and tangential surfaces. One spectrum was collected from all surfaces of each sample. There were 1050 samples and 42 spectra for each timber surface. The spectral region of 780–2300 nm was selected for data analysis.
The digital images of the transverse, radial, and tangential surfaces were scanned using the HP Scanjet 4850 (China Hewlett-Packard Co., Ltd., Shenzhen, China). The scan sample area was 15 × 15 mm, the image resolution was 512 × 512 pixels with horizontal and vertical resolutions of 800 dpi, and the image was stored in JPEG format. The surface of the digital image corresponded to the surface used during the collection of the spectrum.

2.3. Feature Extraction Analysis and the Fusion Information Model

2.3.1. Principal Component Analysis

PCA is a bilinear modeling and projection method. Data from the original variables are converted into a smaller number of latent variables called PCs. Each PC explains a certain amount of the information in the original dataset with the first PC providing the greatest source of information in the dataset. PC scores are the projected locations of each sample corresponding to the PC. The loading represents the contribution of each variable to each PC, so the method reduces the dimensionality of the original variables by selecting the variable in the PC model [16,17]. NIR bands often overlap with redundancy and noise. PCA is used to extract the information from a data matrix and reduce noise. The model for the matrix with a given number of PCs was expressed as
X = TP T + E
where T is the score matrix, P is the loading matrix, and E is the error matrix.
PCA was carried out for the NIR spectra to extract the feature information and reduce the data matrix dimensions.

2.3.2. Extracting the Textural Feature Based on the GLCM

GLCM is an approach based on statistical calculations of the second-order histograms in grayscale images. In this method, the texture is formed by the repeated occurrence of grayscale distribution in the spatial position. GLCM shows that the spatial distribution of each pixel in the image contains textural information and is expressed as follows:
p   ( i , j , d , θ ) = { [ ( x , y ) , ( x + a , y + b ) | f ( x , y ) = i ;   f ( x + a , y + b ) = j ] }
where d is distance, θ is the angle (usually 0°, 45°, 90° or 135°), i, j is the pixel grayscale of two points (i, j = 1, 2…… g, and g is the gray level of image).
As the GLCM results depended on the g, d, and θ values in this study, g = 8, d = 4, and the average value of the GLCM feature composed of 0°, 45°, 90°, and 135° were used to ensure the rotation invariant. Four common descriptors—namely, angular second moment (ASM), contrast, correlation, and entropy, were used [18,19].
The ASM provides the sum of square elements in the GLCM matrix. This value is high when the frequency of repeated image pixels is high. The ASM describes the thickness of the texture and the uniformity of the gray distribution [20].
Angular   Second   Moment   ( ASM ) = i = 1 g j = 1 g p 2 ( i , j , d , θ )
Contrast measures the intensity linking contrast between a pixel and its neighbor in the entire image. It describes the strength of the texture and the sharpness of the image [20].
Contrast   = i = 1 g j = 1 g [ ( i j ) 2 × p 2 ( i , j , d , θ ) ]
Correlation is a measure of gray-tone linear dependence in an image. It specifies how a pixel is correlated with its neighbor. Correlation can be used to determine the main direction of the texture [20].
Correlation   = i = 1 g j = 1 g [ i × j × p ( i , j , d , θ ) μ 1 × μ 2 ] / ( d 1 × d 2 )
where μ 1 = i = 1 g i j = 1 g p ( i , j , d , θ ) ; μ 2 = j = 1 g j i = 1 g p ( i , j , d , θ ) ;
d 1 2 = i = 1 g ( i μ 1 ) 2 j = 1 g p ( i , j , d , θ ) ; d 2 2 = j = 1 g ( j μ 1 ) 2 i = 1 g p ( i , j , d , θ ) .
Entropy calculates the randomness of the image. A homogeneous image will result in a lower entropy value. Entropy reflects textural complexity [20].
Entropy   = i = 1 g j = 1 g ( i m ) 2 p ( i , j , d , θ )
where m is the means value of p ( i , j , d , θ ) .
The SVM model was used. A linear function occasionally cannot separate a model. The data were mapped into a new feature space and a dual representation was used with the data from their dot product. A kernel function was used to map from the original space to the feature space. The function can be more than a single form so that it can handle nonlinear classification. Kernels are viewed as the mapping of nonlinear data to a higher dimensional feature space. Kernels provide a computation shortcut by allowing linear algorithms to work with higher dimensional feature space [21].

3. Results and Discussion

3.1. NIR Spectra and GLCM Features

Figure 1 shows the raw NIR spectra on the transverse surfaces of the first ten wood samples. The gaps among the different timbers on the spectral curve were so narrow that it was difficult to distinguish them from the traditional spectral retrieval method. A multivariate analysis was necessary to classify the wood using the NIR spectra. Table 2 shows the GLCM textural features on the transverse surface. Four GLCM features differed among the timbers. The range in the contrast value of Manilkara sp. did not overlap with the ranges of Hymenaea sp., Newtonia sp., Intsia sp., Cluta sp., and Acacia sp. The range of the Madhuca sp. contrast value did not overlap with the range of Hymenaea sp. and Newtonia sp. These results indicate that the GLCM textural features can be applied to identify wood species. The order of the magnitude of difference among the four GLCM features was remarkable, and the GLCM parameters were normalized.

3.2. Wood Identification Based on Raw NIR Spectra and GLCM Features

The raw NIR spectra were divided into three bands (band 1: 780–1100 nm, band 2: 1100–2300 nm, and band 3: 780–2300 nm, Figure 1). They were analyzed with the PCA to obtain the feature information. Table 3 shows the classification results for each timber based on the NIR, GLCM features, and fusion features. Accuracy was determined by calculating the proportion of correctly identified samples in the test set. The independent raw NIR spectra features and the four GLCM features were insufficient to accurately classify the 25 timbers. The identification accuracy was only 66.86%, 69.43%, and 87.14% for the three raw NIR spectral band features, respectively, and 93.14% for the four GLCM features (Table 3). The accuracy of the NIR and GLCM features combined information improved significantly compared with the raw NIR and GLCM features alone. Accuracy was 99.43% after all of the NIR band features and GLCM texture features were combined, which was about a 6% improvement over the results obtained from the spectra or GLCM features alone. The combination of the NIR spectral features and the GLCM textural feature significantly improved classification accuracy. Tabebuia sp. 1 and Tabebuia sp. 2 were from the same genus in Bignoniaceae. The accuracy of the two species varied greatly when using an identification model based on a single feature. However, the two species tended to have the same or similar accuracy when the identification model was based on the combined features. This result was also found for Pterocarpus sp. 1 and Pterocarpus sp. 2 from the same genus in Fabaceae (Table 3). Therefore, the feature information of the proposed method is repeatable even within the same genus sample.
Although the NIR spectra and GLCM features were useful for identifying the wood, a single feature did not provide sufficient information. The NIR spectra of wood only provide the chemical composition and molecular structure. The four GLCM descriptors describe the digital image textural features. Combining the spectral and textural features added more useful information to identify the wood and overcome the limitations of a single feature.
Some limitations were reflected by the experiments. The limited short-wavelength NIR bands feature combined with the GLCM features was not as good as combining the entire NIR band and the GLCM features to identify the 25 timbers. Overall, accuracies of 97.71% and 97.14% were obtained from the model based on band 1 and band 2 combined with the GLCM features, respectively. However, some samples were misclassified into other wood, particularly in the model of band 2 fused GLCM features, and up to eight Acacia sp. samples were misclassified into Gluta sp.

3.3. The Influence of Heterogeneity for Identifying Wood

Wood anisotropy and heterogeneity affect wood identification. An early report [2] showed that the transverse section was better for wood classification with multidimensional texture analyses. If any surface can be used for identifying wood, the method has more on-site flexibility.
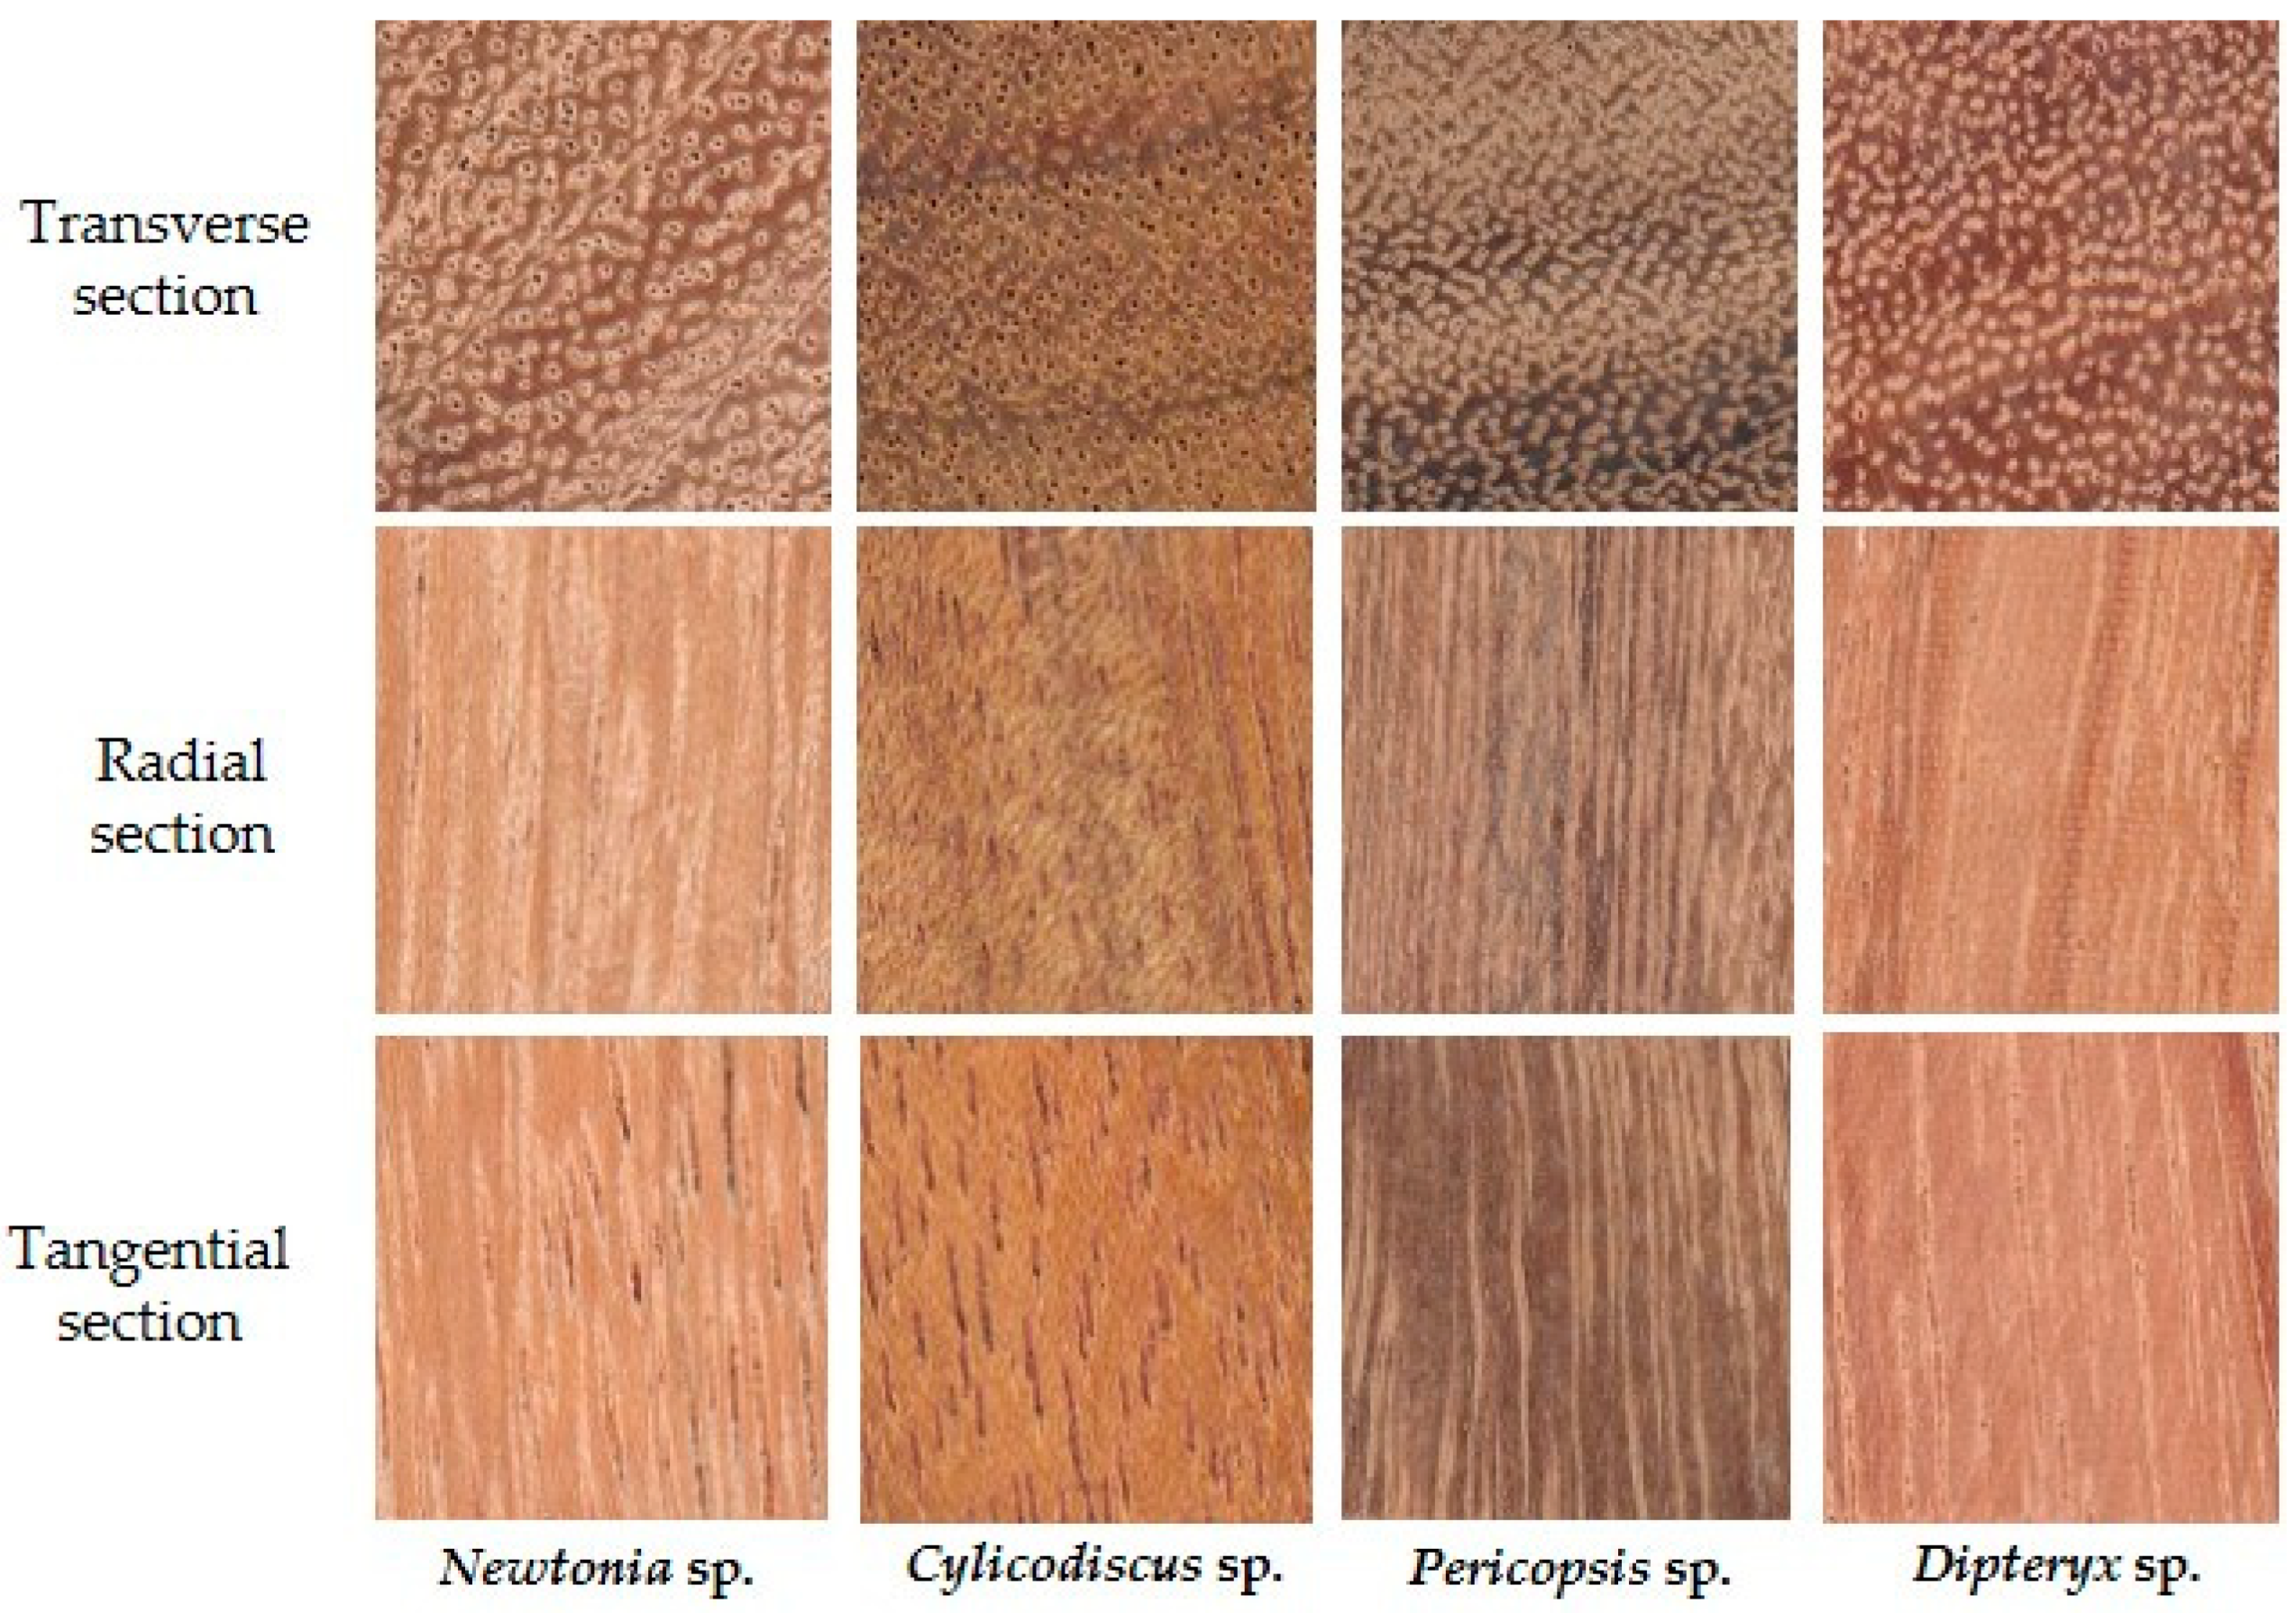
Figure 2 and Table 4 show the digital images from the three surfaces and four GLCM features on the three surfaces, respectively. There were large visual differences among the three surfaces and the GLCM features differed (the sample representative images of all timbers in this paper are included in the Supplementary Materials Table S1). Figure 3 shows the NIR spectra from the three surfaces of Dipteryx sp. The NIR spectral curves from the three surfaces varied widely due to the wood structure particularly between the transverse section and the other two sections. A wood transverse section consists of a cross section of many fibers and vessels in these hardwoods, and the longitudinal axis of the fiber and vessel cells is parallel to the direction of the NIR spectra incident light; therefore, the NIR energy travels further into the wood and more is absorbed [22].
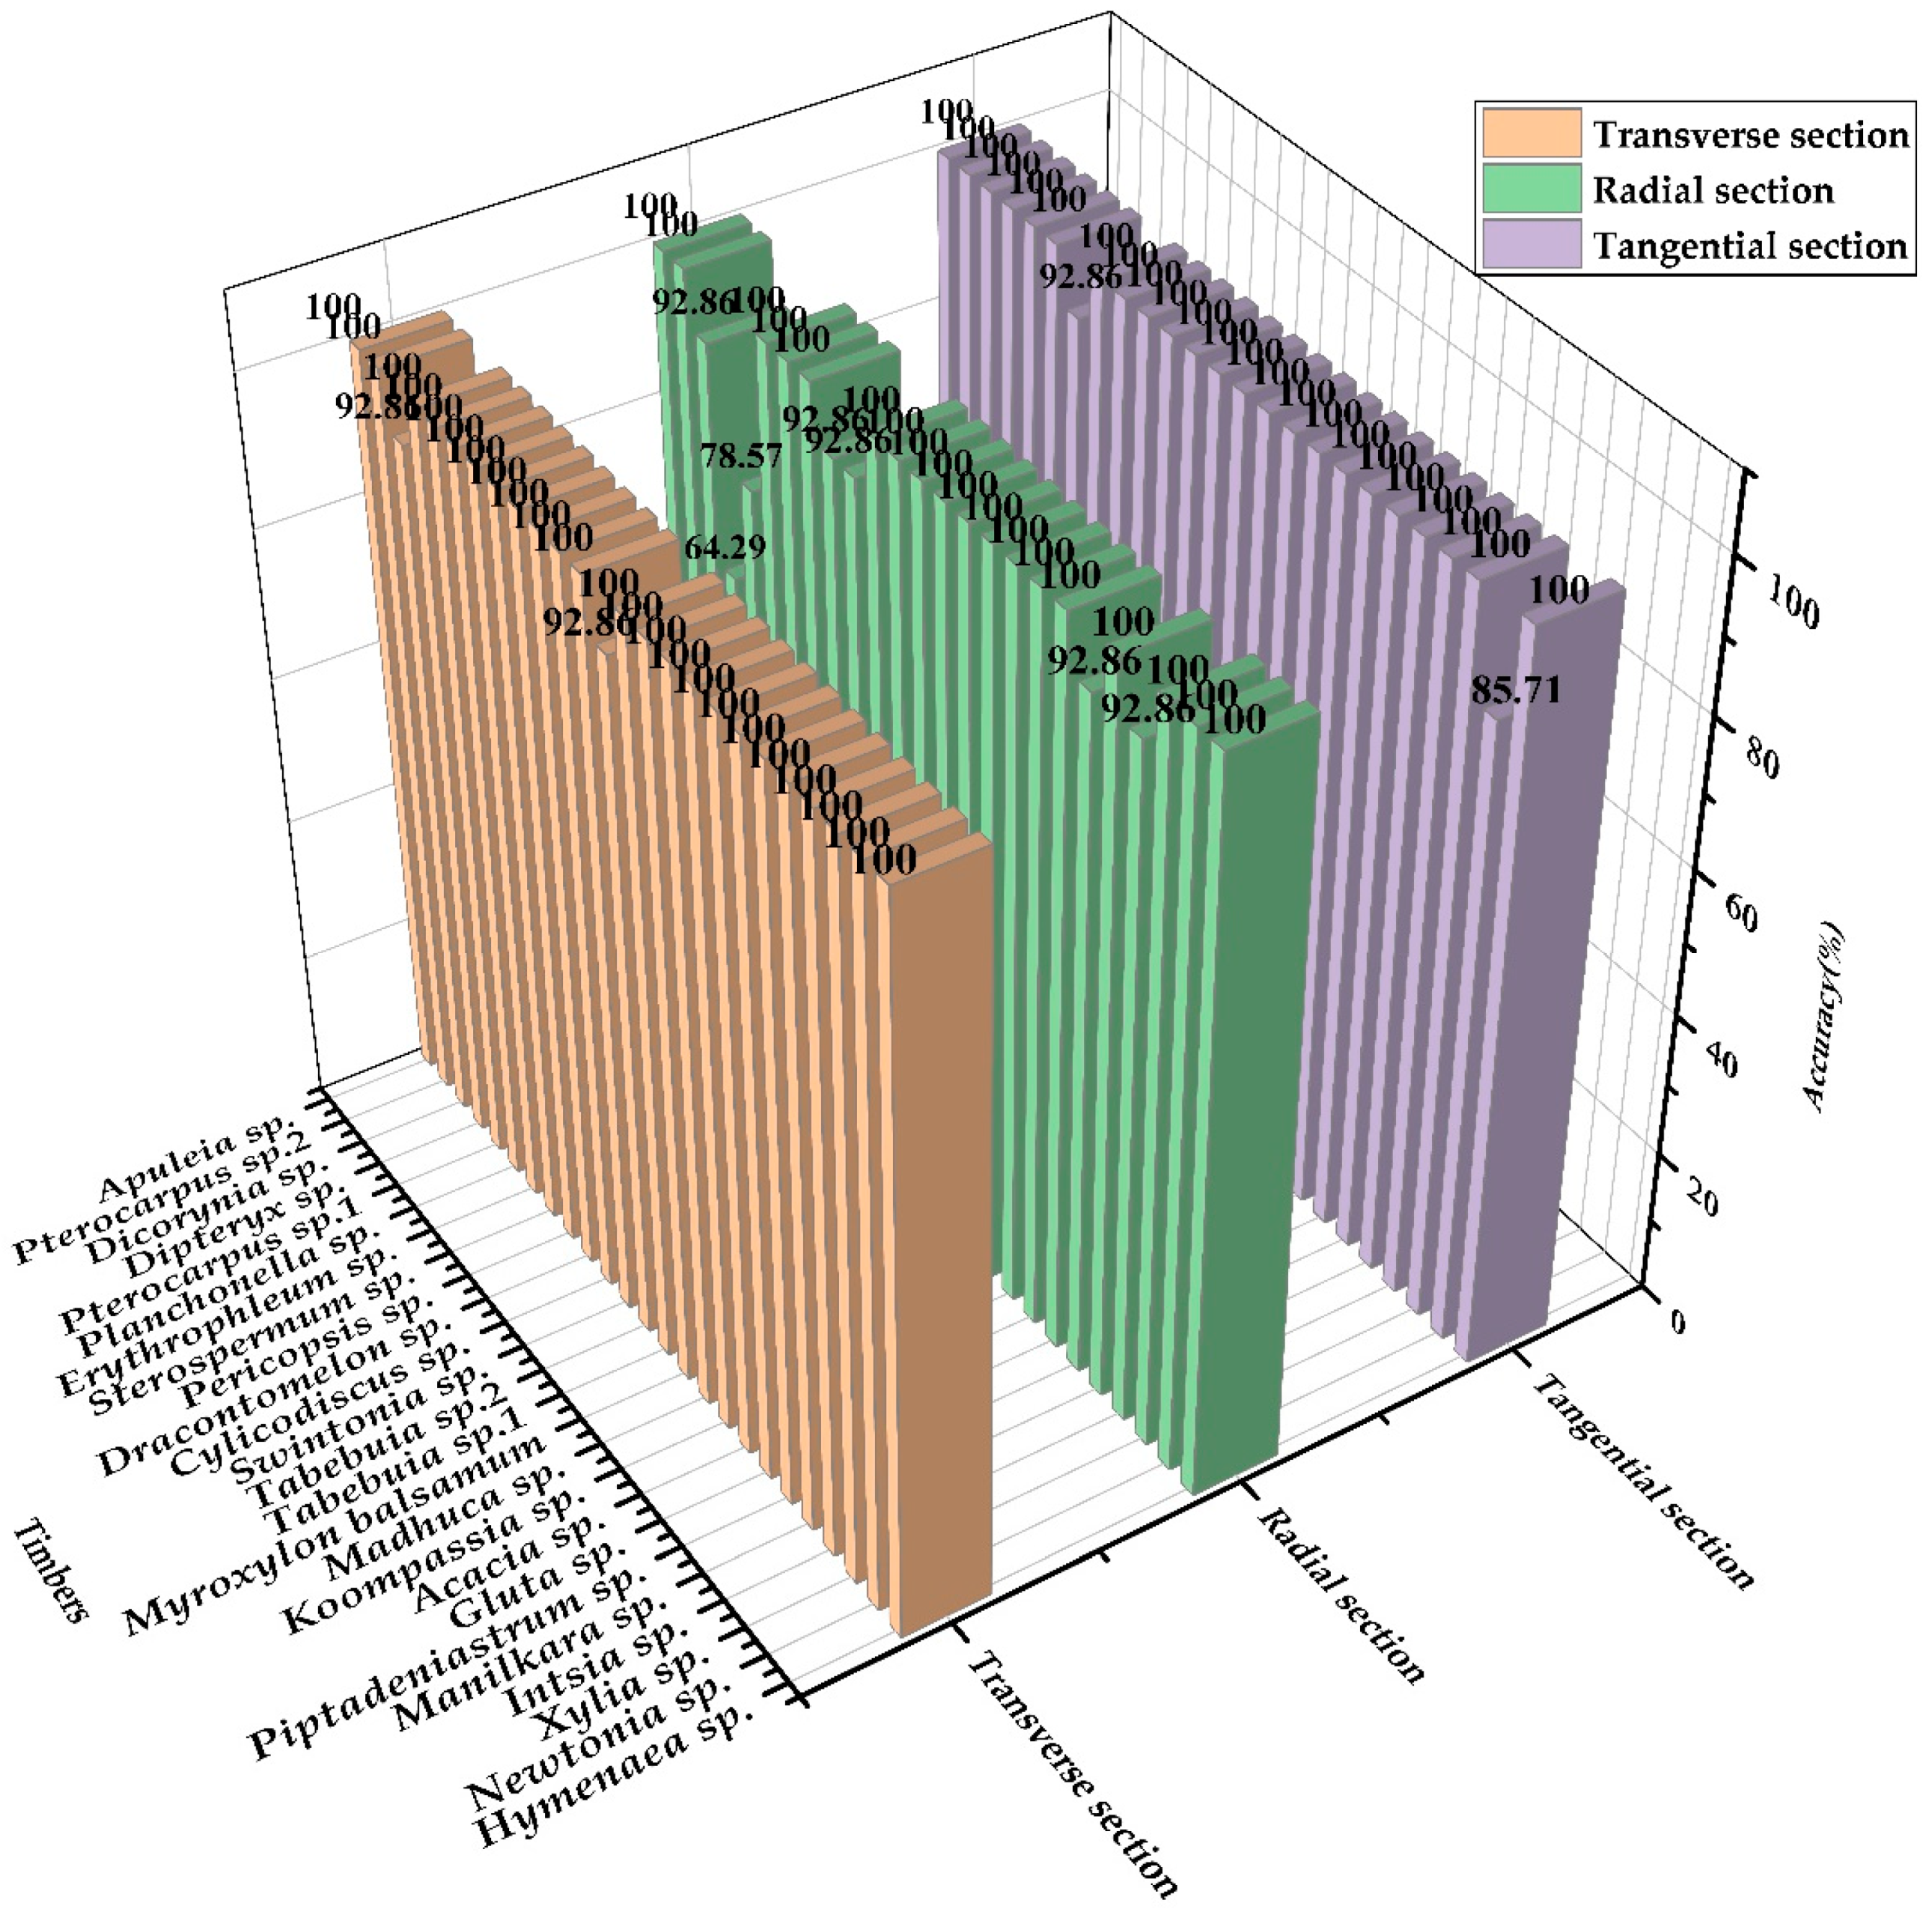
The NIR spectral band wavelength range of 780–2300 nm from the three surfaces was extracted by PCA and then combined with the three sectional GLCM textural features, respectively. Total accuracies of 99.43%, 96.29%, and 99.14% were obtained for the transverse, radial, and tangential surfaces, respectively. Figure 4 shows the identification accuracy with the SVM model. The transverse and tangential sections of the SVM model provided higher identification accuracy than the radial section model. The transverse section was slightly better than the tangential section. Thus, the transverse section is recommended for use in identification. The tangential section can be used if the transverse section is not available.

3.4. Wood Identification Based on Shorter NIR Band Fused GLCM Features

A portable NIR spectrometer was used to measure the sample properties on-site, but it has a limited wavelength range. Shorter raw NIR band-fused GLCM features are inferior to the entire NIR-band-fused GLCM because raw NIR spectra extract some information irrelevant to wood identification, such as instrument noise, sample status, and detection of the environment. Some spectral preprocessing methods have been introduced to reduce the interference of irrelevant information and ensure that the shorter NIR spectra bands are useful to identify the wood. Before developing the SVM classification model, the raw spectral data for the transverse section were preprocessed with the following four methods: (I) combining the first derivative, standard normal variate (SNV), and mean center; (II) preprocessed by combining smoothing, first derivative, and the SNV; (III) preprocessed combining smoothing, the second derivative, and the SNV; (IV) preprocessed with multiplicative scatter correction (MSC), the first derivative, and the SNV.
The preprocessed NIR band was divided into two segments of 780–1100 nm and 1100–2300 nm. Table 5 shows the identification accuracy of the SVM model based on the two short NIR spectral bands pre-processed using the four methods and combined with GLCM features. Compared to Table 2, accuracy was reduced slightly for the model based on the 780–1100 nm NIR spectra pre-processed by methods II and IV. The identification accuracies from the other models increased. This result indicates that the selected preprocessing methods effectively reduced the irrelevant NIR spectral information and improved identification accuracy. The identification accuracy of the shorter 780–1100 nm NIR band was 99.43% for method III, and accuracy was 100% for the 1100–2300 nm NIR band using methods I, II, and III. Therefore, the limited short NIR band can be used to identify the wood after preprocessing.
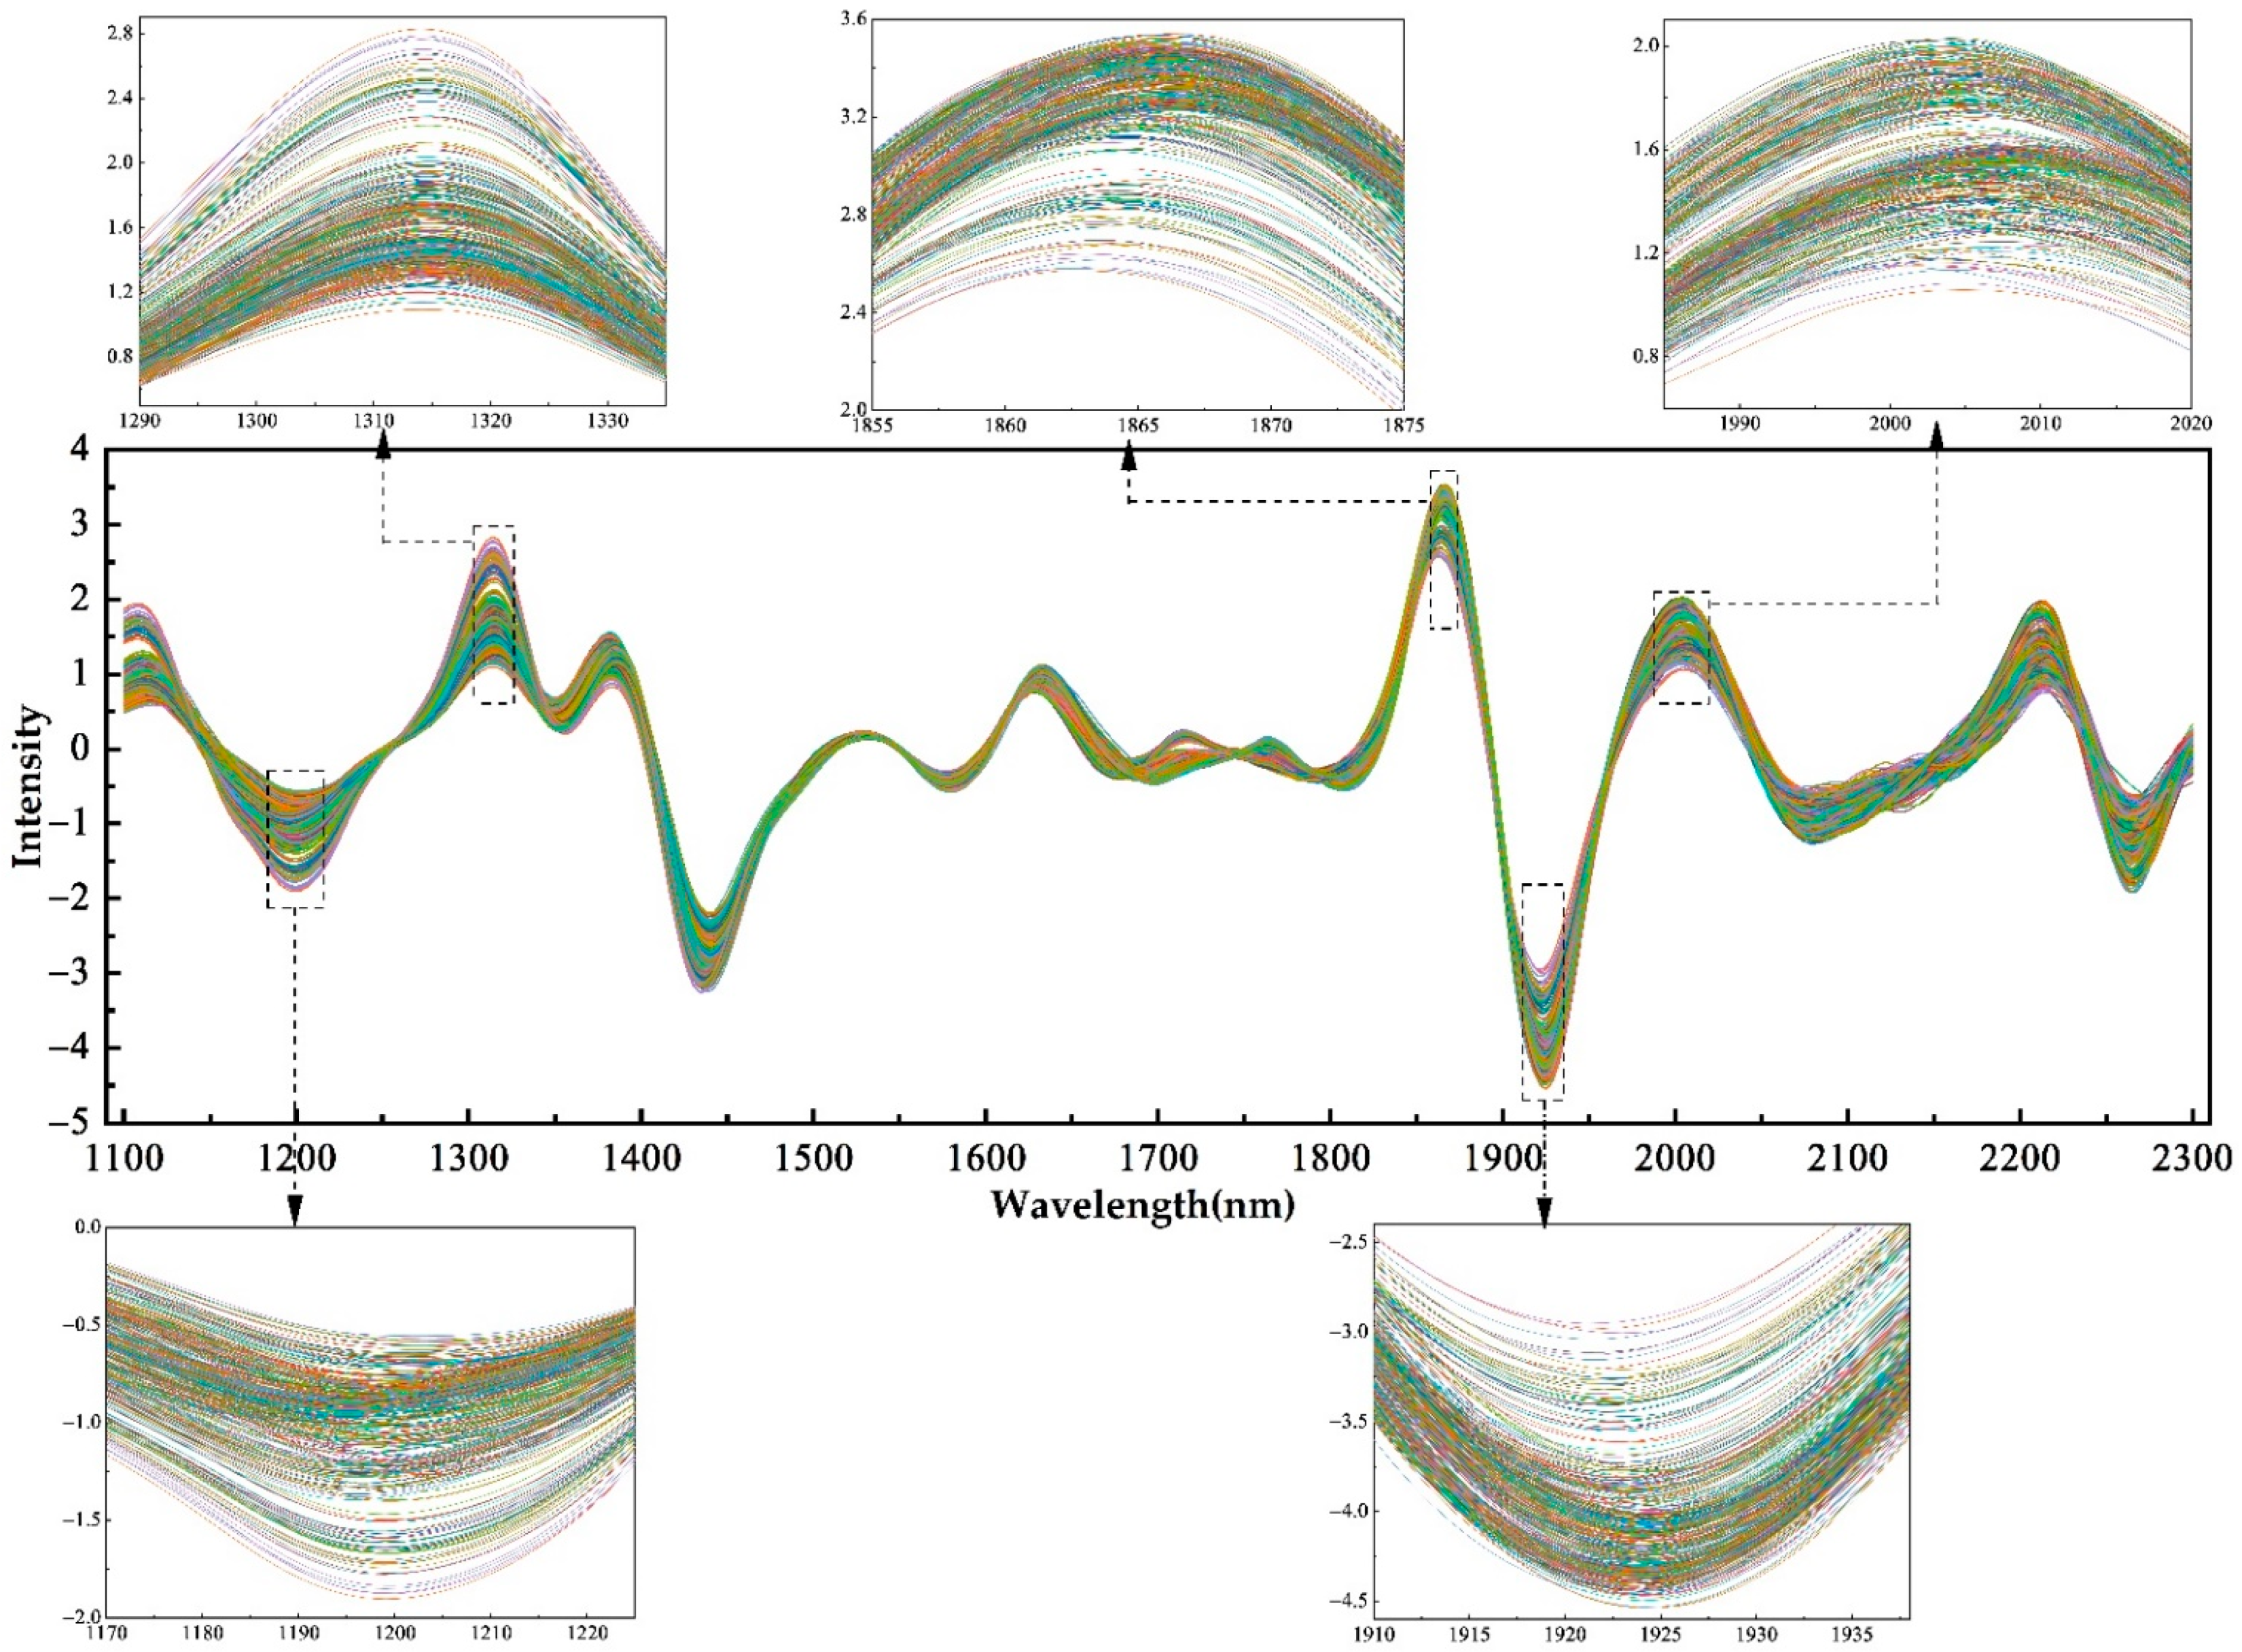
Figure 5 shows the NIR spectra after pre-processing by combining smoothing the second derivative, and the SNV. After pre-processing, the irrelevant information was minimized leading to a sharper spectral curve compared to Figure 1. This result indicates that spectra preprocessing revealed key information about the NIR spectral bands.
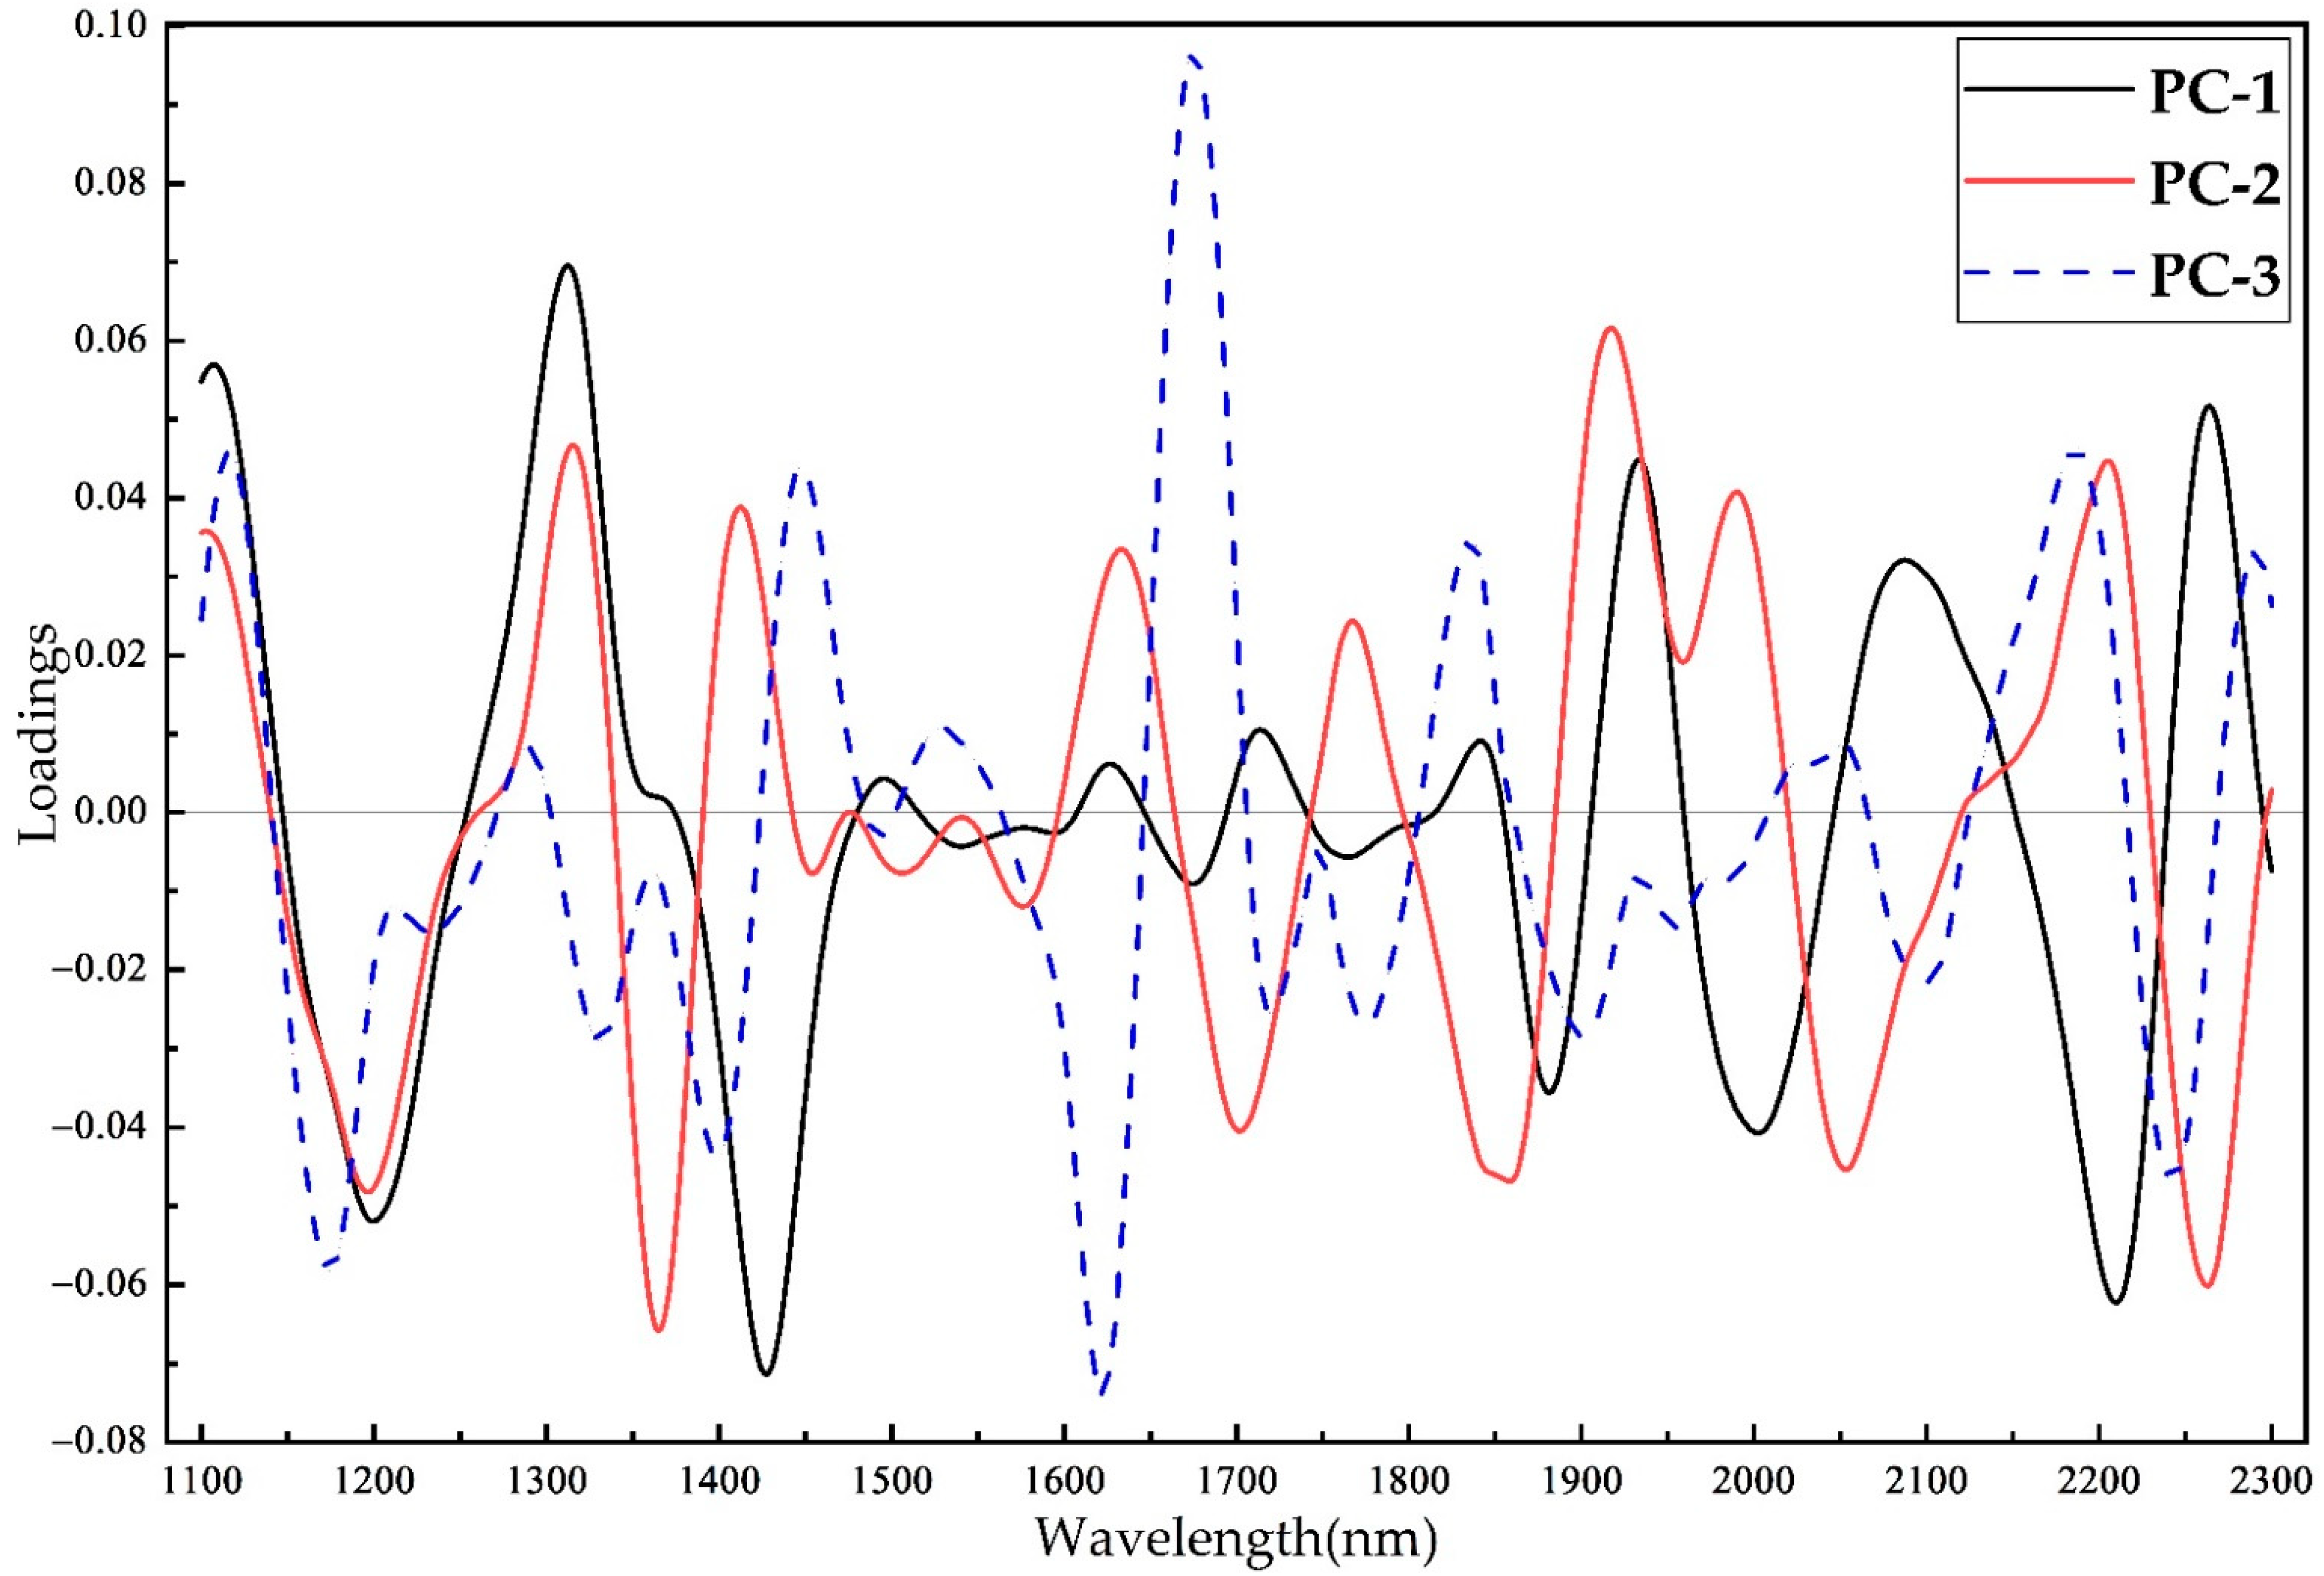
The PC-1, PC-2, and PC-3 spectra are shown in Figure 6. Significant peaks at about 1201, 1312, 1427, 1933, 2002, 2078, 2210 and 2264 nm were shown for PC-1. Major absorption for PC-2 occurred at around 1196, 1312, 1365, 1412, 1633, 1702, 1767, 1917, 1990, 2053, 2205 and 2264 nm. Major absorption for PC-3 occurred at around 1448, 1622, 1675, 1936, 2187 and 2242 nm. PC-1 and PC-2 provided a greater contribution to PCA in the wavelength ranges of 1100–1450 nm and 1850–2300 nm. The overtones of the O-H and N-H stretching vibrations and the overtones of the C-H combined bands appeared in the range of 1100–1450 nm. For example, the peak at around 1,196 was associated with the second overtone of C-H stretching vibrations from the lignin CH3 groups. The peak at around 1365 was associated with the first overtone of C-H stretching vibrations and the C-H deformation vibration combined band from cellulose. The first overtone of aliphatic and aromatic C-H stretching vibrations and O-H combined bands occurred at 1850–2300 nm. A significant peak at about 1675 nm occurred in PC-3, which was associated with the first overtone of Car-H stretching vibrations from the lignin aromatic groups [23]. Park and Yeon et al. reported that the contents and types of extractives can affect the identification of softwood using NIR spectra [24,25,26]. The NIR spectral features contain extractive information, and the extractives played an important role in identifying the 25 timbers in the proposed method. For example, the peaks at around 1412 (PC-2) and 1447 (PC-3) were associated with extractives [23].

3.5. Effects of the GLCM Features on Wood Identification

In order to analyze the effect of the GLCM features on wood identification, the single GLCM features and their combinations were combined with the 780–1100 nm NIR spectra band to identify wood, respectively (Table 6). Model 1 was the SVM classification model developed at the NIR spectra of 780–1100 nm after preprocessing with the combination of smoothing, second derivative, and the SNV. Based on the 780–1100 nm NIR band, not all features increased model identification accuracy when only one feature was combined. Entropy and contrast significantly increased model identification accuracy (models 5 and 3) and entropy was better than contrast. However, model identification accuracy did not improve when the NIR band was combined with ASM and correlation, respectively, (models 2 and 4). Although ASM and correlation did not individually contribute to identification accuracy, accuracy increased slightly when ASM and correlation were fused into the NIR band simultaneously. Thus, entropy and contrast improved model identification accuracy. The four-parameter features, combined with the NIR spectra, accurately identified the 25 timbers.
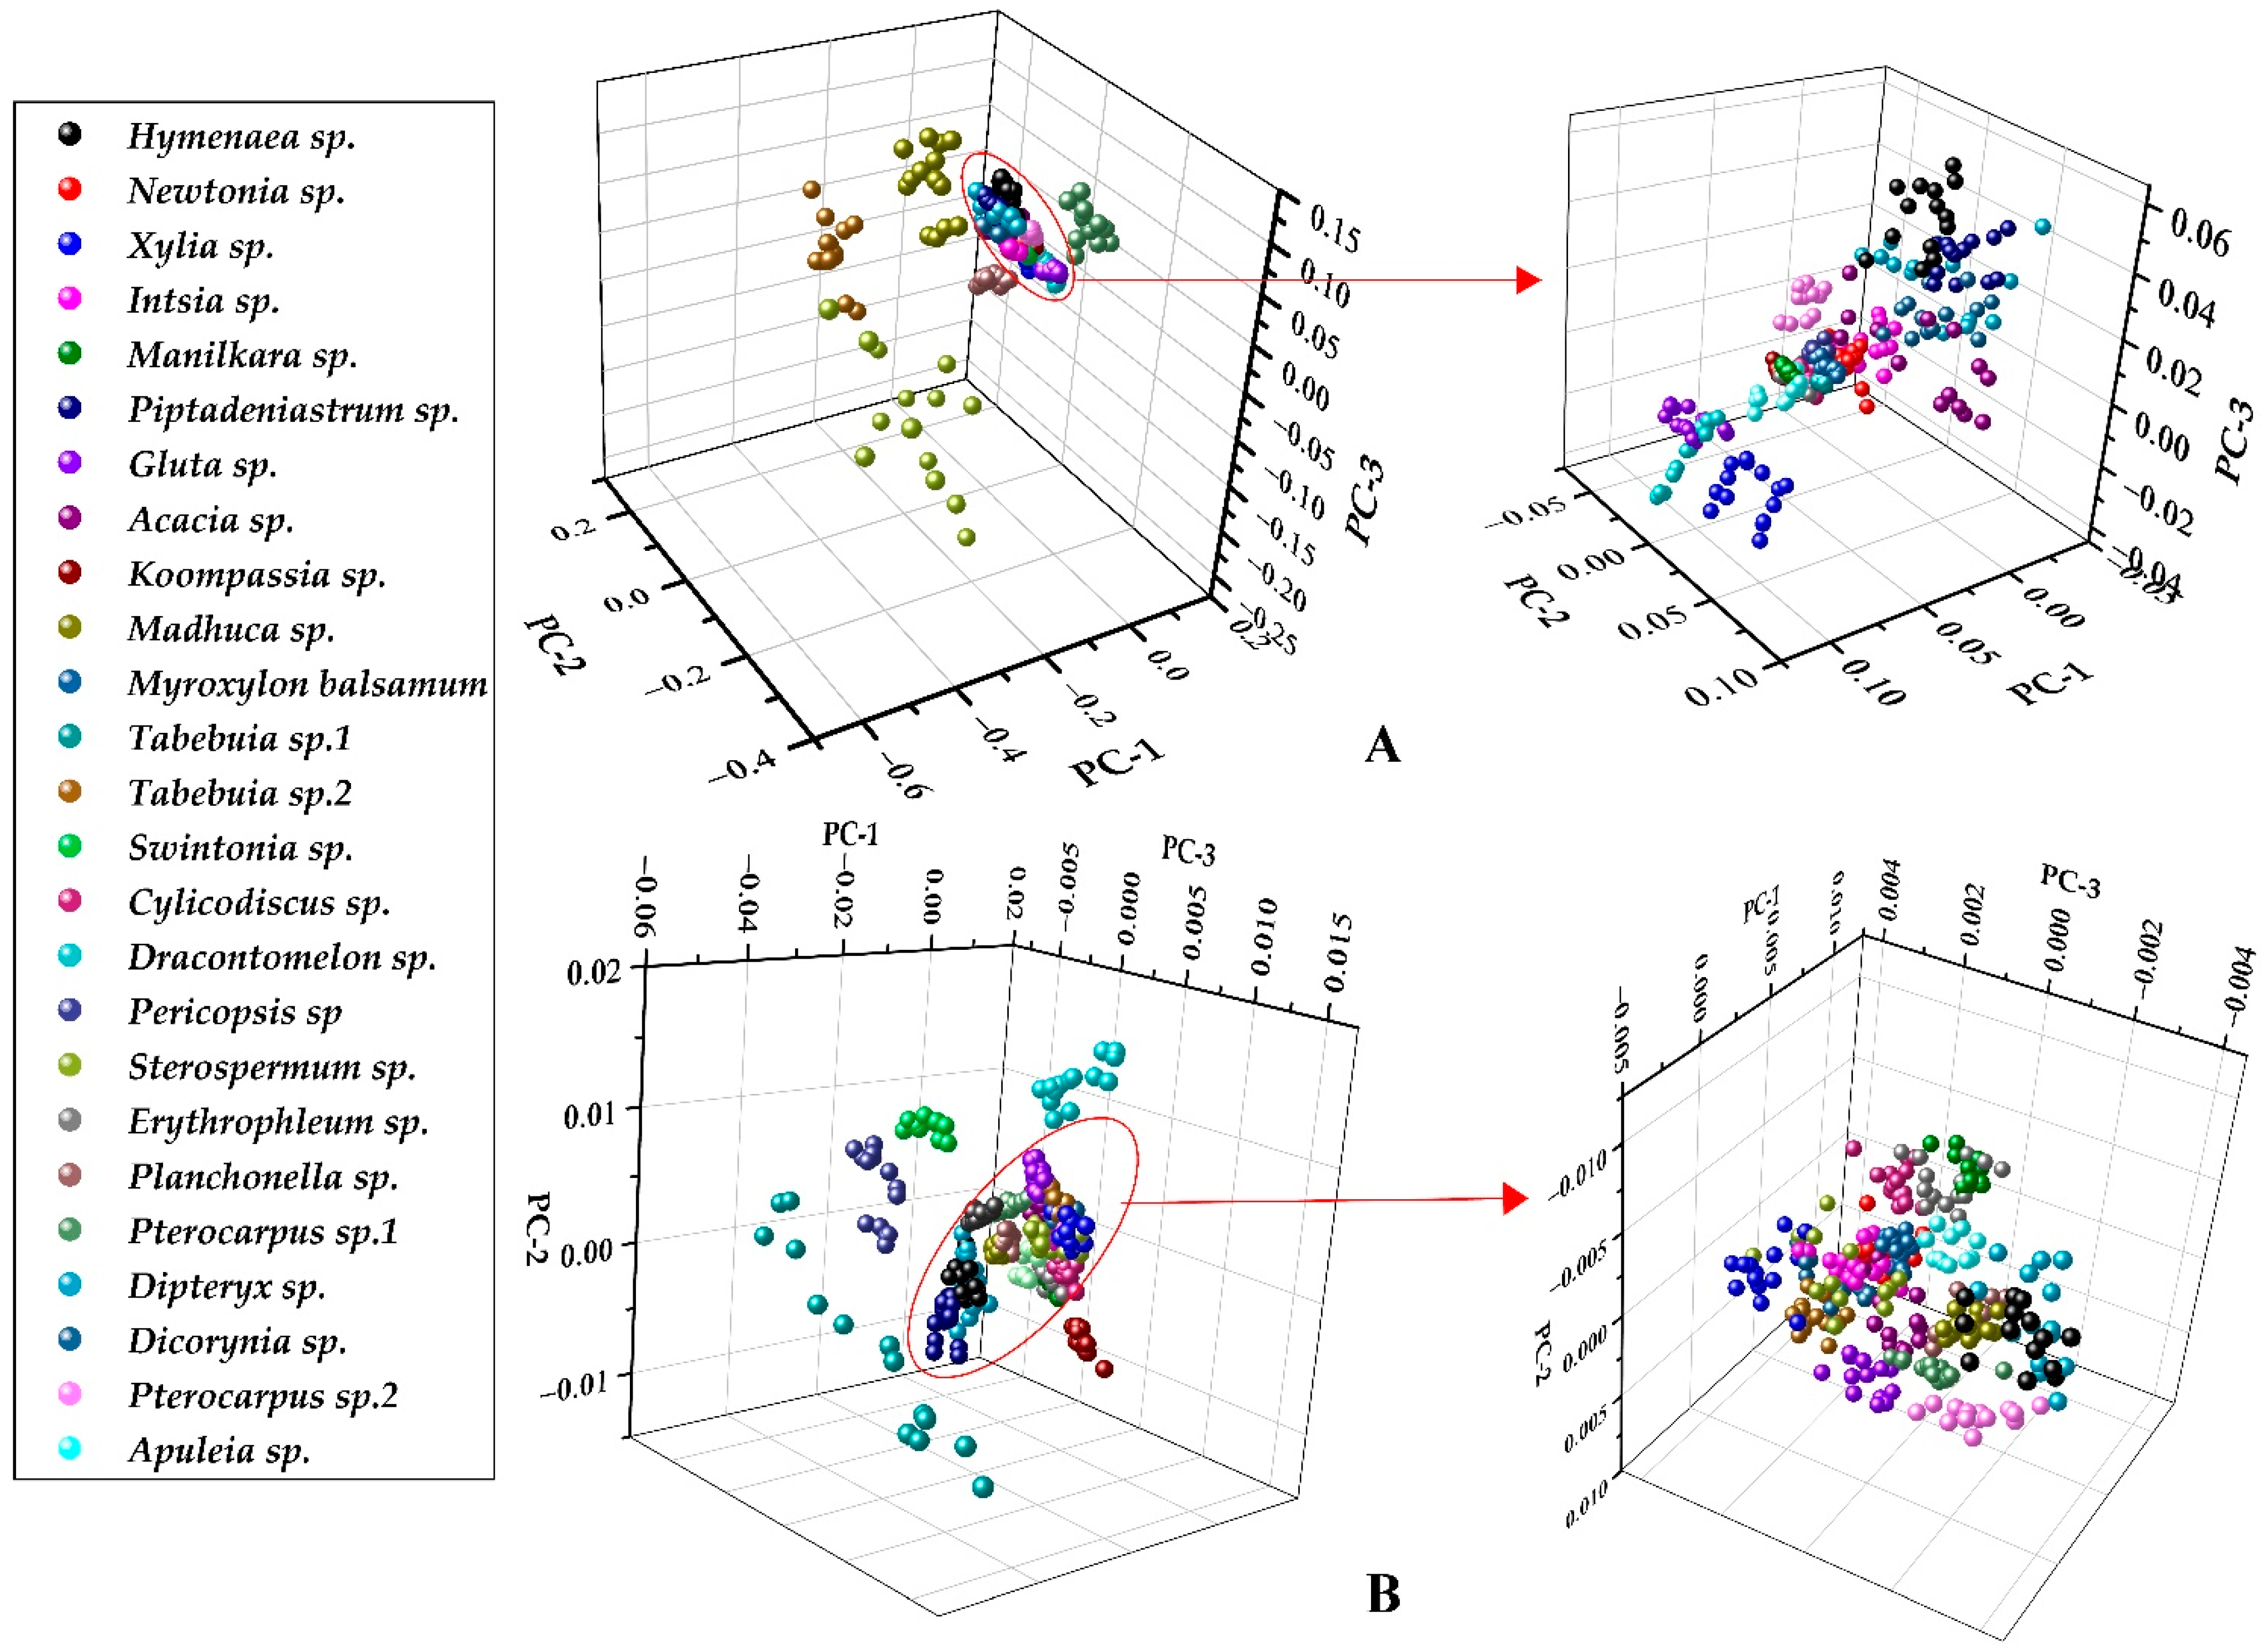
Figure 7 shows the change in the spatial distribution of the test set sample before and after the 780–1100 nm NIR spectral features were combined with the four GLCM features (A: NIR spectra; B: NIR band fused four GLCM features). The spatial clustering distribution was significantly transformed after the GLCM features were combined with the NIR spectra; as the adjacent distance increased, the overlapping range was smaller, and the clustering effect improved. Thus, the distribution of the feature data changed after the GLCM features were combined with the NIR spectra. Wood identification accuracy further improved after combining the SVM method of the constructed optimal decision boundaries. The feature information extracted was sufficient to describe the 25 timbers and characterize their differences.

4. Conclusions

In this study, the NIR spectra and textural features of 25 timbers were combined after extracting them using PCA and GLCM, respectively, and the SVM model was used to identify the timbers. The following conclusions were drawn: First, combining the NIR spectral and textural features was effective for identifying the timbers. Second, four GLCM features combined with the NIR spectra improved the feature information data spatial clustering distribution and enhanced model robustness and accuracy of wood identification. Third, the combined transverse section feature model achieved better identification accuracy than the tangential or radial surfaces model. Thus, the transverse surface is recommended for use in this identification method. Moreover, the limited short NIR band can be used with the proposed method to identify timbers. The proposed method identified timbers rapidly without special expertise, and the device is portable and has a relatively low cost. Therefore, this method has significant research and utility value and has the potential to be an on-site wood identification tool for market supervision.

Supplementary Materials

The following are available online at https://www.mdpi.com/article/10.3390/f12111527/s1, Table S1: The sample representative images of all timbers in this paper.

Author Contributions

Conceptualization, K.L. and Z.Y.; methodology, K.L.; sample collection and preparation, K.L.; software, K.L. and X.P.; formal analysis, X.P. and Z.Y.; validation, X.P. and Z.Y; writing—original draft preparation, X.P.; writing—review and editing, X.P. and Z.C.; supervision, Z.Y.; project administration, Z.Y.; funding acquisition, Z.Y. All authors have read and agreed to the published version of the manuscript.

Funding

This research was funded by the National Natural Science Foundation of China, Grant Numbers 31770766 and 31370711.

Conflicts of Interest

The authors declare no conflict of interest.

References

  1. Wang, D.J. Status quo and Characteristics of Global Trade of Forest products. Res. Dev. 2019, 49, 49–53. (In Chinese) [Google Scholar]
  2. Barmpoutis, P.; Dimitropoulos, K.; Barboutis, I.; Grammalidis, N.; Lefakis, P. Wood species recognition through multidimensional texture analysis. Comput. Electron. Agric. 2018, 144, 241–248. [Google Scholar] [CrossRef]
  3. Adedipe, O.E.; Dawson-Andoh, B.; Slahor, J.; Osborn, L. Classification of Red Oak (Quercus Rubra) and White Oak (Quercus Alba) Wood Using a near Infrared Spectrometer and Soft Independent Modelling of Class Analogies. J. Near Infrared Spectrosc. 2008, 16, 49–57. [Google Scholar] [CrossRef]
  4. Pastore, T.C.M.; Braga, J.W.B.; Coradin, V.T.R.; Magalhaes, W.; Okino, E.Y.A.; Camargos, J.A.A.; de Muniz, G.I.B.; Bressan, O.A.; Davrieux, F. Near infrared spectroscopy (NIRS) as a potential tool for monitoring trade of similar woods: Discrimination of true mahogany, cedar, andiroba, and curupixá. Holzforschung 2011, 65, 73–80. [Google Scholar] [CrossRef]
  5. Braga, J.W.B.; Pastore, T.C.M.; Coradin, V.T.R.; Camargos, J.A.A.; da Silva, A.R. The use of near Infrared Spectroscopy to Identify solid wood Specimens of Swietenia Macrophylla0 (Cites Appendix II). IAWA J. 2011, 32, 285–296. [Google Scholar] [CrossRef]
  6. Yang, Z.; Lv, B.; Fu, Y.J. The Relationship between near Infrared Spectroscopy and Surface Color of Eight Rosewoods. Adv. Mater. Res. 2012, 479–481, 1772–1776. [Google Scholar] [CrossRef]
  7. Snel, F.A.; Braga, J.W.B.; Da Silva, D.; Wiedenhoeft, A.C.; Costa, A.D.C.; Soares, R.; Coradin, V.T.R.; Pastore, T.C.M. Potential field-deployable NIRS identification of seven Dalbergia species listed by CITES. Wood Sci. Technol. 2018, 52, 1411–1427. [Google Scholar] [CrossRef] [Green Version]
  8. Abe, H.; Kurata, Y.; Watanabe, K.; Ishikawa, A.; Noshiro, S.; Fujii, T.; Iwasa, M.; Kaneko, H.; Wada, H. The separation of softwood and hardwood in historical wooden statues of the Nazenji-temple in Japan using NIR spectroscopy. IAWA J. 2020, 41, 740–750. [Google Scholar] [CrossRef]
  9. Ibrahim, I.; Khairuddin, A.S.M.; Abu Talip, M.S.; Arof, H.; Yusof, R. Tree species recognition system based on macroscopic image analysis. Wood Sci. Technol. 2017, 51, 431–444. [Google Scholar] [CrossRef]
  10. Ibrahim, I.; Khairuddin, A.S.M.; Arof, H.; Yusof, R.; Hanafi, E. Statistical feature extraction method for wood species recognition system. Holz. Als. Roh. Werkst. 2017, 76, 345–356. [Google Scholar] [CrossRef]
  11. Yusof, R.; Khalid, M.; Khairuddin, A.S.M. Application of kernel-genetic algorithm as nonlinear feature selection in tropical wood species recognition system. Comput. Electron. Agric. 2013, 93, 68–77. [Google Scholar] [CrossRef]
  12. Rajagopal, H.; Khairuddin, A.S.M.; Mokhtar, N.; Ahmad, A.; Yusof, R. Application of image quality assessment module to motion-blurred wood images for wood species identification system. Wood Sci. Technol. 2019, 53, 967–981. [Google Scholar] [CrossRef]
  13. Kobayashi, K.; Akada, M.; Torigoe, T.; Imazu, S.; Sugiyama, J. Automated recognition of wood used in traditional Japanese sculptures by texture analysis of their low-resolution computed tomography data. J. Wood Sci. 2015, 61, 630–640. [Google Scholar] [CrossRef] [Green Version]
  14. Bremanath, R.; Nithiya, B.; Saipriya, R. Wood Species Recognition Using GLCM and Correlation. In Proceedings of the 2009 International Conference on Advances in Recent Technologies in Communication and Computing, Kottayam, India, 27–28 October 2009; pp. 615–619. [Google Scholar]
  15. Yusof, R.; Khalid, M.; Khairuddin, A.S.M. Fuzzy logic-based pre-classifier for tropical wood species recognition system. Mach. Vis. Appl. 2013, 24, 1589–1604. [Google Scholar] [CrossRef]
  16. Wold, S.; Esbensen, K.; Geladi, P. Principal component analysis. Chemom. Intell. Lab. Syst. 1987, 2, 37–52. [Google Scholar] [CrossRef]
  17. Toscano, G.; Rinnan, Å.; Pizzi, A.; Mancini, M. The Use of Near-Infrared (NIR) Spectroscopy and Principal Component Analysis (PCA) To Discriminate Bark and Wood of the Most Common Species of the Pellet Sector. Energy Fuels 2017, 31, 2814–2821. [Google Scholar] [CrossRef]
  18. Bharati, M.H.; Liu, J.J.; MacGregor, J.F. Image texture analysis: Methods and comparisons. Chemom. Intell. Lab. Syst. 2004, 72, 57–71. [Google Scholar] [CrossRef]
  19. Fongaro, L.; Kvaal, K. Surface texture characterization of an Italian pasta by means of univariate and multivariate feature extraction from their texture images. Food Res. Int. 2013, 51, 693–705. [Google Scholar] [CrossRef]
  20. Kumar, D. Feature Extraction and Selection of kidney Ultrasound Images Using GLCM and PCA. Procedia Comput. Sci. 2020, 167, 1722–1731. [Google Scholar] [CrossRef]
  21. Turhan, K.; Serdar, B. Support Vector Machines in Wood Identification: The Case of Three Salix Species from Turkey. Turk. J. Agric. For. 2013, 37, 249–256. [Google Scholar]
  22. Fujimoto, T.; Kurata, Y.; Matsumoto, K.; Tsuchikawa, S. Application of near Infrared Spectroscopy for Estimating Wood Mechanical Properties of Small Clear and Full Length Lumber Specimens. J. Near Infrared Spectrosc. 2008, 16, 529–537. [Google Scholar] [CrossRef]
  23. Schwanninger, M.; Rodrigues, J.C.; Fackler, K. A Review of Band Assignments in near Infrared Spectra of Wood and Wood Components. J. Near Infrared Spectrosc. 2011, 19, 287–308. [Google Scholar] [CrossRef]
  24. Park, S.-Y.; Kim, J.-C.; Yeon, S.; Yang, S.-Y.; Yeo, H.; Choi, I.-G. Rapid Prediction of the Chemical Information of Wood Powder from Softwood Species Using Near-Infrared Spectroscopy. Bioresources 2018, 13, 2440–2451. [Google Scholar] [CrossRef] [Green Version]
  25. Yeon, S.; Park, S.-Y.; Kim, J.-H.; Kim, J.-C.; Yang, S.-Y.; Yeo, H.; Kwon, O.; Choi, I.-G. Effect of Organic Solvent Extractives on Korean Softwoods Classification Using Near-Infrared Spectroscopy. J. Korean Wood Sci. Technol. 2019, 47, 509–518. [Google Scholar] [CrossRef]
  26. Park, S.-Y.; Kim, J.-H.; Yang, S.-Y.; Yeo, H.; Choi, I.-G. Classification of softwoods using wood extract information and near infrared spectroscopy. Bioresources 2021, 16, 5301–5312. [Google Scholar] [CrossRef]
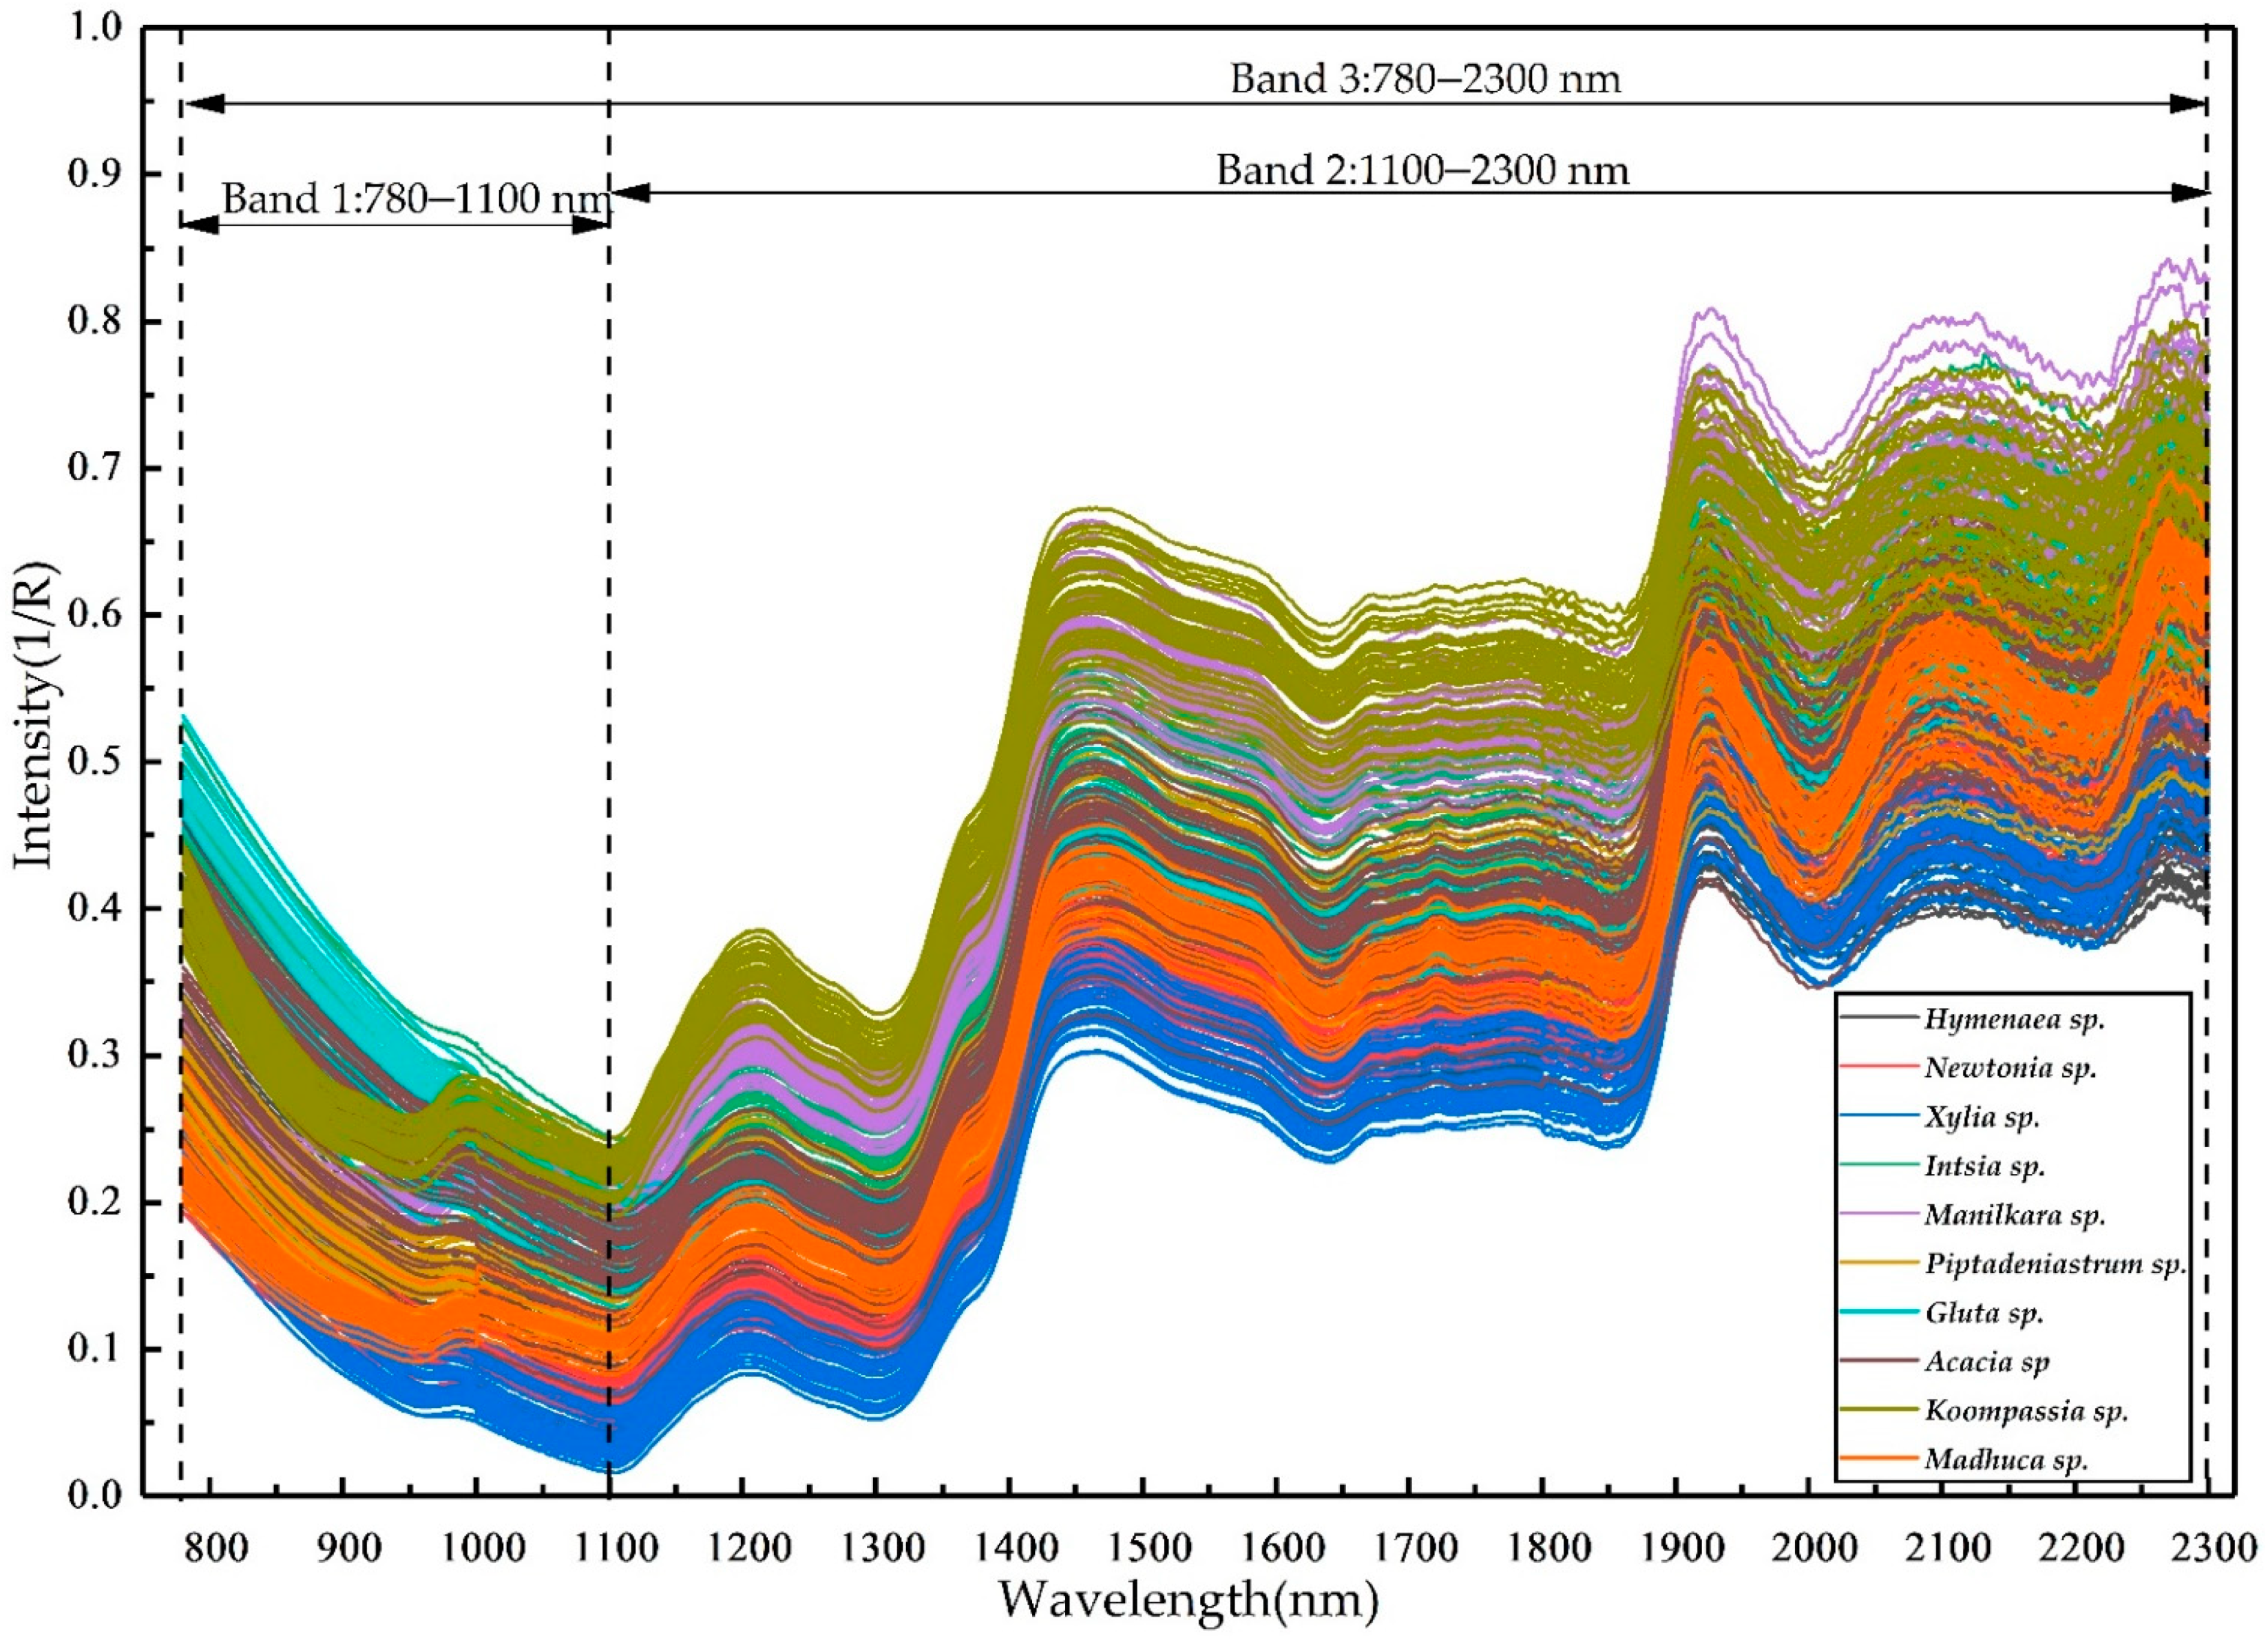
Figure 1. The raw NIR spectra of the transverse section of the first ten wood samples.
Forests 12 01527 g001
Figure 2. The three sections of the surface digital images from four timbers.
Forests 12 01527 g002
Figure 3. Raw NIR spectra of the three different sections of Dipteryx sp. wood.
Forests 12 01527 g003
Figure 4. Identification accuracy of the 25 timbers based on the combined information of the 3 sectional surfaces.
Forests 12 01527 g004
Figure 5. Partial wood transverse Section 1100–2300 nm NIR spectra after preprocessing with the combination of smoothing, the second derivative, and SNV.
Forests 12 01527 g005
Figure 6. Loading spectra for principal components PC-1, PC-2, and PC-3.
Forests 12 01527 g006
Figure 7. Spatial clustering variations in the principal features of the 25 timbers test set ((A): 780–1100 nm NIR spectra; (B): 780–1100 nm NIR spectra combined with the four GLCM features).
Forests 12 01527 g007
Table 1. Wood timbers used in the experiment.
IDLatin NameTrade NameGenusFamily
1Hymenaea sp.Courbaril, Jatoba, Jutai, Jatai et al.HymenaeaCaesalpiniaceae
2Newtonia sp.DahomaNewtoniaMimosaceae
3Xylia sp.Pyinkado, Cam xe, Deng, SokramXyliaMimosaceae
4Intsia sp.Merbau, Mirabow, Ipil, Djumelai et al.IntsiaCaesalpiniaceae
5Manilkara sp.Macaranduba, Kating, SawokecikManilkaraSapotaceae
6Piptadeniastrum sp.Dabema, Dahoma, Ekhimi, Toum et al.PiptadeniastrumMimosaceae
7Gluta sp.Rengas, Inhas, Thitsi, Rengas hutan et al.GlutaAnacardiaceae
8Acacia sp.Brown salwood, African rosewood et al.AcaciaMimosaceae
9Koompassia sp.Kempas, Empas, Impas, Mengeris et al.KoompassiaCaesalpiniaceae
10Madhuca sp.Bitis, Betis, MasangMadhucaSapotaceae
11Myroxylon balsamum (L.) HarmsBalsamo, EstoraqueMyroxylonFabaceae
12Tabebuia sp. 1Tabebuia, Hakia, Guayacan, Ipe et al. TabebuiaBignoniaceae
13Tabebuia sp. 2White cedar, Whitetababuia, Jahoto et al.TabebuiaBignoniaceae
14Swintonia sp.Merpauh, Civit, Boilam, Merpau et al.SwintoniaAnacardiaceae
15Cylicodiscus sp.Okan, Buemon, Denya, EdumCylicodiscusMimosaceae
16Dracontomelon sp.Dao, Kaililaki, Seng kuang, Lamio et al.DracontomelonAnacardiaceae
17Pericopsis sp.Afrormosia, Assamela, ObangPericopsisFabaceae
18Sterospermum sp.PadretreeSterospermumBignoniaceae
19Erythrophleum sp.Tali, Missanda, Sasswood, Alui et al.ErythrophleumCaesalpiniaceae
20Planchonella sp.White planchonella, KetePlanchonellaSapotaceae
21Pterocarpus sp. 1Muniga, Nkula, African padaukPterocarpusFabaceae
22Dipteryx sp.Cumaru, Tonka bean, Almendrillo et al.DipteryxFabaceae
23Dicorynia sp.Angelique, Angelica, Basralocus et al.DicoryniaCaesalpiniaceae
24Pterocarpus sp. 2Padauk, AmbilaPterocarpusFabaceae
25Apuleia sp.Garapa, Pau mulatoApuleiaCaesalpiniaceae
Table 2. GLCM textural features on the transverse surface of the first 10 wood samples.
TimbersASMContrastCorrelationEntropy
Maximum/Minimum
Hymenaea sp.0.021037/0.0187866.375925/5.1881000.021853/0.0140814.053281/3.985188
Newtonia sp.0.020758/0.0191086.693044/5.1723830.021900/0.0122494.024226/3.988707
Xylia sp.0.019930/0.0174897.674559/5.2584300.021414/0.0060824.095178/4.008789
Intsia sp.0.020517/0.0181857.118977/5.4343220.020071/0.0092084.072709/4.005149
Manilkara sp.0.018000/0.0172997.965371/7.1240050.009527/0.0046934.101009/4.076876
Piptadeniastrum sp.0.021096/0.0178247.796809/5.7310490.017605/0.0056074.087183/3.995309
Gluta sp.0.019714/0.0181417.004443/5.6571330.018711/0.0103944.074391/4.026978
Acacia sp.0.021110/0.0180877.053812/4.7523450.024970/0.0092764.076896/3.974451
Koompassia sp.0.019957/0.0184057.330459/5.9644540.016465/0.0083164.069544/4.021759
Madhuca sp.0.018702/0.0176678.342526/6.9358080.010988/0.0023894.090503/4.059368
Table 3. Accuracy of identification based on the NIR, GLCM, and combined features.
TimbersBand 1Band 2Band 3GLCMBand 1 + GLCMBand 2 + GLCMBand 3 + GLCM
Accuracy %
Hymenaea sp.92.86100100100100100100
Newtonia sp.85.7110010092.8685.71100100
Xylia sp.92.8610010078.57100100100
Intsia sp.71.4364.2978.57100100100100
Manilkara sp.10092.86100100100100100
Piptadeniastrum sp.64.2928.5792.86100100100100
Gluta sp.10028.57100100100100100
Acacia sp.14.297.145010010042.86100
Koompassia sp.85.7110010085.7192.86100100
Madhuca sp.85.7110010010085.71100100
Myroxylon balsamum78.5764.29100100100100100
Tabebuia sp.171.4392.86100100100100100
Tabebuia sp.264.2971.4378.575010010092.86
Swintonia sp.92.8610092.8685.71100100100
Cylicodiscus sp.7.1464.2928.57100100100100
Dracontomelon sp.64.2978.5785.7110092.86100100
Pericopsis sp.64.2978.5792.8657.14100100100
Sterospermum sp.42.86100100100100100100
Erythrophleum sp.35.7157.1478.57100100100100
Planchonella sp.71.4378.5710010010092.86100
Pterocarpus sp.157.1457.1410092.86100100100
Dipteryx sp.92.8671.4310085.71100100100
Dicorynia sp.35.7157.1471.4310010010092.86
Pterocarpus sp.207.1428.5710085.71100100
Apuleia sp.10035.7110010010092.86100
Total Accuracy %66.8669.4387.1493.1497.7197.1499.43
Table 4. GLCM features of four timbers.
TimbersSectionsASMContrastCorrelationEntropy
Newtonia sp.Transverse0.0205485.5908680.0188614.000332
Radial0.0209285.3380490.0212513.978335
Tangential0.0204886.3526380.0154803.996089
Cylicodiscus sp.Transverse0.0183367.2641760.0082204.070662
Radial0.0183706.7792220.0124614.064437
Tangential0.0189467.0230980.0108054.046937
Pericopsis sp.Transverse0.0208275.1569180.0217663.978225
Radial0.0199216.4084890.0149594.012705
Tangential0.0207255.0802420.022633.979152
Dipteryx sp.Transverse0.0199775.6140300.0183944.011051
Radial0.0204405.5878840.0193643.992565
Tangential0.0202336.0598640.0166314.002626
Table 5. Identification accuracy of the SVM model based on two short NIR bands combined with GLCM features.
TimbersIIIIIIIVIIIIIIIV
780–1100 nm1100–2300 nm
Accuracy %
Hymenaea sp.100100100100100100100100
Newtonia sp.85.7185.7185.7185.71100100100100
Xylia sp.100100100100100100100100
Intsia sp.100100100100100100100100
Manilkara sp.100100100100100100100100
Piptadeniastrum sp.100100100100100100100100
Gluta sp.100100100100100100100100
Acacia sp.10092.8610092.86100100100100
Koompassia sp.100100100100100100100100
Madhuca sp100100100100100100100100
Myroxylon balsamum100100100100100100100100
Tabebuia sp. 1100100100100100100100100
Tabebuia sp. 2100100100100100100100100
Swintonia sp.100100100100100100100100
Cylicodiscus sp.92.86100100100100100100100
Dracontomelon sp.10078.5710078.57100100100100
Pericopsis sp.100100100100100100100100
Sterospermum sp.10085.7110085.71100100100100
Erythrophleum sp.10010010010010010010092.86
Planchonella sp.100100100100100100100100
Pterocarpus sp.185.7185.7110085.71100100100100
Dipteryx sp.100100100100100100100100
Dicorynia sp.92.86100100100100100100100
Pterocarpus sp. 2100100100100100100100100
Apuleia sp.100100100100100100100100
Total Accuracy %98.2997.1499.4397.1410010010099.71
Table 6. Identification accuracy of the SVM model based on the NIR spectra fused with GLCM.
SVM ModelNIR Band (nm)GLCM FeaturesFeature DimensionAccuracy (%)
Model 1780–1100None696
Model 2780–1100ASM796
Model 3780–1100Con798.29
Model 4780–1100Cor796
Model 5780–1100Ent799.14
Model 6780–1100ASM + Con898.29
Model 7780–1100ASM + Cor896.57
Model 8780–1100ASM + Con + Cor998.29
Model 9780-1100ASM + Con + Cor + Ent1099.43
ASM: angular second moment; Con: contrast; Cor: correlation; Ent: entropy.
Publisher’s Note: MDPI stays neutral with regard to jurisdictional claims in published maps and institutional affiliations.