Article

Social Preferences of Young Adults Regarding Urban Forest Recreation Management in Warsaw, Poland

by
Agnieszka Mandziuk
1,
Beata Fornal-Pieniak
2,
Dagmara Stangierska
3,*,
Stanisław Parzych
1 and
Katarzyna Widera
4
1
Department of Forest Management Planning, Dendrometry and Forest Economics, Institute of Forest Science, Warsaw University of Live Sciences-SGGW, Nowoursynowska St., 159, 02-776 Warsaw, Poland
2
Department of Environmental Protection and Dendrology, Institute of Horticultural Sciences, Warsaw University of Life Sciences-SGGW, Nowoursynowska St., 166, 02-787 Warszawa, Poland
3
Department of Pomology and Horticulture Economics, Institute of Horticultural Sciences, Warsaw University of Life Sciences-SGGW, Nowoursynowska St., 166, 02-787 Warszawa, Poland
4
Department of Economics, Finance, Regional and International Research, Faculty of Economics and Management, Opole University of Technology, Prószkowska St., 76, 45-758 Opole, Poland
*
Author to whom correspondence should be addressed.
Forests 2021, 12(11), 1524; https://doi.org/10.3390/f12111524
Submission received: 29 September 2021 / Revised: 28 October 2021 / Accepted: 2 November 2021 / Published: 5 November 2021
(This article belongs to the Special Issue Forests Tourism and Recreation)

Abstract

:
The paper presents results of questionnaire research conducted to determine social preferences regarding leisure in Warsaw municipal forests (WMF) (Poland). The preferences pertained to frequency of visits and willingness to pay for recreational infrastructure in a forest depending on its appearance, level of development, and the respondent’s income. The data were processed using statistical analysis (ANOVA Friedman test, U Mann–Whitney test, logistic regression). The results show that the higher the development level of a forest, the more often young people choose it for leisure. Willingness to pay for a forest depends on its development level, with respondents more willing to fund forests with a higher development level. No such correlation with the respondents’ income was found. Preferences regarding the selection of a specific type of forest for leisure were dependent on per capita income of the respondents only in the case of forests at a lower level of development. A forest’s preference level affected the willingness to pay for it and varied depending on the development level.

1. Introduction

Urban forests are a type of green area. They are also called “green islands” [1] in the ecological infrastructure of a city [2], promoting biological diversity in accordance with European Union law [3]. Moreover, urban forests are one of the most important footholds for the colonization of forest and ancient forest species in cities [4,5]. Nowadays, some of them are represented by the remnants of natural forest communities [6], whereas others have been planted by man [7].
Many researchers [5,8,9] mention and discuss the natural, ecological, and historical value of urban forests in their publications. Cities are often characterized by anthropogenic impacts, pollution, and higher temperatures compared to outside urban areas [10,11,12]. Baker and Jordan [4] highlighted the ecological significance of urban forests in improving the quality of the urban environment. The presence of forested areas in large, urbanized areas is particularly important for protecting the population against industrial and traffic air pollution, as well as reducing smog formation [13,14]. It also improves the general well-being of residents and helps reduce stress [15,16].
For the reasons above, urban forests are important for human well-being (ecosystem services) [17], and they have an impact on reducing air pollution and high temperatures; these green areas are also used for recreation and education [8]. Tourism and recreation are among the most important ecosystem services provided by urban forests. Recreational value is determined by natural properties (such as vegetation), as well as technical infrastructure in urban forests [18]. Technical infrastructure includes elements of small architecture (sheds, fireplaces, benches) as well as hiking and bicycling path networks in the forest [19]. Citizens and local governments should work on improving the quality of life in cities. The recommended way to proceed is sustainable development of the green areas, directed towards using natural resources from the environment in order to maintain the qualities beneficial to health, well-being, and biodiversity in the city [20]. Identification and management of green areas such as urban forests should be included in the strategy of ecosystem services [21,22] and enhance economic development [23]. Urban forests are visited by people of all ages, and therefore should be managed with consideration of the needs of all users [24].
Urban forests can be characterized by a variety of origins and management types [25]. Forests located inside the administrative borders of cities and within the range of general penetration by urban residents are under protection [26]. Any maintenance or development works must be carried out within those forests, with particular consideration for the safety of visitors, increasing their accessibility for tourism and recreation, as well as minimizing the negative impact of recreational use on the forest environment [27]. Managing and maintaining urban forests presents a significant challenge for the institutions responsible. The issue relates to participating in maintenance costs and defining the benefits of using the forests [28,29]. It also arises from different forms of usage and ownership. Social pressure [29,30,31] and preferences (expectations) regarding leisure in urban forests pose a serious threat to those areas. Urban green areas are usually available to the general public, with paid entry in some specific cases. This practice results in fewer visitors, which has significance in less affluent regions or countries with a large income gap, such as India [32]. This is shown by research on the possibility of introducing ticketed entry [32,33]; however, it should be noted that the higher the ticket price, the less likely the visitors are to pay [33].
The purpose of this paper is to investigate social preferences regarding leisure in Warsaw municipal forests. To this end, the following research hypotheses have been formulated:
Hypothesis 1 (H1).
Preference level for a specific forest type is correlated with its degree of development. A higher development level of a forest results in a higher preference level.
Hypothesis 2 (H2).
The likelihood of funding a forest is correlated to its type. Forests with a high development level are more likely to receive funding.
Hypothesis 3 (H3).
Preferences regarding forest types are correlated with the per capita income of the forest users.
Hypothesis 4 (H4).
The likelihood of a specific type of forest receiving funding is correlated with the per capita income of the forest users.
Hypothesis 5 (H5).
Forest preference level affects the willingness to pay and varies between forest types.

2. Materials and Methods
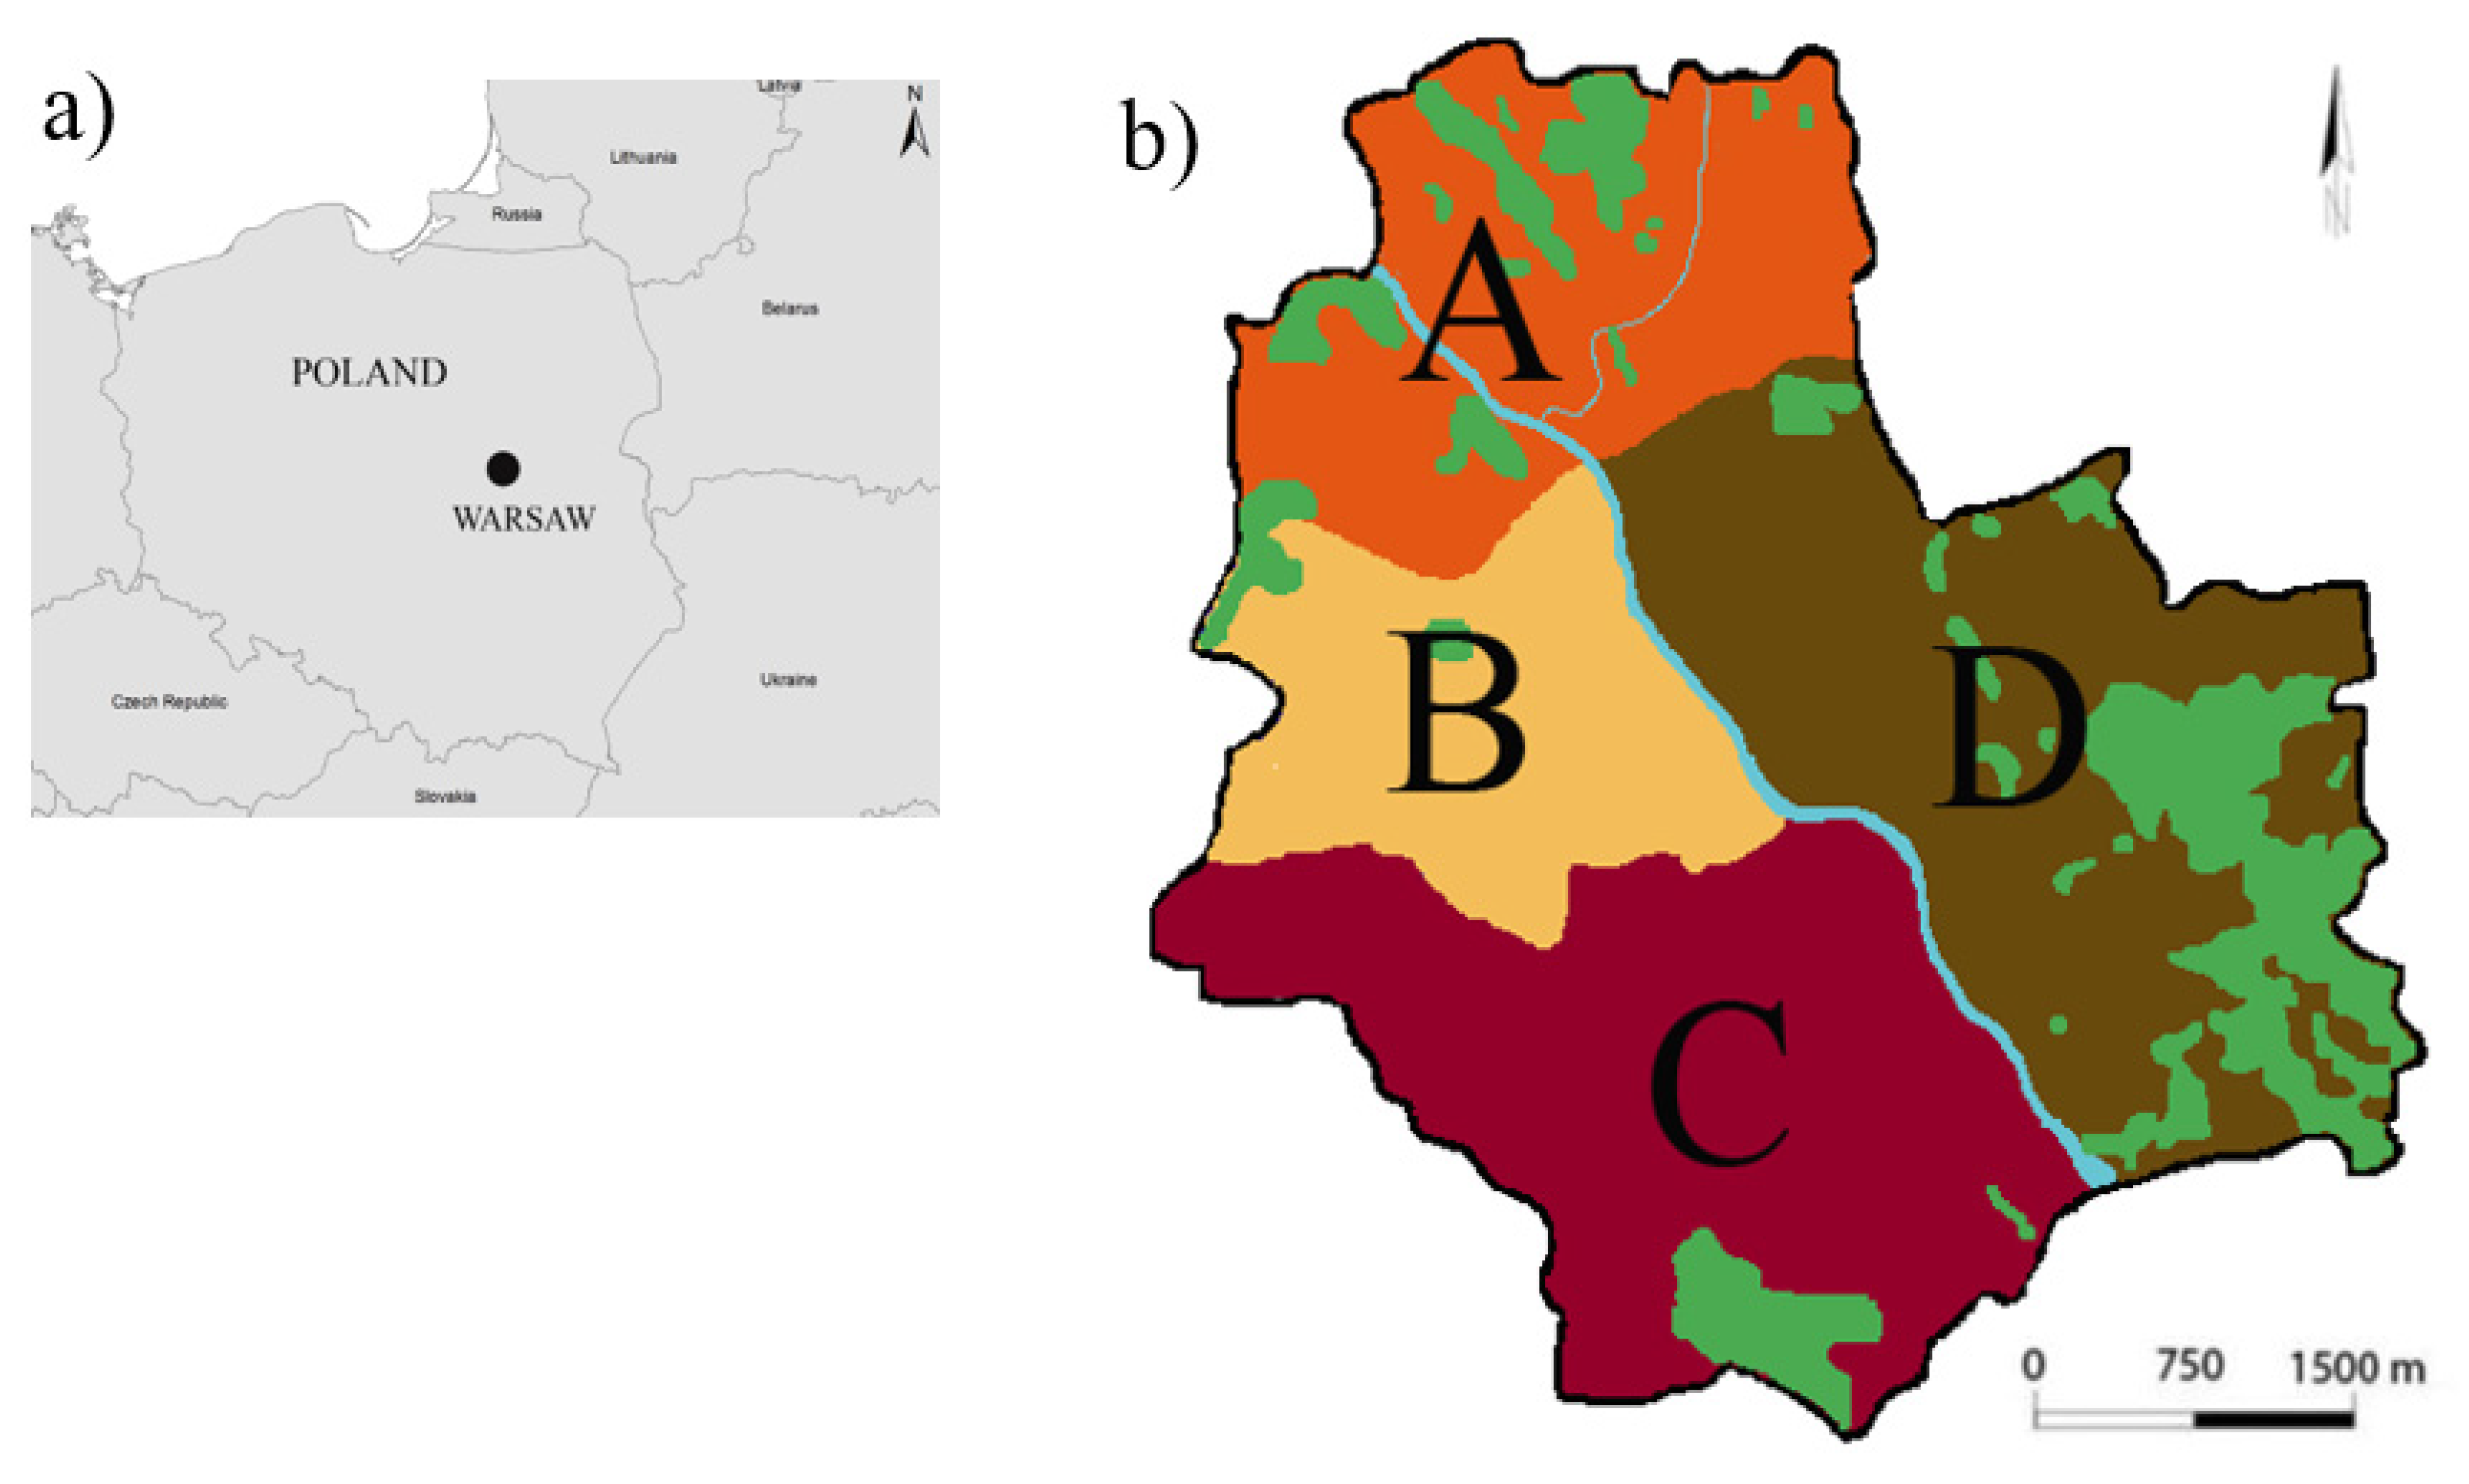
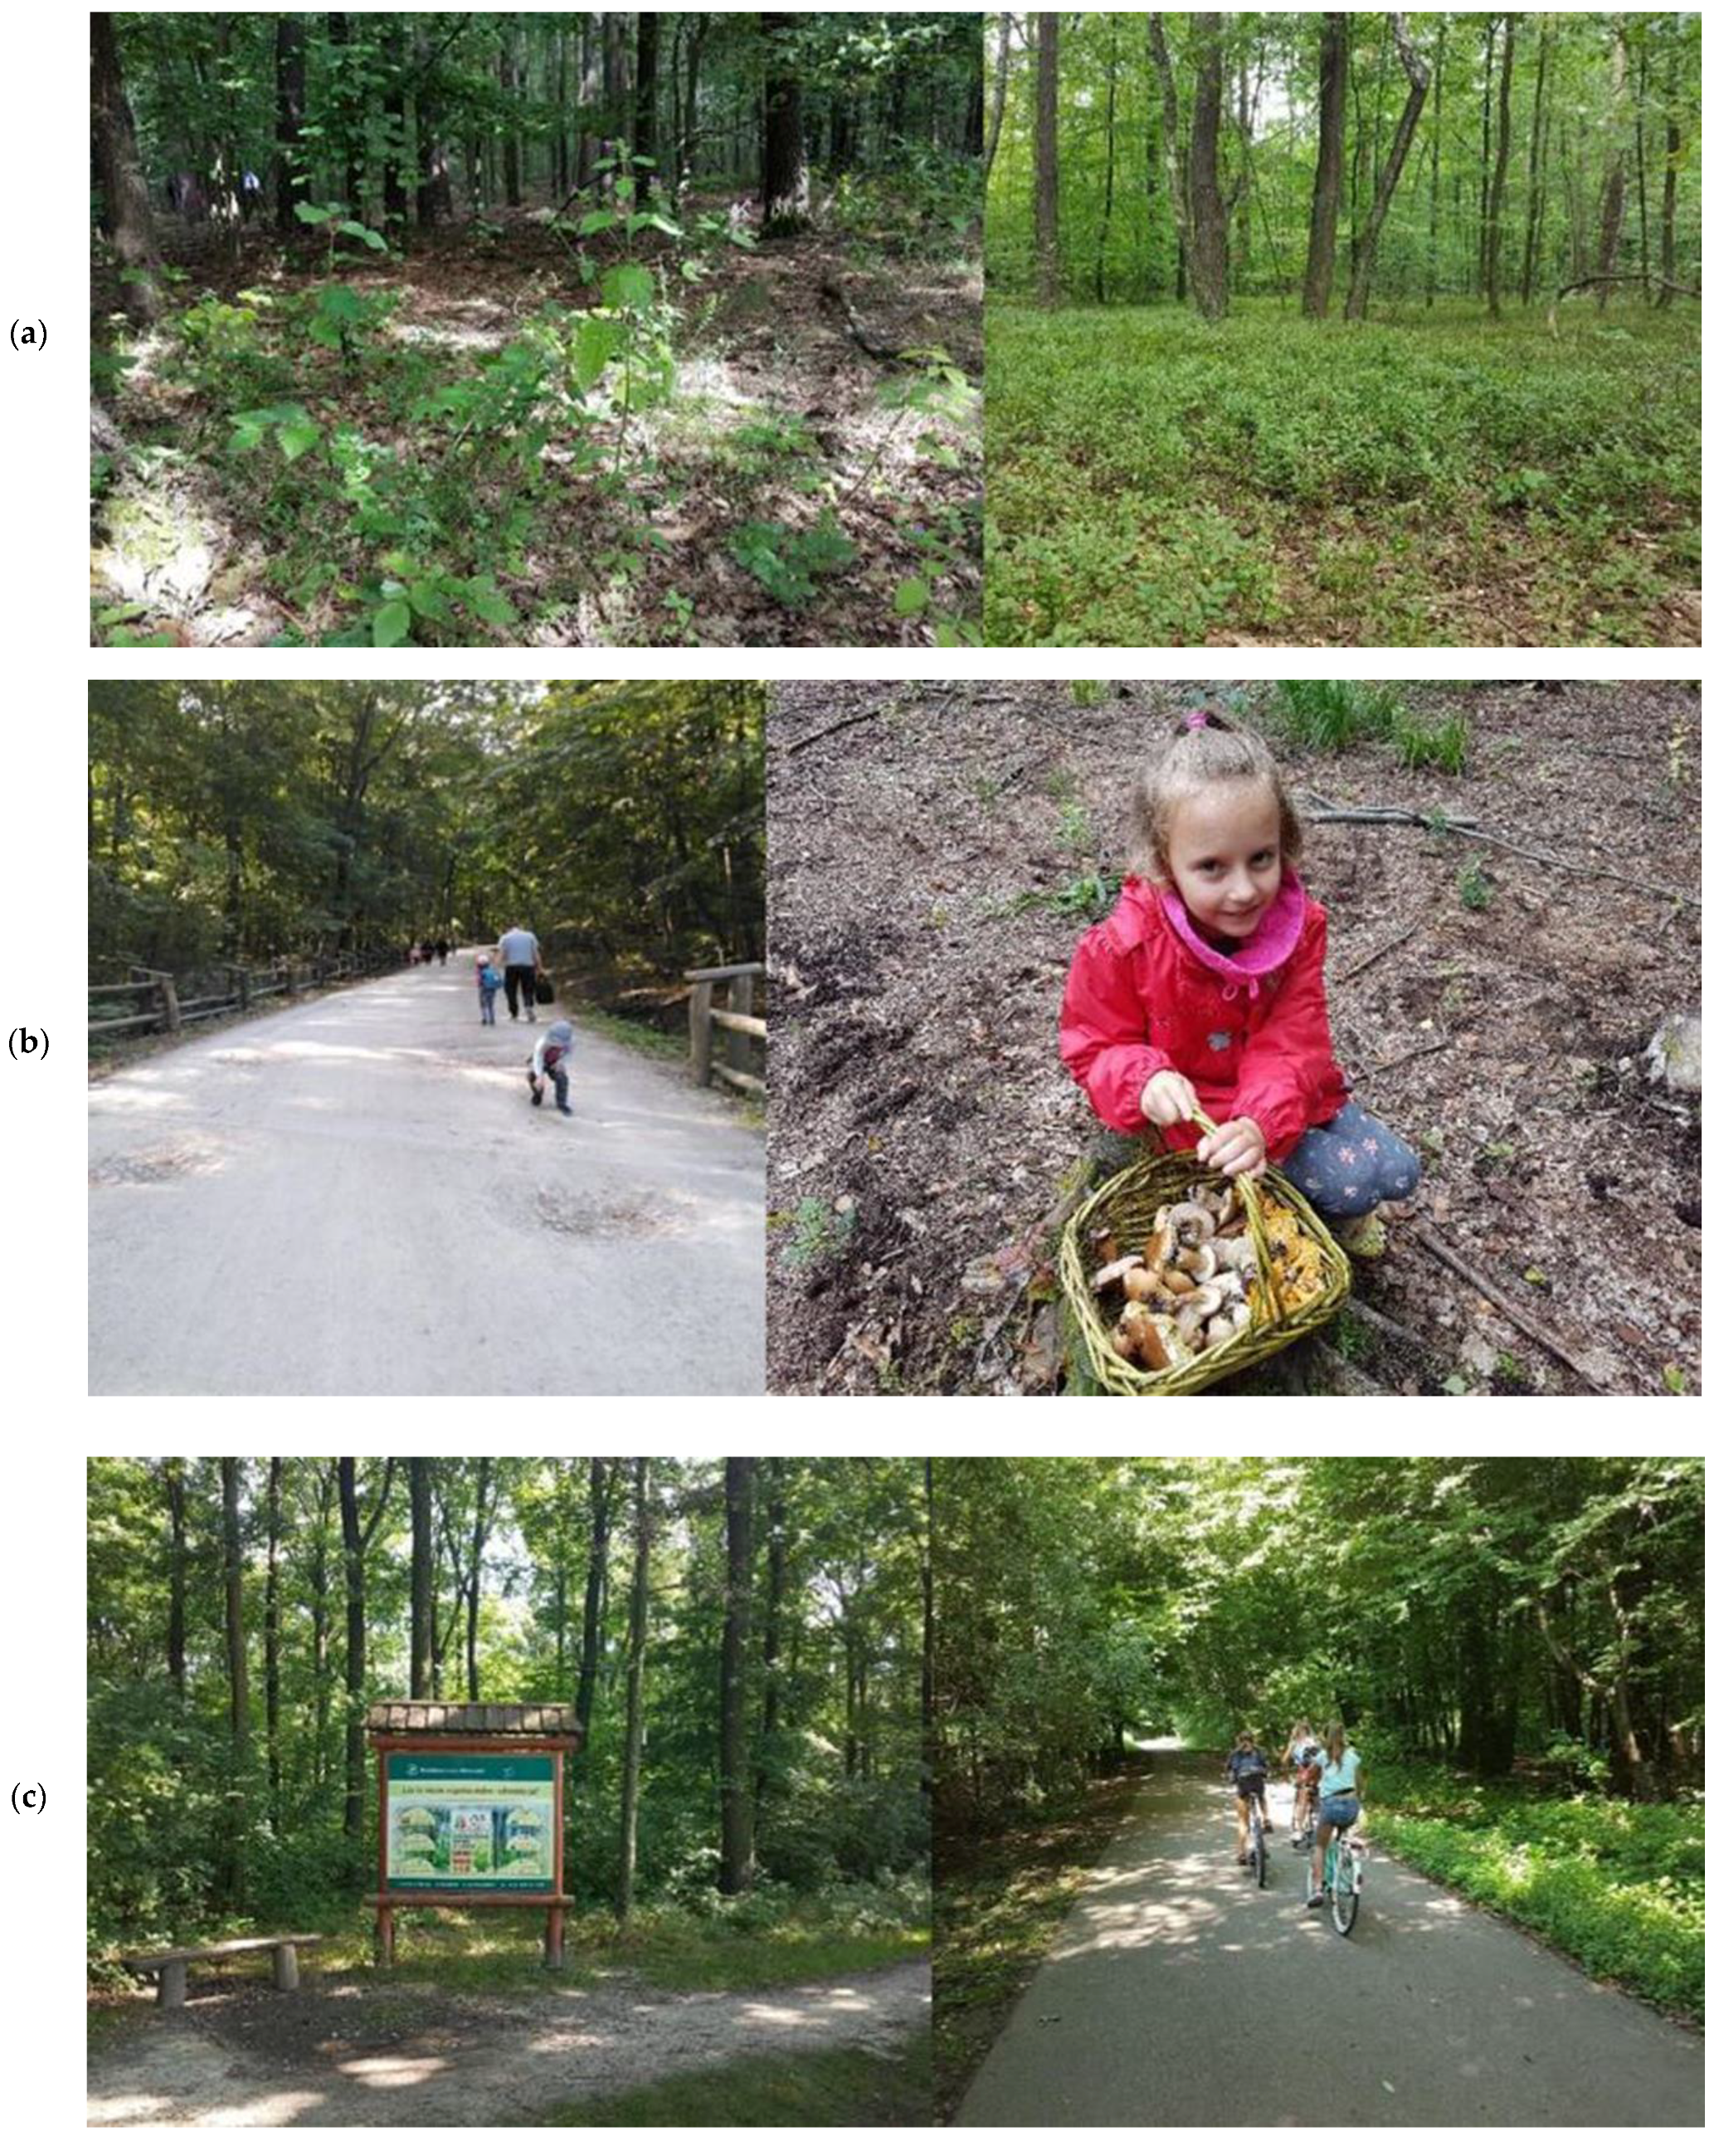
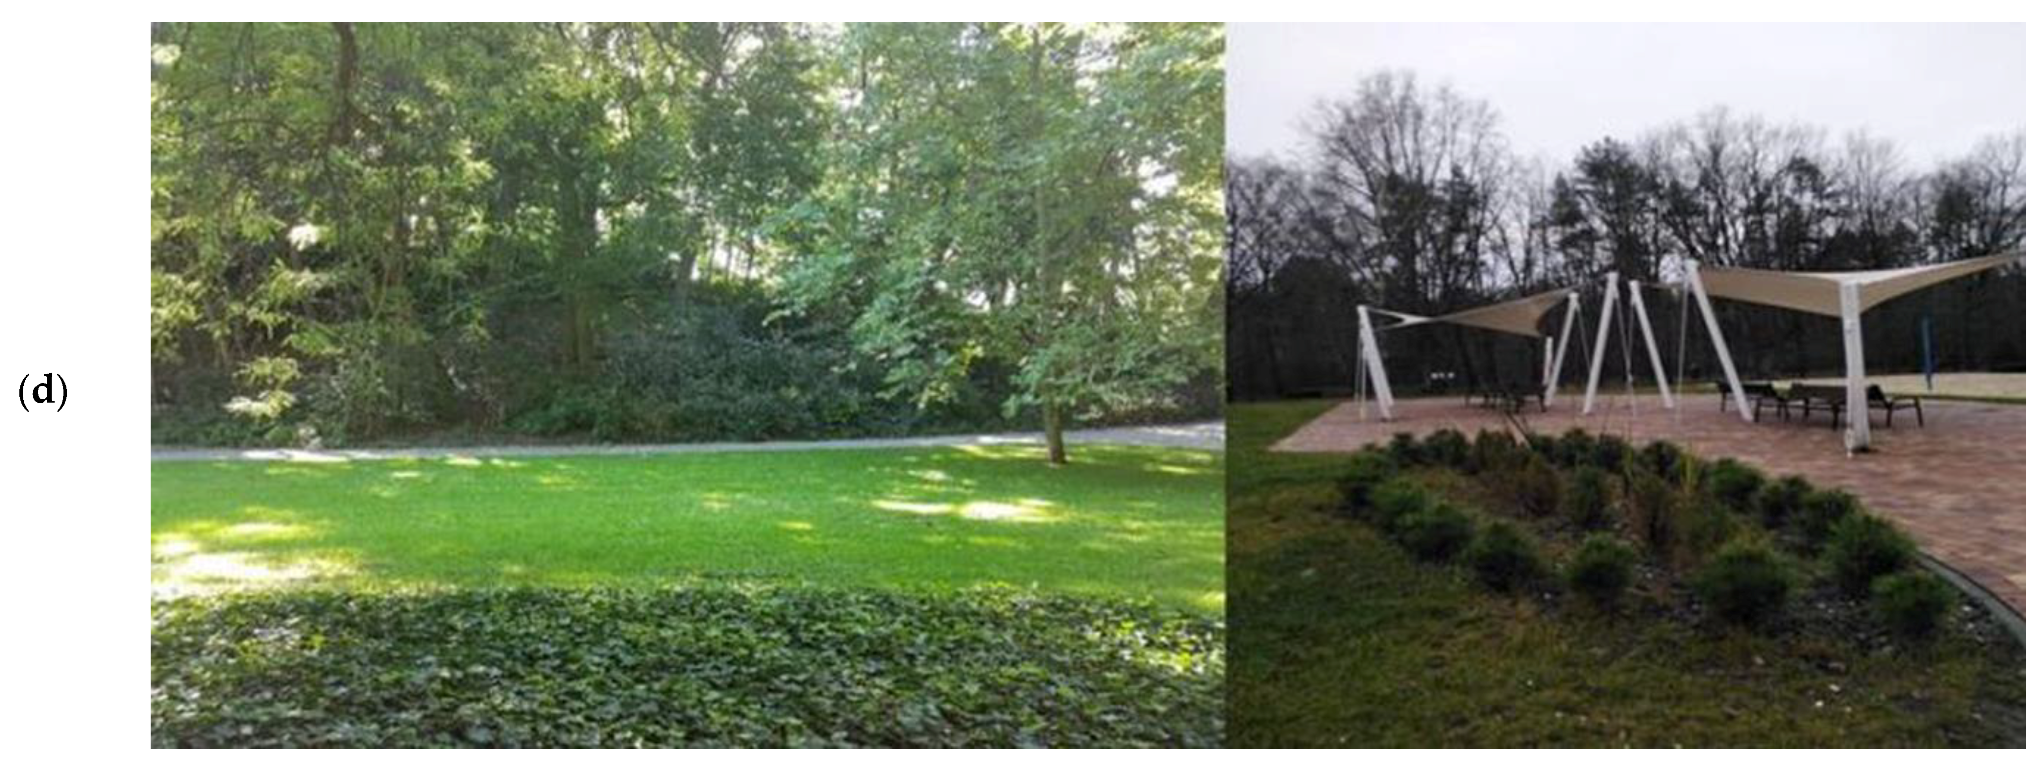
Polish cities include ca. 12,000 ha of urban forests. Warsaw is the largest city in Poland, with urban forests including nature reserves [34]. Currently, Warsaw municipal forests (WMF) cover an area of nearly 8000 ha, which amounts to approximately 15% of Warsaw’s total area; the institution manages forests belonging to the State Treasury, as well as forests under different types of ownership. The WMF was established in the 1930s. Its present form is a result of provisions of the Resolution [35]. The forests are divided into four districts: Bielany-Młociny (838 ha), Bemowo-Koło (556 ha), Kabaty (903 ha), and Las Sobieskiego (1353 ha) (Figure 1). These are located primarily on the edges of the city, in 27 forest complexes. The largest of those are Kabacki Forest (925 ha), Sobieski Forest (517 ha), and Bemowo Forest (509 ha). Kabacki Forest is the most frequently visited forest area in the capital, both among tourists and residents. The WMF encompasses numerous forms of nature protection, including five nature reserves with an aggregate area of nearly 1150 ha, “Lasy Warszawskie” Forest Promotional Complex, and an animal rehabilitation center. The WMF boasts an extensive leisure infrastructure, including hiking, bicycle, and equestrian tourist routes; picnic sites; playgrounds; and a forest-nature education center [18]. Warsaw Municipal Forests (WMF) manages and maintains forests within the city, and those under the jurisdiction of the capital city of Warsaw. The rules for management and maintenance account for the requirements of education, protection of landscape aesthetic and cultural heritage (historical, religious, patriotic), leisure of the visitors, and protection of the wildlife. The WMF operates on a basis of numerous legal acts, including the Municipal Government Act [36], the Powiat Government Act [37], the Government of the Capital City of Warsaw Act [38], the Public Funds Act [39], and the Forests Act [40].

2.1. Study Sites

Empirical materials were collected by using the auditorium questionnaire technique. It is one of the research techniques used in the survey research method; it has the advantage of a very high return rate. The respondents were 784 students from Warsaw University of Life Sciences—SGGW who took the questionnaire between March and May 2021 (Poland). In the analysis, they were treated as forest-area users, and their answers were used to verify the research hypotheses formulated above. The students received the research tool—the questionnaires—during on-site classes, and expressed their opinions on the investigated issues. Completing the questionnaire took approx. 10 min. The questionnaire consisted of two sections. The first section included socio-demographic data such as gender, age, place of residence, education, income, and the number of family members. In the second section, respondents were presented with pictures of four types of WMF (Figure 2a–d).
Based on the pictures provided, the respondents answered questions included in this section of the questionnaire, expressing their preferences regarding willingness to visit WMF (which type of forest would they like to visit the most), a hypothetical financial contribution to the WMF, spending their time in the WMF (they enjoy spending their time in the WMF and do it often), the necessity of maintenance (the respondents do not have to visit urban forests, but would mind a lack thereof), and protection/preservation of the WMF for future generations. The spectrum of preferences depended on the presence/lack of leisure infrastructure and the appearance of urban forests (forest types A–D). Answers to these questions were expressed with a five-level Likert scale; 5 meaning that the respondent strongly agrees with a statement, 4—they agree, 3—neither agrees nor disagrees, 2—does not agree, and 1—strongly disagrees with a statement.

2.2. Methods and Statistical Analysis

The variables used to verify the hypotheses were described as follows:
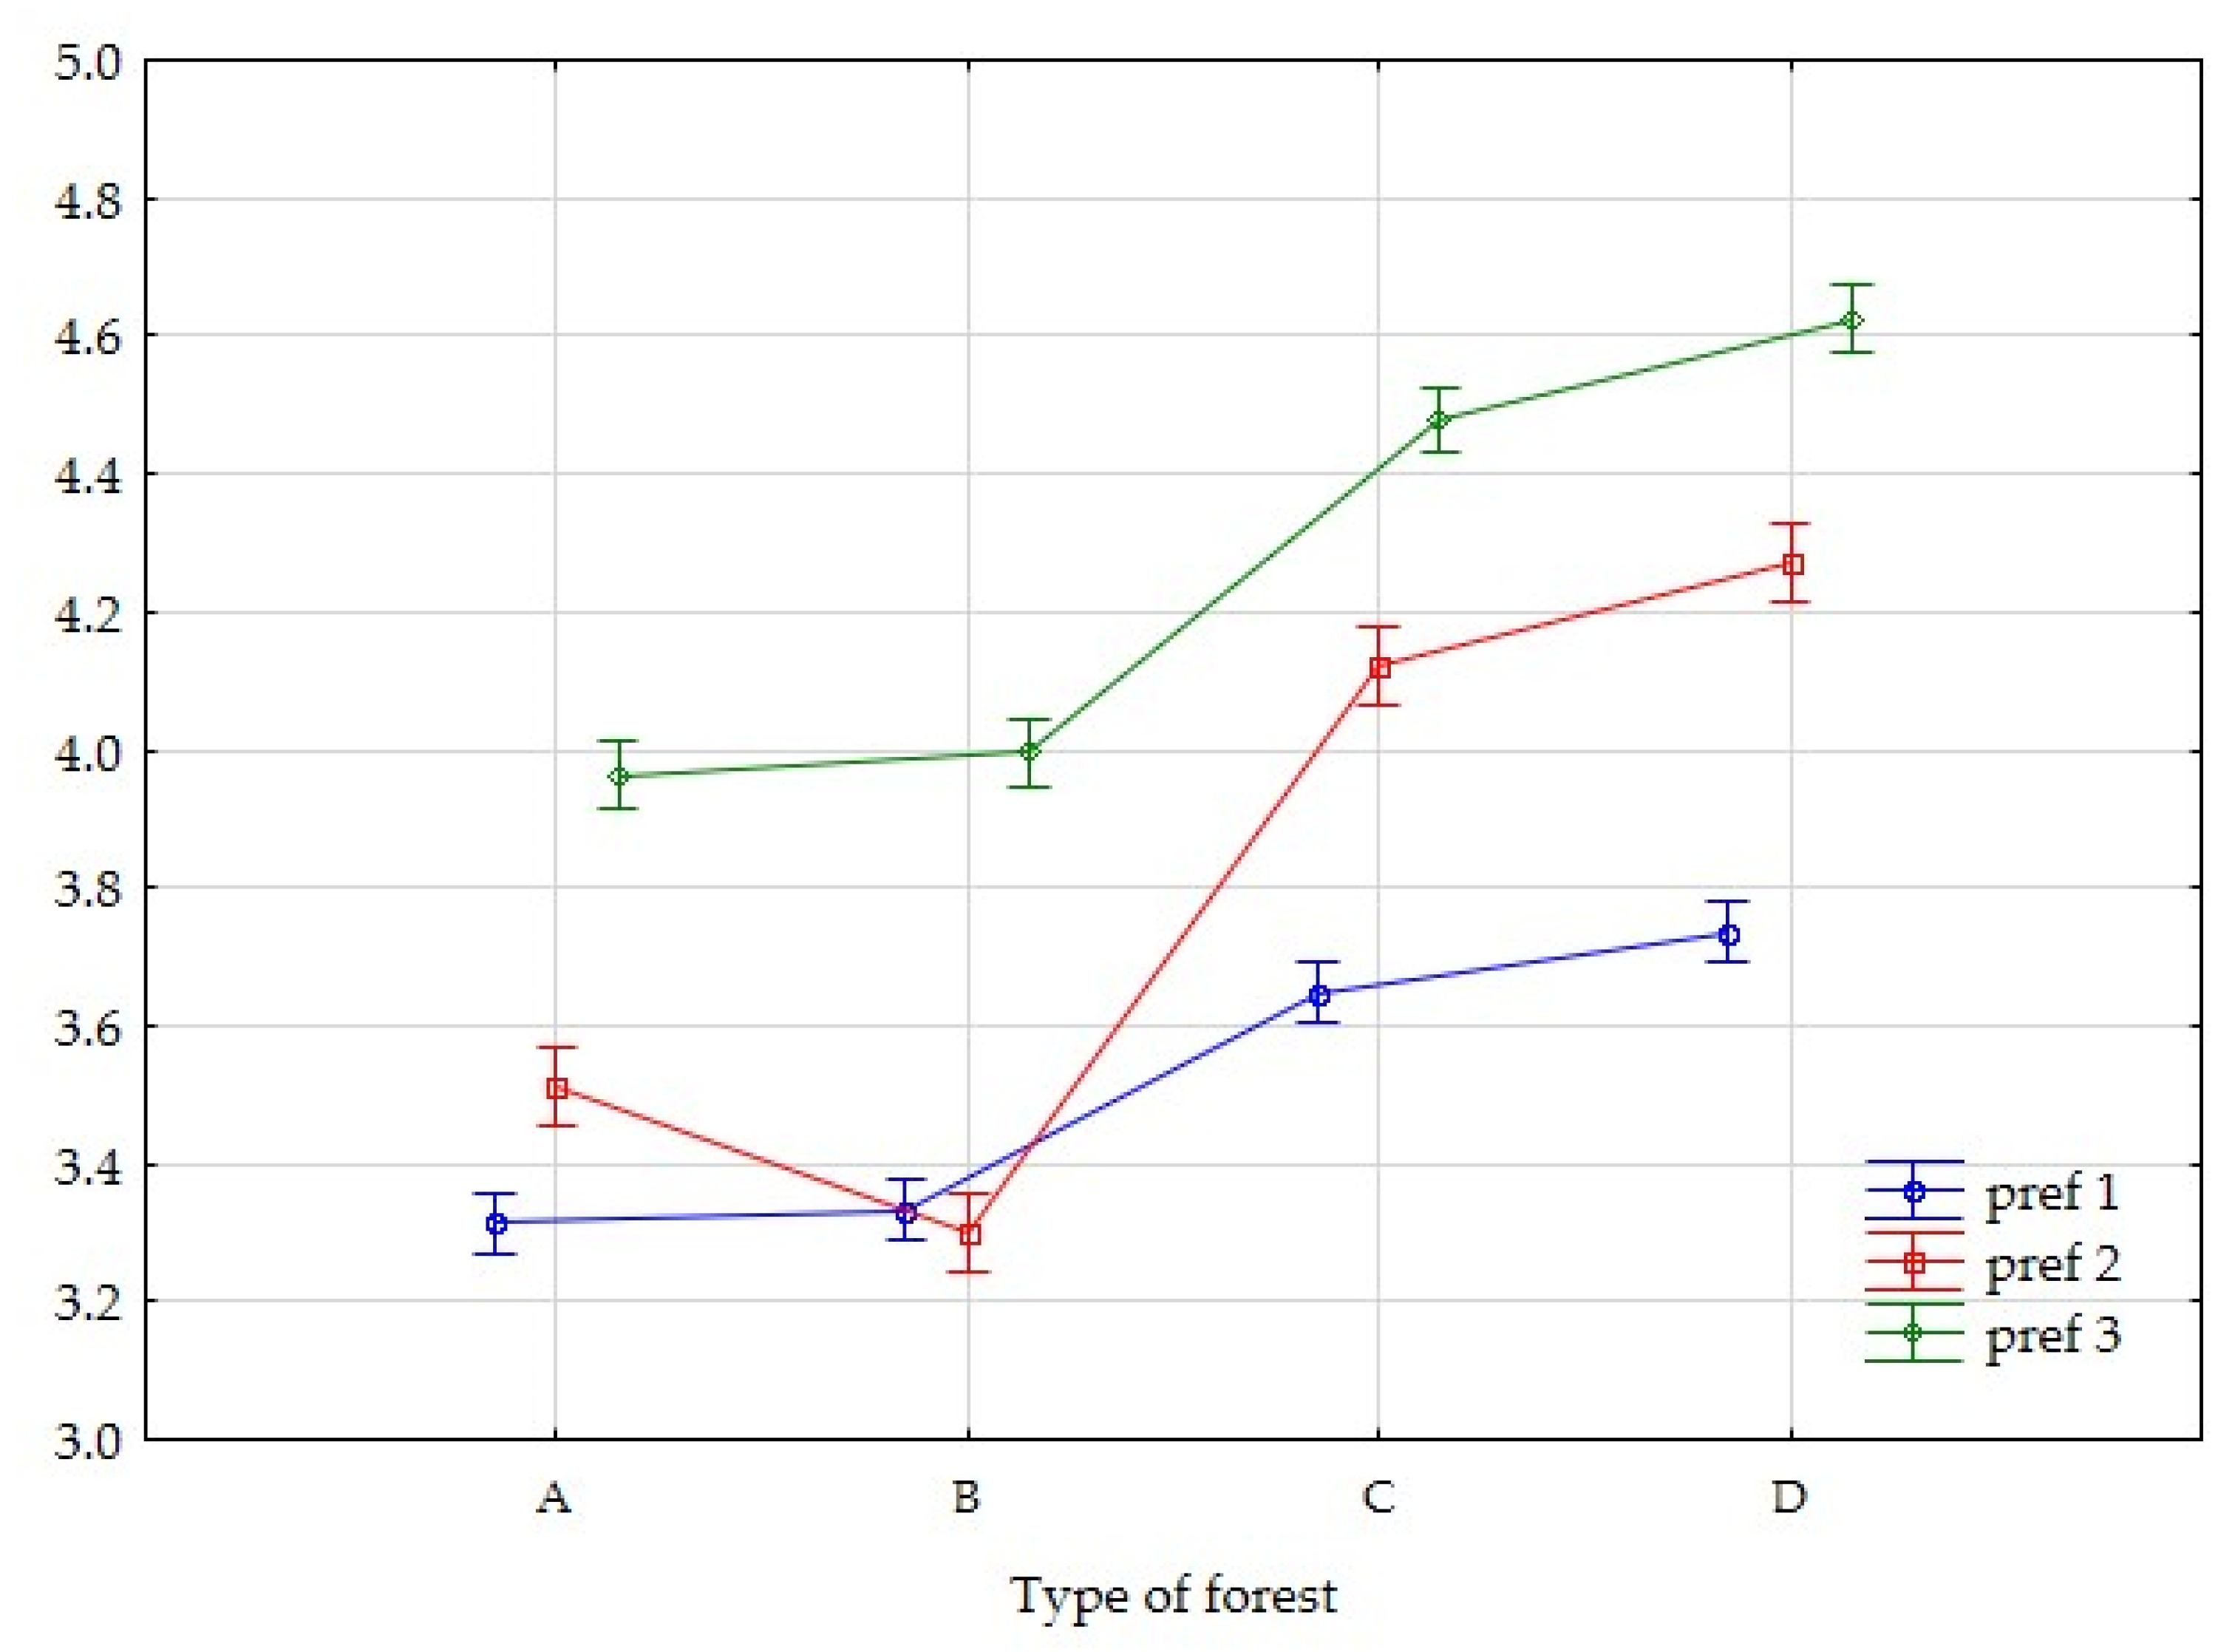
  • PREF 1—preference level for A/B/C/D forest type;
  • PREF 2—preference level regarding fondness for and spending time in that type A/B/C/D forest complex;
  • PREF 3—preference level regarding appreciation for the fact that a specific type of A/B/C/D forest exists, and that the user can access it any time;
and:
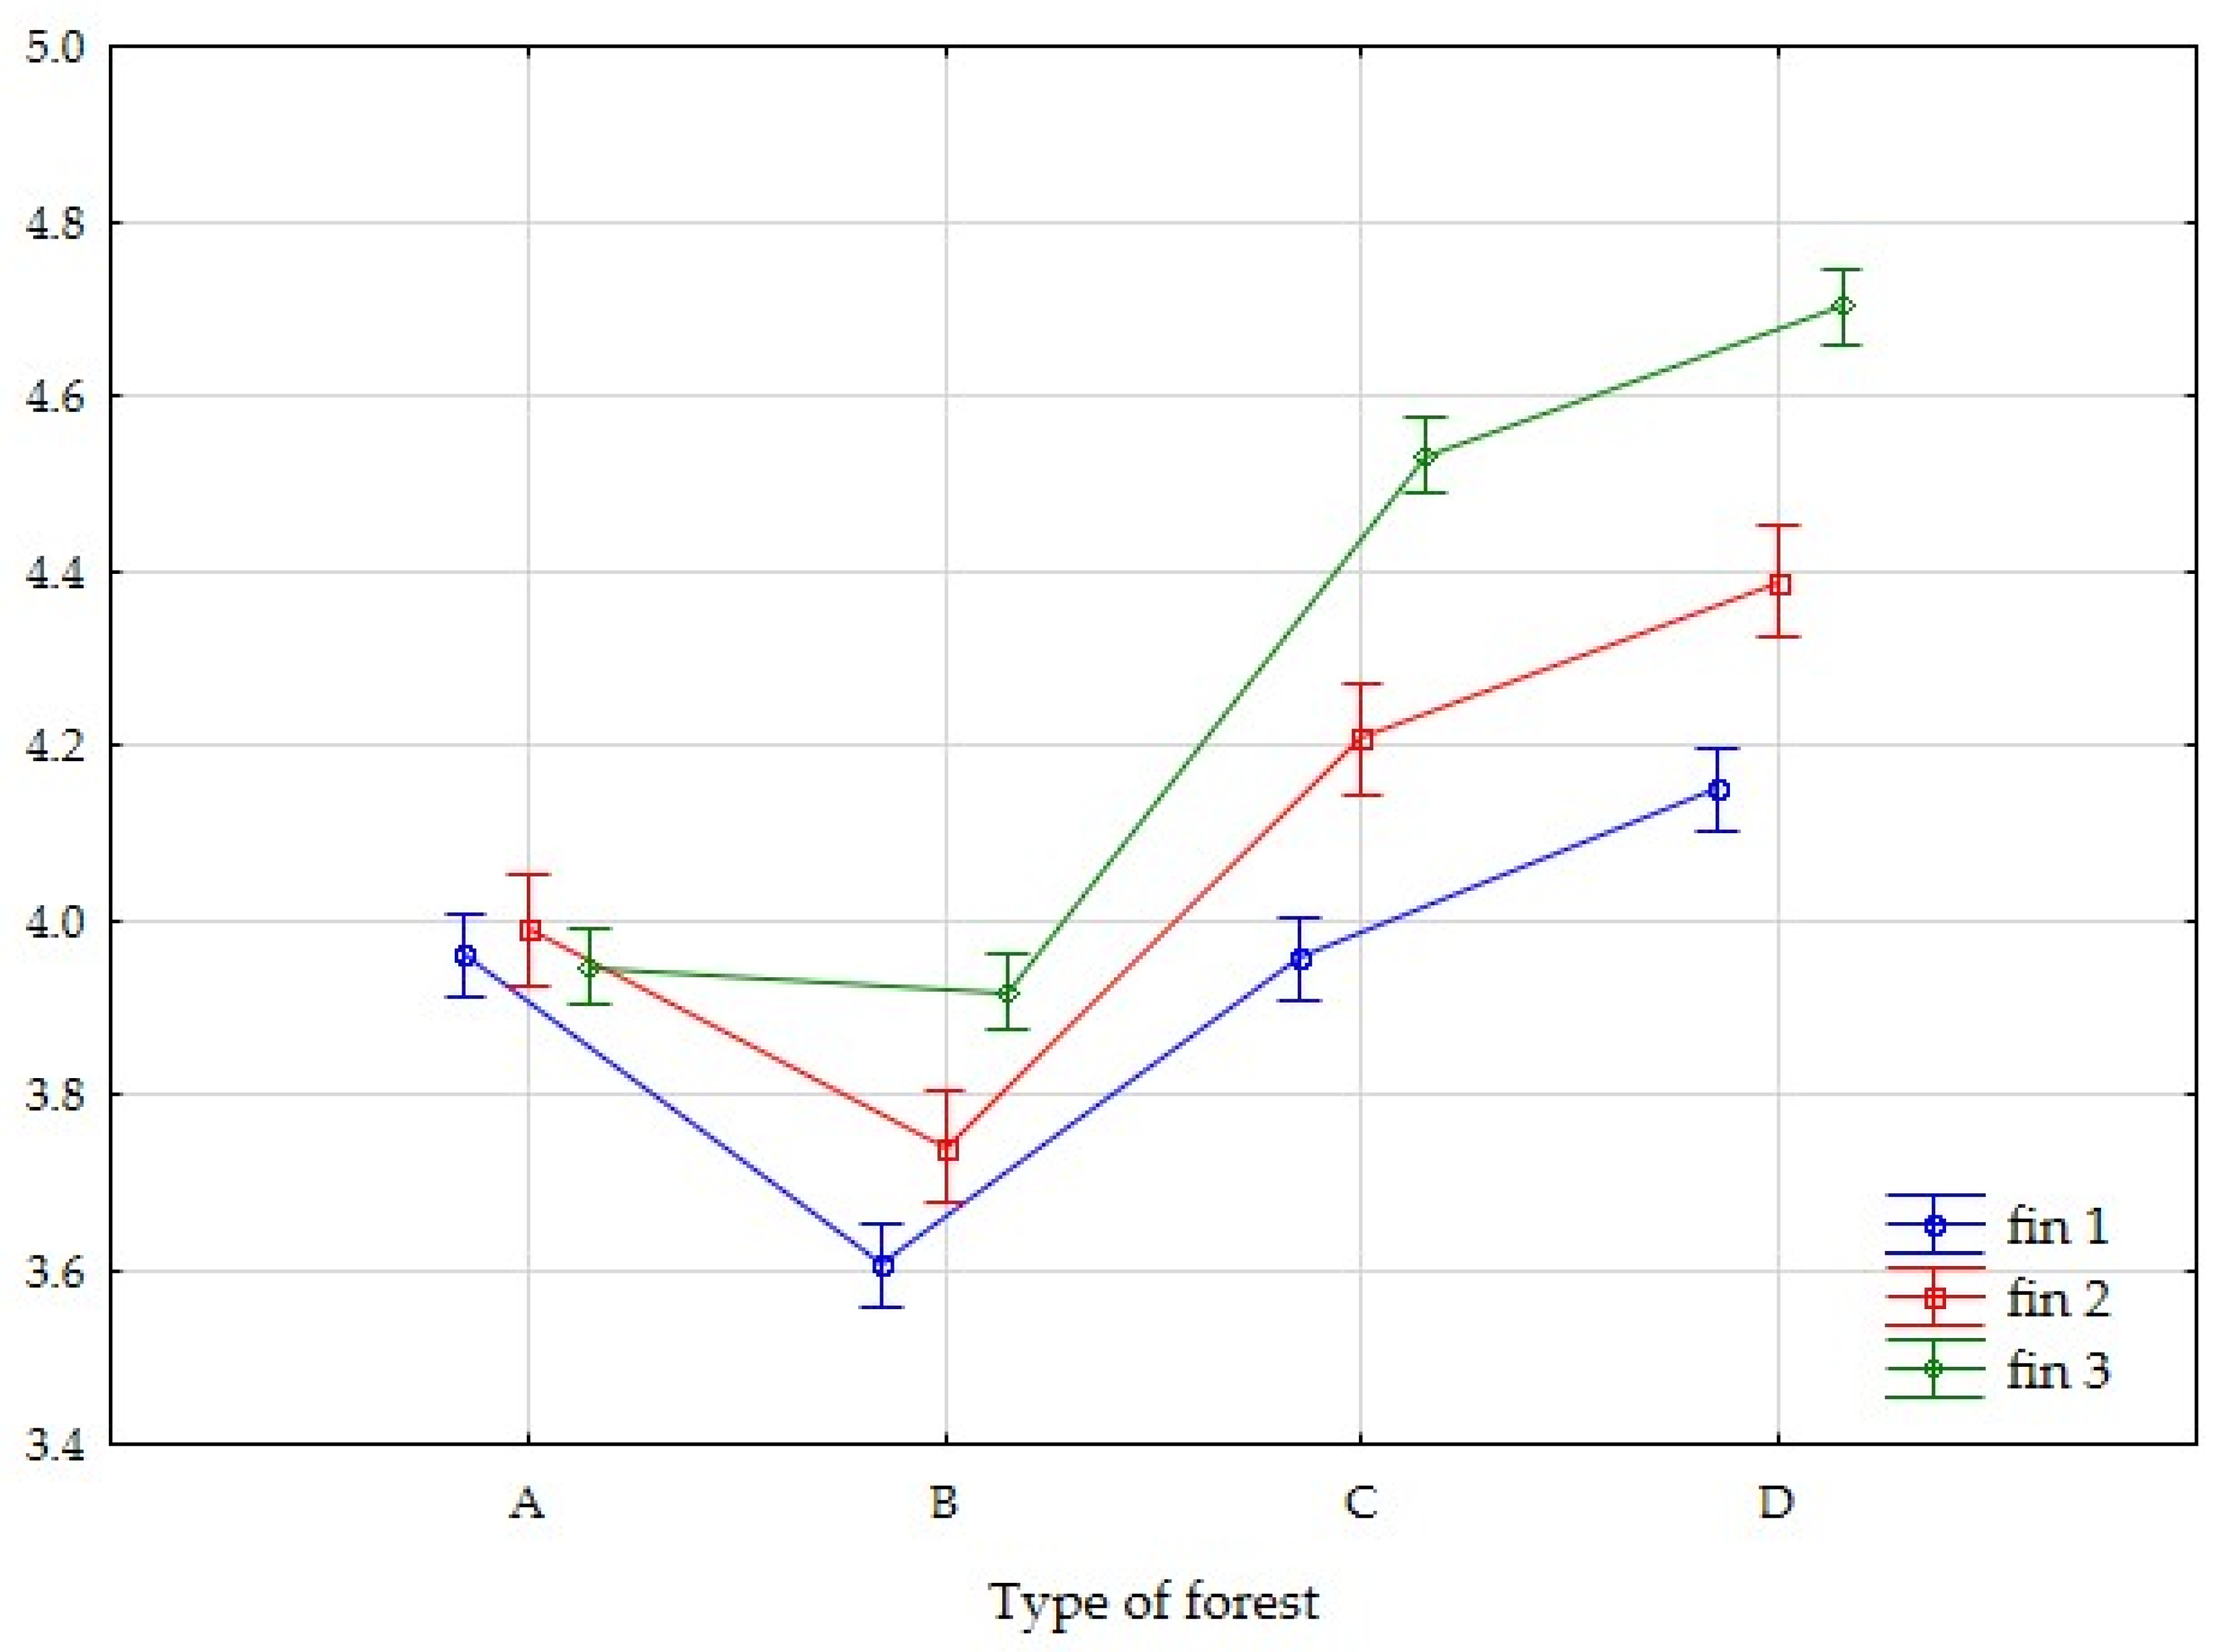
  • FIN 1—attitude towards making the amount of the hypothetical contribution dependent on the manner of exploiting/appearance of the type A/B/C/D forest;
  • FIN 2—attitude towards the necessity of maintenance (funding) of a type A/B/C/D forest (because lack thereof would mean a loss for the user);
  • FIN 3—attitude towards investing in forests in order to keep them in the urban infrastructure for future generations. A/B/C/D: 1–2 (0) do not fund, 4–5 (1) fund—answer 3 was not taken into account;
  • Respondent’s income—quantitative variable (categorized by per capita income in order to divide the respondents into 3 groups according to the affluence of their household), treated as a rank variable after categorization;
  • Respondent’s gender—dichotomous nominal variable;
  • Forest type in A/B/C/D categories—nominal variable.
In order to assess whether the forest type and per capita income (divided into 3 categories) variables affected the level of PREF 1–PREF 3 and FIN 1–FIN 3 variables, non-parametric ANOVA Friedman test was used. Due to limitations of the analysis arising from the nature of the variables, in order to examine the level differences between pairs of variables, a non-parametric U Mann–Whitney test was used for a deeper statistical analysis.
The analysis was summarized by using logistic regression—an econometric tool allowing the impact of factors (variables) on the willingness to pay (WTP) for a specific forest type to be determined. This specific kind of regression allows the correlation between a qualitative variable, which only assumes two values (WTP for a type A/B/C/D forest versus not funding it), and other variables, to be defined. The objective of the analysis utilizing this type of regression was to determine by what percentage the WTP for a type A/B/C/D forest increases or drops depending on the preference level for the corresponding forest type. The analysis involved 784 respondents. Interpretation of the analysis results acquired through logistic regression came down to determining by which percent a change in the value of a particular variable affects the likelihood of WTP for a type A/B/C/D forest, along with changes in the given independent variable. In the case of an attribute measured on a rank scale, the explanation consisted in determining by which percent the likelihood of WTP for a type A/B/C/D forest changes when the preference level increases or decreases by one tier. A logistic regression model was generated for each forest type. In each model, the dependent variable Y signified the WTP for a specific forest type (A/B/C/D). Independent variables in the model were the following: PREF 1, PREF 2, and PREF 3 for type A/B/C/D forests, respectively. The dependent variable Y (Table 1) was generated as an index of 3 variables—FIN 1, FIN 2, and FIN 3; however, their values were treated as follows: 1–2 (0) do not fund, 4–5 (1) fund, and answer 3 was not taken into account. The generated dependent variable Y assumed the following values: If at least two variables assumed a value of 4 or 5, variable Y was given the value of (1), and if one or none of the variables assumed the value of 4 or 5, Y was assigned the value of (0).
The dependent (dichotomous) variable Y was defined as:
Y = { 1   high   or   very   high   willingness   to   pay   for   a   specific   forest   type     0   ow   willingness   or   lack   of   willingness   to   pay   for   a   specific   forest   type
Analyses of each set of independent variables and models generated upon their basis were carried out to verify the following: the statistical significance of model parameters, the accuracy level of case classification, and the assessment of the model’s adjustment to the data. To assess the statistical significance of the test statistics in the ANOVA Friedman test, the U Mann–Whitney test, and the structural parameters for logistic regression models, the assumed significance level was α = 0.5.

3. Results

Participants of the research were aged between 20 and 25 (average—22.77 years). Women constituted 50.13% of the entire group, and men 49.87%. A total of 89.67% of respondents declared having secondary education, whereas the remaining 10.33% reported having higher education. The largest groups (47.70%) were students from cities with over 100,000 residents and those with an income under PLN 2000/person (42.47%). The following groups were residents of rural areas (29.85%), and towns of up to 50,000 residents (17.60%) and over 50,000 residents (4.85%). Income between PLN 2001 AND 3333 was reported by 31.51% of the respondents, whereas another 26.02% declared a higher income (Table 2).

3.1. Preference Level in Relation to the Forest Development Level

To verify whether the preference level was dependent on the forest development level, the ANOVA Friedman test was executed. At the significance level of α = 0.5, it was demonstrated that the forest development level made a significant difference in the preference level (type A forest—the lowest development level, type D forest—the highest level).
In the case of the first variable, PREF 1—the desire to visit a certain forest type in the future, the respondents rated the type D forest the highest (3.74), and type A the lowest (3.31). The ANOVA Friedman test employed confirmed that there were statistically significant differences between forest type and the PREF 1 variable.
The respondents’ declarations regarding their current preference for a specific forest type and spending time in it (PREF 2 variable) also showed statistically significant differences depending on the forest type. However, although the type D forest (4.27) was the most preferred among the respondents, the least preferred forest turned out to be type B (3.30).
General opinion regarding a forest’s value accounting for future perspective (PREF 3 variable) exhibited a dependence analogous to the PREF 1 variable, with the type A forest rated the lowest (3.96), and type D scoring the highest (4.63). Differences between forest types were statistically significant (Table 3).
Figure 3 illustrates the preference trend, showing that in the case of the PREF 1 and PREF 3 variables, the preference level rose proportionately to the forest development level. In the case of the PREF 2 variable, this correlation was not entirely incremental, since the type B forest scored the lowest average.
In order to precisely verify the correlation between a forest type preference level and its development level, pairs of forests were compared using the U Mann–Whitney test. In the case of the PREF 1 variable, all the correlations were statistically significant (p-value for the statistics value was lower than the adopted significance level), with the exception of the comparison between the A and B forest types. This indicates that the preference level did not vary with statistical significance between these forest types in the context of respondents’ desire to visit them in the future. An analogous correlation was applied to the PREF 3 variable. Only in the case of the PREF 2 variable, which regarded spending time in a given type of forest, did the U Mann–Whitney test show statistically significant differences between all pairs of forest types; however, the correlation between A and B forest types was opposite to what the hypothesis presumed—of the two, the less developed forest type was preferred (Table 4).
The performed analyses confirmed hypothesis H1, that the preference level depends on the forest’s development level, and a higher development level translates to a higher preference level.

3.2. Forest Type vs. Willingness to Pay for It

To examine whether WTP for the infrastructure of urban forests depends on the forest’s development level, the ANOVA Friedman test was used again. At a significance level of α = 00.5, it was demonstrated that a forest’s development level significantly affects the WTP for the forest infrastructure.
In the case of the first variable, FIN 1, which describes the amount of a hypothetical contribution depending on the forest’s appearance and manner of exploitation, the respondents were the most willing to fund forests with higher levels of development. The type D forest scored an average of 4.1, whereas type B was rated the lowest. The ANOVA Friedman test confirmed the presence of statistically significant differences depending on the forest type and the FIN 1 variable (p-value for the statistics value was lower than the adopted significance level).
A similar correlation can be seen in the case of declarations regarding the necessity to fund forests—the FIN 2 variable. The respondents agreed the most with the statement that highly developed forests should receive more funding. They showed the least WTP for the type B forest. This correlation was also statistically significant.
The FIN 3 variable referred to a long-term perspective for funding urban forests, namely, investing in forests to preserve them in cities for future generations. Similar to variables FIN 1 and FIN 2, in the case of the FIN 3 variable, the type D forest scored the highest average of answers (4.70), whereas type B scored the lowest (3.92). This correlation was also statistically significant (Table 5).
For a detailed verification of the analyzed correlations, Figure 4 was generated; it illustrates that a higher forest development level translated to a higher value of variables related to WTP for forest types A, C and D. Only in the case of the type B forest could a break from the trend be observed, which is why additional comparative analyses of pairs of forests using the U Mann–Whitney test were executed.
In the case of the FIN 1 variable, all the correlations were statistically significant, with the exception of the comparison between forest types A and C, which shows that there was no statistically significant difference between the levels of WTP for these two types of forest. Additionally, in the case of this variable, a comparison between forest types A and B showed that the less developed type A forest was more preferred, and that this correlation bore statistical significance. In the case of the FIN 2 variable, all the correlations were statistically significant and, with the exception of the comparison between forest types A and B, confirmed that the WTP for a forest was higher for more developed forest types. In the case of the FIN 3 variable, statistically significant correlations confirmed that WTP for a forest rose along with its development level (Table 6).
The performed analyses partially confirmed the postulated H2 hypothesis that WTP for a specific forest type depends on its development level, and the higher the development level, the higher WTP for it. This correlation did not apply to forest type B only.

3.3. Preferences Regarding a Forest Type in Relation to Respondents’ Income

The analysis employed the U Mann–Whitney test. All the statistical values in the table marked with the (*) symbol exhibited statistically significant differences at the significance level assumed for the research. The higher the income, the lower the preference for the type A forest (PREF 1, 2, 3 variables); these differences were statistically significant in the comparison between respondents with the lowest and highest incomes (groups 1 and 3, respectively), and between respondents with medium and high incomes (groups 2 and 3, respectively) in the case of the PREF 1 and 2 variables. An analogous correlation occurred in the case of the type B forest; however, these differences were not statistically significant for the PREF 3 variable. In the case of the type C forest, higher income corresponded to a statistically significant increase in preference in the PREF 2 area between respondents with the highest and the lowest income. In the case of the type D forest, a higher income meant a higher preference level in the PREF 1 area; this difference was statistically significant for the comparison between respondents with the highest and the lowest income (1 vs. 3, respectively), as well as between those with medium and high incomes (2 vs. 3, respectively) (Table 7).
The obtained results allowed the researchers to partially verify hypothesis 3 stating that preferences regarding a forest type are dependent on the respondent’s per capita income. The hypothesis was verified for the less developed forest types, namely, A and B. In the case of type C and D forests, the hypothesis was not verified.

3.4. Willingness to Pay

In the case of the type A forest, a higher income meant that the respondent was less willing to financially support this forest type (FIN 1 variable); however, statistically significant differences were observed only between the lowest (1) and medium (2) income groups, and between the lowest (1) and highest (3) income groups. Moreover, a statistically significant difference between the lowest (1) and the highest (3) income groups was related to the necessity to invest in forests to preserve them in the urban structure for future generations (variable FIN 3). An analogous correlation between the lowest (1) and medium (2) income groups applied to the type B forest in the case of FIN 1 and FIN 2 variables, and to the type C forest in the case of the FIN 3 variable, in the comparison between the lowest (1) and the highest (3) income group. An opposite correlation was found in the case of the FIN 2 variable between income groups 2 and 3. In the case of the type C forest, a higher income was correlated to a lower value of the FIN 2 variable in comparison to income groups 2 vs. 3 and 1 vs. 3 (Table 8).
The performed analyses did not allow us to verify hypothesis 4, namely, that WTP for a specific forest type depends on the respondent’s per capita income.

3.5. Preference in Relation to WTP for a Forest Type

Logistic regression analysis was performed to verify hypothesis 5.
WTP for a type A forest (Table 9):
  • Preference level regarding appreciation for the fact that type A forests exist, and that the respondent can access them at any time—a probability quotient of 0.2600 indicates that an increase in preference level of 100% results in a 74% decrease in WTP for a type A forest.
WTP for a type B forest:
  • Type B forest preference level—a probability quotient of 1.4139 indicates that an increase in preference level of 41.39% results in an increase in WTP for a type B forest (multiplied by 1.4139).
  • Preference level regarding fondness for and spending time in a specific type of forest complex—type B forest; a probability quotient of 2.0872 indicates that an increase in preference level of 100% results in a 108.72% increase in WTP for a type B forest (multiplied by 2.0872).
  • Preference level regarding appreciation for the fact that type B forests exist, and that the respondent can access them at any time—a probability quotient of 0.1296 indicates that an increase in preference level of 100% results in a 87.04% decrease in WTP for a type B forest.
WTP for a type C forest:
  • Preference level regarding fondness for and spending time in a specific type of forest complex—type C forest; a probability quotient of 0.3836 indicates that an increase in preference level of 100% results in a 61.64% decrease in WTP for a type C forest.
  • Preference level regarding appreciation for the fact that type C forests exist, and that the respondent can access them at any time—a probability quotient of 0.2616 indicates that an increase in preference level of 100% results in a 73.84% decrease in WTP for a type C forest.
WTP for a type D forest:
  • Preference level regarding fondness for and spending time in a specific type of forest complex—type D forest; a probability quotient of 0.6181 indicates that an increase in preference level of 100% results in a 38.19% decrease in WTP for a type D forest.
  • Preference level regarding appreciation for the fact that type D forests exist, and that the respondent can access them at any time—a probability quotient of 0.2973 indicates that an increase in preference level of 100% results in a 70.27% decrease in WTP for a type D forest.
All the parameters appearing next to the descriptive variables were statistically significant (p-value < 0.05); this means that these variables affected the dependent variable Y significantly.
The parameters included in Table 10 indicate good accuracy of case classification in each model. Statistical significance of the χ2 statistic value indicates good model adjustment to the data.
The conducted analyses allowed us to confirm hypothesis 5, namely, that preference level affects WTP and varies for different forest types. In the case of A, C, and D forest types, an increase in preference resulted in a decrease in WTP for this forest type; in the case of the type B forest, an increase in preference resulted in a greater WTP for this type of forest.

4. Discussion

The importance of green areas in cities is tremendous, especially during the recent COVID-19 pandemic [41,42]. Since they often cover a large area, forests create a safe haven of leisure and recreation for significant numbers of people. Forests located near big cities are eagerly frequented by residents of those cities. It would seem that tourists are more keen on spending their time in forests with better and more extensive infrastructure. Interestingly, the results of research into this matter are very inconclusive. Tourist preferences regarding forest development are different; for leisure, they choose both forests with recreational infrastructure [43] and those without it. The preferences also change over time [44,45]. Research conducted in the WMF has shown and proven that forests with park characteristics and numerous elements of small recreational architecture are the most popular. Preference level also depends on sociological features, such as place of residence; Dudek’s research [46] showed that the demand for tourist-recreational infrastructure is higher in larger cities. Referowska-Chodak [47] examined the technical condition of the recreational infrastructure, pointing it out as one of the most important factors affecting the development of tourism in the urban forests of large cities. In research by Janeczko and Woźnicka [48], a decisive majority of those visiting WMF mentioned the importance of recreational infrastructure. The most vital elements included walking, biking, and jogging paths. The edges of forested areas should be prioritized for development [48]. For comparison, in the municipal forests of Riga, the visitors gave positive feedback on the presence of tourist equipment and infrastructure, especially trash cans and designated areas for sports and picnicking [49]. Respondents also valued accessibility and cleanliness of parking lots, hiking routes, and the availability of guide services [33]. A different point of view was presented by [50,51,52,53,54], whose results demonstrated that tourists are more inclined to choose forests without recreational equipment for their leisure.
Urban forest areas and protected areas are regarded by society through the lens of the profits they make and the non-market economic values applied to them, which often inspire in citizens a WTP for the protection and preservation of these areas [55,56,57]. Society’s readiness to support forests financially is subject to heavy fluctuations [44]. Research in the WMF partially confirmed hypothesis 2 and indicated that the WTP for a forest depends on its development level—a higher development level was correlated with a greater WTP for it. Interestingly, research by Skłodowski and Gołos [54] did not confirm this; in that research, the respondents declared a greater WTP for forests without tourist infrastructure. In the same research, the WTP was greater among respondents who pointed out the following features as missing: parking lots, educational routes, jogging paths, leisure equipment (e.g., benches, tables, canopies), and biking paths. As for preferences regarding the choice of forest type for leisure depending on the respondents’ income, research in the WMF has shown that forests with lower recreational development are preferred; this means that people with higher income are more likely to visit natural forests free of landscaping efforts (e.g., a strict nature reserve or a commercial forest without any recreational infrastructure and where available activities include walking on footpaths and picking mushrooms and berries). No such correlation has been found for forests with developed tourist infrastructure.
An analysis of literature on the subject shows a general trend: The WTP for forests is lower in the less wealthy countries [54], and conversely, the higher the GDP, the higher the declared amounts respondents were willing to pay [58,59,60,61,62]. Affluent respondents are more often willing to pay higher contributions to protect the most ecologically valuable portions of forests, clean out the litter [63], support amenities, and modernize and expand recreational infrastructure in municipal forests, e.g., to upgrade hiking routes [11,63]. The same correlation was observed in the case of household income [64]. However, there is no shortage of quite opposite reports pointing to a lack of correlation between the WTP for forests and the respondent’s income [55,56,57,58,59,60,61,62,63,64,65]. The research conducted in the WMF is also characterized by a lack of this correlation. For comparison, research conducted in the municipal forests of Tarnów City shows little impact of sociological factors on the WTP for urban forests [56].
Other sociological factors affecting the WTP for urban forests may include education (the higher the education the greater the WTP for forests [11,33,66,67], gender [68], social status [57,65], age [60,61,69], and place of residence [70]. The respondents also declared a greater WTP for forests if they lived near one [71,72].
The preferences of respondents participating in the research in the WMF confirmed that the forest preference level affects the WTP for it. As shown by the literature research, the WTP for forests also largely depends on the appearance of the forest itself. It may be presumed that the higher the respondents’ preference for leisure in stratified forests with multiple species and undergrowth, the more willing they will be to financially support forests. Visitors are more willing to pay for mixed forests than coniferous or deciduous ones [68]. Greater accessibility of ecosystem services in a forest is another factor increasing the amount of the contributions the respondents are willing to pay [73]. Therefore, due to a very high biodiversity level, as well as performing numerous ecological, social, protective, and economic functions, forest ecosystems should undergo comprehensive evaluation in regard to all the services they provide. This applies to all forested areas, including urban forests [74,75]. For example, enhancing visibility in a forest by removing some of the vegetation increases its recreational value [15,76,77]. Preferences and perception of a forest depend on the studied group. For instance, adult tourists seeking leisure usually choose clean forests with abundant light, semi-sparse vegetation, and little undergrowth [23,53,78]. Parents and caregivers have different requirements for a recreational-use forest: bodies of water, deadwood, open spaces such as meadows, and undergrowth [24].

5. Conclusions

Current decision-makers, city planners, and scientists are taking up the challenge of zoning urban forests in such a manner that combines multi-functionality and biodiversity, and at the same time accommodates the changing preferences of users of those areas [79].
Due to the fact that woodland tourism is often the catalyst for the development of other industries, this paper is an important piece of the discussion on the economic, social, and environmental significance of urban forests. Information gathered from this work may prove valuable to those managing municipal forests and involved in the development of recreation in urban forests and their vicinity. The conducted research is important in the context of developing recreational infrastructure, the landscaping of green areas, and forest management in big cities.

Author Contributions

Conceptualization, A.M., B.F.-P. and S.P.; methodology, A.M. and B.F.-P.; software, D.S.; validation, D.S. and K.W.; formal analysis, D.S., K.W., A.M. and B.F.-P.; investigation, A.M. and B.F.-P.; resources, A.M. and B.F.-P.; data curation, D.S. and K.W.; writing—original draft preparation D.S.; A.M., B.F.-P. and S.P.; writing—review and editing, A.M., B.F.-P., D.S. and S.P.; visualization, D.S., K.W. and B.F.-P. All authors have read and agreed to the published version of the manuscript.

Funding

This research received no external funding.

Institutional Review Board Statement

The study was conducted according to the guidelines of the Declaration of Helsinki. The personal information and data of the participants were anonymous according to the General Data Protection Regulation of the European Parliament (GDPR 679/2016). The survey did not require approval by the ethics committee because of the anonymous nature of the online survey and impossibility of tracking sensitive personal data, additionally the CAWI survey was conducted by professional company certified to conduct research in accordance with industry and ethical standards.

Informed Consent Statement

Informed consent was obtained from all subjects involved in the study.

Data Availability Statement

Data sharing not applicable; no new data were created or analyzed in this study.

Conflicts of Interest

The authors declare no conflict of interest.

References

  1. Sanesi, G.; Colangelo, G.; Lafortezza, R.; Calvo, E.; Davies, C. Urban green infrastructure and urban forests: A case study of the Metropolitan Area of Milan. Landsc. Res. 2017, 42, 164–175. [Google Scholar] [CrossRef]
  2. Liro, A.; Szacki, J. Korytarz ekologiczny: Przegląd problematyki (Ecological corridor: An overview of the issues). Człowiek I Środowisko 1993, 17, 299–312. [Google Scholar]
  3. Maes, J.; Barbosa, A.; Baranzelli, C.; Zulian, G.; e Silva, F.B.; Vandecasteele, I.; Hiederer, R.; Liquete, C.; Paracchini, M.L.; Mubareka, S.; et al. More green infrastructure is required to maintain ecosystem services under current trends in land-use change in Europe. Landsc. Ecol. 2015, 30, 517–534. [Google Scholar] [CrossRef] [PubMed] [Green Version]
  4. Baker, T.P.; Jordan, G.J.; Baker, S.C. Microclimatic edge effects in a recently harvested forest: Do remnant forest patches create the same impact as large forest areas? For. Ecol. Manag. 2016, 365, 128–136. [Google Scholar] [CrossRef]
  5. Fornal-Pieniak, B.; Ollik, M.; Schwerk, A. Impact of different levels of anthropogenic pressure on the plant species composition in woodland sites. Urban For. Urban Green. 2019, 38, 295–304. [Google Scholar] [CrossRef]
  6. Manning, W.J. Plants in urban ecosystems: Essential role of urban forests in urban metabolism and succession toward sustainability. Int. J. Sustain. Dev. World Ecol. 2008, 15, 362–370. [Google Scholar] [CrossRef]
  7. Konijnendijk, C.C. The Forest and the City, 9th ed.; Springer International Publishing: Cham, Switzerland, 2018; Volume 9, ISBN 978-3-319-75075-0. [Google Scholar]
  8. Nitoslawski, S.A.; Steenberg, J.W.; Duinker, P.N.; Bush, P.G. Assessing the influence of location attributes on urban forest species composition in suburban neighbourhoods. Urban For. Urban Green. 2017, 27, 187–195. [Google Scholar] [CrossRef]
  9. Xu, C.; Dong, L.; Yu, C.; Zhang, Y.; Cheng, B. Can forest city construction affect urban air quality? The evidence from the Beijing-Tianjin-Hebei urban agglomeration of China. J. Clean. Prod. 2020, 264, 121607. [Google Scholar] [CrossRef]
  10. Picket, T.A.; Steward, J.M.; Grove, J.M. Urban ecosystems: What would Tansley do? Urban Ecosyst. 2009, 12, 1–8. [Google Scholar] [CrossRef]
  11. Tavárez, H.; Elbakidze, L. Valuing recreational enhancements in the San Patricio Urban Forest of Puerto Rico: A choice experiment approach. For. Policy Econ. 2019, 109, 102004. [Google Scholar] [CrossRef]
  12. Kousis, I.; Pigliautile, I.; Pisello, A.L. A Mobile Vehicle-Based Methodology for Dynamic Microclimate Analysis. Int. J. Environ. Res. 2021, 15, 893–901. [Google Scholar] [CrossRef] [PubMed]
  13. Mandziuk, A.; Woźnicka, M. Walory kulturowe Lasów Miejskich—Warszawa (Cultural values of the Warsaw Municipal Forests). Probl. Ekol. Kraj. 2012, 34, 181–186. [Google Scholar]
  14. Croci, E.; Lucchitta, B.; Penati, T. Valuing ecosystem services at the urban level: A critical review. Sustainability 2021, 13, 1129. [Google Scholar] [CrossRef]
  15. Arnberger, A.; Eder, R. Are urban visitors’ general preferences for green-spaces similar to their preferences when seeking stress relief? Urban For. Urban Green. 2015, 14, 872–882. [Google Scholar] [CrossRef]
  16. Jahani, A.; Saffariha, M. Aesthetic preference and mental restoration prediction in urban parks: An application of environmental modeling approach. Urban For. Urban Green. 2020, 54, 126775. [Google Scholar] [CrossRef]
  17. Lorek, A.A. Usługi ekosystemów w aspekcie zrównoważonego rozwoju obszarów miejskich (Ecosystem services in the context of sustainable urban development). Acta Univ. Lodziensis. Folia Oecon. 2015, 2, 97–112. [Google Scholar] [CrossRef] [Green Version]
  18. Malinowska, E.; Szumacher, I. Survey of recreational use of the Las Kabacki forest nature reserve in Warsaw (Poland). Misc. Geogr. 2013, 17, 12–18. [Google Scholar] [CrossRef] [Green Version]
  19. Kurek, W.; Mika, M. Turystyka jako przedmiot badan naukowych. Turystyka 2007, 11–49. [Google Scholar]
  20. Costanza, R.; Fisher, B.; Ali, S.; Beer, C.; Bond, L.; Boumans, R.; Danigelis, N.L.; Dickinson, J.; Elliott, C.; Farley, J.; et al. Quality of life: An approach integrating opportunities, human needs, and subjective well-being. Ecol. Econ. 2007, 61, 267–276. [Google Scholar] [CrossRef]
  21. Kulczyk, S.; Woźniak, E.; Derek, M. Landscape, facilities and visitors: An integrated model of recreational ecosystem services. Ecosyst. Serv. 2018, 31, 491–501. [Google Scholar] [CrossRef]
  22. Boćkowski, M.; Rogowski, W. Wycena usług ekosystemowych oraz ich zastosowanie w rachunku ekonomicznym—Praktyczne przykłady w zarządzaniu zasobami przyrodniczymi (Valuation of Ecosystem Services and Their Application in Economic Calculation: Practical Examples of Managing Natural Resources). Studia I Pr. Kol. Zarządzania I Finans. 2018, 167, 37–64. [Google Scholar]
  23. Tyrväinen, L.; Pauleit, S.; Seeland, K.; de Vries, S. Benefits and Uses of Urban Forests and Trees. In Urban Forests and Trees—A Reference Book; Konijnendijk, C.C., Nilsson, K., Randrup, T.B., Schipperijn, J., Eds.; Springer: Berlin/Heidelberg, Germany, 2005; pp. 81–114. [Google Scholar]
  24. Nastran, M. Visiting the forest with kindergarten children: Forest suitability. Forests 2020, 11, 696. [Google Scholar] [CrossRef]
  25. Ordóñez, C.; Kendal, D.; Threlfall, C.G.; Hochuli, D.F.; Davern, M.; Fuller, R.A.; van der Ree, R.; Livesley, S.J. How Urban Forest Managers Evaluate Management and Governance Challenges in Their Decision-Making. Forests 2020, 11, 963. [Google Scholar] [CrossRef]
  26. PGL LP. Instrukcja Urządzania Lasu; Dyrekcja Generalna Lasów Państwowych: Warsaw, Poland, 2012. [Google Scholar]
  27. PGL LP. Zasady Hodowli Lasu; Dyrekcja Generalna Lasów Państwowych: Warsaw, Poland, 2012. [Google Scholar]
  28. Fors, H.; Molin, J.F.; Murphy, M.A.; van den Bosch, C.K. User participation in urban green spaces—For the people or the parks? Urban For. Urban Green. 2015, 14, 722–734. [Google Scholar] [CrossRef] [Green Version]
  29. Referowska-Chodak, E. Pressures and Threats to Nature Related to Human Activities in European Urban and Suburban Forests. Forests 2019, 10, 765. [Google Scholar] [CrossRef] [Green Version]
  30. Referowska-Chodak, E. The Organization of Nature Conservation in State-Owned Forests in Poland and Expectations of Polish Stakeholders. Forests 2020, 11, 796. [Google Scholar] [CrossRef]
  31. Zhao, Z.; Ren, J.; Wen, Y. Spatial perception of urban forests by citizens based on semantic differences and cognitive maps. Forests 2020, 11, 64. [Google Scholar] [CrossRef] [Green Version]
  32. Basu, S.; Nagendra, H. Perceptions of park visitors on access to urban parks and benefits of green spaces. Urban For. Urban Green. 2021, 57, 126959. [Google Scholar] [CrossRef]
  33. Fadhlin, M.H.N.; Matthew, N.K.; Shuib, A. Visitors’ willingness to pay for entrance fee at Puncak Janing Forest Eco-Park, Kedah, Malaysia. J. Trop. For. Sci. 2021, 33, 49–57. [Google Scholar] [CrossRef]
  34. Jaszczak, R. Las i gospodarka leśna w zasięgu oddziaływania miast w Polsce (Forest and forest economy within the range of influence of towns and cities in Poland). Studia I Mater. Cent. Edukac. Przyr.-Leśnej 2003, 10, 152–171. [Google Scholar]
  35. Uchwała Nr LXXXIII/2128/2014 Rady Miasta Stołecznego Warszawy Z Dnia 5 Czerwca 2014 R. Available online: https://www.google.com/url?sa=t&rct=j&q=&esrc=s&source=web&cd=&ved=2ahUKEwjz6dG29qPzAhXMiIsKHd65AgUQFnoECAkQAQ&url=http%3A%2F%2Fedziennik.mazowieckie.pl%2FWDU_W%2F2014%2F6143%2Fakt.pdf&usg=AOvVaw1wrpn5x51lrFypiyjrciHM (accessed on 29 September 2021).
  36. Ustawa Z Dnia 8 Marca 1990 R. O Samorządzie Gminnym (Act Dated 8 March 8 1990 on Municipal Self-Government). Available online: https://isap.sejm.gov.pl/isap.nsf/DocDetails.xsp?id=WDU19900160095Y (accessed on 29 September 2021).
  37. Ustawa Z Dnia 5 Czerwca 1998 R. O Samorządzie Powiatowym; (Act Dated 5 June 1998 on Poviat Self-Government). Available online: https://isap.sejm.gov.pl/isap.nsf/DocDetails.xsp?id=WDU19980910578 (accessed on 29 September 2021).
  38. Ustawa Z Dnia 15 Marca 2002 R. Ustroju Miasta Stołecznego WARSZAWY (Act of 15 March 2002 on the System of the Capital City of Warsaw. Available online: http://isap.sejm.gov.pl/isap.nsf/DocDetails.xsp?id=wdu20020410361 (accessed on 29 September 2021).
  39. Ustawa Z Dnia 27 Sierpnia 2009 R. O Finansach Publicznych (Act of 27 August 2009 on Public Finance). Available online: https://isap.sejm.gov.pl/isap.nsf/DocDetails.xsp?id=WDU20091571240 (accessed on 29 September 2021).
  40. Ustawa Z Dnia 28 Sierpnia 1991 R. O Lasach (The Act of 28 August 1991 on Forests). Available online: https://isap.sejm.gov.pl/isap.nsf/DocDetails.xsp?id=WDU19911010444 (accessed on 29 September 2021).
  41. Yamazaki, T.; Iida, A.; Hino, K.; Murayama, A.; Hiroi, U.; Terada, T.; Koizumi, H.; Yokohari, M. Use of Urban Green Spaces in the Context of Lifestyle Changes during the COVID-19 Pandemic in Tokyo. Sustainability 2021, 13, 9817. [Google Scholar] [CrossRef]
  42. Ugolini, F.; Massetti, L.; Calaza-Martínez, P.; Cariñanos, P.; Dobbs, C.; Ostoic, S.K.; Marin, A.M.; Pearlmutter, D.; Saaroni, H.; Šaulienė, I.; et al. Effects of the COVID-19 pandemic on the use and perceptions of urban green space: An international exploratory study. Urban For. Urban Green. 2020, 56, 126888. [Google Scholar] [CrossRef]
  43. Giergiczny, M.; Czajkowski, M.; Zylicz, T.; Angelstam, P. Choice experiment assessment of public preferences for forest structural attributes. Ecol. Econ. 2015, 119, 8–23. [Google Scholar] [CrossRef]
  44. Czajkowski, M.; Barczak, A.; Budziński, W.; Giergiczny, M.; Hanley, N. Preference and WTP stability for public forest management. For. Policy Econ. 2016, 71, 11–22. [Google Scholar] [CrossRef] [Green Version]
  45. Janeczko, E.; Wolnicka, M.; Tomusiak, R.; Dawidziuk, A.; Kargul-Plewa, D.; Janeczko, K. Preferencje spłeczne dotyczace rekreacji w lasach Mazowieckiego Parku Krajobrazowego w latach 2000 i 2012 (Social preferences regarding recreation in forests of the Mazowiecki Landscape Park in 2000 and 2012). Sylwan 2017, 161, 422–429. [Google Scholar] [CrossRef]
  46. Dudek, T. Needs of the local population related to development of forests for recreational purposes: Example of south-eastern Poland. J. For. Sci. 2016, 62, 35–40. [Google Scholar] [CrossRef] [Green Version]
  47. Referowska-Chodak, E. Management and Social Problems Linked to the Human Use of European Urban and Suburban Forests. Forests 2019, 10, 964. [Google Scholar] [CrossRef] [Green Version]
  48. Janeczko, E.; Woźnicka, M. Zagospodarowanie rekreacyjne lasów Warszawy w kontekście potrzeb i oczekiwań mieszkanców stolicy (Development of urban forest recreation of Warszaw in the context of the needs and expectations of the residents of the capital). Studia I Mater. Cent. Edukac. Przyr.-Leśnej 2009, 11, 131–139. [Google Scholar]
  49. Jankovska, I.; Straupe, I.; Brumelis, G.; Donis, J.; Kupfere, L. Urban forests of Riga, Latvia—Pressures, naturalness, attitudes and management. Balt. For. 2014, 20, 342–351. [Google Scholar]
  50. Jensen, F.S. Landscape managers’ and politicians’ perception of the forest and landscape preferences of the population. For. Landsc. Res. 1993, 1, 79–93. [Google Scholar]
  51. Kikulski, J. Model rekreacyjnego zagospodarowania lasów na terenach pojezierzy (Model of recreational development of forests in the lake districts). Studia I Mater. Cent. Edukac. Przyr.-Leśnej 2009, 4, 165–171. [Google Scholar]
  52. Eriksson, L.; Nordlund, A.M.; Olsson, O.; Westin, K. Recreation in Different Forest Settings: A Scene Preference Study. Forests 2012, 3, 923–943. [Google Scholar] [CrossRef]
  53. Gundersen, V.S.; Frivold, L.H. Public preferences for forest structures: A review of quantitative surveys from Finland, Norway and Sweden. Urban For. Urban Green. 2008, 7, 241–258. [Google Scholar] [CrossRef]
  54. Skłodowski, J.; Gołos, P. Wartość rekreacyjnej funkcji lasu w świetle wyników ogólnopolskiego badania opinii społecznej (Value of leisure−related function of forest in view of the results of nationwide survey in Poland). Sylwan 2016, 160, 759–766. [Google Scholar] [CrossRef]
  55. Bamwesigye, D.; Hlavackova, P.; Sujova, A.; Fialova, J.; Kupec, P. Willingness to pay for forest existence value and sustainability. Sustainability 2020, 12, 891. [Google Scholar] [CrossRef] [Green Version]
  56. Mandziuk, A.; Fornal-Pieniak, B.; Ollik, M. Wartości nierynkowe lasów miejskich w zależności od ich wyglądu—Studium przypadku miasta Tarnowa (Non−market values of urban forests depending on their appearance—A case study of Tarnów). Sylwan 2021, 165, 165–175. [Google Scholar] [CrossRef]
  57. Liu, W.Y.; Lin, Y.Z.; Hsieh, C.M. Assessing the ecological value of an urban forest park: A case study of sinhua forest park in taiwan. Forests 2021, 12, 806. [Google Scholar] [CrossRef]
  58. Bateman, I.J.; Diamand, E.; Langford, I.H.; Jones, A. Household willingness to pay and farmers’ willingness to accept compensation for establishing a recreational Woodland. J. Environ. Plan. Manag. 1996, 39, 21–43. [Google Scholar] [CrossRef]
  59. Dhakal, B.; Yao, R.T.; Turner, J.A.; Barnard, T. Recreational users’ willingness to pay and preferences for changes in planted forest features. For. Policy Econ. 2012, 17, 34–44. [Google Scholar] [CrossRef]
  60. Mizaras, S.; Kavaliauskas, M.; Cinga, G.; Mizaraite, D.; Belova, O. Ocioeconomics Aspects of Recreational Use of Forests in Lithuania. Balt. For. 2015, 21, 308–314. [Google Scholar]
  61. Nielsen, A.B.; Olsen, S.B.; Lundhede, T. An economic valuation of the recreational benefits associated with nature-based forest management practices. Landsc. Urban Plan. 2007, 80, 63–71. [Google Scholar] [CrossRef]
  62. Jim, C.Y.; Chen, W.Y. Recreation–amenity use and contingent valuation of urban greenspaces in Guangzhou, China. Landsc. Urban Plan. 2006, 75, 81–96. [Google Scholar] [CrossRef]
  63. Zydroń, A.; Szoszkiewicz, K.; Chwiałkowski, C. Valuing protected areas: Socioeconomic determinants of the willingness to pay for the National Park. Sustainability 2021, 13, 765. [Google Scholar] [CrossRef]
  64. Gołos, P.; Ukalska, J. Hipotetyczna gotowość fmansowania publicznych funkcji lasu i gospodarki leśnej (Hypothetical readiness for financing the most important public functions of forest and forest management). Sylwan 2016, 160, 597–608. [Google Scholar] [CrossRef]
  65. Yu, X.; Abler, D. Incorporating zero and missing responses into CVM with open-ended bidding: Willingness to pay for blue skies in Beijing. Environ. Dev. Econ. 2010, 15, 535–556. [Google Scholar] [CrossRef]
  66. Witt, B. Tourists’ Willingness to Pay Increased Entrance Fees at Mexican Protected Areas: A Multi-Site Contingent Valuation Study. Sustainability 2019, 11, 3041. [Google Scholar] [CrossRef] [Green Version]
  67. Zaiton, S.; Huda-Farhana, M.; Hasan-Basri, B. Conservation of mangroves in Kuala Perlis, Malaysia—A case study of socio-economic attributes of fishermen driving valuation in sustaining livelihoods through forest management. J. Trop. For. Sci. 2019, 31, 433–442. [Google Scholar] [CrossRef]
  68. Paletto, A.; Guerrini, S.; De Meo, I. Exploring visitors’ perceptions of silvicultural treatments to increase the destination attractiveness of peri-urban forests: A case study in Tuscany Region (Italy). Urban For. Urban Green. 2017, 27, 314–323. [Google Scholar] [CrossRef]
  69. Bartczak, A. The role of social and environmental attitudes in non-market valuation. For. Policy Econ. 2015, 50, 357–365. [Google Scholar] [CrossRef]
  70. Lindemann-Matthies, P.; Keller, D.; Li, X.; Schmid, B. Attitudes toward forest diversity and forest ecosystem services—A cross-cultural comparison between China and Switzerland. J. Plant Ecol. 2014, 7, 1–9. [Google Scholar] [CrossRef] [Green Version]
  71. Czajkowski, M.; Bartczak, A.; Giergiczny, M.; Navrud, S.; Żylicz, T. Providing preference-based support for forest ecosystem service management. For. Policy Econ. 2014, 39, 1–12. [Google Scholar] [CrossRef]
  72. Czajkowski, M.; Budziński, W.; Campbell, D.; Giergiczny, M.; Hanley, N. Spatial Heterogeneity of Willingness to Pay for Forest Management. Environ. Resour. Econ. 2017, 68, 705–727. [Google Scholar] [CrossRef] [Green Version]
  73. Saraj, B.S.; Yachkaschi, A.; Oladi, J.; Teimouri, S.F.; Latifi, H. The recreational valuation of a natural forest park using travel cost method in Iran. IForest 2009, 2, 85–92. [Google Scholar] [CrossRef]
  74. Baciu, G.E.; Dobrotă, C.E.; Apostol, E.N. Valuing forest ecosystem services. Why is an integrative approach needed? Forests 2021, 12, 677. [Google Scholar] [CrossRef]
  75. Costanza, R.; d’Arge, R.; de Groot, R.; Farberll, F.; Grassot, M.; Hannon, B.; Limburg, K.; Naeem, S.; O’Neil, R.V.; Paruelo, J.; et al. The value of the world’s ecosystem services and natural capital Robert Costa. Nature 1997, 387, 253–260. [Google Scholar] [CrossRef]
  76. Bjerke, T.; And, C.T.; Kleiven, J. Outdoor recreation interests and environmental attitudes in Norway. Manag. Leis. 2006, 11, 116–128. [Google Scholar] [CrossRef]
  77. Tyrväinen, L.; Silvennoinen, H.; Kolehmainen, O. Ecological and aesthetic values in urban forest management. Urban For. Urban Green. 2003, 1, 135–149. [Google Scholar] [CrossRef]
  78. Edwards, D.; Jay, M.; Jensen, F.S.; Lucas, B.; Marzano, M.; Montagné, C.; Peace, A.; Weiss, G. Public preferences for structural attributes of forests: Towards a pan-European perspective. For. Policy Econ. 2012, 19, 12–19. [Google Scholar] [CrossRef]
  79. Vasiljević, N.; Radić, B.; Gavrilović, S.; Šljukić, B.; Medarević, M.; Ristić, R. The concept of green infrastructure and urban landscape planning: A challenge for urban forestry planning in Belgrade, Serbia. IForest 2018, 11, 491–498. [Google Scholar] [CrossRef]
Figure 1. Localization of Warsaw in Poland (a) and urban forests (green color) located in four obwody leśne in Warsaw (b): (A—Bielany-Młociny (orange color); B—Bemowo-Koło (yellow color), C—Kabaty (purple color); D—Las Sobieskiego (brown color)).
Forests 12 01524 g001
Figure 2. Four types of Warsaw municipal forests (WMF): (a) natural forest, no landscaping, similar to a strict nature reserve; (b) forest with designated footpaths, picking mushrooms and berries allowed; (c) forest with extensive tourism infrastructure, leisure meadows, designated barbecue areas, educational routes with information boards; (d) park-like forest, with numerous benches and other small architecture.
Forests 12 01524 g002aForests 12 01524 g002b
Figure 3. Relation between forest development level and its preference level.
Forests 12 01524 g003
Figure 4. Correlation between forest development level and WTP for it.
Forests 12 01524 g004
Table 1. Values of the dependent variable Y for each forest type.
Forest TypeABCD
Y = (0)16530810352
Table 2. Socio-demographic structure of the research group accounting for selected characteristics.
Gender (%)
FemaleMale
50.1349.87
Education (%)
SecondaryHigher
89.6710.33
Place of residence (%)
Rural areasTowns up to 50,000 residentsTowns 50,000–100,000 residentsCities over 100,000 residents
29.8517.604.8547.70
Per capita income (%)
Under PLN 2000
(1)
PLN 2001–3333
(2)
Over PLN 3334
(3)
42.4731.5126.02
Table 3. Relation between forest development level and its preference level.
Forest AForest BForest CForest DFriedman ANOVA χ2
PREF 13.313.333.653.74273.15 *
PREF 23.513.304.124.27748.38 *
PREF 33.964.004.474.63645.00 *
* means that the p-value < 0.05.
Table 4. Correlation between forest development and preference levels (U Mann–Whitney test for pairs of forest types).
PREF 1PREF 2PREF 3
BCDBCDBCD
A−0.49−9.07 *−11.89 *4.96 *−12.44 *−15.66 *−0.92−12.87 *−16.56 *
B −8.78 *−11.70 * −17.21 *−20.14 * −11.89 *−15.46 *
C −3.01 * −3.55 * −2.52 *
* means that p-value < 0.05.
Table 5. Correlation between forest development level and WTP for it.
Forest AForest BForest CForest DANOVA Friedman Test χ2
FIN 13.963.613.964.15249.60 *
FIN 23.993.744.214.39249.58 *
FIN 33.953.924.534.70893.66 *
* means that p-value < 0.05.
Table 6. Correlations between forest development levels and willingness to finance them (U Mann–Whitney test for pairs of forests).
FIN 1FIN 2FIN 3
BCDBCDBCD
A9.11 *0.66−4.27 *4.68 *−2.51 *−5.98 *0.91−16.24 *−21.23 *
B −9.51 *−14.43 * −8.70 *−11.94 * −16.58 *−21.29 *
C −5.48 * −4.12 * −6.44 *
* means that p-value < 0.05.
Table 7. Preference for each forest type in relation to respondents’ income.
Income Per Capita GroupsU Mann–Whitney Test
Variable1 (333)2 (247)3 (204)1 vs. 22 vs. 31 vs. 3
Forest A
PREF 13.413.462.98−1.056.52 *6.16 *
PREF 23.573.553.370.352.04 *2.53 *
PREF 34.013.983.860.481.732.16 *
Forest B
PREF 13.393.493.05−1.946.09 *4.84 *
PREF 23.353.353.15−0.112.68 *2.82 *
PREF 34.033.983.960.700.371.06
Forest C
PREF 13.673.613.661.46−0.171.07
PREF 24.044.134.25−1.42−1.88−3.17 *
PREF 34.444.494.53−1.00−0.40−1.42
Forest D
PREF 13.673.703.88−0.17−2.63 *−3.12 *
PREF 24.244.274.32−0.38−0.90−1.24
PREF 34.584.664.66−1.380.22−1.09
* means that p-value < 0.05.
Table 8. WTP for a specific forest type in relation to the respondents’ income.
Income Per Capita GroupsU Mann–Whitney Test
Variable1 (333)2 (247)3 (204)1 do 22 do 31 do 3
Forest A
FIN 14.083.893.843.03 *−0.412.26 *
FIN 23.903.973.99−1.43−0.14−1.48
FIN 34.113.933.871.480.802.44 *
Forest B
FIN 13.633.533.652.15 *−1.96 *−0.10
FIN 23.833.653.712.01 *−0.671.40
FIN 33.873.943.96−1.19−0.51−1.71
Forest C
FIN 13.914.003.98−1.650.40−1.17
FIN 24.194.234.20−0.420.380.00
FIN 34.574.554.440.512.17 *2.80 *
Forest D
FIN 14.164.184.10−0.801.270.66
FIN 24.354.394.45−0.53−1.47−1.96
FIN 34.694.704.730.08−0.010.06
* means that p-value < 0.05.
Table 9. Values of estimated variables in the logistic regression model.
VariableFactorProbability QuotientStandard Errort-Stat.
Forest A
PREF 1
PREF 2
PREF 3−1.350.260.15−9.19 *
CONSTANT3.75 0.547.00 *
Forest B
PREF 10.351.410.142.55 *
PREF 20.742.090.135.77 *
PREF 3−2.040.130.15−13.90 *
CONSTANT4.02 0.745.43 *
Forest C
PREF 1
PREF 2−0.960.380.19−4.99 *
PREF 3−1.340.260.18−7.38 *
CONSTANT7.22 0.779.38 *
Forest D
PREF 1
PREF 2−0.480.620.19−2.57 *
PREF 3−1.210.300.24−4.98 *
CONSTANT4.68 1.074.37 *
* means that p-value < 0.05.
Table 10. Assessment of model prediction and adjustment to the data.
Forest TypeCase Classification Accuracy
(Model Prediction Assessment)
χ2 Statistic
(Model Zdjustment to Data Assessment)
A78.32%103.70 *
B80.48%287.42 *
C84.69%185.68 *
D99.9%44.217 *
* means that p-value < 0.05.
Publisher’s Note: MDPI stays neutral with regard to jurisdictional claims in published maps and institutional affiliations.

