Abstract
Pioneer trees play a key role in the recovery of a reclaimed ecosystem that is nutrient-deficient in the initial stage of reclamation. Clarifying the growth of pioneer trees and their response to intra- or interspecific competition is of great importance to help stewards manage reclaimed forest. Nevertheless, such documents are lacking. We utilized forestry inventory data from a R. pseudoacacia and P. tabuliformis mixed forest plot with an area of 8000 m2 to find out the effect of trees interaction on their growth (indicated by the amount of biomass carbon per stem) in a nutrient-lacking reclaimed ecosystem 17 years after reclamation in Pingshuo opencast coal mine, Shanxi Province, China. In total, 2133 tree individuals were measured and tagged; the kriging interpolation method was applied to map spatial variation of forest-biomass carbon (C). Univariate and bivariate mark correlation functions were employed to examine the effect of intra- and interspecific interactions on tree’s biomass C accumulation. The results showed that tree biomass C was 27.84 Mg ha−1 in the forest. C class structure of planted R. pseudoacacia followed inversed J-shaped distribution and seeded-in R. pseudoacacia and Ulmus pumila (a spontaneous species) had L-shaped distribution. P. tabuliformis, however, followed a nearly normal distribution. Patchy distribution was observed with regard to C spatial arrangement of all tree species. In terms of the intraspecific correlation of biomass C, no significant competitive or facilitative interactions (GoF p ≥ 0.05) was observed among conspecific trees of seeded-in R. pseudoacacia and P. tabuliformis. In contrast, significant negative interactions (GoF p < 0.05) or repulsion correlations between biomass C of planted R. pseudoacacia individuals and U. pumila individuals were found at the scale of 1–2 and 0–8.5 m, respectively. In term of the interspecfic spatial correlation of biomass C, a significant positive interaction between the heterospecific individuals of planted R. pseudoacacia and seeded-in R. pseudoacacia was observed at the scale of 2.5–4 and 12.5–15 m. Similarly, seeded-in R. pseudoacacia and U. pumila were found to be attracted by P. tabuliformis at 7–9 and 0–2 m, respectively. Conversely, significant departure effect was observed at the scale of 1–3 m between the biomass C of U. pumila and planted R. pseudoacacia and 4.5–5.5 m between the biomass C of U. pumila and seeded-in R. pseudoacacia. Consequently, R. pseudoacacia and P. tabuliformis could coexist for a long term and P. tabuliformis was a species that facilitated the accumulation of C of other tree species. Overall, complex intra- and interspecific interactions in nutrient-limit reclamation ecosystem affected biomass C accumulation. R. pseudoacacia–P. tabuliformis mixed forest could be an efficient reclamation pattern to restore biomass C in the Loess Plateau area.
1. Introduction
Surface mining, the one of the common techniques used for coal mining, often causes great degradation to our terrestrial ecosystem [1]. In the process of mining, overburden and soil are removed by excavation, geological structures and topography are substantially changed and surface and subsurface hydrologic regime are disrupted [2]. In particular, forest is thoroughly destroyed with some forest biomass harvested and most bulldozed in piles and burned [3]. Consequently, carbon (C) sequestrated in forest biomass is released, which increases the CO2 emission and changes mines’ climate. Fortunately, drastically perturbed C sink in mined land could be improved with the choice of effective reclamation techniques and post-reclamation management practices [4].
Generally, the dominant landscape of reclaimed mine land is immense spoils or dumps. These dumps are covered by waste rocks and adverse soils which could be referred to as reclaimed mined soils (RMSs) [5]. The RMSs get high-compacted due to repeated movement of heavy equipment used to haul, replace and grade the topsoil materials [2,6]. The portion of rock fragments of RMSs often exceeds 65% and the bulk density (BD) could be up to 1.82 Mg m−3 [2]. Because of the high portion of rock fragments and high BD, RMSs have low pore space resulting in poor aeration, restricted root exploration, decreased water infiltration and retention [7]. In addition, mining and reclamation activities also lead to the drastic depletion of nutrient in RMSs, for example, >70% of soil organic carbon and >65% of nitrogen is lost [8,9]. Along with the loss of soil nutrient, other soil physicochemical properties such as pH and electrical conductivity are inevitably changed [10]. In a word, dumps are nutrient-deficient and thus difficult for vegetation to survive.
The natural succession in such nutrient-lacking spoils requires a long time and reforestation could be an efficient solution [11,12]. The reclaimed dumps are frequently regarded as “empty cups” with the capacity to sequester and restore tremendous amount of CO2 into woods as forest develops from young towards mature [3]. Yuan et al. found that 12.17%–25.66% of ecosystem C was stored in tree biomass 17-year after reclamation in Pingshuo opencast coal mine [13]. Similarly, Shrestha and Lal suggested that biomass C accounted for 6% of reclaimed ecosystem C in the initial period of reclamation (<1 year) and the proportion increased to 66% during the later stage (>14 year) in Northeast Ohio mines [14].
Despite reclaimed forest has immense potential to sequestrate C, the biologic progress is still uncertain. Pioneer tree species plays a key role in the recovery of tree biomass C, for example, pine stands sequestered the highest amount of biomass C in the Midwestern and Appalachian coalfields, followed by hardwood and mixed stands [3]. Except for the pioneer tree or reclamation pattern, other factors also affected the accumulation of C, such as harvesting, fire and climate change [15,16,17,18], among which, competition for resources (e.g., nutrient, light) could be another important indicator [19,20,21,22,23]. It was deduced that the competition among trees was more fiercely in nutrient-lacking reclaimed dumps, because soil nutrient played an important role in tree’s development and nutrient-depletion soil exacerbated the scarcity of resource [24,25].
To reveal the biologic process of the forest C accumulation in nutrient-lacking reclaimed dumps, we utilized forestry inventory data from a R. pseudoacacia and P. tabuliformis mixed forest plot with an area of 8000 m2 in Pingshuo opencast coal mine, Shanxi Province, China. Actually, R. pseudoacacia and P. tabuliformis mixed forest is the most efficient pattern to sequestrate C in post-mining spoils in the Loess Plateau area, China [26]. We wanted to answer the following questions: (1) What was the biomass C class structure of pioneer tree species in the plot? (2) Did biomass C distribute uniformly or aggregated? (3) Did Intra- and interspecific interactions affect the sequestration of pioneer tree species’ biomass C?
2. Materials and Methods
2.1. Study Area
The Pingshuo mine (112°10′–113°30′E, 39°23′–39°37′N) is located in the north of Shanxi Province, east of the Loess Plateau, China. It is one of the largest opencast coal mine in China with an area of 376,000 ha and an average production of 80 Mt coal per year. The climate is semiarid continental monsoon. The total annual precipitation averages 428.2–449.0 mm and the average annual potential evapotranspiration is 1786.6–2598.0 mm. The annual mean temperature is 6.2 °C. Ecology ecosystem here is fragile and the dominant landscape is grassland [7].
In coal mining process in Pingshuo mine, the overburden, covered on the coal seams, is stripped, transported and piled to build large-scale dumps. Thus, these dumps are of ladder terrain with relative height about 100–150 m and step height ranges from 20 to 40 m [12]. The reclamation of the dumps was initiated in the year 1988 and the spoils were revegetated with trees or crops. The dominant tree species were R. pseudoacacia, U. pumila, Ailanthus altissima, P. tabuliformis and Populus simonii. Due to the severe disturbance, the dump was identified with poor nutrient. The bulk density (BD) was ~1.8 Mg m−3, soil organic matter (SOM) was 1.1 mg kg−1, total nitrogen (TN) was 1.1 mg kg−1, total phosphorus (TP) was 0.4 mg kg−1 and total potassium (TK) was 5.8 mg kg−1. In addition, the soil microorganism community was also wrecked. The number of soil bacteria, fungi and actinomycetes was 0.45 × 10⁷, 4.0 × 10² and 0 per gram soil, respectively [7].
2.2. Plot Introduction and Vegetation Survey Method
The R. pseudoacacia and P. tabuliformis mixed plot is 8000 m2 and it was revegetated in the year 1993. The plot was characterized by slope with the elevation ranged from 1420 m to 1455 m (Figure 1). In the initial stage of reclamation, the seedlings of R. pseudoacacia were about 30 cm height at the age of 1 year and that of P. tabuliformis were 100 cm height at the age of 5 years. All the seedlings were planted by line spacing of 1 m. R. pseudoacacia were planted with interval of 1.5 m and P. tabuliformis of 5 m. Every three rows of R. pseudoacacia were interplanted by one row of P. tabuliformis. The total seedling density was about 6400 plants ha−1, among which the density of R. pseudoacacia was approximately 6000 plants ha−1 and that of P. tabuliformis was 400 plants ha−1. In particular, 224 R. pseudoacacia stems were cut in the year 2007 (14 years after reclamation) due to fierce competition [12].
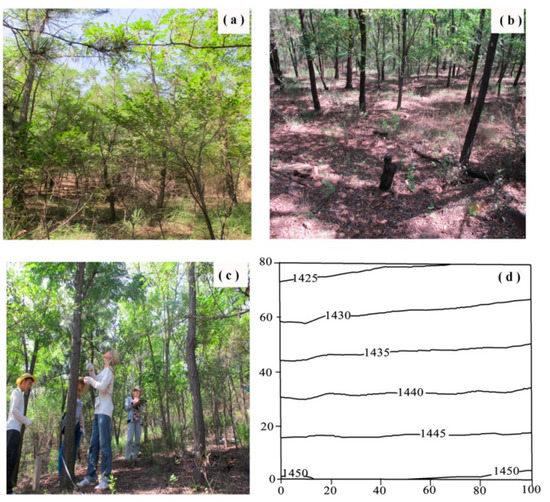
Figure 1.
(a–c) Photos and (d) topography of the plot in Pinshuo opencast coal mine, China. Axis scale is in meters. The black lines in (d) was the contours (marked with elevation values, m ASL).
The plot was divided into 80 subplots by an electronic total station (NTS-350R, South Surveying Group, China). Each subplot was 10 × 10 m and the four corners of each subplot were marked permanently by cement piles. Each subplot was subsequently divided into four 5 × 5 m quadrats using the interpolation method. All free-standing trees greater than 1 cm in diameter were tagged, mapped with their geographic coordinates recorded in a clockwise order following a standard field protocol [27,28] in August 2010 (the distribution of each species is shown in Figure 2). For individuals with heights less than 1.3 m, the basal diameters were measured without tagging. When the malformation of a trunk occurred at 1.3 m, diameter was measured at 1.2 m or 1.4 m.
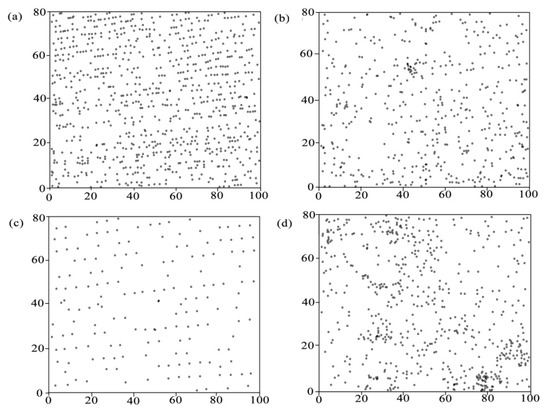
Figure 2.
Distribution of each tree species in an 8000-m2 reclaimed plot after 17-year succession in Pingshuo opencast mine, China, (a) planted R. pseudoacacia, (b) seeded-in R. pseudoacacia, (c) P. tabuliformis, (d) U. pumila. Axis scale is in meters.
Large trees are of great importance to forest ecosystem’s structure, function and dynamics [29], and they disproportionately possess much of the forest biomass C, despite their small proportion of total abundance in a forest [30]. Thus, we distinguished planted and seeded-in trees in the study. According to our long-term survey, R. pseudoacacia stems with diameter ≥ 7 cm were mainly planted at the initial phase of reclamation (which were named planted R. pseudoacacia) and individuals with diameter < 7 cm were regenerated after reclamation (which were named seeded-in R. pseudoacacia) [31]. P. tabuliformis trees with diameter ≥ 3 cm were observed planted originally. Considering the number of seeded-in P. tabuliformis tree was negligible (15 plants, accounting for 8.77% of the total number of P. tabuliformis), we did not distinguish planted or seeded-in trees among P. tabuliformis species. U. pumila was an alien tree species that invaded our plot after reclamation and we did not distinguish planted or seeded-in trees as well.
2.3. Calculation of Trees Biomass C
Biomass C of each tree species was calculated by multiplying tree’s biomass value with C content coefficients in biomass. In this study, a C content coefficient of 0.5 was employed [32]. Tree biomass was calculated by allometric equations from [33] (for R. pseudoacacia), [34] (for P. tabuliformis) and [35] (for U. pumila) (Table 1).

Table 1.
Allometric equations for R. pseudoacacia, P. tabuliformis and U. pumila in Pingshuo opencast coal mine, China.
2.4. Spatial Arrangement of Biomass C
Spatial variability of tree biomass C was detected by geostatistical methods. The geostatistics are based on the theory of a regionalized variable, distributing in space and showing spatial autocorrelation so that samples close together in space are more alike than those are apart [36]. The geostatistical methods consist of two parts: one is the calculation of an experimental variogram from the data and model fitting and the other is a prediction at unsampled locations [37].
The semivariogram of tree biomass C was constructed using the following formula:
where, is the semivariance for the lag interval and is the number of pairs separated by a distance . and are C at locations and . Based on the minimization of the sum of the squared deviations between the experimental and theoretical semivariograms, linear model and exponential model were selected to further investigate the C spatial structure. The spatial distribution of the C could be calculated through spatial interpolation based on the fitted model mentioned above. In this paper, kriging was employed as the spatial interpolation method because kriging was regarded as the best linear unbiased estimator.
Spatial distribution of C was determined by using ordinary kriging with the best fitted semivariogram model. Before this, data that were not subject to normal distribution were logarithmic transformed to meet the requirement of application of semivariogram [38].
2.5. The Effect of Intra- and Interspecific Interaction on Tree Biomass C Accumulation
The effects of intra- and interspecific interaction on biomass C accumulation were calculated by mark correlation function kmm(r) using C as the mark. The mark correlation function could detect the interaction (e.g., competition) between the objects or the influence of external factors (covariates) which result in spatial correlations using marked point pattern data. In kmm(r), the similarity between the quantitative marks of two points (the sizes of pine and beech in here) that are located at distance r from one another is identified by the test function , where and are the marks (biomass C) of two neighboring trees of a pattern, i.e., univariate mark correlation function kmm(r) and the sizes of trees of two patterns, i.e., bivariate mark correlation function km1m2(r) and the test function computes the mark product of pair of trees located at distance r from one another. In the case of quantitative marks (i.e., biomass C), random labeling is considered as the null model of mark correlation function kmm(r), which independently assigns the marks to the locations of trees The marked point pattern data offer information on properties of the objects, e.g., size, status or type [39].
where, is the intersection area of corresponding windows of and which are typical points of the point pattern in the study plot and is Epanechnikov kernel function. We followed the instructions suggested by [40] for further details. The univariate and bivariate mark correlation functions were computed in Programita grid-based software [40]. The analyses were performed up to 20 m with 1 m lag distance. In mark correlation function, detection of spatial patterns that differed significantly from complete spatial randomness expectation required the construction of envelopes based on Poisson null model simulations. For descriptive analyses, envelopes were calculated based on the fifth highest and lowest of 199 Monte Carlo complete spatial randomness simulations, corresponding to a goodness-of-fit (GoF) test with [41]. If kmm(r) was above the envelop curve, the marks (C) were positively correlated, if kmm(r) was down the envelop curve, the C were negatively correlated, otherwise, the C were independent.
3. Results
3.1. Tree Biomass C and its Class Structures
Totally 2133 tree individuals were measured to calculate biomass C within our forest and a total of 22.27 Mg C was found by the summed C of all individual trees, which indicated the trees’ C density was 27.84 Mg C ha−1 in our plot (Table 2).
Table 2.
Basic information of tree number, diameter and C for each tree species in Pingshuo opencast coal mine, China.
Figure presented herein shows the structures of biomass C class (Figure 3). The C class structure of planted R. pseudoacacia showed inverted J-shaped distribution and the number of individuals with 7.5–30 kg C accounted for 77.04% of the total R. pseudoacacia stems. Similarly, the structure of seeded-in R. pseudoacacia showed L-shaped distribution. Individuals with 0–1.5 kg C accounted for 67.63% of the total number of seeded-in R. pseudoacacia stems. The C class structure of P. tabuliformis, however, followed a nearly normal (or Gaussian) distribution (p = 0.27) with a peak at 5.0–12.5 kg C classes. Furthermore, U. pumila Cs class structure also followed L-shaped distribution with the most trees (91.09% of the total U. pumila) storing 0–0.4 kg C.
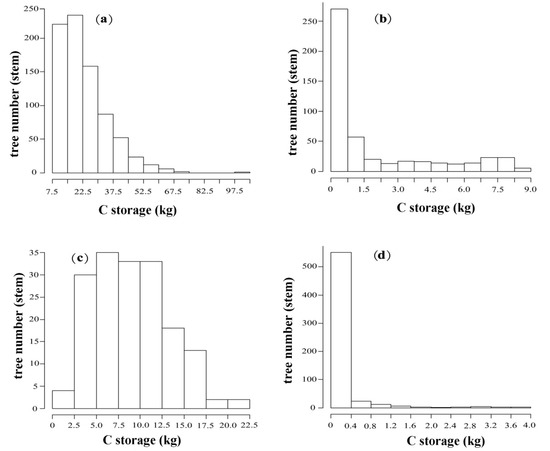
Figure 3.
Histograms of biomass C class for each tree species in Pingshuo opencast coal mine, China. (a) Planted R. pseudoacacia; (b) Seeded-in R. pseudoacacia; (c) P. tabuliformis; (d) U. pumila.
3.2. The Spatial Arrangement of Tree Biomass C
The semivariogram models and best-fit model parameters of all tree species are provided in Table 3. Liner model was used for planted R. pseudoacacia and exponential models for seeded-in R. pseudoacacia, P. tabuliformis and U. pumila to calculate the optimum weight in kriging analysis.
Table 3.
Best fitted semivariogram model and the corresponding parameters for each tree species in Pingshuo opencast coal mine, China.
Maps of tree biomass C generated from the field data are provided in Figure 4. Generally, C of all species showed patchy distribution. High C values of R. pseudoacacia (both planted and seeded-in) and P. tabuliformis scattered within the plot. Comparatively, U. pumila had fewer high C values (C ≥ 0.97 kg per plant), moreover, the high values concentrated in the southwest and center part.
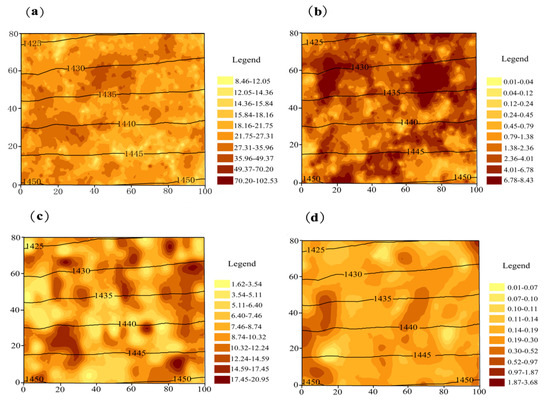
Figure 4.
Spatial distribution of biomass C (kg per plant) in Pinshuo opencast coal mine, China. Black lines denote contours marked with elevation values (m ASL). Axis scale is in meters. (a) Planted R. pseudoacacia; (b) seeded-in R. pseudoacacia; (c) P. tabuliformis; (d) U. pumila.
3.3. Intraspecific Interactions of Tree Biomass C
The univariate mark correlation function was employed to explore the spatial pattern of biomass C of pioneer trees that located at distance r away from conspecific neighbors (Figure 5). The observed the kmm(r) curves of seeded-in R. pseudoacacia and P. tabuliformis were completely inside the simulation envelopes at all scales (Figure 5b,c), which indicated biomass C of two nearby trees tended to be similar to two trees taken at random, thus no significant competitive or facilitative interactions (GoF p ≥ 0.05) were observed among conspecific trees to influence the correlation between tree biomass C. In contrast, a significant negative interaction (GoF p < 0.05) between biomass C of planted R. pseudoacacia at the scale of 1–2 m, being independent at 0–1 and 2–20 m (Figure 5a). Similarly, the repulsion correlation of biomass C between different cohorts of U. pumila was found at 0–8.5-m scale and being independent at large scale (8.5–20 m) (Figure 5d).
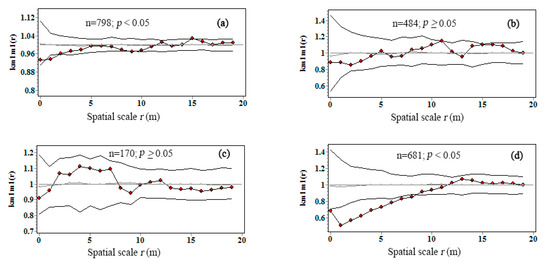
Figure 5.
Univariate mark correlation function kmm(r) for intraspecific interaction on C accumulation in Pinshuo opencast coal mine, China. Straight gray line indicated the theoretical kmm(r); black line with red dots indicated the observed the kmm(r); polygonal black line without red dots indicated the 95% simulation envelops. (a) Planted R. pseudoacacia; (b) seeded-in R. pseudoacacia; (c) P. tabuliformis; (d) U. pumila.
3.4. Interspecific Correlations of Tree Biomass C
The null model of km1 m2(r) revealed the spatial dependence of the biomass C of their heterospecific neighbors. A significant positive interaction (GoF p < 0.05) between the biomass C from the heterospecific individuals of planted R. pseudoacacia and seeded-in R. pseudoacacia were found by the bivariate mark correlation function at the scales of 2.5–4 and 12.5–15 m, being independent at other scales (Figure 6a). Similarly, seeded-in R. pseudoacacia and U. pumila were found to be attractive to P. tabuliformis at 7–9-m and 0–2-m scale (Figure 6e,f), respectively, which indicated that seeded-in R. pseudoacacia and U. pumila that had P. tabuliformis neighbor within 7–9-m and 0–2-m scale accumulated more C than expected.
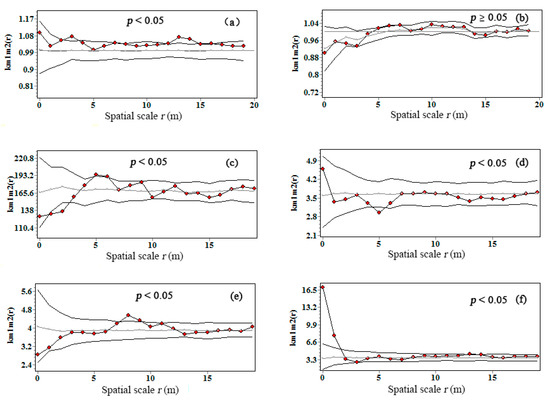
Figure 6.
Bivariate mark correlation function km1 m2(r) for interspecific interaction on C accumulation in Pinshuo opencast coal mine, China. Gray line indicated the theoretical kmm(r); black line with red dots indicated the observed the kmm(r); black line without red dots indicated the 95% simulation envelops. (a) Planted R. pseudoacacia vs. seeded-in R. pseudoacacia; (b) planted R. pseudoacacia vs. P. tabuliformis; (c) planted R. pseudoacacia vs. U. pumila; (d) seeded-in R. pseudoacacia vs. U. pumila; (e) seeded-in R. pseudoacacia vs. P. tabuliformis; (f) P. tabuliformis vs. U. pumila.
Conversely, significant departure effect (GoF p < 0.05) was observed at the scales of 1–3 m between the biomass C of U. pumila and planted R. pseudoacacia and 4.5–5.5 m between the biomass C of U. pumila and seeded-in R. pseudoacacia (Figure 6c,d), which indicated that U. pumila that had R. pseudoacacia neighbor within 1–3- and 4.5–5.5-m scale accumulated less C than expected.
The km1 m2(r) exhibited no significant departure or facilitation (GoF p ≥ 0.05) from random labeling null model between the biomass C of planted R. pseudoacacia and P. tabuliformis at all scale (Figure 6b), which can be referred to no spatial correlation between the two pioneer tree species with regard to biomass C correlation.
4. Discussion
4.1. The Development of Forest Biomass C and RMSs
In reclaimed spoil, the pioneer tree species was carefully selected. More attention was paid to tree’s barren-tolerance and nutrient-fixing abilities rather than tree’s light and temperature preference when determining the tree species in spoils, because cultivating the degraded RMSs topped the priority of reclamation. In Pingshuo mine, the R. pseudoacacia and P. tabuliformis mixed forest is proved to be the most effective reclamation pattern due to their excellent barren-tolerance and nutrient-fixed abilities. The estimation of the C density in R. pseudoacacia and P. tabuliformis mixed forest (27.84 Mg C ha−1) was higher than that in R. pseudoacacia–U. pumila–Ailanthus altissima mixed forest (19.49 Mg C ha−1) and R. pseudoacacia monoculture forest (18.26 Mg C ha−1) in Pinshuo dumps. Additionally, it was compared favorably with the average value of 28.21 Mg C ha−1 of nation-wide artificial forests, China [42]. R. pseudoacacia–P. tabuliformis mixed forest also significantly catalyzed the improvement of soil physicochemical properties 17 years after reclamation. For example, the soil BD decreased from 1.8 Mg m−3 to 1.4 Mg m−3 and SOM increased from 1.1 g kg−1 to 71.7 g kg−1 [7]. Moreover, soil microbial community was ameliorated as observed by [10]. Actually, this could be due to the strong N-fixing ability of R. pseudoacacia and P. tabuliformis.
4.2. The Effect of Intra- and Interspecific Interaction on Biomass C Accumulation
Recently, the relationship between trees’ spatial pattern and biomass was discussed [43,44,45]. Some authors agreed that trees’ spatial arrangement was dictated by tree individual’s regeneration and mortality, while tree biomass was determined by the acquisition of the energy and nutrient, thus they believed there was no relationship between trees’ spatial pattern and biomass [46]. Nevertheless, some studies documented that tree’s aggregated spatial arrangement inhibited their growth due to the inter or intraspecific competition [47,48]. In reclaimed forest in opencast spoil, pioneer seedlings are regularly planted at particular intervals. With several years’ succession, the community structure changed with the mortality or regeneration of pioneer tree species and the invasion of exotic species.
In our forest, R. pseudoacacia and P. tabuliformis were originally planted uniformly and both still showed regular distribution after 17 years of reclamation (Figure 2). However, C spatial arrangement of planted R. pseudoacacia and P. tabuliformis scattered with several high values, which indicated that the spatial pattern of C was not in accordance with the spatial arrangement of trees’ location. This was in agreement with the results of other authors [24,48,49]. The finding also testified that forest spatial arrangement is determined by trees’ regeneration and mortality, while the tree C is dictated by the process of energy inflow and nutrient acquisition [47,50]. Seeds of R. pseudoacacia were pods with hard shells and not easy to spread and bourgeon which resulted in the patchy distribution of seeded-in R. pseudoacacia C [31]. U. pumila, an alien species, was shaded by R. pseudoacacia and P. tabuliformis and it survived where resource was available. Thus, higher C values of U. pumila intensively distributed in the southwest and center part of the plot and gap-phase dynamics could be the major process for U. pumila.
In this study, mark correlation function was introduced to detect the effect of competition on tree biomass C accumulation and some interesting results were proposed: in terms of the intraspecific correlation of biomass C, no significant competitive or facilitative interactions were observed among conspecific trees of seeded-in R. pseudoacacia and P. tabuliformis. In contrast, a significant negative interactions or repulsion correlations between conspecific trees of planted R. pseudoacacia and U. pumila were found at certain scales. In term of the interspecific spatial correlation of biomass C, a significantly positive interaction between the biomass C from the heterospecific individuals of planted R. pseudoacacia vs. seeded-in R. pseudoacacia, P. tabuliformis vs. seeded-in R. pseudoacacia and P. tabuliformis vs. U. pumila were found. In contrast, significant departure effects were observed between the biomass C of U. pumila vs. planted R. pseudoacacia and U. pumila vs. seeded-in R. pseudoacacia.
The constraint role that intra- and interspecific correlation played in tree biomass Cs recovery was also demonstrated by our long-term observation. Despite 249 R. pseudoacacia individuals were manually thinned 14 year after reclamation, 68 stems of planted R. pseudoacacia were found dead 17 years after reclamation, whereas P. tabuliformis was not thinned during the 17 years and only three stems of were observed dead [51]. U. pumila was found competing against each other at all scales, thus U. pumila had gap-phase dynamic and fierce competition within conspecific trees. It was deduced that there were few niches for alien invasive species to survive in nutrient-poor soils. Just as confirmed by the spatial pattern of C of seeded-in R. pseudoacacia, the planted R. pseudoacacia facilitated the growth of seeded-in R. pseudoacacia, which could be due to seeds of R. pseudoacacia were pods with hard shells and not easy to spread and bourgeon. P. tabuliformis, however, had positive correlation with seeded-in R. pseudoacacia and U. pumila, indicating it was brilliant species to promote the succession of reclaimed ecosystem. Nevertheless, the departures between seeded-in R. pseudoacacia and U. pumila could be due to the light preference of the both species. Despite after several years’ succession, no departure effects between planted R. pseudoacacia and P. tabuliformis were found, which indicated that R. pseudoacacia and P. tabuliformis could be selected as the compatible pioneer trees in the Loess Plateau.
Generally, inter- and intra-specific interaction provided a perspective to observe the ecological process of C accumulation and explained, to some extent, why R. pseudoacacia–P. tabuliformis mixed forest was the most efficient pattern to sequestrate C in post-mining spoils in the Loess Plateau area. Just as mentioned above, the pioneer tree species of R. pseudoacacia and P. tabuliformis could coexist for long term and P. tabuliformis was a species that facilitated the accumulation of C of other tree species. Moreover, R. pseudoacacia was a typical nitrogen-fixing plant that significantly improved the C storage in soil [52]. Nevertheless, the reclamation management especially the interval between trees should be carefully designed because the distance was a key factor that affected tree’s competition and the recovery of biomass Cs. In addition, thinning by manual operation could be potential manner to inhibit the fierce competition among trees in reclaimed forest.
5. Conclusions
Tree biomass C class varied among planted R. pseudoacacia, seeded-in R. pseudoacacia, P. tabuliformis and U. pumila. C spatial arrangement of all tree species was in patchy distribution and the spatial pattern of C was not in accordance with tree’s location pattern. There were few niches for alien species to survive in nutrient-deficient reclaimed dump, thus gap-phase dynamic could be the major process for U. pumila. Furthermore, intra- and interspecific interactions affected the C accumulation of trees. Pioneer tree species R. pseudoacacia and P. tabuliformis could coexist for a long term and P. tabuliformis was a species that facilitated the accumulation of C of other tree species. Overall, our results revealed the why R. pseudoacacia and P. tabuliformis was the most efficient pattern to sequestrate C in post-mining spoils in the Loess Plateau area and we highlight the importance of the design of reclamation pattern in nutrient-limit reclamation ecosystem.
Author Contributions
Conceptualization, Z.Z. and Y.Y.; methodology, G.G. and Y.Y.; software, Y.R.; validation, Y.Y.; formal analysis, Y.Y.; investigation, Y.R. and S.N.; resources, Y.Y.; data curation, S.N.; writing—original draft preparation, Y.Y.; writing—review and editing, Y.Y.; visualization, Y.Y. and S.N.; supervision, Y.Y.; project administration, Y.Y.; funding acquisition, Y.Y. All authors have read and agreed to the published version of the manuscript.
Funding
This research was funded by the National Natural Science Foundation of China (Grant Number 41907408) and the Scientific and the Technological Innovation Programs of Higher Education Institutions in Shanxi (Grant Number 2019L0496).
Acknowledgments
We also thank Jinman Wang for his suggestions in the preparation of the manuscript.
Conflicts of Interest
The authors declare no conflicts of interest.
References
- Ussiri, D.A.N.; Lal, R. Carbon sequestration in reclaimed minesoils. Crit. Rev. Plant Sci. 2005, 24, 151–165. [Google Scholar] [CrossRef]
- Shrestha, R.K.; Lal, R. Changes in physical and chemical properties of soil after surface mining and reclamation. Geoderma 2011, 161, 168–176. [Google Scholar] [CrossRef]
- Amichev, B.Y.; Burger, J.A.; Rodrigue, J.A. Carbon sequestration by forests and soils on mined land in the Midwestern and Appalachian coalfields of the U.S. Forest Ecol. Manag. 2008, 256, 1949–1959. [Google Scholar] [CrossRef]
- Adeli, A.; Brooks, J.P.; Read, J.J.; McGrew, R.; Jenkins, J.N. Post-reclamation Age Effects on Soil Physical Properties and Microbial Activity Under Forest and Pasture Ecosystems. Commun. Soil Sci. Plant Anal. 2019, 50, 20–34. [Google Scholar] [CrossRef]
- Ahirwal, J.; Maiti, S.K.; Reddy, M.S. Development of carbon, nitrogen and phosphate stocks of reclaimed coal mine soil within 8 years after forestation with Prosopis juliflora (Sw.) Dc. Catena 2017, 156, 42–50. [Google Scholar] [CrossRef]
- Feng, Y.; Wang, J.M.; Liu, T.; Bai, Z.K.; Reading, L. Using computed tomography images to characterize the effects of soil compaction resulting from large machinery on three-dimensional pore characteristics in an opencast coal mine dump. J. Soils Sediments 2019, 19, 1467–1478. [Google Scholar] [CrossRef]
- Bai, Z.K.; Zhao, J.K.; Li, J.C.; Wang, W.Y.; Lu, C.E.; Ding, X.Q.; Chai, S.J.; Chen, J.J. Ecosystem damage in a large opencast coal mine-a case study on Pingshuo surface coal mine, China. Acta Ecol. Sin. 1999, 19, 870–875. (In Chinese) [Google Scholar]
- Akala, V.A.; Lal, R. Soil organic pools and sequestration rates in reclaimed minesoils in Ohio. J. Environ. Qual. 2001, 30, 2090–2104. [Google Scholar] [CrossRef]
- Ganjegunte, G.K.; Wick, A.F.; Stahl, P.D.; Vance, G.F. Accumulation and composition of total organic carbon in reclaimed coal mine lands. Land Degrad. Dev. 2009, 20, 156–175. [Google Scholar] [CrossRef]
- Yuan, Y.; Zhao, Z.Q.; Li, X.Z.; Wang, Y.Y.; Bai, Z.K. Characteristics of labile organic carbon fractions in reclaimed mine soils: Evidence from three reclaimed forests in the Pingshuo opencast coal mine, China. Sci. Total Environ. 2018, 613–614, 1196–1206. [Google Scholar] [CrossRef]
- Dutta, R.K.; Agrawal, M. Restoration of opencast coal mine spoil by planting exotic tree species: A case study in dry tropical region. Ecol. Eng. 2003, 21, 143–151. [Google Scholar] [CrossRef]
- Zhao, Z.Q.; Wang, L.H.; Bai, Z.K.; Pan, Z.G.; Wang, Y. Development of population structure and spatial distribution patterns of a restored forest during 17-year succession (1993–2010) in Pingshuo opencast mine spoil, China. Environ. Monit. Assess. 2015, 187, 431. [Google Scholar] [CrossRef] [PubMed]
- Yuan, Y.; Zhao, Z.Q.; Bai, Z.K.; Wang, H.Q.; Wang, Y.Z.; Niu, S.Y. Reclamation patterns vary carbon sequestration by trees and soils in an opencast coal mine, China. Catena 2016, 147, 404–410. [Google Scholar] [CrossRef]
- Shrestha, R.K.; Lal, R. Carbon and nitrogen pools in reclaimed land under forest and pasture ecosystems in Ohio, USA. Geoderma 2010, 157, 196–205. [Google Scholar] [CrossRef]
- Dobrowolska, D.; Bolibok, L. Is climate the key factor limiting the natural regeneration of silver fir beyond the northeastern border of its distribution range? Forest Ecol. Manag. 2019, 439, 105–121. [Google Scholar] [CrossRef]
- St-Denis, A.; Kneeshaw, D.; Messier, C. Effect of predation, competition, and facilitation on tree survival and growth in abandoned fields: Towards Precision Restoration. Forests 2018, 9, 692. [Google Scholar] [CrossRef]
- Williams, P.R.; Congdon, R.A.; Grice, A.C.; Clarke, P.J. Effect of fire regime on plant abundance in a tropical eucalypt savanna of north-eastern Australia. Austral Ecol. 2003, 28, 327–338. [Google Scholar] [CrossRef]
- Xu, Y.Z.; Franklin, S.B.; Wang, Q.G.; Shi, Z.; Luo, Y.Q.; Lu, Z.J.; Zhang, J.X.; Qiao, X.J.; Jiang, M.X. Topographic and biotic factors determine forest biomass spatial distribution in a subtropical mountain moist forest. Forest Ecol. Manag. 2015, 357, 95–103. [Google Scholar] [CrossRef]
- De Castilho, C.V.; Magnusson, W.E.; De Araújo, R.N.O.; Luizão, F.J. Short-term temporal changes in tree live biomass in a central Amazonian forest, Brazil. Biotropica 2010, 42, 95–103. [Google Scholar] [CrossRef]
- Lobos-Catalán, P.; Jiménez-Castillo, M. Different patterns of biomass allocation of mature and sapling host tree in response to liana competition in the southern temperate rainforest. Austral Ecol. 2014, 39, 677–685. [Google Scholar] [CrossRef]
- Nilsen, E.T.; Huebner, C.D.; Carr, D.E.; Bao, Z. Interaction between Ailanthus altissima and Native Robiniapseudoacacia in Early Succession: Implications for Forest Management. Forests 2018, 9, 211. [Google Scholar] [CrossRef]
- Stephenson, N.L.; van Mantgem, P.J.; Bunn, A.G.; Bruner, H.; Harmon, M.E.; O’Connell, K.B.; Urban, D.L.; Franklin, J.F. Causes and implications of the correlation between forest productivity and tree mortality rates. Ecol. Monogr. 2011, 81, 527–555. [Google Scholar] [CrossRef]
- Wang, J.S.; Fan, X.H.; Fan, J.; Zhang, C.Y.; Xia, F.C. Effect of tree biomass Competition on the biomass partitioning of Abiesnephrolepis. Sci. Silvae Sin. 2012, 48, 14–20. (In Chinese) [Google Scholar]
- John, R.; Dalling, J.W.; Harms, K.E.; Yavitt, J.B.; Stallard, R.F.; Mirabello, M.; Hubbell, S.P.; Valencia, R.; Navarrete, H.; Vallejo, M.; et al. Soil nutrients influence spatial distributions of tropical tree species. Proc. Natl. Acad. Sci. USA 2007, 104, 864–869. [Google Scholar] [CrossRef] [PubMed]
- Kirfel, K.; Heinze, S.; Hertel, D.; Leuschner, C. Effects of bedrock type and soil chemistry on thefine roots of European beech- A study on the belowground plasticity of trees. Forest Ecol. Manag. 2019, 444, 256–268. [Google Scholar] [CrossRef]
- Yuan, Y.; Zhao, Z.Q.; Zhang, P.F.; Chen, L.M.; Hu, T.; Niu, S.Y.; Bai, Z.K. Soil organic carbon and nitrogen pools in reclaimed mine soils under forest and cropland ecosystems in the Loess Plateau, China. Ecol. Eng. 2017, 102, 137–144. [Google Scholar] [CrossRef]
- Condit, R. Research in large, long-term tropical forest plots. Trends Ecol. Evol. 1995, 10, 18–22. [Google Scholar] [CrossRef]
- Condit, R. Tropical Forest Census Plots: Methods And results from Barro Colorado Island, Panama and a Comparison with Other Plots; Springer Science & Business Media: Berlin, Germany, 1998. [Google Scholar]
- Sist, P.; Mazzei, L.; Blanc, L.; Rutishauser, E. Large trees as key elements of carbon storage and dynamics after selective logging in the Eastern Amazon. Forest Ecol. Manag. 2014, 318, 103–109. [Google Scholar] [CrossRef]
- Slik, J.W.F.; Paoli, G.; McGuire, K.; Amaral, I.; Barroso, J.; Bastian, M.; Blanc, L.; Bongers, F.; Boundja, P.; Clark, C.; et al. Large trees drive forest aboveground biomass variation in moist lowland forests across the tropics. Glob. Ecol. Biogeogr. 2013, 22, 1261–1271. [Google Scholar] [CrossRef]
- Zhao, Z.Q.; Bai, Z.K.; Zhang, Z.; Guo, D.G.; Li, J.C.; Xu, Z.G.; Pan, Z.G. Population structure and spatial distributions patterns of 17 years old plantation in a reclaimed spoil of Pingshuo opencast mine, China. Ecol. Eng. 2012, 44, 147–151. [Google Scholar] [CrossRef]
- Ma, J.; Bu, R.C.; Liu, M.; Chang, Y.; Qin, Q.; Hu, Y.M. Ecosystem carbon storage distribution between plant and soil in different forest types in Northeastern China. Ecol. Eng. 2015, 81, 353–362. [Google Scholar] [CrossRef]
- Zhang, J.J.; Xu, J.J.; Li, M.H. Growth process of soil and water conservation forest and dynamic change of its carbon intensity. Sci. Soil Water Conserv. 2012, 10, 70–76. (In Chinese) [Google Scholar]
- Wang, N.; Wang, B.T.; Wang, R.J.; Cao, X.Y.; Wang, W.J.; Chi, L. Biomass allocation patterns and allometric models of PopulusDavidiana and Pinus Tabulaeformis Carr. in west of Shanxi Province. Bull. Soil Water Conserv. 2013, 33, 151–159. (In Chinese) [Google Scholar]
- Zhao, W.; Hu, Z.M.; Yang, H.; Zhang, L.M.; Guo, Q.; Wu, Z.Y.; Liu, D.Y.; Li, S.G. Carbon density characteristics of sparse Ulmus pumila forest and Populus simonii plantation in OnqinDaga Sandy Land and their relationships with stand age. Chin. J. Plant Ecol. 2016, 40, 318–326. (In Chinese) [Google Scholar]
- Du, H.Q.; Zhou, G.M.; Fan, W.Y.; Ge, H.L.; Xu, X.J.; Shi, Y.J.; Fan, W.L. Spatial heterogeneity and carbon contribution of aboveground biomass of moso bamboo by using geostatistical theory. Plant Ecol. 2010, 207, 131–139. [Google Scholar] [CrossRef]
- Burgos, P.; Madejon, E.; Perez-De-Mora, A.; Cabrera, F. Spatial variability of the chemical characteristics of a trace-element-contaminated soil before and after remediation. Geoderma 2006, 130, 157–175. [Google Scholar] [CrossRef]
- David, M.G.; Chao, S.; Zhang, B.; Owen, T.C. Geostatistical analyses and hazard assessment on soil lead in Silvermines area, Ireland. Environ. Pollut. 2004, 127, 239–248. [Google Scholar]
- Wälder, K.; Wälder, O. Analysing interaction effects in forests using the mark correlation function. iForest 2008, 1, 34–38. [Google Scholar] [CrossRef]
- Wiegand, T.; Moloney, K.A. Handbook of Spatial Point-Pattern Analysis in Ecology; CRC Press: London, UK, 2014. [Google Scholar]
- Diggle, P.J. Statistical Analysis of Spatial Point Patterns; Hodder Arnold: London, UK, 2003. [Google Scholar]
- Li, H.K.; Lei, Y.C.; Zeng, W.S. Forest carbon storage in China estimated using total volume data. Sci. Silvae Sin. 2011, 47, 7–12. (In Chinese) [Google Scholar]
- Belote, R.T.; Prisley, S.; Jones, R.H.; Fitzpatrick, M.; de Beurs, K. Forest productivity and tree diversity relationships depend on ecological context within mid-Atlantic and Appalachian forests (USA). Forest Ecol. Manag. 2011, 261, 1315–1324. [Google Scholar] [CrossRef]
- Bieng, M.A.N.; Perot, T.; de Coligny, F.; Goreaud, F. Spatial pattern of trees influences species productivity in a mature oak-pine mixed forest. Eur. J. Forest Res. 2013, 132, 841–850. [Google Scholar] [CrossRef]
- Ratcliffe, S.; Holzwarth, F.; Nadrowski, K.; Levick, S.; Wirth, C. Tree neighbourhood matters-Tree species composition drives diversity-productivity patterns in a near-natural beech forest. Forest Ecol. Manag. 2015, 335, 225–234. [Google Scholar] [CrossRef]
- Condit, R.; Ashton, P.S.; Baker, P.; Bunyavejchewin, S.; Gunatilleke, S.; Gunatilleke, N.; Hubbell, S.P.; Foster, R.B.; Itoh, A.; LaFrankie, J.V.; et al. Spatial patterns in the distribution of tropical tree species. Science 2000, 288, 1414–1418. [Google Scholar] [CrossRef] [PubMed]
- Fraver, S.; D’Amato, A.W.; Bradford, J.B.; Jonsson, B.G.; Jonsson, M.; Esseen, P.A. Tree growth and competition in an old-growth Piceaabies forest of boreal Sweden: Influence of tree spatial patterning. J. Veg. Sci. 2014, 25, 374–385. [Google Scholar] [CrossRef]
- Law, R.; Illian, J.; Burslem, D.F.R.P.; Gratzer, G.; Gunatilleke, C.V.S.; Gunatilleke, I.A.U.N. Ecological information from spatial patterns of plants: Insights from point process theory. J. Ecol. 2009, 97, 616–628. [Google Scholar] [CrossRef]
- Hao, M.H.; Zhang, Z.H.; Zhao, S.S.; Zhang, C.Y.; Zhao, X.M. Spatial autocorrelation patterns of tree growth in a coniferous and broad-leaved mixed forest in Jiaohe of Jilin province. Acta Ecol. Sin. 2017, 37, 1922–1930. (In Chinese) [Google Scholar]
- Yan, Y.; Xia, M.; Fan, S.; Zhan, M.; Guan, F. Detecting the Competition between Moso Bamboos and Broad-Leaved Trees in Mixed Forests Using a Terrestrial Laser Scanner. Forests 2018, 9, 520. [Google Scholar] [CrossRef]
- Zhao, B.Q.; Wu, Z.F.; Xu, Z.Y.; Yin, Z.X.; Wang, Q.Z.; Wang, X.W.; Wang, J.P.; Wang, L.Y.; Guo, D.G. Study on Species Composition and spatial pattern changes of Robiniapseudoacacia + Pinus tabuliformis mixed forest plot in opencast coal mine reclamation area. Environ. Sustain. Dev. 2015, 6, 31–35. (In Chinese) [Google Scholar]
- Gradel, A.; Ammer, C.; Ganbaatar, B.; Nadaldorj, O.; Dovdondemberel, B.; Wagner, S. On the Effect of Thinning on Tree Growth and Stand Structure of White Birch (Betula platyphyllaSukaczev) and Siberian Larch (LarixsibiricaLedeb.) in Mongolia. Forests 2017, 8, 105. [Google Scholar] [CrossRef]


© 2020 by the authors. Licensee MDPI, Basel, Switzerland. This article is an open access article distributed under the terms and conditions of the Creative Commons Attribution (CC BY) license (http://creativecommons.org/licenses/by/4.0/).