Article

Update of Genetic Linkage Map and QTL Analysis for Growth Traits in Eucommia ulmoides Oliver

1
College of Forestry, Northwest Agriculture and Forestry University, Yangling 712100, China
2
Forestry College, Fujian Agriculture and Forestry University, Fuzhou 350002, China
3
Yantai Research Institute of Forestry Science, Yantai 264013, China
*
Author to whom correspondence should be addressed.
Forests 2020, 11(3), 311; https://doi.org/10.3390/f11030311
Submission received: 6 February 2020 / Revised: 3 March 2020 / Accepted: 9 March 2020 / Published: 12 March 2020
(This article belongs to the Special Issue Forest Genetics and Tree Improvement)

Abstract

:
Eucommia ulmoides (Tu-chung) is an economically and ecologically important tree species which has attracted worldwide attention due to its application in pharmacology, landscaping, wind sheltering and sand fixation. Molecular marker technologies can elucidate the genetic mechanism and substantially improve the breeding efficiency of E. ulmoides. The current research updated the original linkage map, and quantitative trait loci (QTL) analysis was performed on tree growth traits measured over 10 consecutive years in an E. ulmoides F1 population (“Xiaoye” × “Qinzhong No.1”). In total, 452 polymorphic markers were scored from 365 simple sequence repeat (SSR) primers, with an average of 1.24 polymorphic markers per primer combination. The integrated map was 1913.29 cM (centimorgan) long, covering 94.10% of the estimated genome and with an average marker density of 2.20 cM. A total of 869 markers were mapped into 19 major independent linkage groups. Growth-related traits measured over 10 consecutive years showed a significant correlation, and 89 hypothetical QTLs were forecasted and divided into 27 distinct loci. Three traits for tree height, ground diameter and crown diameter detected 25 QTLs (13 loci), 32 QTLs (17 loci) and 15 QTLs (10 loci), respectively. Based on BLASTX search results in the NCBI database, six candidate genes were obtained. It is important to explore the growth-related genetic mechanism and lay the foundation for the genetic improvement of E. ulmoides at the molecular level.

1. Introduction

As a relic plant that experienced the third glacial period, Eucommia ulmoides is a dioecious perennial deciduous tree (2n = 34) and the only surviving species of the genus Eucommia (Eucommiaceae) [1,2]. Historical documents show that E. ulmoides is naturally distributed in central China, protected by complex terrains [1], and it has been considered highly adaptable to various site conditions. Since its successful introduction into France in 1896, E. ulmoides has been introduced into Korea, Japan, Germany, Russia and the United States [3]. E. ulmoides bark has been used as traditional Chinese medicine for thousands of years [4,5]. Modern studies have revealed that E. ulmoides has medicinal and health effects, such as lowering blood glucose and blood lipid levels and regulating blood pressure [6,7]. The gutta-percha in E. ulmoides leaves, fruits and phloem tissues can be a substitute for rubber, exhibit good resistance to strong temperature and acid-base changes, and is also an excellent insulator [8]. The species is also used in landscaping and forestry because of its straight trunk, flourishing leaves, wind sheltering, sand fixation and positive impacts on water and soil conservation.
Eucommia ulmoides can be propagated through seeding, cutting, grafting and tissue culture. Du et al. [9] have established seed orchards for large-scale production and identified a series of excellent varieties or clones, namely Xiaoye (male), Xiaoye (female), Daye, Daguo, Yanci, Miye, Luochao NO. 3 and so on, which are widely applied in the production. Du et al. [10] mainly focused on improving the linolenic acid oil and gutta-percha in E. ulmoides and selected and bred Huazhong NO. 6–9, which were suitable for orchard cultivation. Based on phenotypic traits such as growth, cold resistance, drought resistance and content of medicinal components of primary clones, the Northwest Agriculture and Forestry University has developed a clonal assay forest through the selection of provenances and superior trees and gained Qinzhong NO. 1–4, with high yields of gutta-percha and medicinal ingredients [11]. Wei et al. [12] obtained F1 hybrids of 24 families via controlled pollination from 10 clone parents. However, generally, in conventional breeding, it takes decades to test, evaluate and confirm new varieties.
Molecular markers can be employed to detect allelic variants associated to phenotypes in different conditions and to shorten the breeding cycles [13]. In recent years, foresters tended to apply molecular technologies to improve tree quality and yield. Genetic linkage map is an essential tool for identifying major promising genes and quantitative trait loci (QTL) controlling target traits. These markers could be directly used in marker-assisted breeding programmes and implemented in further positional cloning based on the linkage map. Due to the high heterozygosity of trees, F1 (cross pollinator, CP) plants exhibit abundant variance, and the pseudo-testcross mapping strategy was conducted [14], which has been widely used in trees, and many QTLs related to growth have been detected. Tong et al. [15] constructed a genetic linkage map containing 20 linkage groups from 299 Populus F1 progenies (P. deltoides (eastern cottonwood) × P. simonii (simon poplar) and obtained eight tree-height QTLs and seven ground-diameter QTLs. Conson et al. [16] constructed a linkage map with simple sequence repeat (SSR) and single nucleotide polymorphism (SNP) markers and estimated 38 QTLs related to stem size, tree height and whorl number in Hevea brasiliensis (rubber tree). In addition, disease resistance-related QTLs [17,18] and fruit-related QTLs [19,20] have been reported.
Li [21] constructed a genetic linkage map with sequence-related amplified polymorphism (SRAP), amplified fragment length polymorphism (AFLP), inter-simple sequence repeat (ISSR) and SSR molecular markers for E. ulmoides, in which 706 markers were distributed over 25 linkage groups. After excluding smaller linkage groups, 13 linkage groups were obtained containing 592 markers (at least 15 markers in each linkage group). In this study, SSR markers obtained from the transcriptome data [22] were used to update the original map, growth-related QTLs for tree height, ground diameter and crown diameter of 10 consecutive years were identified and candidate genes were predicted. These results enrich the genomic resources of E. ulmoides and represent feasible tools to facilitate ongoing and future breeding programs.

2. Materials and Methods

2.1. Mapping Population

An outcrossing F1 E. ulmoides mapping population was derived by the cross between two parental lines (“Xiaoye” × “Qinzhong No.1”) [23]. Controlled pollination was performed in March and April 2009 at Yantuo, Lingbao, Henan (110°66′ E, 34°27′ N, 1100–1500 m above sea level). Seeds were collected in October 2009 and stored in breathable gauze bags at 4 °C. Seeding was carried out in plastic cups with a 1:1:1 mix substrate of humus, sand and soil in the laboratory in March 2010. Seedlings were planted out in a greenhouse when they had reached a height of around 20 cm in July 2010. The F1 plantlets were planted with a spacing of 0.5 × 0.5 m in March 2011 and transplanted with a spacing of 3 × 3 m in April 2014 in the field at the nursery garden of Northwest A&F University, Yangling, Shaanxi (108°3′32″ E, 34°14′58″ N, 460 m above sea level). The F1 population was denominated as DZ0901 and consisted of 152 individuals.
The two parents were chosen because of the differences in leaf morphology characteristics, secondary metabolite content and climatic and geographic conditions of the origin areas. A wild phenotype “Xiaoye” was selected as the female parent, originating from the forest at Yantuo, Lingbao, Henan, with the following characteristics: small leaves, smooth bark, low contents of secondary metabolites and late budding and flowering times (convenient for controlled pollination). “Qinzhong No. 1” was selected as the male parent with a superior breeding variety, produced through selective asexual breeding and planted in the museum garden of Northwest A&F University, Yangling, Shaanxi (34°16′1″ N, 108°4′21″ E, 460 m above sea level), with the following characteristics: large leaves, rough bark, high levels of secondary metabolites and early budding and flowering times. “Qinzhong No. 1” also displayed high resistance to drought and cold, with a high growth rate [11].

2.2. DNA Extraction

We isolated DNA from fresh, young, fully expanded leaves of 152 F1 full sibs and two parental trees (“Xiaoye” and “Qinzhong No. 1”), according to a modified cetyltrimethylammonium bromide (CTAB) method [24]. The integrity of extracted DNA was checked via 1.2% agarose gel electrophoresis stained by ethidium bromide (EB), and the concentration was estimated with a NanoDrop ND-1000 spectrophotometer (NanoDrop Technologies Inc, Wilmington, Delaware, USA).

2.3. Simple Sequence Repeat (SSR) Analysis

Based on transcriptome data, 2200 pairs of SSR primers were randomly selected and synthesized by GENEWIZ Inc. (Suzhou, China) [22]. Eight samples (six F1 individuals and two parental trees) were used to assess the polymorphism and practicability of the SSR markers. A total of 365 SSR primers were validated as polymorphisms in the DZ0901 population [22,25] (Table S1) and were used for PCR amplification with 152 F1 individuals and two parents. The PCR amplification was carried out in 25 μL of reaction mix containing DNA (approximately 50 ng), dNTPs (0.2 mM), MgCl2 (2.5 mM), each primer (0.4 mM), PCR (polymerase chain reaction) buffer and Taq DNA polymerase (1.5 U). The amplification protocol of SSR-PCR was as follows: 3 min at 94 °C; 30 s at 94 °C, 30 s at the locus-specific annealing temperature, 60 s at 72 °C for 35 cycles; 10 min at 72 °C (final extension step). The results of the PCR amplification were detected by polyacrylamide gel electrophoresis on 8% of non-denaturing polyacrylamide gel and then visualised through AgNO3 staining. Polymorphic markers were recorded (repeat three times) as the presence or absence on the mapping population and then converted to “ll × l m” (heterozygous in female parent), “nn × np” (heterozygous in male parent) and “hk × hk” (heterozygous in both parent) to fit the map construction software JoinMap 4.0 (Plant Research International B.V. and Kyazma B.V., Wageningen, Gelderland, The Netherlands) [26].

2.4. Segregation Analysis and Linkage Map Construction

The E. ulmoides linkage map was updated with the pseudo-testcross mapping strategy using JoinMap 4.0 [26] combined with previous data [21]. A chi-squared test was performed to detect the segregation distortion with recorded SSR markers. Markers fitted to the expected Mendelian segregation ratio were applied for linkage analysis with the Kosambi mapping function and grouped following these parameters: 4.0 for the logarithm of odds (LOD) threshold, 0.45 for the recombination fraction threshold, 1.0 for the ripple value and 5.0 for the jump threshold. Linkage groups were drawn using the MapChart 2.2 software (Plant Research International B.V. and Kyazma B.V., Wageningen, Gelderland, The Netherlands) [27]. The arithmetic for estimating genome length (G2) was proposed by Chakravarti et al. [28] in 1991: G2 = G1 × (m + 1)/(m − 1); G1 refers to the observed length of one linkage group and m refers to the number of markers mapped on the linkage group. The computing method of the constructed linkage map coverage was assessed by G1 sum/G2 sum.

2.5. Growth Traits Assessment

Three vital growth traits (H, tree height; GD, ground diameter at 20 cm above ground level; C, crown diameter) were measured to assess the growth condition of the F1 progenies in October from 2010–2019 (at the end of the growing season). The 4-year (2010–2013, 1a–4a) phenotypic data for H and GD have been described in a previous study [21]. Here, 1 or 1a refers to 2010 traits, 2 or 2a refers to 2011 traits, and so on. Analyses of descriptive statistics and Pearson correlations of traits were carried out applying the statistical software SPSS 18.0 (Inc. SPSS, Prentice Hall, Upper Saddle River, New Jersey, USA, 2010) for Windows. Violin Plots (Omicshare Tools, Guangzhou Gene Denovo Biotechnology Co., Ltd., Guangzhou, Guangdong, China) were used to show the distribution and probability density for tree height (cm, H), ground diameter (mm, GD) and crown diameter (cm, C) of the F1 population DZ0901 over 10 years. The following formula was used to calculate the average growth rate (GR) of three traits over a 10-year period. Here, GV refers to the growth value, a and b refer to the measuring time (year), and a was larger than b.
GR = GV a GV b a b 1

2.6. Quantitative Trait Loci (QTL) Analysis

The QTL analyses were performed using the software MapQTL 5.0 (Plant Research International B.V. and Kyazma B.V., Wageningen, Gelderland, The Netherlands) [29]. The K–W (Kruskal–Wallis) analyses (nonparametric test) were performed to estimate the marker significance level and the marker-phenotype association. The interval mapping model (IM) was used to estimate the location of a supposed QTL. The multiple-QTL mapping (MQM) model was employed with the cofactors detected by the IM model. The significant logarithm of odds (LOD) threshold (p < 0.05) was determined via a permutation test (PT) with 1000 iterations. However, those QTLs with an LOD score ≥3 and lower than the LOD threshold from PT were also recorded. The phenotypic variations explained by the identified QTLs (R2) were calculated by variance analysis. The software MapChart 2.2 was used for QTL representation [27]. The original sequence information of the SSR markers flanking the target trait QTLs were obtained [22], a BLASTX search was conducted in the NCBI database, functional annotation was performed and relevant information of candidate genes was summarised.

3. Results

3.1. SSR Analysis

In total, 452 polymorphic SSR markers were obtained from 365 SSR primers, with an average of 1.24 polymorphic markers per primer combination. Among the 452 polymorphic SSR markers, 135 markers were identified as l m × ll markers (1:1 segregation ratio), 173 markers were identified as nn × np markers (1:1 segregation ratio), 144 markers were identified as hk × hk markers (3:1 segregation ratio), and the remaining 22 markers (4.87%) showed segregation distortion (p < 0.05) and were therefore excluded from mapping (Table S2). Combined with the previous data, a total of 1949 markers compliance with Mendelian segregation ratios put into use for the construction of the genetic linkage maps.

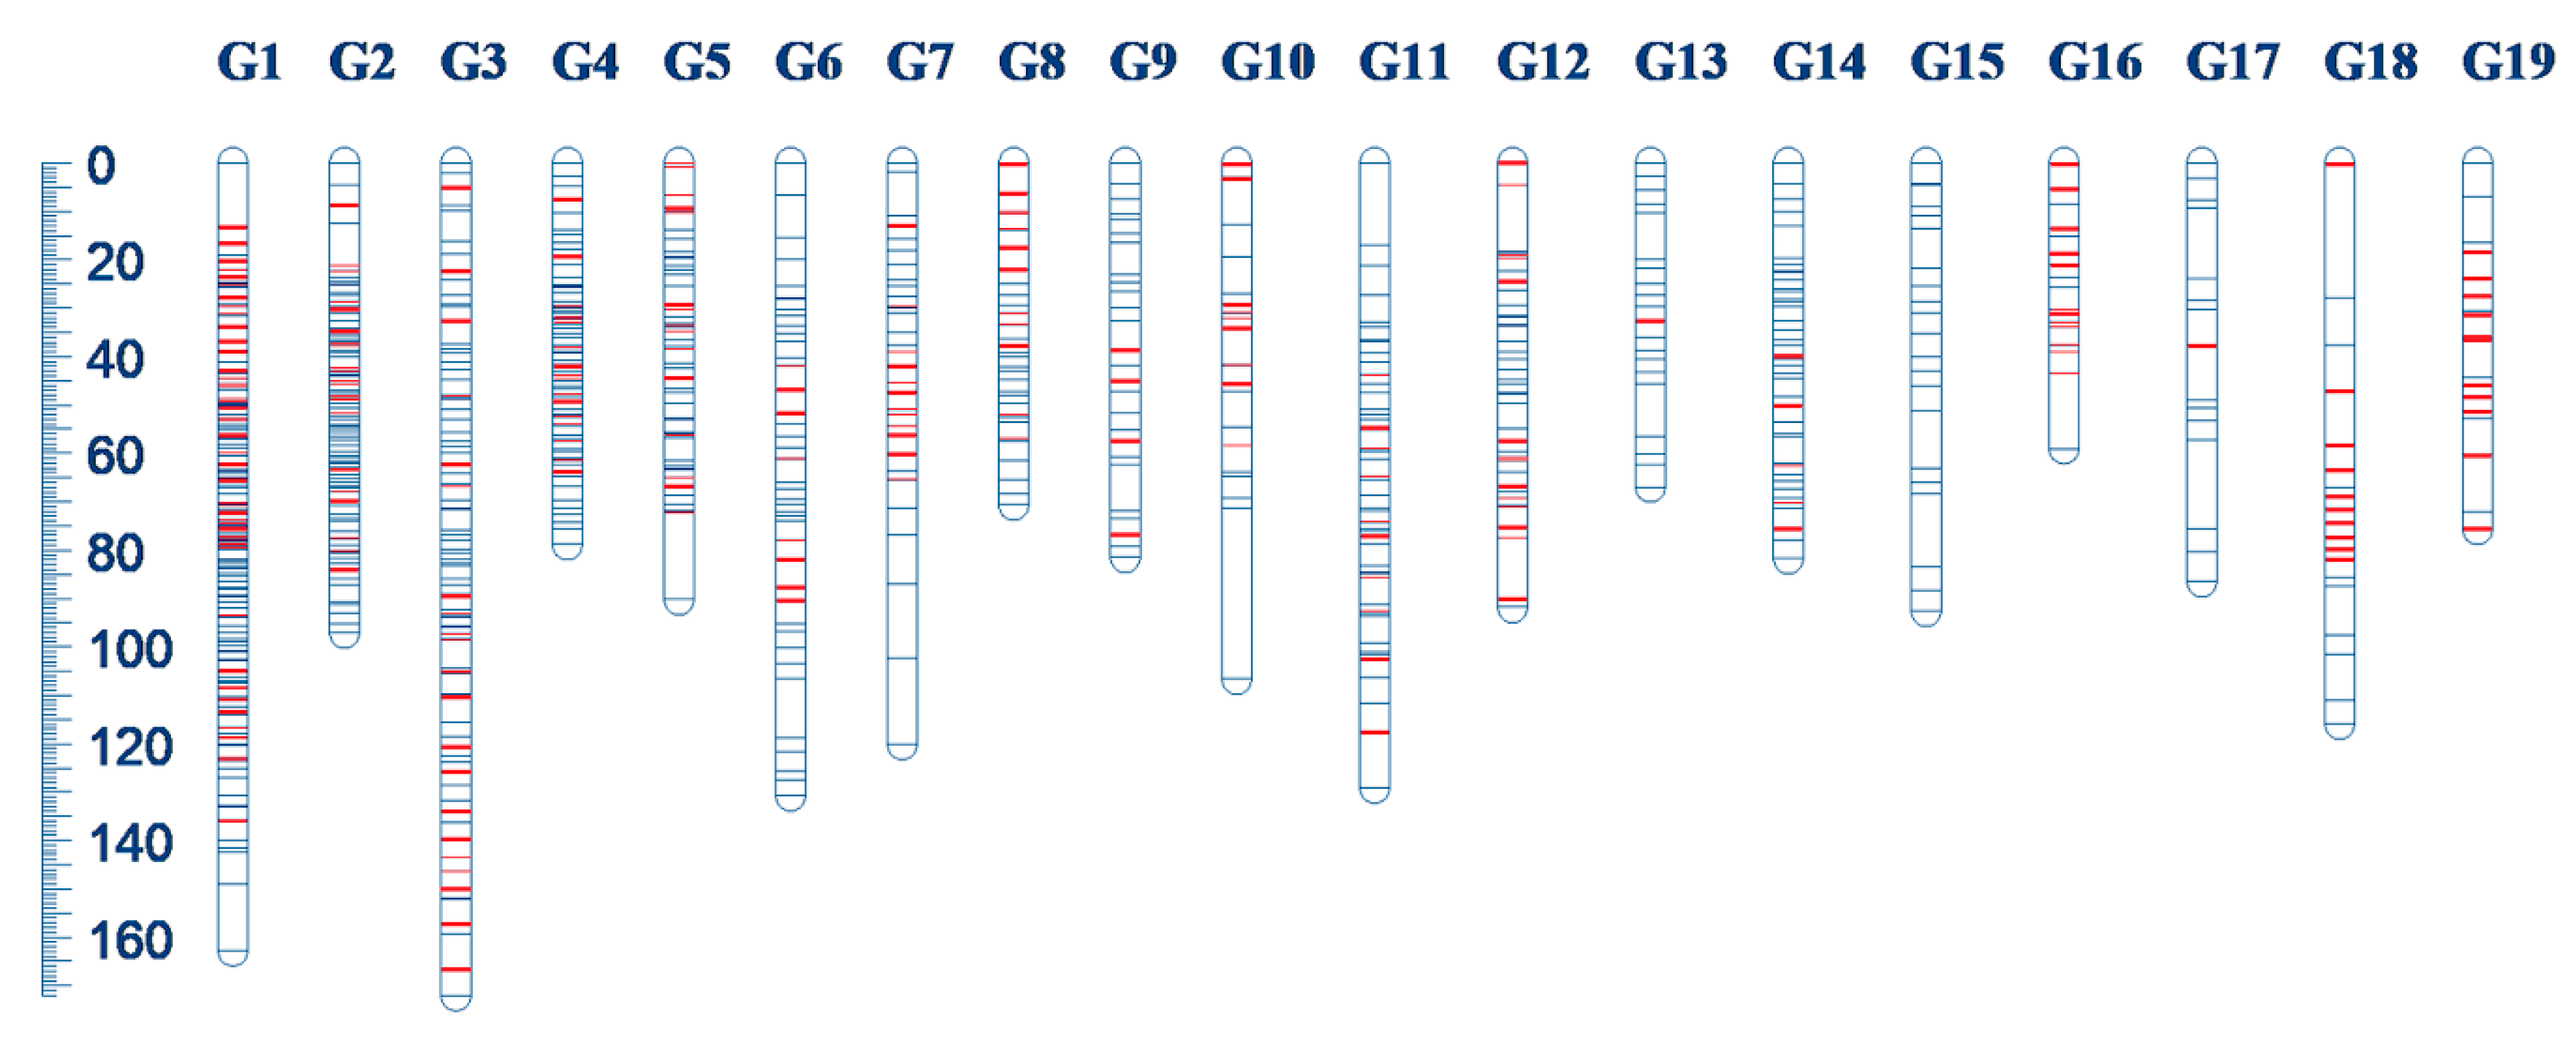
3.2. Genetics Linkage Map

The genetic linkage map of E. ulmoides consisted of 19 linkage groups with 869 segregating markers covering 1913.29 cM (Table 1, Figure 1, Figure S1). The maximum number of makers per linkage group was 151 (G1), the minimum number was 15 (G17), and the average number was 46. The total number of added SSR makers was 224, with a mean number of 11.79 per linkage group. The shortest length of each linkage group was 59.13 cM (G16), the longest was 172.21 cM (G3), and the average length was 100.70 cM. The mean genetic distance between adjacent markers was 2.20 cM. The estimated length of the E. ulmoides genome was 2033.151 cM. In this study, the constructed linkage map covered 94.10% of the estimated genome length. In addition, 286 markers were not linked to any of the existing linkage groups and were grouped in 88 small groups. One and three markers linked to G6 and G7, respectively, but could not be ordered. The remaining 790 markers did not link to any linkage group.

3.3. Growth Traits

The genetic variation of F1 population phenotypic traits was significant. The variation coefficients of tree height, ground diameter and crown diameter over consecutive 10 (8) years were 6.30–42.81%, 18.09–34.12% and 13.37–33.77%, respectively (Table 2). These growth-related traits were obviously separated in the mapping population and normally distributed, which was suitable for QTL analysis (Figure 2).
Tree height traits showed a significant correlation between different years (except 2010 and 2011), which was consistent with the results for ground diameter, while crown diameter showed no correlation between some years. Tree height and ground diameter showed a significant positive correlation over 10 years. Tree height and crown diameter showed a significant positive correlation in 2010–2015 and 2019 (1a–6a, 10a), but no correlation in 2016–2018 (7a–9a). Tree height and crown diameter were significantly correlated in 2012–2015 and 2019 (3a–6a, 10a), but showed no correlation in 2016–2018 (7a–9a).Ground diameter and crown diameter showed a significant positive correlation in 2012–2016 (3a–7a), but no correlation in 2017–2019 (8a–10a) (Table S3).

3.4. QTL Analysis

A total of 89 hypothetical QTLs were predicted, of which 30 were related to tree height, 38 were related to ground diameter and 21 were related to crown diameter. The above-mentioned QTLs included the results of the QTL analysis for the growth rates of three traits, among which 5, 6 and 6 QTLs were identified for growth rate of tree height, ground diameter and crown diameter, respectively (Table 3, Figure 3).
The linkage group G1 detected the most QTLs for the tree height trait (15), while G5, G7, G8, G10, G13, G18 and G19 predicted 2, 1, 1, 1, 5, 4 and 1 QTLs, respectively. We identified 13 distinct loci, which were distributed in G1 (4), G5 (1), G7 (1), G8 (1), G10 (1), G13 (2), G18 (2) and G19 (1). Locus 2 and 3 contained the most QTLs (6), Locus 7 and 19 contained 3 QTLs, Locus 10, 11, 15, 17 and 24 contained 2 QTLs, while the other loci contained 1 QTL (Table 4). Also, 16 QTLs (53.3%) reached the genomic LOD threshold and 18 QTLs (60.0%) were significantly correlated with the trait. Each QTL explained 13.8% (qh10-2) to 68.7% (qh5-2) of the phenotypic variation.
The linkage group G1 detected the most QTLs for the ground diameter trait (18), while G2, G3, G4, G5, G6, G8, G10, G12, G13, G16, G18 and G19 predicted 1, 1, 2, 2, 1, 2, 2, 1, 3, 1, 3 and 1 QTLs, respectively. We identified 17 distinct loci, which were distributed in G1 (4), G18 (2) and 11 linkage groups (each linkage group contained 1 locus). Locus 2 and 3 contained the most QTLs (7), Locus 19 contained 3 QTLs (qh3-1, qh4-1, qh5-1), Locus 7, 11, 20, 24 and 25 contained 2 QTLs, while the other loci contained 1 QTL (Table 4). Meanwhile, 23 QTLs (60.5%) reached the genomic LOD threshold (GW analysis) and 27 QTLs (71.1%) were significantly correlated with the trait (KW analysis). Each QTL explained 11.7% (qgr-gd-3) to 74.9% (qgd10-1) of the phenotypic variation.
The linkage group G1 detected the most QTLs for crown diameter trait (14), while G5, G7, G10, G15 and G16 predicted 3, 1, 1, 1 and 1 QTLs, respectively. We identified 10 distinct loci, which were distributed in G1 (5), G5 (1), G7 (1), G10 (1), G15 (1) and G16 (1). Locus 2 contained the most QTLs (qc3-1, qc6-4, qc9-1, qgr-c-1), Locus 3, 4 and 11 contained 3 QTLs, Locus 1 and 6 contained 2 QTLs, while the other loci contained 1 QTL (Table 4). Meanwhile, 11 QTLs (52.4%) reached the genomic LOD threshold and 13 QTLs (61.9%) were significantly correlated with the trait. Each QTL explained 11.1% (qc5-1) to 56.6% (qc6-4) of the phenotypic variation.
We found 3 loci linked to 3 traits (Locus 2, 3 and 11), while 5 loci were detected for tree height and ground diameter (Locus 7, 15, 19, 24 and 27), 2 loci were detected for ground diameter and crown diameter (Locus 6 and 17), and no loci were detected for tree height and crown diameter (Table 4). Based on the results of BLASTX, a total of six candidate genes were obtained. There was one QTL containing the KEGG (Kyoto Encyclopedia of Genes and Genomes) and GO (Gene Ontology) annotation information, respectively, and two failed to be mapped to the database (Table 5).

4. Discussion

4.1. SSR Marker and Segregation Distortion

Interspecific SSR primers were used to construct genetic maps for numerous species, but E. ulmoides has no species of the same genus (Eucommia) as candidate SSR sources. Therefore, the development of polymorphic SSR markers by next-generation sequencing is economical, efficient and necessary. The markers used in this study were also obtained from the transcriptome database, and 4.87% segregation distortion (SD) were detected, which was lower than for Castanea sativa (sweet chesnut) [18], Populus spp. (poplar) [30], Juglans regia (walnut) [31], Ziziphus jujuba (jujube) [32] and Citrus clementina (clement pomelo) [33]. Segregation distortion is a common problem in population mapping, and a number of variables could have led to SD [34,35,36,37,38]. In the current study, there were also significant differences in parental origin and growth-related traits between “Xiaoye” and “Qinzhong No.1” [39], and the genetic difference between parents was also an important factor affecting SD. There were no three or four alleles in the SSR marker, which may be related to the conservatism of CDS (coding sequence) identified via transcriptome sequencing.

4.2. Genetic Linkage Map

The E. ulmoides genetic linkage map contained more information with added SSR markers. Marker density and genome coverage have improved. The number of linkage groups (the mapped marker number was over 15) in the E. ulmoides linkage map was updated from 13 to 19 [21], which was larger than the chromosome haploid number (17). In addition, we obtained some small linkage groups, the same as in Juglans regia [31]. These phenomena have been found in many species [16,18,31,33,40,41] and indicate that some gaps prevent connection between linkage groups belonging to the same chromosome, which needs to be optimised in the future by expanding mapping population, increasing parental combinations and adopting new markers. By contrast with the variety of mapping populations in crops [42,43], the growth cycle of trees was long, and the genetic offspring was difficult to be obtained. The F1 mapping population is the most common one, and abundant variation can be gained through interspecific hybridisation in many trees [18,33]. In E. ulmoides, parents with significant differences should be valued.

4.3. Growth Traits

The growth rates of traits in 5a (2014) and 6a (2015) changed from slow growth to rapid growth, which may be related to transplanting (2014, 5a). After transplanting, plant spacing increased, leaving more growth space for the trees. Hence, the F1 progenies showed a rapid increase in tree height, ground diameter and crown diameter after adapting to the new environment. However, the slow growth of 9a (2018) and 10a (2019), especially the stagnant growth of crown diameter, may have been caused by the limited growth space, indicating that the phenotype was decided by the interaction of genotype and environment [31]. The research objects in this experiment were decennial high trees with a massive root system. The human, financial and land resources needed for transplanting were the primary issues. The design of the nursery and seed orchard and the use of fields or woodlands are important issues in tree cultivation. As a long-term task, tree cultivation needs to consider the actual condition of tree species and to better plan the use of fields or woodlands to obtain reliable research results.

4.4. QTL Analysis

Growth-related characteristics are important economic indices of E. ulmoides. The QTLs identified for each trait were distributed in different linkage groups, suggesting that the trait may be regulated by multiple genes with large effect. Three traits (tree height, ground diameter and crown diameter) had a complex genetic background, which was also confirmed for Pistacia vera (pistachio) [40], J. regia [31], P. tremula (European aspen) [44], H. brasiliensis [16] and Camellia sinensis (tea tree) [45]. The phenotypic variation explained by each QTL had a wide range, and the sum of the phenotypic variation for one trait was more than 100%. Beavis [46] has proposed the “Beavis effect” in 1994, which stated that the mapping population size could affect the phenotypic variation accounted for QTLs. In addition, when the distance between one QTL and its co-marker is close, the MQM model will absorb the effect of another QTL, thus affecting the phenotypic variation result. This problem can be solved by increasing the population size and optimising the QTL analysis model.
The tree height-related QTLs of different years were identified in the same region, forming a total of 13 loci. The same phenomenon also appeared in traits of ground diameter (17 loci) and crown diameter (10 loci). Growth rate-related QTLs also appeared in the aggregation regions of QTLs, indicating that the QTL loci contained the major genes which have a significant regulatory effect on the growth traits. In this study, the frequent QTLs showed various phenotypic variations among different years, and no QTLs were detected for 10 consecutive years. Expression instability of growth-related QTLs among years has been observed in many species [47,48]. Conson et al. [16] measured tree height, number of whorls, and stem diameter at seven different ages in H. brasiliensis, while Yang et al. [49] measured height and diameter at breast height over 2 years in Pinus elliottii (pelliottii), and the QTLs detected at different times did not cluster in the same region. These findings indicate that variations could be possible because different genes are involved in genotype–environment interactions or QTL regulation according to the developmental stage [50].
The growth traits of trees are easily influenced by the surrounding environment [31], and with the growth and maturity of trees, the genetic regulation mechanisms may adjust accordingly [51]. Four QTLs (qh6-1, qh6-2, qgd6-2 and qc6-2) detected in 6a (2015) were not in the QTL clusters, suggesting that regulatory genes or factors have changed after adapting to the new environment (transplanting). The growth of E. ulmoides slowed down in 9a (2018) and 10a (2019), and three separate QTLs were detected (qh10-1, qgd10-2 and qc9-2), suggesting that these QTLs may be related to the adaptability to spatial competitive pressure in E. ulmoides.
In this study, the QTL loci identified in G1, G5, G8, G13, G18 and G19 were associated with two or three traits. The results of the phenotypic correlation analysis revealed plain positive correlations among tree height, ground diameter and crown diameter in E. ulmoides. The QTLs for different traits with high correlation tend to appear in clusters in H. brasiliensis [16], Populus (poplar) [15], P. elliottii [49], Prunus dulcis (almond) [19] and J. regia [31]. It was generally inferred that the gene may regulate and control the expression of multiple traits or that, QTLs/genes were linked closely [52,53].
The QTL detection should formally apply on genotypic value, where environmental variations have been estimated and subtracted from the phenotypic observations. However, no replicates were set in this study, and therefore, estimates of environmental variance were not allowed and phenotypic values cannot be corrected. In the further study, we will replicate the mapping population (via grafting or tissue culture) to grow in different fields with various site conditions, with the aim to better evaluate the environmental and genetic effects.

4.5. Candidate Genes for QTLs

This study relied on previous transcriptome data to obtain annotation information and did not expect to identify all candidate genes for QTLs affecting growth traits in E. ulmoides.
Gigantea protein (GI) was predicted to be related to H1 and GD1 traits. It is generally believed that GI promotes flowering under long days in a circadian clock-controlled flowering pathway [54]. It is also involved in numerous physiological processes, mediating rhythmic, phytochrome B signalling, carbohydrate metabolism and cold stress response [55]. Ding et al. have described the identification of the Populus (poplar) orthologs of GI and their critical role in short-day-induced growth cessation and concluded that GI controls seasonal growth cessation in Populus [56]. In our study, GI may have played an important role in the photoperiodic control of growth cessation in E. ulmoides.
The ABIL1 was predicted to be related to H1, GD1 and C8 traits in E. ulmoides. Based on a previous study, ABIL1 encodes a subunit of the WAVE (Wiskott-Aldrich syndrome verprolin homologous protein) complex and is required for the activation of the ARP2/3 complex, which is involved in the nucleation and branching of actin microfilaments [57]. Studies have shown that actin microfilaments are involved in several physiological processes in plants, including organelle movement [58], intracellular vesicle transport [59], plant stress resistance [60] and response to plant hormones [61]. In addition, actin is involved in the process of cell division, acting as an orbit for the spindle and assisting in its localization in the middle of mitosis. This indicates that ABIL1 is an important regulatory factor in the growth and development of E. ulmoides.
The filamentation temperatures-sensitive H (FtsH) gene encoded an ATP and Zn2+-dependent protein with ATPase activity, proteolytic activity and molecular chaperone activity [62]. It plays an important role in thermal shock, hyperpermeability, light stress, cold induction, disease and other stress conditions [63]. The m-AAA complexes consist of AtFtsH3 and/or AtFtsH10 in Arabidopsis thaliana (arabidopsis), participating in the maturation of the ribosomal subunit L32 by proteolysis. Hence, in the double FtsH3/10 mutants of A. thaliana, molecular regulatory mechanisms are impaired, including mitotic biogenesis, mitochondrial translation and the function of the OXPHOS (oxidative phosphorylation) complex [64]. It is speculated that FtsH is involved in regulating mitochondrial activity in E. ulmoides cells.
The eukaryotic translation initiation factor 4G (eIF4G) is a scaffold protein that organises the assembly of initiation factors needed to recruit the 40S ribosomal subunit to an mRNA [65]. The eIF4G expresses two isoforms (eIF4G, eIFiso4G) in plants. Chen et al. [66] have investigated the role of eIFiso4G in plant growth by using null mutants for the eIF4G isoforms in Arabidopsis. The eIFiso4G loss-of-function mutants exhibited smaller cell, leaf, plant size and biomass accumulation, especially a reduction in chlorophyll levels, which correlated with its reduced photosynthetic activity. It is speculated that eIF(iso)4G affects the growth and development of E. ulmoides by regulating photosynthesis.
Although genes can potentially influence the growth and development of plants, further studies should be conducted to validate and prove the effects of genes in E. ulmoides on the growth-related traits.

5. Conclusions

In this study, the original genetic linkage maps were updated with transcriptome SSR data, and QTL analysis was performed on tree growth traits over 10 consecutive years in the E. ulmoides F1 population (“Xiaoye” × “Qinzhong No.1”). The integrated map was 1913.29 cM long, covering 94.10% of the estimated genome and with an average marker density of 2.20 cM. A total of 869 markers were mapped into 19 major independent linkage groups. Growth-related traits measured over 10 consecutive years showed a significant correlation, and 89 hypothetical QTLs were forecasted and divided into 27 distinct loci. Three traits for tree height, ground diameter and crown diameter detected 25 QTLs (13 loci), 32 QTLs (17 loci) and 15 QTLs (10 loci), respectively. Based on the BLASTX results, six candidate genes were obtained. It is important to explore the growth-related genetic mechanism and lay the foundation for the genetic improvement of E. ulmoides at the molecular level.

Supplementary Materials

The following are available online at https://www.mdpi.com/1999-4907/11/3/311/s1, Table S1: Primer sequence of SSR markers, Table S2: Segregation of SSR locus, Table S3: The correlation coefficient of growth trait in 10 consecutive years in Eucommia ulmoides F1 population (“Xiaoye” × “Qinzhong No.1”), Figure S1: The location of growth-related QTLs mapped on 19 linkage groups of Eucommia ulmoides.

Author Contributions

Conceptualization, C.J. and Z.L.; Data curation, C.J.; Formal analysis, C.J.; Funding acquisition, C.J., Z.L. and L.L.; Investigation, C.J., Y.L., S.W. and M.L.; Writing—original draft, C.J.; Writing—review and editing, C.J., Z.L., Y.L. and L.L. All authors have read and agreed to the published version of the manuscript.

Funding

The research was funded by the Shaanxi Research and development (R & D) Program (2019NY-012), Scientific Startup Foundation for Doctor of Northwest A & F University (Z109021715) and the General Financial Grant from the China Postdoctoral Science Foundation (2018M633594).

Conflicts of Interest

The authors declare no conflict of interest.

References

  1. Hu, S.Y. A contribution to our knowledge of Tu-chung—Eucommia ulmoides. Am. J. Chin. Med. 1979, 7, 5–37. [Google Scholar] [CrossRef] [PubMed]
  2. Du, H.; Xie, B.; Shao, S. Prospects and research progress of Gutta-percha. J. Central South For. Univ. 2003, 23, 95–98. [Google Scholar]
  3. Nakazawa, Y.; Bamba, T.; Takeda, T.; Uefuji, H.; Harada, Y.; Li, X.; Chen, R.; Inoue, S.; Tutumi, M.; Shimizu, T. Production of Eucommia-rubber from Eucommia ulmoides Oliv. (Hardy Rubber Tree). Plant Biotechnol. 2009, 26, 71–79. [Google Scholar] [CrossRef]
  4. Sih, C.J.; Ravikumar, P.R.; Huang, F.C.; Buckner, C.; Whitlock, H., Jr. Isolation and synthesis of pinoresinol diglucoside, a major antihypertensive principle of Tu-Chung (Eucommia ulmoides, Oliver). J. Am. Chem. Soc. 1976, 98, 5412–5413. [Google Scholar] [CrossRef]
  5. Kawasaki, T.; Uezono, K.; Nakazawa, Y. Antihypertensive mechanism of food for specified health use: “Eucommia leaf glycoside” and its clinical application. J. Health Sci. 2000, 22, 29–36. [Google Scholar]
  6. Hirata, T.; Kobayashi, T.; Wada, A.; Ueda, T.; Fujikawa, T.; Miyashita, H.; Ikeda, T.; Tsukamoto, S.; Nohara, T. Anti-obesity compounds in green leaves of Eucommia ulmoides. Bioorganic Med. Chem. Lett. 2011, 21, 1786–1791. [Google Scholar] [CrossRef]
  7. Jin, X.; Amitani, K.; Zamami, Y.; Takatori, S.; Hobara, N.; Kawamura, N.; Hirata, T.; Wada, A.; Kitamura, Y.; Kawasaki, H. Ameliorative effect of Eucommia ulmoides Oliv. leaves extract (ELE) on insulin resistance and abnormal perivascular innervation in fructose-drinking rats. J. Ethnopharmacol. 2010, 128, 672–678. [Google Scholar] [CrossRef]
  8. Chen, R.; Namimatsu, S.; Nakadozono, Y.; Bamba, T.; Nakazawa, Y.; Gyokusen, K. Efficient regeneration of Eucommia ulmoides from hypocotyl explant. Biol. Plant. 2008, 52, 713–717. [Google Scholar] [CrossRef]
  9. Du, H.; Du, L.; Li, F. Dynamic of Gutta-percha formation and accumulation in Samara of Eucommia ulmoides. For. Res. 2004, 17, 185–191. [Google Scholar]
  10. Du, H.Y.; Li, F.D.; Yang, S.B.; Fu, J.M.; Duan, J.H.; Du, L.Y.; Li, F.H. An elite variety for Samara use: Eucommia ulmoides “Huazhong NO. 9”. Scientia Silvae Sinicae 2008, 46, 182. [Google Scholar]
  11. Dong, J.; Ma, X.; Wei, Q.; Peng, S.; Zhang, S. Effects of growing location on the contents of secondary metabolites in the leaves of four selected superior clones of Eucommia ulmoides. Ind. Crop. Prod. 2011, 34, 1607–1614. [Google Scholar] [CrossRef]
  12. Wei, Y.C.; Li, Z.Q.; Li, Y.; Li, C. Genetic analysis of hybrid offspring morphological traits in Eucommia ulmoides Oliver. J. Northwest AF Univ. Nat. Sci. Ed. 2012, 40, 137–143. [Google Scholar]
  13. Priyadarshan, P.M. Breeding hevea rubber: Formal and molecular genetics. Adv. Genet. 2004, 52, 51–115. [Google Scholar] [PubMed]
  14. Grattapaglia, D.; Sederoff, R. Genetic linkage maps of Eucalyptus grandis and Eucalyptus urophylla using a pseudo-testcross: Mapping strategy and RAPD markers. Genetics 1994, 137, 1121–1137. [Google Scholar]
  15. Tong, C.; Li, H.; Wang, Y.; Li, X.; Shi, J. Construction of high-density linkage maps of Populus deltoides × P. simonii using restriction-site associated DNA sequencing. PLoS ONE 2016, 11, e0150692. [Google Scholar] [CrossRef] [Green Version]
  16. Conson, A.R.O.; Taniguti, C.H.; Amadeu, R.R.; Andreotti, I.A.A.; de Souza, L.M.; dos Santos, L.H.B.; Rosa, J.R.B.F.; Mantello, C.C.; da Silva, C.C.; José Scaloppi, E., Jr.; et al. High-resolution genetic map and QTL analysis of growth-related traits of Hevea brasiliensis cultivated under suboptimal temperature and humidity conditions. Front. Plant Sci. 2018, 9. [Google Scholar] [CrossRef] [Green Version]
  17. Emeriewen, O.F.; Richter, K.; Piazza, S.; Micheletti, D.; Broggini, G.A.L.; Berner, T.; Keilwagen, J.; Hanke, M.-V.; Malnoy, M.; Peil, A. Towards map-based cloning of FB_Mfu10: Identification of a receptor-like kinase candidate gene underlying the Malus fusca fire blight resistance locus on linkage group. Mol. Breed. 2018, 38, 106. [Google Scholar] [CrossRef] [Green Version]
  18. Santos, C.; Nelson, C.D.; Zhebentyayeva, T.; Machado, H.; Costa, R.L. First interspecific genetic linkage map for Castanea sativa × Castanea crenata revealed QTLs for resistance to Phytophthora cinnamomi. PLoS ONE 2017, 12, e0184381. [Google Scholar] [CrossRef] [Green Version]
  19. Goonetilleke, S.N.; March, T.J.; Wirthensohn, M.G.; Arús, P.; Mather, D.E. Genotyping-by-sequencing in almond: SNP discovery, linkage mapping and marker design. G3 Genes Genomes Genet. 2017, 8, 161–172. [Google Scholar] [CrossRef] [Green Version]
  20. Xia, Z.; Zhang, S.; Wen, M.; Lu, C.; Sun, Y.; Zou, M.; Wang, W. Construction of an ultrahigh-density genetic linkage map for Jatropha curcas L. and identification of QTL for fruit yield. Biotechnol. Biofuels 2018, 11, 3. [Google Scholar] [CrossRef]
  21. Li, Y.; Wang, D.; Li, Z.; Wei, J.; Jin, C.; Liu, M. A molecular genetic linkage map of Eucommia ulmoides and quantitative trait loci (QTL) analysis for growth traits. Int. J. Mol. Sci. 2014, 15, 2053–2074. [Google Scholar] [CrossRef] [PubMed] [Green Version]
  22. Cangfu, J.; Zhouqi, L.; Yu, L.; Shuhui, W.; Long, L.; Minhao, L.; Jing, Y. Transcriptome analysis of terpenoid biosynthetic genes and simple sequence repeat marker screening in Eucommia ulmoides. Mol. Biol. Rep. 2020, 47, 1979–1990. [Google Scholar] [CrossRef]
  23. Wang, D.; Li, Y.; Li, L.; Wei, Y.; Li, Z. The first genetic linkage map of Eucommia ulmoides. J. Genet. 2014, 93, 13–20. [Google Scholar] [CrossRef] [PubMed]
  24. Porebski, S.; Bailey, L.G.; Baum, B.R. Modification of a CTAB DNA extraction protocol for plants containing high polysaccharide and polyphenol components. Plant Mol. Biol. Rep. 1997, 15, 8–15. [Google Scholar] [CrossRef]
  25. Wu, M.; Du, H.; Wuyun, T.; Liu, P.; Jing, T. Characterization of Genomic MICROSATELLLITES and development of SSR markers of Eucommia ulmoides. For. Res. 2015, 28, 89–95. [Google Scholar]
  26. Ooijen, J.W.V. JoinMap 4. In Software for the Calculation of Genetic Linkage Maps in Experimental Populations; Kyazma B.V.: Wageningen, The Netherlands, 2006. [Google Scholar]
  27. Voorrips, R.E. MapChart: Software for the graphical presentation of linkage maps and QTLs. J. Hered. 2002, 93, 77–78. [Google Scholar] [CrossRef] [Green Version]
  28. Chakravarti, A.; Lasher, L.K.; Reefer, J.E. A maximum likelihood method for estimating genome length using genetic linkage data. Genetics 1991, 128, 175–182. [Google Scholar]
  29. Ooijen, J.W.; van Kessel, J.; van’t Verlaat, J.W.; Van, O.; van der Meer, J.; Ooijen, J.W.V. MapQTL 5. In Software for the Mapping of Quantitative Trait Loci in Experimental Populations; Kyazma B.V.: Wageningen, The Netherlands, 2004. [Google Scholar]
  30. Woolbright, S.A.; Rehill, B.J.; Lindroth, R.L.; Difazio, S.P.; Whitham, T.G. Large effect quantitative trait loci for salicinoid phenolic glycosides in Populus: Implications for gene discovery. Ecol. Evol. 2018, 8, 3726–3737. [Google Scholar] [CrossRef]
  31. Kefayati, S.; Ikhsan, A.S.; Sutyemez, M.; Paizila, A.; Kafkas, S. First simple sequence repeat-based genetic linkage map reveals a major QTL for leafing time in walnut (Juglans regia L.). Tree Genet. Genomes 2019, 15, 13. [Google Scholar] [CrossRef]
  32. Zhang, Z.; Gao, J.; Kong, D.; Wang, A.; Tang, S.; Li, Y.; Pang, X.M. Assessing genetic diversity in Ziziphus jujuba ‘Jinsixiaozao’ using morphological and microsatellite (SSR) markers. Biochem. Syst. Ecol. 2015, 61, 196–202. [Google Scholar] [CrossRef]
  33. Chang, Y.; Kim, H.B.; Oh, E.; Yi, K.; Song, K.J. Construction of genetic linkage maps of ‘Fina Sodea’ clementine (Citrus clementina) and Byungkyul (C. platymamma), a Korean landrace, based on RAPD and SSR markers. Hortic. Environ. Biotechnol. 2018, 59, 263–274. [Google Scholar] [CrossRef]
  34. Joy, K.; Yanfeng, D.; Xiaoyan, C.; Richard, M.; Zhongli, Z.; Xingxing, W.; Yuhong, W.; Zhenmei, Z.; Kunbo, W.; Fang, L. Simple sequence repeat (SSR) genetic linkage map of D genome diploid cotton derived from an interspecific cross between Gossypium davidsonii and Gossypium klotzschianum. Int. J. Mol. Sci. 2018, 19, 204. [Google Scholar]
  35. Jenczewski, E.; Gherardi, M.; Bonnin, I.; Prosperi, J.M.; Olivieri, I.; Huguet, T. Insight on segregation distortions in two intraspecific crosses between annual species of Medicago (Leguminosae). Theor. Appl. Genet. 1997, 94, 682–691. [Google Scholar] [CrossRef]
  36. Bradshaw, H.D.; Stettler, R.F. Molecular genetics of growth and development in Populus. II. Segregation distortion due to genetic load. Theor. Appl. Genet. 1994, 89, 551–558. [Google Scholar] [CrossRef] [PubMed]
  37. Lopez-Lavalle, L.A.B.; Matheson, B.; Brubaker, C.L. A genetic map of an Australian wild Gossypium C genome and assignment of homoeologies with tetraploid cultivated cotton. Genome 2011, 54, 779–794. [Google Scholar] [CrossRef] [PubMed]
  38. Alheit, K.V.; Reif, J.C.; Maurer, H.P.; Hahn, V.; Weissmann, E.A.; Miedaner, T.; Würschum, T. Detection of segregation distortion loci in triticale (x Triticosecale Wittmack) based on a high-density DArT marker consensus genetic linkage map. BMC Genom. 2011, 12, 380. [Google Scholar] [CrossRef] [PubMed] [Green Version]
  39. Li, Y.; Wei, Y.C.; Li, Z.Q.; Wang, S.H.; Chang, L. Relationship between progeny growth performance and molecular marker-based genetic distances in Eucommia ulmoides parental genotypes. Genet. Mol. Res. 2014, 13, 4736–4746. [Google Scholar] [CrossRef]
  40. Motalebipour, E.Z.; Gozel, H.; Khodaeiaminjan, M.; Kafkas, S. SSR-based genetic linkage map construction in pistachio using an interspecific F1 population and QTL analysis for leaf and shoot traits. Mol. Breed. 2018, 38, 134. [Google Scholar] [CrossRef]
  41. Mortaza, K.; Salih, K.; Ziya, M.E.; Nergiz, C. In silico polymorphic novel SSR marker development and the first SSR-based genetic linkage map in pistachio. Tree Genet. Genomes 2018, 14, 45. [Google Scholar]
  42. Uttam, B.; Prasanta, K.S. Identification of drought responsive QTLs during vegetative growth stage of rice using a saturated GBS-based SNP linkage map. Euphytica 2018, 214, 38. [Google Scholar] [CrossRef]
  43. Yang, Z.; Zhenyong, C.; Zhengsong, P.; Yan, Y.; Mingli, L.; Shuhong, W. Development of a high-density linkage map and mapping of the three-pistil gene (Pis1) in wheat using GBS markers. BMC Genom. 2017, 18, 567. [Google Scholar] [CrossRef] [PubMed]
  44. Zhigunov, A.V.; Ulianich, P.S.; Lebedeva, M.V.; Chang, P.L.; Nuzhdin, S.V.; Potokina, E.K. Development of F1 hybrid population and the high-density linkage map for European aspen (Populus tremula L.) using RADseq technology. BMC Plant Biol. 2017, 17, 180. [Google Scholar] [CrossRef] [PubMed]
  45. Tan, L.Q.; Wang, L.Y.; Xu, L.Y.; Wu, L.Y.; Peng, M.; Zhang, C.C.; Wei, K.; Bai, P.X.; Li, H.L.; Cheng, H. SSR-based genetic mapping and QTL analysis for timing of spring bud flush, young shoot color, and mature leaf size in tea plant (Camellia sinensis). Tree Genet. Genomes 2016, 12, 52. [Google Scholar] [CrossRef]
  46. Beavis, W.D. The power and deceit of QTL experiments: Lessons from comparative QTL studies. In Proceedings of the Forty-Ninth Annual Corn and Sorghum Industry Research Conference; American Seed Trade Assocition: Washington, DC, USA, 1994; pp. 250–266. [Google Scholar]
  47. Bradshaw, H.D.; Stettler, R.F. Molecular genetics of growth and development in Populus. IV. mapping QTLs with large effects on growth, form, and phenology traits in a forest tree. Genetics 1997, 84, 143–153. [Google Scholar]
  48. Li, R.; Jiang, H.; Zhang, Z.; Zhao, Y.; Xie, J.; Wang, Q.; Zheng, H.; Hou, L.; Xiong, X.; Xin, D.; et al. Combined linkage mapping and BSA to identify QTL and candidate genes for plant height and the number of nodes on the main stem in Soybean. Int. J. Mol. Sci. 2019, 21, 42. [Google Scholar] [CrossRef] [Green Version]
  49. Yang, H.X.; Liu, T.; Liu, C.; Zhao, F. QTL detection for growth traits in Pinus elliottii var. elliottii and P. caribaea var. hondurensis. For. Ecosyst. 2013, 15, 196–205. [Google Scholar]
  50. Conner, P.J.; Brown, S.K.; Weeden, N.F. Molecular-marker analysis of quantitative traits for growth and development in juvenile apple trees. Theor. Appl. Genet. 1998, 96, 1027–1035. [Google Scholar] [CrossRef]
  51. Kenis, K.; Keulemans, J. Study of tree architecture of apple (Malus × domestica Borkh.) by QTL analysis of growth traits. Mol. Breed. 2007, 19, 193–208. [Google Scholar] [CrossRef]
  52. Thumma, B.R.; Baltunis, B.S.; Bell, J.C.; Emebiri, L.C.; Moran, G.F.; Southerton, S.G. Quantitative trait locus (QTL) analysis of growth and vegetative propagation traits in Eucalyptus nitens full-sib families. Tree Genet. Genomes 2010, 6, 877–889. [Google Scholar] [CrossRef]
  53. Freeman, J.S.; Whittock, S.P.; Potts, B.M.; Vaillancourt, R.E. QTL influencing growth and wood properties in Eucalyptus globulus. Tree Genet. Genomes 2009, 5, 713–722. [Google Scholar] [CrossRef] [Green Version]
  54. Fowler, S.; Lee, K.; Onouchi, H.; Samach, A.; Richardson, K.; Morris, B.; Coupland, G.; Putterill, J. GIGANTEA: A circadian clock-controlled gene that regulates photoperiodic flowering in Arabidopsis and encodes a protein with several possible membrane-spanning domains. EMBO J. 1999, 18, 4679–4688. [Google Scholar] [CrossRef] [PubMed] [Green Version]
  55. De Montaigu, A.; Coupland, G. The timing of GIGANTEA expression during day/night cycles varies with the geographical origin of Arabidopsis accessions. Plant Signal. Behav. 2017, 12, e1342026. [Google Scholar] [CrossRef] [PubMed]
  56. Ding, J.; Böhlenius, H.; Rühl, M.; Chen, P.; Sane, S.; Zambrano, J.; Zheng, B.; Eriksson, M.; Nilsson, O. GIGANTEA-like genes control seasonal growth cessation in Populus. New Phytol. 2018, 218. [Google Scholar] [CrossRef] [PubMed] [Green Version]
  57. Basu, D.; Le, J.; El-Essal, E.-D.S.; Huang, S.; Zhang, C.; Mallery, E.L.; Koliantz, G.; Staiger, C.J.; Szymanski, D.B. DISTORTED3/SCAR2 is a putative Arabidopsis WAVE complex subunit that activates the Arp2/3 complex and is required for epidermal morphogenesis. Plant Cell 2005, 17, 502–524. [Google Scholar] [CrossRef] [PubMed] [Green Version]
  58. Grolig, F.; Moch, J.; Schneider, A.; Galland, P.; Palme, K. Actin cytoskeleton and organelle movement in the sporangiophore of the zygomycete Phycomyces blakesleeanus. Plant Biol. 2014, 16, 167–178. [Google Scholar] [CrossRef] [PubMed]
  59. Li, L.-J.; Ren, F.; Gao, X.Q.; Wei, P.C.; Wang, X.C. The reorganization of actin filaments is required for vacuolar fusion of guard cells during stomatal opening in Arabidopsis. Plant Cell Environ. 2013, 36, 484–497. [Google Scholar] [CrossRef] [PubMed]
  60. Hao, X.; Li, H.; Hua, Y.; Yu, K.; Walter, M.; Qi, T.; Zhang, B.; Ma, Q. Actin dynamic polymerization is required for the expression of nonhost resistance in pepper against Blumeria graminis f. sp. tritici. Physiol. Mol. Plant Pathol. 2014, 86, 64–72. [Google Scholar] [CrossRef]
  61. Lanza, M.; Garcia-Ponce, B.; Castrillo, G.; Catarecha, P.; Sauer, M.; Rodriguez-Serrano, M.; Páez-García, A.; Sánchez-Bermejo, E.; TC, M.; Leo del Puerto, Y. Role of actin cytoskeleton in brassinosteroid signaling and in its integration with the auxin response in plants. Dev. Cell 2012, 22, 1275–1285. [Google Scholar] [CrossRef] [Green Version]
  62. Wagner, R.; Sydow, L.V.; Aigner, H.; Netotea, S.; Funk, C. Deletion of FtsH11 protease has impact on chloroplast structure and function in Arabidopsis thaliana when grown under continuous light. Plant Cell Environ. 2016, 39, 2530–2544. [Google Scholar] [CrossRef]
  63. Karata, K.; Inagawa, T.; Wilkinson, A.J.; Tatsuta, T.; Ogura, T. Dissecting the role of a conserved motif (the second region of homology) in the AAA family of ATPases: Site-directed mutagenesis of the ATP-dependent protease FtsH. J. Biol. Chem. 1999, 274, 26225–26232. [Google Scholar] [CrossRef] [Green Version]
  64. Kolodziejczak, M.; Skibior, B.R.; Janska, H. m-AAA complexes are not crucial for the survival of arabidopsis under optimal growth conditions despite their importance for mitochondrial translation. Plant Cell Physiol. 2018, 59, 1006. [Google Scholar] [CrossRef] [PubMed]
  65. Gan, W.; Rhoads, R.E. Internal initiation of translation directed by the 5′-untranslated region of the mRNA for eIF4G, a factor involved in the picornavirus-induced switch from cap-dependent to internal initiation. J. Biol. Chem. 1996, 271, 623–626. [Google Scholar] [CrossRef] [PubMed] [Green Version]
  66. Chen, Z.; Jolley, B.; Caldwell, C.; Gallie, D.R. Eukaryotic translation initiation factor eIFiso4G is required to regulate violaxanthin de-epoxidase expression in Arabidopsis. J. Biol. Chem. 2014, 289, 13926–13936. [Google Scholar] [CrossRef] [PubMed] [Green Version]
Figure 1. Distribution of 869 segregating markers among 19 linkage groups of Eucommia ulmoides. Red lines represent new SSR markers added on the linkage group. The genetic distance (cM) and linkage group number are shown on the left and top, respectively.
Forests 11 00311 g001
Figure 2. Distribution of growth traits of the Eucommia ulmoides F1 population for 10 consecutive years. The white dots in the middle represents the median value. The black rectangle in the middle represents 25th to 75th percentiles range. The middle vertical line extended from the black rectangle represents the 95% confidence interval. The vertical axis of the shape outside the black rectangle represents the data dispersion, and the horizontal axis represents the distribution frequency. 1a represents for 2010, 2a represents for 2011, and so on.
Forests 11 00311 g002
Figure 3. QTL mapping on genetic linkage groups for growth traits in Eucommia ulmoides. Red, green and blue bars represent QTLs for height, ground diameter and crown diameter, respectively. The hollow bars represents QTLs for growth rates. Thick bars and thin lines represent 1-LOD and 2-LOD confidence intervals of each QTL, respectively. QTLs name were described in Table 3.
Forests 11 00311 g003
Table 1. Distributions of markers on 19 linkage groups of Eucommia ulmoides.
Linkage GroupNumber of MarkersLengthMean DistanceNumber of Added SSR
G1151162.931.0844
G29497.341.0419
G393172.211.8521
G47279.091.1015
G55390.511.7116
G642130.893.128
G733120.223.6413
G83170.712.2811
G93081.712.724
G1021106.845.099
G1155129.422.3510
G124291.902.1914
G132067.093.351
G144281.821.955
G152192.884.420
G161759.133.4812
G171586.635.781
G1819116.126.1110
G191875.854.2111
Total8691913.292.20224
Mean46100.702.2011.79
Table 2. Distribution of measured traits of Eucommia ulmoides.
Traits 1Min.Max.MeanMedianSD 2CV 3/%Max/Min
H2010/cm9.0085.0039.2537.0016.8042.819.44
H2011/cm50.00216.00138.71139.0036.6226.404.32
H2012/cm120.00310.00224.84230.0048.3821.522.58
H2013/cm170.00480.00332.02340.0074.4422.422.82
H2014/cm178.00500.00380.84400.0079.2320.802.81
H2015/cm120.00620.00390.16380.00110.4828.325.17
H2016/cm260.00640.00457.04450.0080.0517.512.46
H2017/cm320.00770.00589.44595.0066.4011.272.41
H2018/cm400.00770.00690.20700.0043.476.301.93
H2019/cm440.00880.00740.46740.0063.298.552.00
GD2010/mm1.279.374.854.811.6534.127.38
GD2011/mm3.9319.6111.8712.023.0625.744.99
GD2012/mm10.0230.4119.2018.834.5623.733.03
GD2013/mm10.4238.2722.3722.026.0827.163.67
GD2014/mm13.5547.6025.6624.587.0527.493.51
GD2015/mm21.3382.6946.4142.8014.3530.913.88
GD2016/mm16.0496.2956.7054.0015.0026.456.00
GD2017/mm39.67135.9969.9567.3214.6020.883.43
GD2018/mm36.46126.2779.5680.6515.1018.983.46
GD2019/mm39.09123.5984.1885.1815.2318.093.16
C2012/cm17.5093.0056.6056.0014.9926.495.31
C2013/cm33.50117.5077.4978.5015.5220.023.51
C2014/cm45.00145.0088.7587.5017.1819.363.22
C2015/cm32.50190.00100.0490.0033.7933.775.85
C2016/cm52.00232.50147.72145.0028.9219.584.47
C2017/cm127.50275.00203.20200.0027.1613.372.16
C2018/cm125.00315.00211.89204.5043.8520.702.52
C2019/cm110.00345.00196.88190.0040.9920.823.14
Note: 1 H, tree height; GD, ground diameter at 20 cm above ground level; C, crown diameter. 2 SD, standard deviation; 3 CV, coefficient of variation.
Table 3. Descriptions of quantitative trait loci (QTLs) affecting growth traits in Eucommia ulmoides.
Trait 1QTL 2GW 3LG 4Peak position/cMLOD 5Marker 6Var./% 7KW 8
H2010qh1-15.1 *G186.0005.56EQ457–200a50.4*
qh1-25.1 *G149.8336.40em2me13–7019.6*******
qh1-35.1 *G175.4056.77EQ580–180b19.8*******
H2011qh2-15.0 *G149.4885.90em13me4–62017.3*******
H2012qh3-15.2G1314.3094.65em13me4–36031.4*****
qh3-25.2G1842.6523.67EQ1107–110b61.8-
H2013qh4-15.7G1310.3093.85em13me4–36040.7**
qh4-25.7G1349.6033.35em3me9–25050.0****
H2014qh5-17.6G1314.3095.57em13me4–36054.4-
qh5-27.6G1353.6036.77em3me9–25068.7-
qh5-37.6G1841.6525.50em53me13–22060.8-
H2015qh6-15.2 *G870.4625.48em1me6–17038.5**
qh6-25.2 *G193.0006.62em32me7–12543.7**
qh6-35.2 *G147.81114.19em1me26–240053.0-
qh6-45.2 *G174.98017.69em49me3–15042.9*******
qh6-55.2 *G1121.5099.45DZ159–161c39.4***
H2016qh7-15.0 *G147.81111.40em1me26–240042.1-
qh7-25.0 *G174.98013.49em49me3–15033.9*******
qh7-35.0 *G1121.5097.60DZ159–161c38.3**
H2017qh8-14.6 *G145.7205.39DZ165–301c15.1*******
qh8-24.6 *G189.1735.83E8M8–11523.2-
H2018qh9-112.5G182.3645.14E8M8–12519.7****
qh9-212.5G727.3818.62em3me2–51041.0-
H2019qh10-16.7G546.6934.70em7me12–36529.7-
qh10-26.7G182.3643.38E8M8–12513.8*
GR-Hqgr-h-15.7 *G149.8336.69em2me13–7019.0*******
qgr-h-25.7 *G197.2436.77em13me4–480c18.5*******
qgr-h-35.7G546.1824.95em7me12–36539.0-
qgr-h-45.7G1020.2333.04em21me6–60016.9-
qgr-h-55.7G189.0004.99EQ457–200a52.7-
GD2010qgd1-15.0 *G149.8336.62em2me13–7027.7*******
qgd1-45.0 *G175.40510.18EQ580–180b27.0*******
qgd1-55.0 *G186.0005.76EQ457–200a54.1*
GD2011qgd2-14.8 *G149.4885.03em13me4–62017.5*******
qgd2-24.8 *G1107.7384.98em1me4–140c14.0******
GD2012qgd3-15.0G3106.8423.03E7M4–35016.4-
qgd3-25.0G442.8363.30em4me7–25014.2***
qgd3-35.0G1054.2533.17EQ962–25015.2**
qgd3-45.0G1312.3063.61em13me4–36034.4****
qgd3-55.0G193.0003.68em32me7–12550.5**
GD2013qgd4-14.9G279.3463.29UBC886–220023.6**
qgd4-24.9G435.1184.33em1me1–75026.3-
qgd4-34.9G1056.5833.38EQ962–25018.3-
qgd4-44.9G1312.3093.34em13me4–36030.2****
GD2014qgd5-15.6G147.8119.11em1me26–240039.2-
qgd5-25.6G189.9396.70DZ159–26023.9**
GD2015qgd6-110.3 *G870.46211.04em1me6–17059.2***
qgd6-210.3 *G18114.36610.74UBC842–30072.7-
qgd6-310.3 *G174.98026.21em49me3–15056.8*******
qgd6-410.3 *G1121.50912.04DZ159–161c49.5***
qgd6-510.3 *G147.81115.94em1me26–240056.5-
GD2016qgd7-15.4 *G870.7095.80em1me6–17034.0**
qgd7-25.4 *G145.72011.14DZ165–301c28.6*******
qgd7-35.4 *G174.98016.50em49me3–15039.7*******
qgd7-45.4 *G1122.5098.53em25me28–110c32.0*******
GD2017qgd8-15.5 *G145.72010.81DZ165–301c27.9*******
qgd8-25.5 *G181.11214.48em1me14–90048.8*******
GD2018qgd9-14.9 *G158.10311.40DZ4–141c29.2*******
qgd9-24.9 *G174.98013.49em49me3–15037.7*******
qgd9-34.9 *G1121.5097.50DZ159–161c37.3*
GD2019qgd10-15.9 *G547.44531.36em7me12–36074.9**
qgd10-25.9 *G1627.16337.52em39-me11–230074.8-
GR-GDqgr-gd-16.2 *G175.40510.87EQ580–180b29.4*******
qgr-gd-26.2G554.9544.75em5me7–26036.6-
qgr-gd-36.2G688.8803.06EQ2190–15011.7****
qgr-gd-46.2G121.0004.45EQ1652–190b51.2-
qgr-gd-56.2G1315.3093.28em1me3–9045.6-
qgr-gd-66.2 *G188.0007.06EQ457–200a59.6-
C2012qc3-14.8G154.5624.56em1me26–11013.0*******
C2013qc4-14.9G186.5513.28em9me5–31017.3-
qc4-24.9G545.1823.05em56me4–15013.6-
C2014qc5-14.8G129.0783.89em6me8–330c11.1-
qc5-24.8G174.9804.00em49me3–15018.7-
C2015qc6-15.5 *G545.1825.77em56me4–15036.1**
qc6-25.5 *G163.0005.88EQ2084-23034.8-
qc6-35.5 *G128.9018.40em6me8–330c31.2*******
qc6-45.5 *G147.81111.83em1me26–240056.6-
qc6-55.5 *G181.12115.57em1me14–90052.0*******
C2016qc7-14.8 *G168.3935.06UBC808–42019.8**
C2017qc8-14.7 *G175.4056.35EQ580–180b18.3*******
C2018qc9-15.2 *G148.6585.53E1M8–24523.9******
qc9-25.2 *G1105.1177.56em13me4–190c22.3*******
C2019qc10-14.9 *G188.1737.68em8me10–230c20.8*******
GR-Cqgr-c-15.4 *G149.4888.25em13me4–62038.3-
qgr-c-25.4G1110.4837.74em4me3–230027.8**
qgr-c-35.4G546.1823.60em7me12–36523.2***
qgr-c-45.4G7102.5623.09em4me7–19026.5***
qgr-c-55.4G1064.0063.92em14me8–270c11.2****
qgr-c-65.4G1530.9565.29em6me3–55034.4-
Note: 1 H, tree height; GD, ground diameter; C, crown diameter, GR, growth rate. 2 QTL named using q added an abbreviation of the trait, followed by the year (1 for 2010, 2 for 2011, and so on) and the QTL number. 3 Genome-wide permutation test, * logarithm of the odds (LOD) value was significant at P < 0.05 based on 1000 genome-wide permutation tests. 4 Linkage Group. 5 logarithm of the odds (LOD) value at peak position. 6 Marker name nearest to the QTL position. 7 The proportion of phenotypic variance explained by the QTL. 8 Kruskal–Wallis significance level, given by the P values (* 0.1; ** 0.05; *** 0.01; **** 0.005, ***** 0.001, ****** 0.0005, ******* 0.0001).
Table 4. The statistics of QTL loci on the genetic linkage map.
NO.LG1Interval/cMQTL
H 2GD 3C 4
Locus 1G127.901~29.168qc5-1, qc6-3
Locus 2G145.526~54.202qh1-2, qh2-1,
qh6-3, qh7-1,
qh8-1, qgr-h-1,
qgd1-1, qgd2-1, qgd5-1,
qgd6-5, qgd7-2, qgd8-1,
qgd9-1
qc3-1, qc6-4,
qc9-1, qgr-c-1
Locus 3G171.761~75.489qh1-3, qh6-4,
qh7-2, qh8-2,
qh9-1, qh10-2
qgd1-4, qgd5-2, qgd6-3,
qgd7-3, qgd8-2, qgd9-2,
qgr-gd-1
qc5-2, qc7-1,
qc8-1
Locus 4G186.881~90.899qc4-1, qc6-5,
qc10-1
Locus 5G195.989~99.254qgr-h-2
Locus 6G1103.685~109.72qgd2-2qc9-2, qgr-c-2
Locus 7G1120.509~123.215qh6-5, qh7-3qgd6-4, qgd9-3, qgd7-4
Locus 8G278.034~80.215qgd4-1
Locus 9G3104.69~108.842qgd3-1
Locus 10G431.947~47.632qgd3-2, qgd4-2
Locus 11G543.445~52.63qh10-1, qgr-h-3qgr-gd-2, qgd10-1qc4-2, qc6-1,
qgr-c-3
Locus 12G684.245~94.599qgr-gd-3
Locus 13G726.381~28.441qh9-2
Locus 14G795.113~113.562qgr-c-4
Locus 15G857.394~70.709qh6-1qgd6-1, qgd7-1
Locus 16G1013.624~25.233qgr-h-4
Locus 17G1045.839~60.583qgd3-3, qgd4-3qgr-c-5
Locus 18G120.000~3.000qgr-gd-4
Locus 19G1310.309~17.309qh3-1, qh4-1,
qh5-1
qgd3-4, qgd4-4, qgr-gd-5
Locus 20G1345.603~52.603qh4-2, qh5-2
Locus 21G1530.583~33.586qgr-c-6
Locus 22G160.000~8.214qc6-2
Locus 23G1625.613~28.613qgd10-2
Locus 24G180.000~25.000qh1-1, qgr-h-5qgd1-5, qgr-gd-6
Locus 25G1838.652~45.652qh3-2, qh5-3
Locus 26G18112.366~115.366qgd6-2
Locus 27G190.000~18.476qh6-2qgd3-5
Note: 1 LG, linkage group; 2 H, tree height; 3 GD, ground diameter; 4 C, crown diameter.
Table 5. Candidate QTL genes for growth traits in Eucommia ulmoides.
TraitMarkerGene IDAnnotationKO/GO ID
H2010, GD2010, GR-H, GR-GDEQ457Unigene0019357gigantea protein
H2010, GD2010, C2017, GR-GDEQ580Unigene0000958protein ABIL1-likeGO:0016485
GD2010, GR-GDEQ767Unigene0003585cell division protease, ftsH isoform 1
H2012EQ1107Unigene0007449translation initiation factor 4G-likeK03260
GD2012, GD2013EQ962Unigene0005909
C2015EQ2084Unigene0016652

