Article

The Assessment of Two Species of Soapberry as Resources for High-Quality Biodiesel Production with an Optimized Method of Ultrasound-Assisted Oil Extraction

1
The Key Laboratory for Silviculture and Conservation of the Ministry of Education, Beijing Forestry University, Beijing 100083, China
2
Institute of Forestry and Pomology, Beijing Academy of Agriculture and Forestry Science, Beijing 100093, China
3
Institute of Chinese Medicinal Materials, Nanjing Agricultural University, Nanjing 210095, China
*
Author to whom correspondence should be addressed.
These authors contributed equally to this work.
Forests 2020, 11(2), 212; https://doi.org/10.3390/f11020212
Submission received: 5 January 2020 / Revised: 3 February 2020 / Accepted: 8 February 2020 / Published: 13 February 2020
(This article belongs to the Section Forest Ecology and Management)

Abstract

:
Biodiesel has many advantages, yet its high price has become the main obstacle to market acceptance. Selecting non-edible woody oil plant resources and optimizing the oil extraction process will contribute to the effective utilization of raw materials and development of the related biodiesel industry. This study presents a detailed evaluation of two Sapindus species (Sapindus delavayi (Franch.) Radlk. and Sapindus mukorossi Gaertn.) as promising feedstocks for biodiesel production. As ultrasonic-assisted extraction (UAE) is considered a green and efficient oil extraction method, the process was optimized by response surface methodology (RSM) using a Box–Behnken design (BBD) in our study. The kernel oil yield of S. delavayi was up to 43.67% ± 0.16% under the optimized extraction conditions (the ultrasonic power was 109W, extracting at 65 °C for 25 min, and the liquid–solid ratio was 9 mL·g−1). The kernel oil yield of S. mukorossi was as high as 45.96% ± 0.21% under the optimized extraction conditions (the ultrasonic power was 114W, extracting at 68 °C for 26 min, and the liquid–solid ratio was 9 mL·g−1). The fatty acid profiles of S. delavayi and S. mukorossi kernel oils showed a high percentage of monounsaturated fatty acids (74.91% and 76.32%, respectively) and a low percentage of polyunsaturated fatty acids (11.11% and 7.83%, respectively) and saturated fatty acids (13.98% and 15.85%, respectively). Most of the properties of the two biodiesels conformed to EN 14214:2014, ASTM D6751–2018 and GB 25199–2017 standards, except for oxidation stability. In general, the results provided the optimized extraction method using ultrasound for the two species oil extraction and proved that the two kernel oils are potentially useful feedstocks for high-quality and low-cost biodiesel production.

1. Introduction

Sapindus L. (soapberry), which includes 13 species, is widely distributed in tropical and subtropical regions of the world including Asia, Australia, and North and South America. Of four Chinese-native species (S. mukorossi, S. delavayi, S. tomentosus and S. rarak), both S. delavayi and S. mukorossi are widespread in southern China. Their overlapping distribution areas include Sichuan, Hubei, Yunnan and Guizhou, but they vary in altitudes, which are 1200–2600 m and 200–1500 m, respectively. Both are deciduous trees and can reach up to 20 m in height. The flowering period is in early summer and the fruit maturity period is in late autumn. The main morphological differences between S. delavayi and S. mukorossi can be observed between their leaves and flowers [1]. In China, soapberry is contiguously distributed and covers more than 1 million hectares. The fruit yield exceeds 1 million tons [2]. At present, the fruit pulp of soapberry is commonly used as a raw material for traditional soap and the extraction of saponins and flavonoids [3,4,5], yet the seeds are not well utilized. Hence, the rational exploitation and utilization of the residue seeds could effectively improve the whole value of the fruit, and oil extraction for biodiesel production seems to be one of the important ways to utilize the seed.
Compared with petroleum diesel, biodiesel has the advantage of environmental protection because of its renewable, biodegradable, and non-toxic characteristics. Previous studies have reported that the combustion of biodiesel could reduce emissions of greenhouse gas, particulate matter and polycyclic aromatic hydrocarbon compounds by 40%–65%, 30%, and 75%–90%, respectively [6,7,8]. As one of the most promising alternative energy sources, biodiesel has become a logical solution to the contradiction of increasing energy demands, environmental protection and socio-economic issues. A higher level of biodiesel blending with fossil diesel-B30- is expected to be promoted as an alternative fuel in the transport sector by the year 2030 [6]. However, due to the high cost of raw materials, the global market for biodiesel has not expanded significantly over the last few years, and more than 95% of world biodiesel production is derived from edible plant oils [9]. Therefore, paying more attention to exploring non-edible woody seed oils as raw materials will benefit promotion of the application and development of biodiesel. Also, it is important to improve and develop biodiesel preparation technology. Among these technologies (e.g., pyrolysis, supercritical fluid, catalytic distillation, transesterification, and microemulsion methods), homogeneous transesterification is still considered to be the most typical and commercial method [10].
Oil extraction is another important step in biodiesel production, which directly affects the final yield. There are some conventional oil extraction methods that include steam distillation (SD), mechanical press (MP) and solvent extraction (SE) [11]. Besides, some modern technologies, such as enzymatic extraction (EE), supercritical fluid extraction (SFE) and microwave-assisted extraction (MAE) have also been applied for oil extraction. Nevertheless, utilizations of these technologies still suffer hindrances in industrial-scale application, from the high operating costs, intricate processing steps, to the dielectric property difference of reaction systems [11,12,13]. As another effective oil extraction technique, ultrasound-assisted extraction (UAE) has been widely used in laboratories and pilot scales with preeminent advantages, such as more effective mixing, less solvent usage, shorter extraction time, and lower energy consumption [14]. From the viewpoints of science and practice, UAE is a very promising extraction technology but for seed oil extraction of S. mukorossi, few applications of UAE have been reported.
Response surface methodology (RSM) is a multivariate optimization technique, which not only has the advantage of considering the interactions between variables, but also reduces the number of experimental treatments to avoid the waste of time and materials [15]. It is necessary to choose an experimental design, to fit an adequate mathematical function, and to evaluate the quality and accuracy of the fitted model to realize process optimization using RSM [15]. Box-Behnken design (BBD) is a commonly used experimental design in RSM requiring fewer experiments than other designs [16]. It excludes the combinations which contain all factors at their highest or lowest levels simultaneously to avoid possible unsatisfactory results due to the experiments being carried out under extreme conditions [17]. The results from previous studies in the fields of industry, analytical applications and bioprocess have proved that BBD-RSM is effective for developing, improving and optimizing processes [18].
In this study, in order to develop and utilize the two non-edible woody oil plant resources in biodiesel production: (1) an ultrasound-assisted extraction for seed oils of the two species was optimized by BBD-RSM; (2) the fatty acid profiles of the two seed oils were quantified and identified; (3) the physicochemical properties of the biodiesel obtained from the extracted seed oils were evaluated. A detailed evaluation was carried out including a determination of oil content and fatty acid composition, an examination of the biodiesel properties and a comparison with the fuel specifications in the ASTM D6751–2018, EN 14214:2014 and GB/T 25199–2017 biodiesel standards.

2. Materials and Methods

2.1. Materials

Fully matured S. mukorossi and S. delavayi fruits were obtained in October 2018 in Jianning County (116°51′47″E, 26°51′56″N), Sanming City, Fujian Province, and Lincang City (102°40′38″E, 23°40′16″N), Yunnan Province, China, respectively. There are some differences in fruit characteristics between the two species which are listed in Table 1. The whole experimental procedure included: (1) removal of the pericarp from fruits for seeds; (2) drying the seeds at 40 °C for 5 days; (3) taking the dry kernels out of the stiff seed shells using a hammer; (4) crushing the seed kernels using a pulverizer and sieving them using a 30-mesh stainless steel sieve (pore size 0.6 mm) to gain classified powder; (5) oil extraction; (6) collecting the extracted crude oil in amber wide-mouth glass packer bottles under cool conditions; (7) detecting fatty acid composition in part of the crude oil and preparing the remaining oil for biodiesel production.
All standard chemicals (pure fatty acid methyl ester, etc.) were purchased from Sigma Chemical Co., USA. Methanol, potassium hydroxide, petroleum ether, sulphuric acid and all other reagents (AR) were purchased from Sinopharm Chemical Reagent Co., Ltd., Beijing.

2.2. Ultrasound-Assisted Extraction (UAE)

Based on the results of a previous study [19], petroleum ether (boiling point 60–90 °C) is more suitable for soapberry kernel oil extraction than n-hexane due to its low cost, efficient extraction, and simple recovery. So, petroleum ether (boiling point 60–90 °C) was selected as the solvent in this study.
Soapberry seed powder (10 g) mixed with extractant was added in a round-bottom flask with reflux condenser and placed into the KQ-3200DB ultrasonic clearer bath (40 kHz frequency; internal dimension, 300 × 240 × 150 mm) (Kunshan Ultrasonic Instrument Co., Ltd., Jiangsu, China). The liquid level in the flask should be lower than that of the cleaner tank. Seed kernel oil was extracted under different conditions for the evaluation of the effect of the process variables (ultrasonic power, extraction temperature, extraction time, and liquid–solid ratio). The levels of each variable were determined based on the preliminary single-factor experiments (Figure A1 and Figure A2). After the extraction process, the solid residues were separated by filtration and the solvent was recycled by the RE-52AA rotary evaporator equipped with a vacuum pump (Shanghai Yarong Biochemistry Instrument Factory, Shanghai, China) at 50 °C. Finally, the solution was dried in an oven at 100 °C for 30 min to reach the constant weight and then weighed.

2.3. Determination of Extraction Yield

The oil yield was calculated according to Equation (1).
Oil   yield = W O / W S
where WO is the weight of extracted oil (g), and WS is the weight of seed kernel (g).
The Practum313–1CN analytical balance with a readability of 0.001 g (Sartorius Group, Göttingen, Germany) was used to weigh accurately.

2.4. Optimization of Ultrasonic-assisted Extraction

Based on the results of single-factor experiment, a four-factor (ultrasonic power, X1; extraction temperature, X2; extraction time, X3; liquid–solid ratio, X4), three-level (−1, 0, +1) BBD with RSM was applied to identify the optimal conditions for obtaining a high oil yield. Experiments were performed with two independent variables changed and the others fixed at the middle level. According to the principle of the Box–Behnken center combination experiment, the response surface experiment consisted of 29 treatments including five replicates of the central point. The coded and encoded variables are presented in Table 2. Each experiment was performed in triplicate, and then the oil yields (actual value, Y1; predicted value, Y2) were considered as the response, and are also provided in Table 2.
A second-order polynomial model proposed for predicting the values of response variable was expressed according to Equation (2):
Y = β 0 + i = 1 4 β i X i + i = 1 4 β i i X i 2 + i j = 1 4 β i j X i X j ,
where Y is the experimental response; β 0 is a constant; βi, β i i and β i j are the linear, quadratic and interactive coefficients of the model, respectively. X i and X j are the independent variables.
All experimental data were analyzed using the Design-Expert 8.0.6 software (Stat-Ease Inc., Minneapolis, MN, USA) to plot the response surfaces and establish the mathematical model. The adequacy of the model was checked by evaluating the coefficient of determination (R2), adjusted coefficient of determination (adj. R2), coefficient of variation (C.V.) and the F-test value. The significance level of the model was based on the p-value with a 95% confidence level. The optimum condition for oil extraction was calculated according to the desirability function.

2.5. Fatty Acids Composition

The fatty acid profiles were determined by gas chromatography-mass spectrometer (GC-MS) using GCMS-QP2010 ultra (Shimadzu, Kyoto, Japan) and a highly polar TR-Waxms 30 m capillary column (inner diameter 0.25 mm, film thickness 0.25 µm) at a split ratio of 1:10. High purity helium (99.999% purity) was used as the carrier gas at a flow rate of 1 mL/min. The operation conditions of the chromatographic analysis were as follows—the initial column temperature was held at 100 °C for 2 min, then increased to 180 °C at 15 °C/min, and then to 230 °C with a rate of 2 °C/min for 10 min; the injector temperature was 250 °C; the injection volume of the sample was 1 µL. The mass spectrometric conditions were as follows—the energy of electron ionization (EI) mode was 70 eV; the temperatures of the interface and ion-source were 240 °C and 220 °C, respectively; the solvent cut time was 3 min; the mass scanning range was set as m/z 45~500.
Different fatty acids were identified by comparing their retention times with fatty acid methyl ester standards and their mass spectral characteristics with the NIST 05a mass spectral library database. The fatty acids were quantified by the peak area normalization method and expressed as the relative percentage of each fatty acid to the total fatty acids.

2.6. Preparation of Biodiesel

Biodiesel was obtained from esterification and transesterification reactions, and the process is illustrated in Figure 1. For the esterification pretreatment, methanol and vegetable oil at 6:1 molar ratio was taken in the reaction flask with 1 wt% of H2SO4 as acid catalyst when the reaction temperature was heated up to 60 °C. The reaction lasted for 1 h. After the reaction, a mixture of the lower layer was obtained and dried for the alkaline transesterification process.
The mixture (esterified oils) was performed for another hour using a 6:1 molar ratio of methanol to oil with 1 wt% of KOH as a catalyst at a reaction temperature of 60 °C. The final result was a two-phase separation in which the two distinct layers were glycerol (lower layer) and methyl ester (upper layer). The ester phase was washed 5–6 times with warm distilled water to remove residues (including methanol, KOH, or glycerol). Finally, the S. delavayi methyl esters (SDMEs) and S. mukorossi methyl esters (SMMEs) were obtained after the drying process by passing over anhydrous magnesium sulfate.

2.7. Properties of Biodiesel

Biodiesel standards include the standard testing methods and specifications. The United States and European Union standards are widely used as a reference or foundation for further analysis or standard preparation [10]. All fuel properties of biodiesel involved in this study were measured according to the standards set by the American Society for Testing and Materials (ASTM) and the European Union (EN/EN ISO). Specifically, density (ASTM D4052), calorific value (DIN EN 51900), water content (EN ISO 12937), kinematic viscosity (ASTM D445), flash point (ASTM D93), cold filter plugging point (ASTM D6371), sulfur content (ASTM D5453), sulfated ash content (EN ISO 3987), copper strip corrosion (EN ISO 2160), cetane number (ASTM D613), oxidative stability (EN 14112), acid value (EN 14104), free glycerin (ASTM D6584), and total glycerin (ASTM D6584) were determined by the standard method in the parentheses. At last, the values of all properties were evaluated under the ASTM D6751−2018 (in U.S.), EN 14214:2014 (in European Union) and GB/T 25199–2017 (in China) specifications.

3. Results

3.1. Parameters Optimization for Oil Extraction by Response Surface Methodology

3.1.1. Model Fitting and Analysis of Variance

Based on the experimental data presented in Table 2, the two regression models that best described the oil extraction process from S. delavayi and S. mukorossi kernels were given by Equations (3) and (4):
Y = 42.97 + 0.88 X 1 + 0.55 X 2 + 1.06 X 3 + 0.73 X 4 + 0.057 X 1 X 2 + 0.46 X 1 X 3 + 0.20 X 1 X 4 + 0.0075 X 2 X 3 + 0.23 X 2 X 4 + 0.063 X 3 X 4 1.41 X 1 2 0.72 X 2 2   1.27 X 3 2   0.84 X 4 2
Y = 45.46 + 1.00 X 1 0.20 X 2 + 1.15 X 3 + 0.79 X 4 0.005 X 1 X 2 + 0.46 X 1 X 3 + 0.19 X 1 X 4 0.053 X 2 X 3 0.20 X 2 X 4 + 0.12 X 3 X 4 1.60 X 1 2 0.69 X 2 2   1.21 X 3 2 0.98 X 4 2 .
The regression coefficients of different independent variables and the corresponding p-values are summarized in Table 3. The p-value was used as a tool to examine the significance of the investigated factors. The smaller the p-value was, the more significant the difference the corresponding variables displayed. It could be seen that the X1, X2, X3, X4, X1 × 3, X1 × 4, X2X4, X12, X22, X32, and X42 were significant with small p-values (P < 0.05) for the oil yield of S. delavayi and the X1, X3, X4, X1X3, X12, X22, X32, and X42 were significant for the oil yield of S. mukorossi. The determination coefficients (R2) were 0.9920 and 0.9638, respectively, which indicated that only 0.80% and 3.62% of the variability was not explained by the two models. The adjusted determination coefficients (0.9839 and 0.9276, respectively) of two models were both significant. The “Pred R-Squared” values of 0.9572 and 0.8076 were in reasonable agreement with the “Adj R-Squared” values. The F-values for “lack of fit” were 3.52 and 3.37, and implied that this term was not significantly relative to the pure errors of the two models, which were desirable. “Adequate precision” expressed the signal to noise ratio and the ratios (32.348 and 15.434, respectively), both higher than 4, were satisfactory. The results of the ANOVA clearly indicated that the two regression models fitted the experimental data well and could be used to predict the actual oil yield.

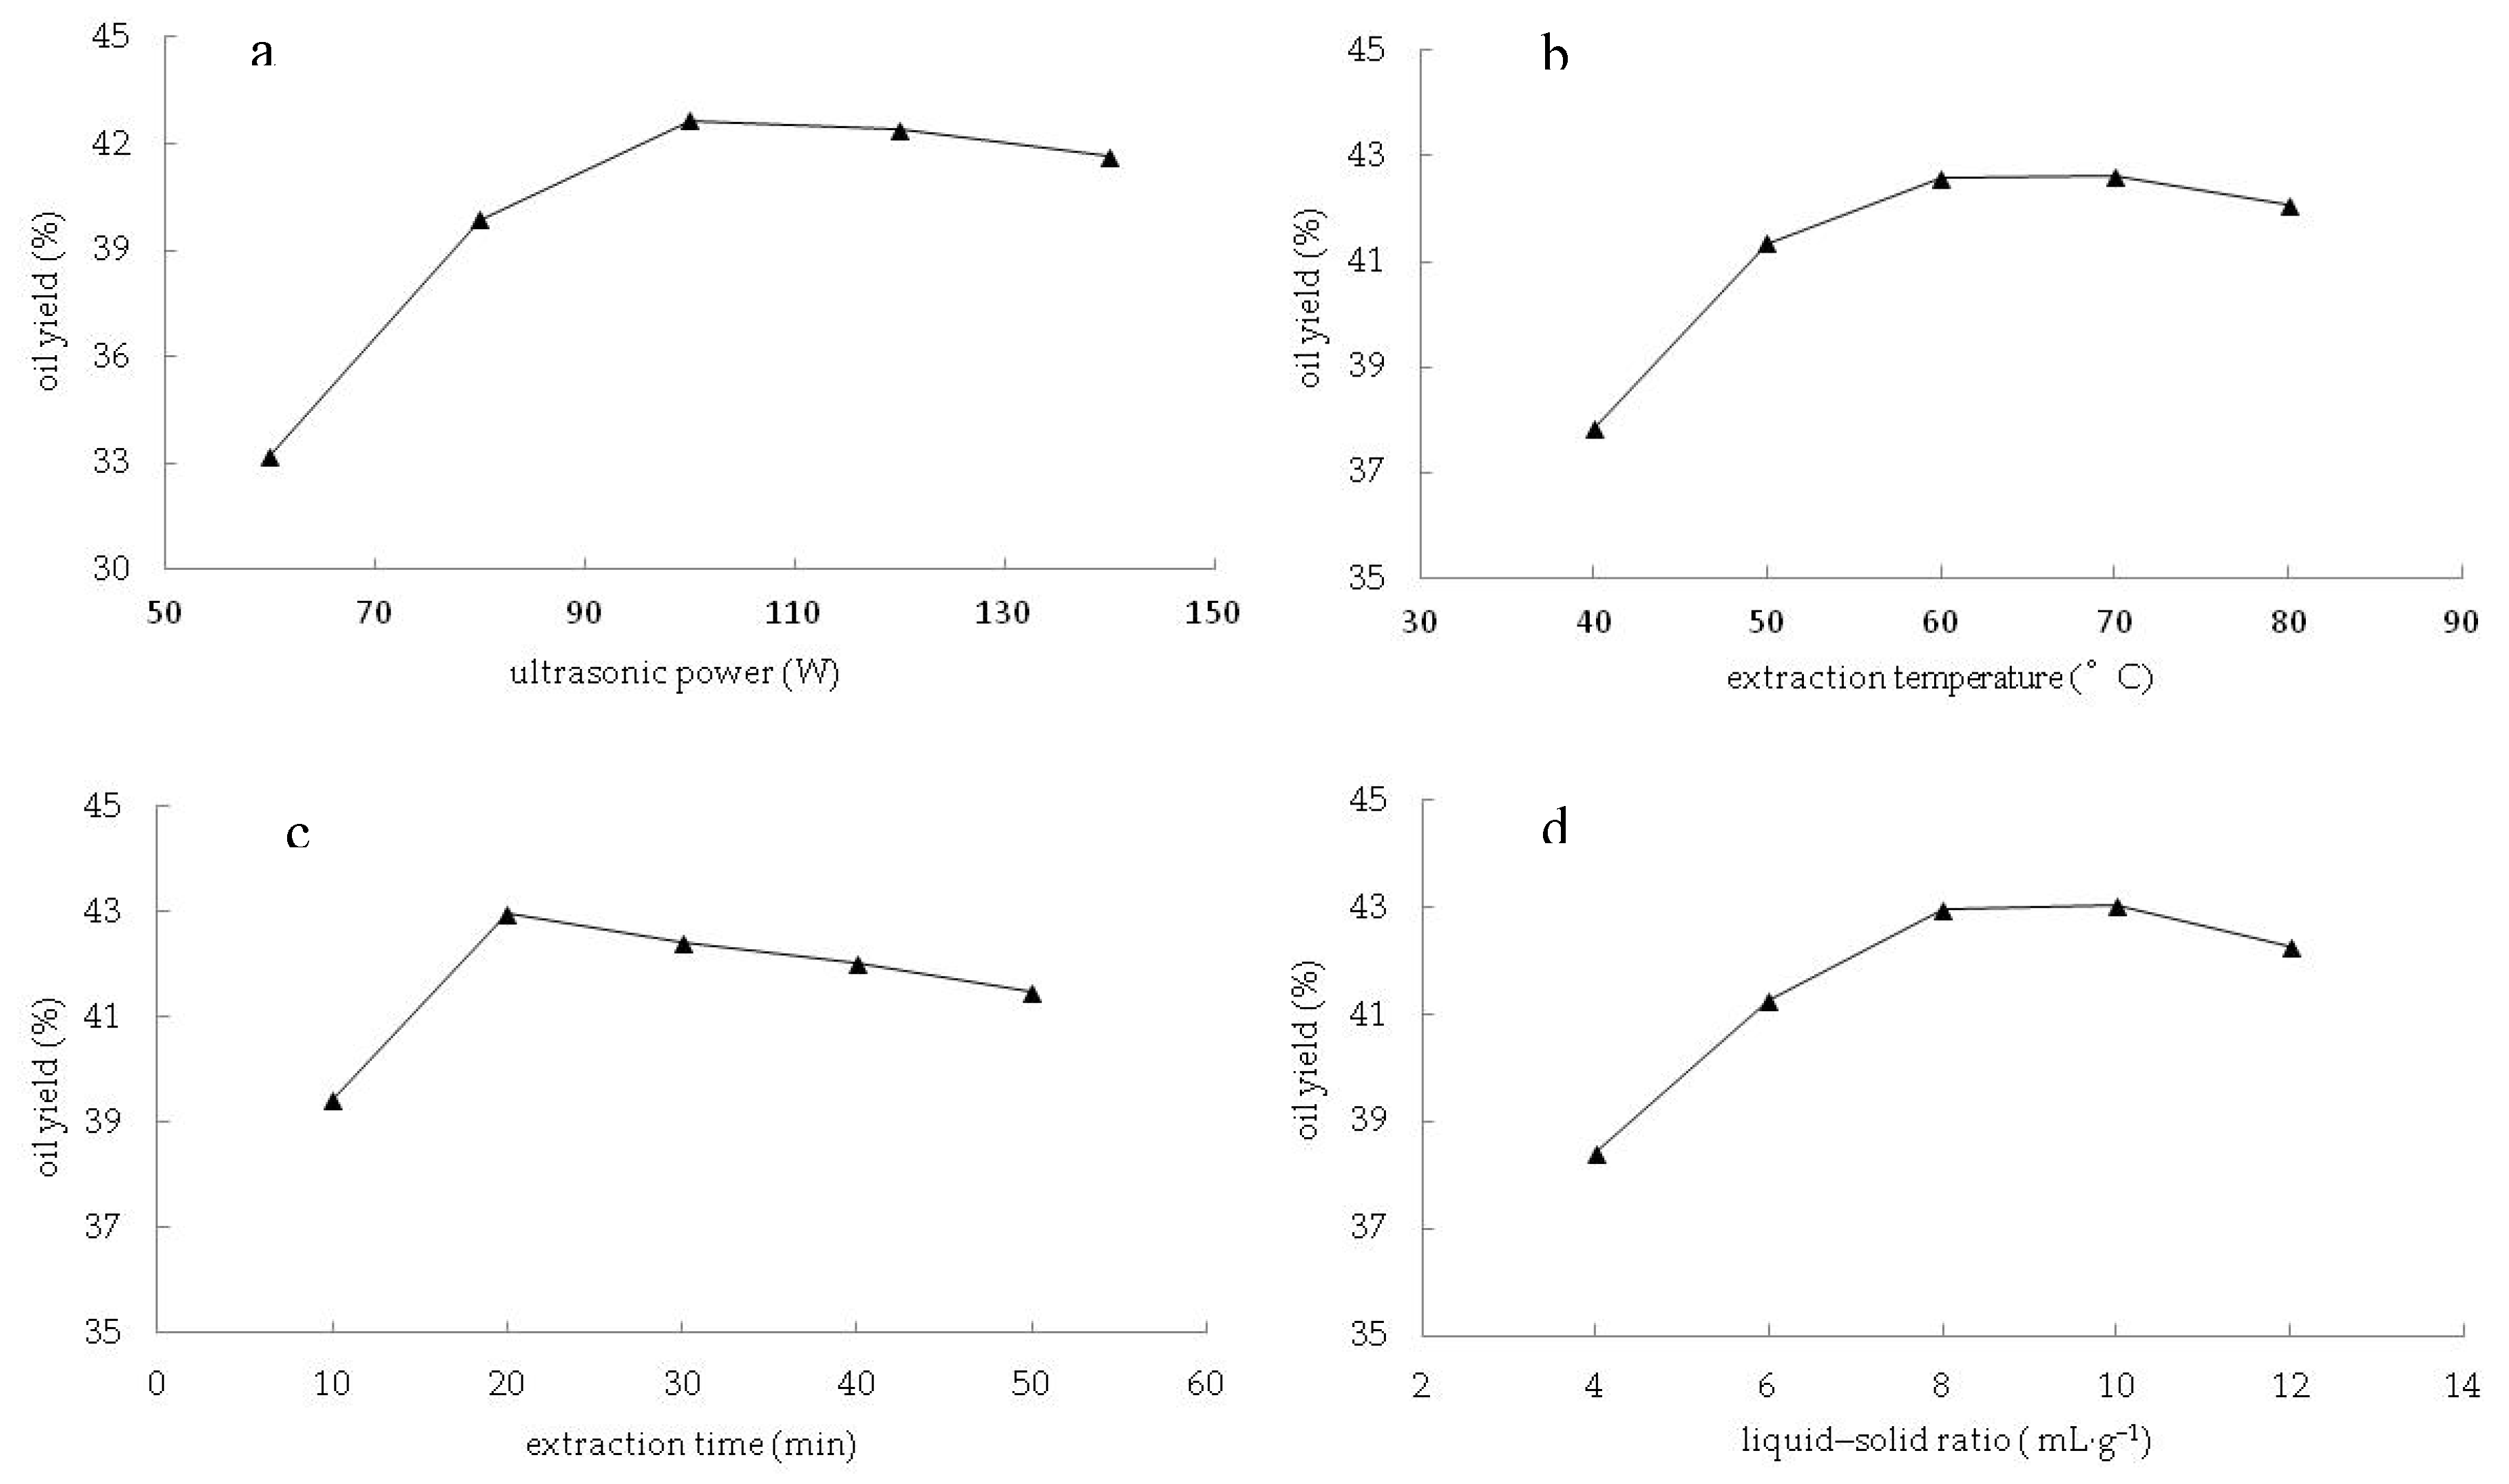
3.1.2. Influence of the Parameters on the Oil Yield and Verification of Optimum Conditions

From the F-value of each model term, four factors influenced the kernel oil yield as follows—extraction time > ultrasonic power > liquid–solid ratio > extraction temperature. The extraction time was the major contributing factor to the oil yield from the two species kernels. The influence of the variable interaction on the oil yield was graphically represented by 3D response surface plots (Figure 2) generated by the model.
Figure 2a depicts the effect of ultrasonic power and extraction time on the oil yield of S.delavayi with an extraction temperature of 60 °C and a liquid–solid ratio of 8:1. At higher ultrasonic power, the oil yield of S. delavayi increased rapidly and then kept steady with an increase in extraction time from 10 to 30 min; similar results have been found when increasing the ultrasonic power (80 to 120 W) over longer extraction times. However, at lower ultrasonic power, the oil yield increased slightly and then decreased slowly with an increase in extraction time from 10 to 30 min; the same result could also be achieved when increasing the ultrasonic power (80 to 120 W) over shorter extraction times. With higher ultrasonic power or longer extraction time, the oil yield obviously increased and then decreased. The maximum oil yield was obtained with 107.84W (ultrasonic power) and 24.90 min (extraction time). Figure 2b presents the effect of ultrasonic power and liquid–solid ratio on the oil yield of S. delavayi when the extraction temperature (60 °C) and extraction time (20 min) were fixed at the zero level. The oil yield initially increased with increasing ultrasonic power and liquid–solid ratio, and a maximum oil yield was achieved with ultrasonic power of 106.91W and a liquid–solid ratio of 8.94:1; however, beyond 106.91W and 8.94:1, the oil yield decreased. It could be inferred that ultrasonic power and liquid–solid ratio produced duple effects on the oil yield. Figure 2c illustrats the effect of extraction temperature and liquid–solid ratio on the oil yield of S. delavayi at fixed ultrasound power (100 W) and extraction time (20 min). With the increase of extraction temperature and liquid–solid ratio, the oil yield increased accordingly and then decreased slightly. The maximum oil yield was obtained with 64.64 °C (extraction temperature) and 8.99:1 (liquid–solid ratio). As shown in Figure 2a–c, the variable interaction between ultrasonic power and extraction time is more important for the oil extraction of S. delavayi. The 3D response surface curves in Figure 2d demonstrate the mutual effect of ultrasonic power and extraction time on the oil extraction of S. mukorossi at an extraction temperature of 70 °C and a liquid–solid ratio of 8:1. When the extraction time was fixed at a higher level, the oil yield increased rapidly and nearly peaked with an increase in ultrasonic power; similar results have been found when increasing the extraction time at the higher level of ultrasonic power. The maximum oil yield was obtained with 113.90W (ultrasonic power) and 25.50 min (extraction time). With the continuous increase of ultrasonic power or ultrasonic time, the oil yield decreased. In this study, only the ultrasonic power and extraction time have a significant interactive effect on the oil extraction yield of S. mukorossi.
According to the second-order polynomial models (Equations (3) and (4)) built above, the predicted oil yield of S. delavayi could be calculated as 43.80% under the optimum conditions (the ultrasonic power was 108.95W and extracting at 64.97 °C for 25.15 min, with a liquid–solid ratio was 9.14 mL·g−1), the predicted oil yield of S. mukorossi could be calculated as 46.23% under the optimum conditions (the ultrasonic power was 114.26W and extracting at 67.57 °C for 25.87 min, and the liquid–solid ratio was 9.01 mL·g−1). Considering operation practicability, ultrasonic power, extraction temperature, extraction time and liquid–solid ratio were revised to 109W, 65 °C, 25 min and 9:1, respectively, for oil extraction of S. delavayi, and the above variables were set to 114W, 68 °C, 26 min and 9:1, respectively, for oil extraction of S. mukorossi. To check the accuracy of the two models, three verification experiments were performed under the assigned conditions. The average values of the oil yield of S. delavayi and S. mukorossi acquired through the validation experiments were 43.67% ± 0.16% and 45.96% ± 0.21%, respectively, which were close to the predicted values. Thus, the response surface methodology models were reliable for optimizing the oil extraction conditions and could be used to predict the oil yield. The differences in oil yield of the two species could be caused by the varietal differences. Sun et al. [20] identified 13 ISSR loci associated with the kernel oil content of soapberry.

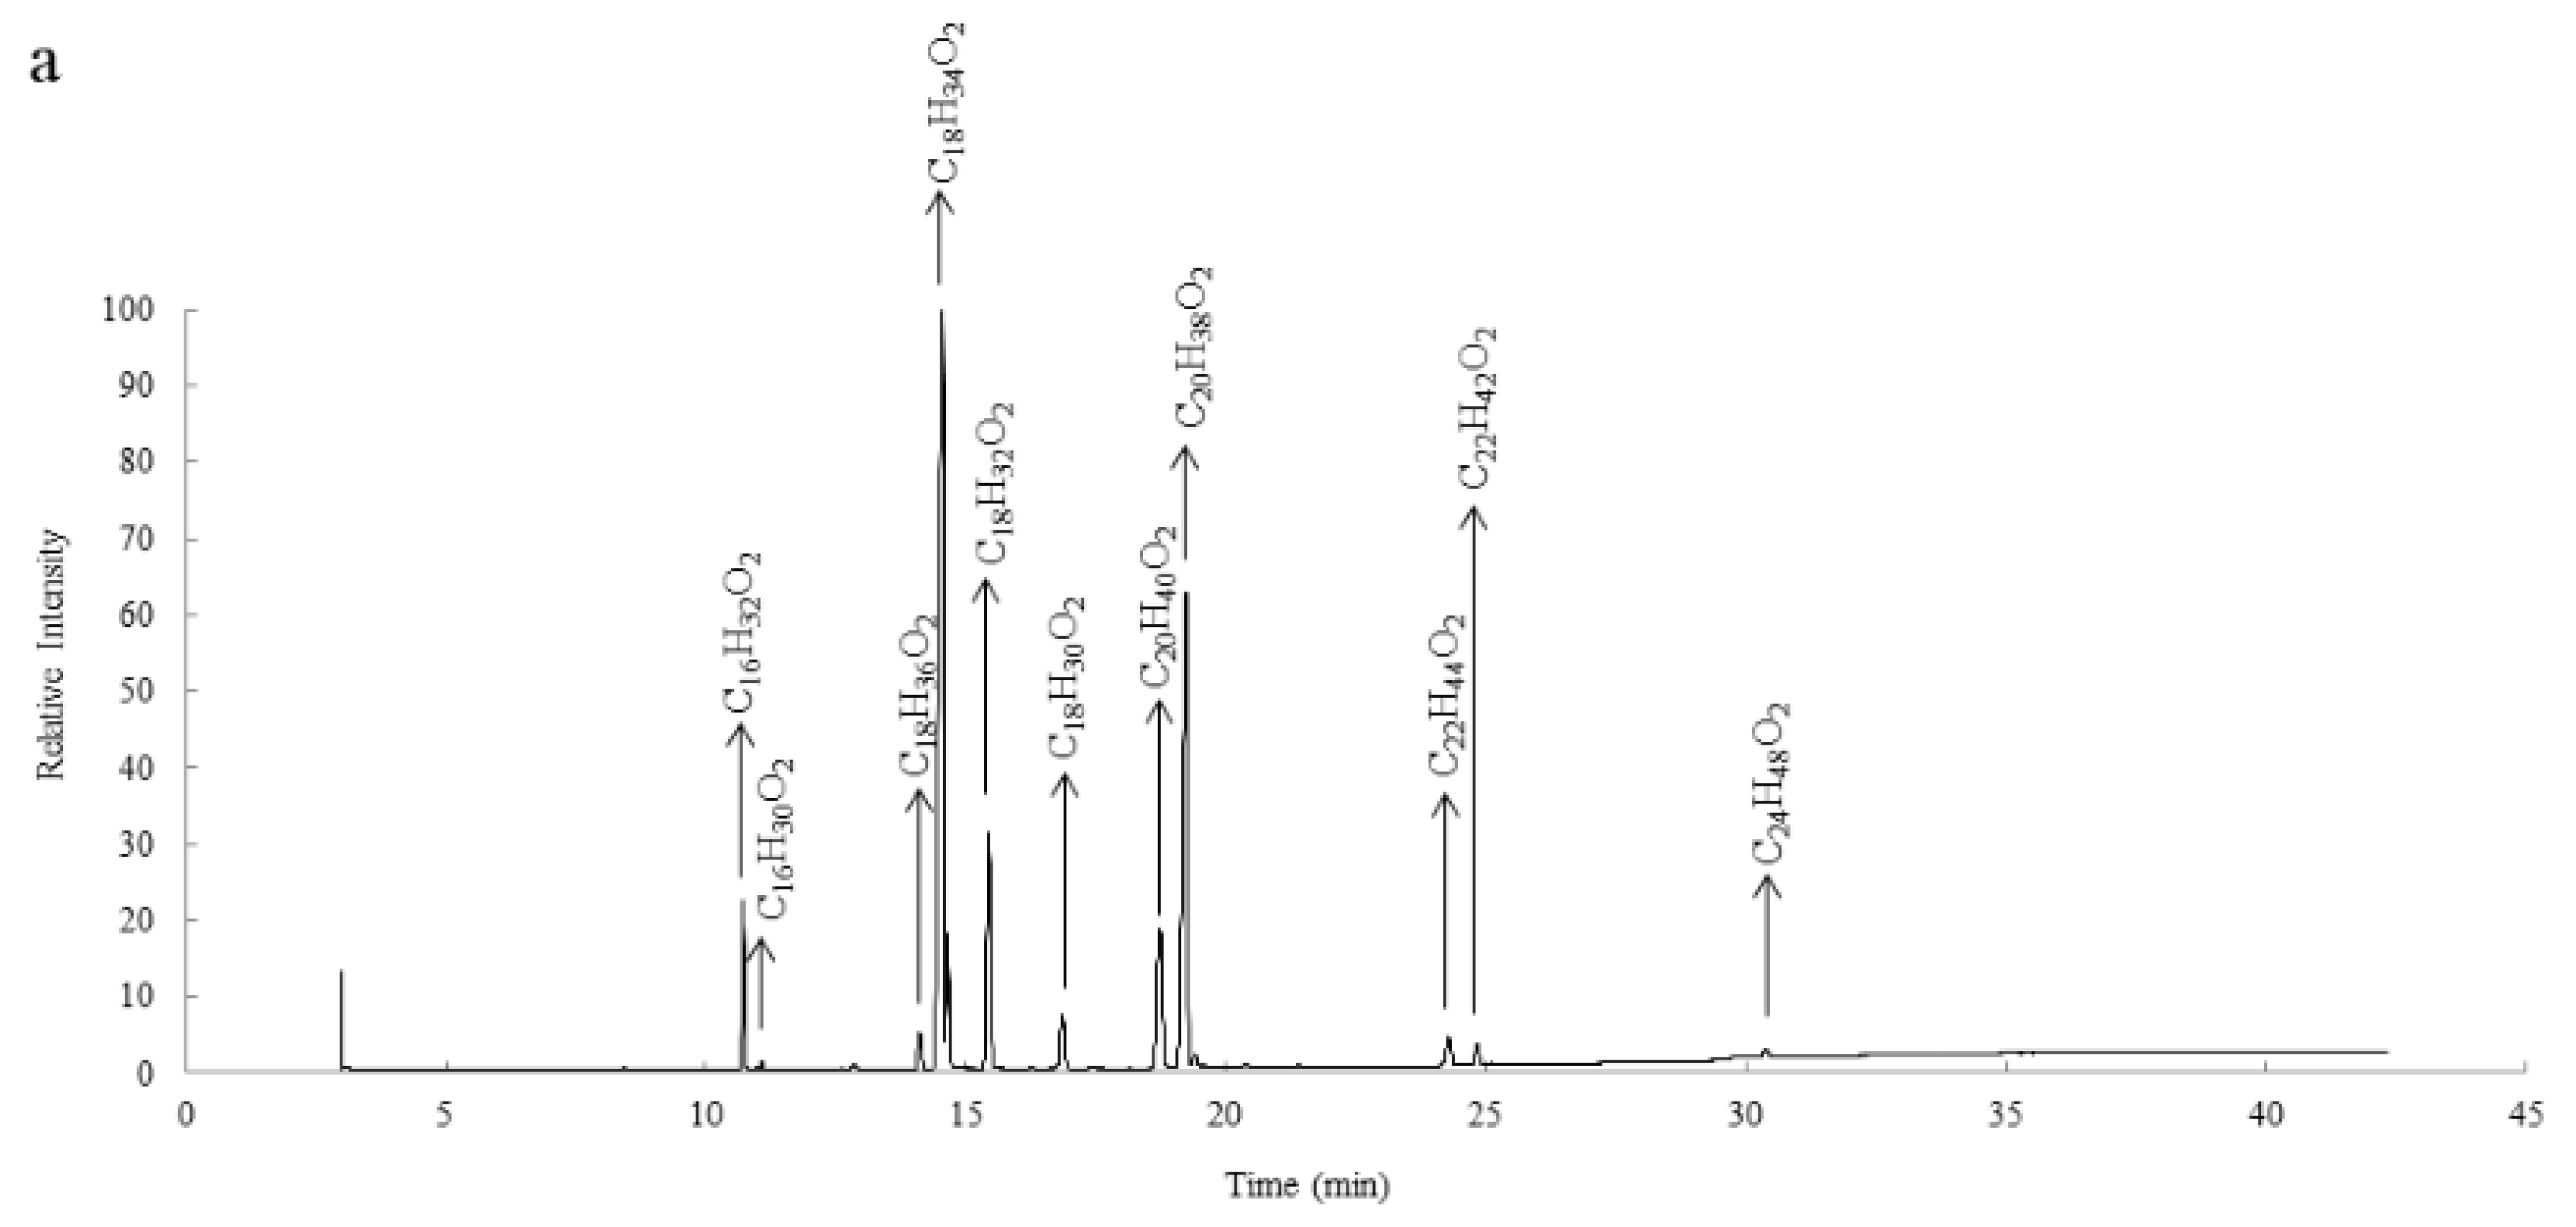
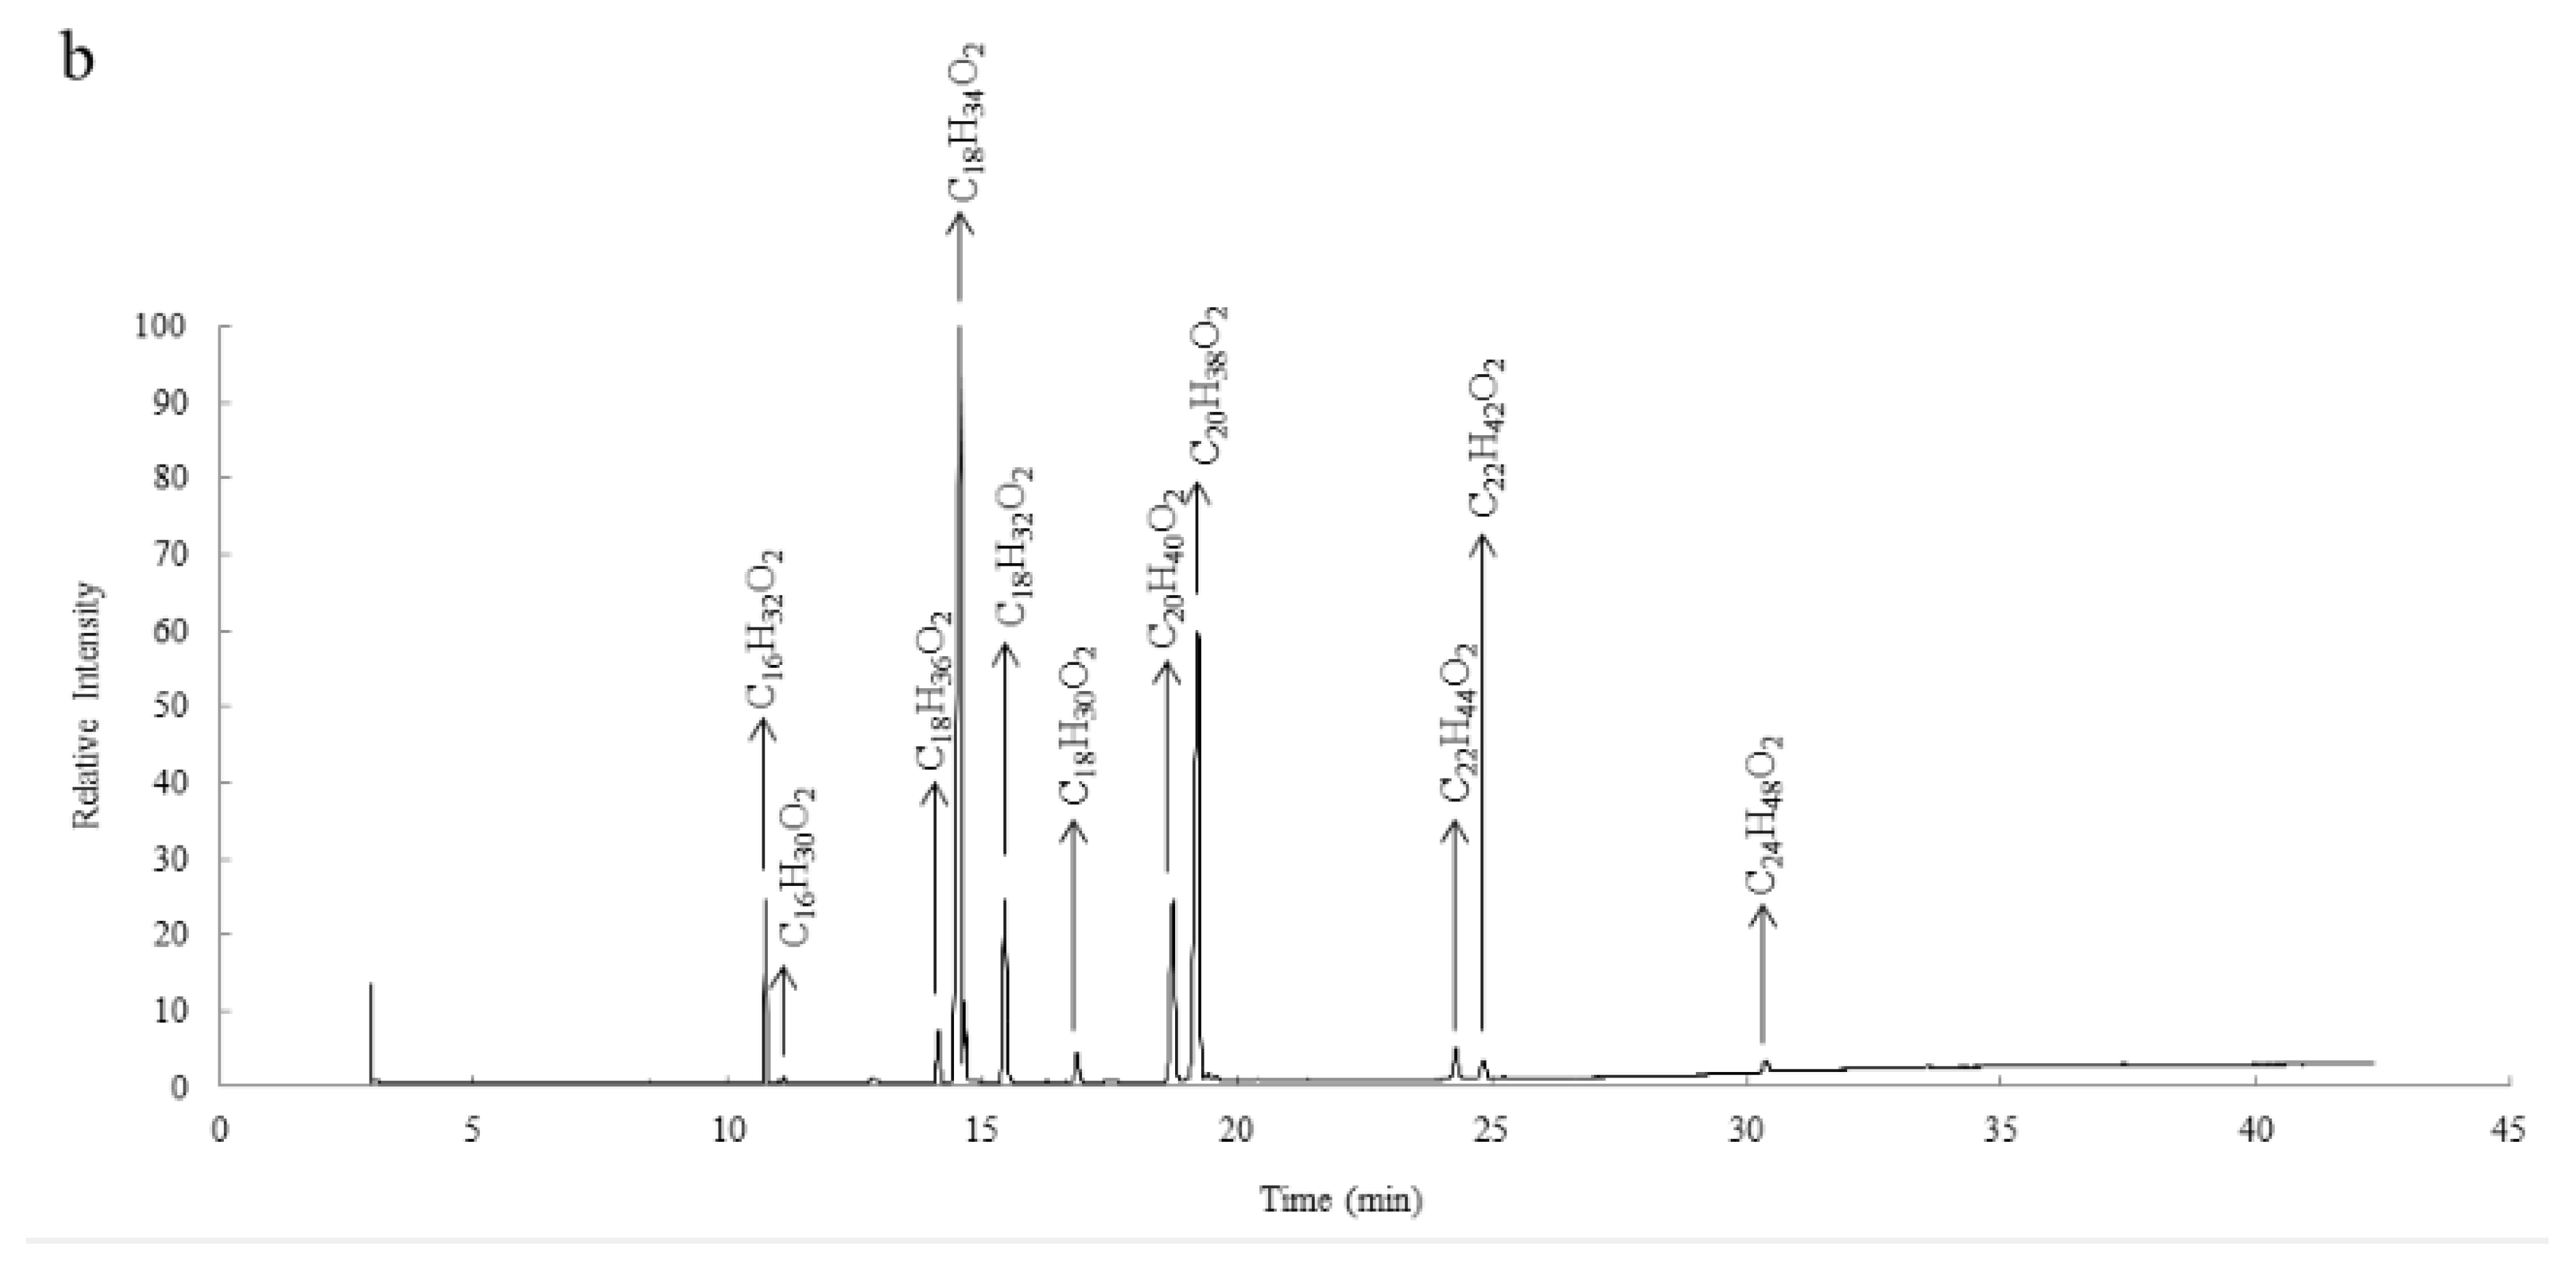
3.2. Fatty Acids Composition of S. delavayi and S. mukorossi Kernel Oils

The total ion chromatogram of the two kernel oils are depicted in Figure 3. The fatty acid profiles of S. delavayi and S. mukorossi kernel oil are shown in Table 4.
A total of 11 fatty acid methyl esters from the two kernel oils were automatically detected and identified by GC-MS (Figure 3). The effluent time of the same fatty acid components of the two kernel oils is almost the same. The palmitic acid methyl ester was eluted first with a retention time of 10.7 min, as can be seen in the chromatogram, followed by the peaks corresponding to the methyl esters of the acids—palmitoleic (11.1 min), stearic (14.1 min), oleic (14.6 min), linoleic (15.4 min), linolenic (16.9 min), arachidic (18.7 min), eicosenoic (19.2 min), behenic (24.3 min), erucic (24.8 min), and lignoceric (30.4 min).
As shown in Table 4, the saturated fatty acid content of S. delavayi kernel oil was 13.98%, and the unsaturated fatty acid content was 86.02%. Amongst the saturated fatty acids, arachidic acid was the highest (6.28% ± 0.29%), followed by palmitic acid (4.83% ± 0.17%), stearic acid (1.43% ± 0.06%), behenic acid (1.09% ± 0.08%), and lignoceric acid (0.35% ± 0.07%). Amongst the unsaturated fatty acids, oleic acid (52.32% ± 1.28%) was the most dominant, followed by eicosenoic acid (21.45% ± 0.81%), linoleic acid (8.45% ± 0.72%), linolenic acid (2.66% ± 0.32%), erucic acid (0.86% ± 0.17%), and palmitoleic acid (0.28% ± 0.04%). The main fatty acids composition of S. mukorossi kernel oil was determined as oleic acid (55.21% ± 1.83%), eicosenoic acid (20.03% ± 1.12%), arachidic acid (7.15% ± 0.37%), linoleic acid (6.63% ± 0.54%), palmitic acid (5.32% ± 0.31%), stearic acid (1.81% ± 0.17%), linolenic acid (1.20% ± 0.16%), behenic acid (1.18% ± 0.11%). Palmitoleic acid, erucic acid, and lignoceric acid were also noticed in trace amount. The fatty acid profiles of the two oils are similar. The polyunsaturated acid content of S. delavayi oil is slightly higher than that of S. mukorossi oil, while the contents of saturated and monounsaturated acids are slightly lower.

3.3. Fuel Properties

The property values of SDMEs and SMMEs were determined and compared with previous studies, and the results were also compared to the biodiesel standards: GB 25199–2017, ASTM D6751–2018, and EN 14214:2014 (Table 5).
Density plays a crucial role in influencing the efficiency of the fuel atomization in airless combustion systems and in determining the fuel injection property [21]. The biodiesel standards for density are set as 860–900 kg·m−3 at 15 °C in EN 14214:2012 and 820–900 kg·m−3 at 20 °C in GB 25199–2017, but there is no specification for density in the ASTM D6751. From Table 5, the density of S. delavayi methyl esters (882 kg·m−3) was little higher than that of S. mukorossi methyl esters (879 kg·m−3), which both met the range specified in the standards.
Kinematic viscosity (KV) is an indicator defined as the resistance of liquid to flow, and it affects the operation of the fuel injection equipment as well as the spray atomization at low temperatures [22]. The values of KV of the biodiesels are specified by ASTM D6751–2018 (1.9–6.0 mm2·s−1), EN 14214:2014 (3.5–5.0 mm2·s−1), and GB 25199–2017 (1.9–6.0 mm2·s−1). The results of two biodiesels shown in Table 5 were within these standards.
The calorific value (CV) indicates the energy content in the fuel per unit mass, which also determines the suitability of biodiesel as an alternative to diesel fuels [23]. Both ASTM D6751 and GB 25,199 standards do not have any specification for CV, but EN 14,213 prescribes that a minimum of 35 MJ·kg−1 is required [22]. The measured values of S. delavayi and S. mukorossi methyl esters (39.63, 39.96 MJ·kg−1) were both within the specification limit.
The cold filter plugging point (CFPP) is commonly used as a major indicator of the low temperature operability of fuels and refers to the temperature at which a fuel jams a filter due to the formation of crystalline agglomerates [22]. A lower value of CFPP implies better flow properties at cold temperatures. The EN 14214:2014 standard does not specify a certain value for the parameter in its specification list, but recommends setting limiting values for different times of year depending on the local climate conditions. The ASTM D6751–2018 does not set a limit for CFPP and GB 25199–2017 standard requires its value to be reported. The measured values of S. delavayi and S. mukorossi biodiesels were 4 °C and 5 °C, respectively.
The cetane number (CN) is used to indicate a fuel’s ignition characteristics or the ability of the fuel to auto-ignite quickly after being injected [22]. A higher CN value means shorter ignition delay and better ignition, so the CN value has become an important indicator for biodiesel feedstock screening. The CN values of S. delavayi and S. mukorossi biodiesels were determined to be 53 and 54 (Table 5), which is in accordance with the three standards that prescribe a minimum of 47 (ASTM D6751–2018), 51 (EN 14214:2014), 49 (S50), and 51 (S10) for different categories differentiated by the content of sulfur in GB 25199–2017.
The oxidation stability (OS) of biodiesel is another important parameter, and it is always used for indicating the degree of oxidation and potential reactivity with air, thus it is necessary to determine the requirement to add antioxidants. Oxidation occurs due to the presence of heat, traces of metal, peroxides, light, unsaturated fatty acid chains, and the double bonds, which react with oxygen as soon as it is exposed to air, so biodiesel fuels are more susceptible to deteriorating easily than fossil fuels [22]. Table 5 shows that the measured values of S. delavayi and S. mukorossi biodiesels (3.6 and 3.9 h) in this work could meet the minimum value prescribed in the ASTM D6751–2018, but not the EN 14214:2014 and GB 25199–2017.
Flash point (FP) is the lowest temperature at which the fuel will ignite when exposed to a flame or spark. The FP of biodiesel was higher than the prescribed limit of diesel fossil fuel, which is safe for transport, handling, and storage purposes [21]. In this study, the FP value of S. delavayi biodiesel was 5 °C higher than that of S. mukorossi biodiesel, which both exceeded the minimum values prescribed in specifications (Table 5).
Other fuel properties of S. delavayi and S. mukorossi biodiesels, such as acid value, sulfur content, sulfated ash content, copper strip corrosion, free glycerin, total glycerin, and water content were all determined (Table 5). These parameters are also important for evaluating the biodiesel’s performance. It can be seen from Table 5 that all of these aforementioned properties of S. delavayi and S. mukorossi biodiesels satisfied the ASTM D6751–2018, EN 14214:2014, and GB 25199–2017 standards.
Additionally, the EN 14214:2014 standard dictated that the content of linolenic acid and fatty acids possessing four double bonds should be lower than 12% and 1%, respectively. Correspondingly, no fatty acids containing four double bonds were found in S. delavayi and S. mukorossi oil-based biodiesels, and the content of linolenic acid determined in this work was considerably lower than that demanded by the EN 14214:2014 specification.

4. Discussion

4.1. Effect of Process Parameters and Process Optimization

Different extraction variables have different effects on the extraction process. For the ultrasonic oil extraction process, ultrasonic power, extraction temperature, extraction time and liquid–solid ratio are very important influencing factors. In this study, the oil yield obviously increased with higher ultrasonic power or longer extraction time. The reasons are as follows: (1) the cavitation bubbles form, grow, expand and collapse continuously which disrupts the cell walls and leads to the movement of solute into the solvent; (2) the adequate mixing of sample and solvent results in the accelerated diffusion of oil from the sample matrix to the solvent phase. However, with the continuous increase of ultrasonic power or extraction time, the oil yield decreased. The possible reason was that the tissue, with a large surface area produced by cell wall disruption, reabsorbed oil into the tissue particles [24,25]. A similar result was observed by Liu et al. [26] and Hu et al. [27] for the extraction of Paeonia lactiflora kernel oil and tea (Camelia sinensis) seed oil, respectively. A similar trend could be found in the investigation of the influence of ultrasonic power and liquid–solid ratio on extraction yield. As the main driving force for extraction, the increase of concentration gradient between the solute and solvent enhances the diffusion rate, keeps the soluble components better dissolved and makes the extraction process more efficient [28,29]. Diffusion stops when there is no concentration gradient. The influence of extraction temperature and liquid–solid ratio on extraction yield seemed complicated. Previous studies suggested that the number of cavitation bubbles might create a cohesive force at higher temperatures and then reduce the tensile strength of the liquid [24,30]. Therefore, higher temperatures could reduce oil yield by the decreased cavitation intensities. The result obtained in the present study is consistent with the report of Tian et al. (2013) [24].
Numerous previous studies have evaluated the effectiveness of UAE application. The results of the first semi-industrial scale UAE technique study on virgin olive oil extraction further underlines UAE as a tangible and effective alternative to conventional processes, which could improve the quality and the commercial value of the product and increase its extraction yield [31]. Mohammadpour et al. [32] reported that UAE increased the Moringa peregrina seed oil yield (53.101%) compared with the Soxhlet extraction (SXE) (43%), while the extraction time was much shorter (26.3 min vs. 11 h). Górnaś et al. [33] showed the result that SXE, SFE and cold-pressing extraction (CPE) assays were less efficient in comparison with UAE on average by 3%, 21%, and 27% for seed oil recovery from Japanese quince (Chaenomeles japonica), respectively. In this study, the extraction yields of S. delavayi and S. mukorossi kernel oils could reach 43.67% and 45.96% under the optimized UAE conditions, respectively. However, the publicly reported results showed that the S. mukorossi kernel oil yields obtained by CPE [34], SXE [35,36] and MAE [35] were 30%, 28.34%–44.69% and 36.21%, respectively. Liu et al. [37] optimized the aqueous enzymatic-ultrasonication extraction process for S. mukorossi kernel oil yield and the extraction yield was 36.78% ± 2.25%. Without considering the influence of gene and geographic variation, the UAE method used for S. mukorossi kernel oil yield is efficient. The result was similar to that of previous studies, that is, UAE improves the extraction efficiency by reducing extraction time and solvent consumption. In general, the UAE technique is an effective and indeed feasible method for soapberry kernel oil production from an industrial point of view.

4.2. Effects of Seed oil Components on the Biodiesel Properties

Fatty acid composition of the feedstock does not significantly change during the transesterification reaction by which biodiesel is obtained [38]. Therefore, the feedstock’s fatty acid characteristics (structural features and composition of the fatty acids) strongly affected the critical physicochemical properties of biodiesel (combustion performance, flow property and storage stability). A better understanding of the structure-physical property relationships in fatty acids is of particular importance when choosing suitable feedstocks that will give the desired biodiesel quality [39].
The combustion performance of biodiesel could be reflected in its CV and CN. CV characterizes the energy content of fuels and their combustion efficiency. The unsaturation degree of fatty acid has a stronger effect upon CV than carbon chain length. Ramírez-Verduzco et al. [40] reported that the CV decreases by approximately 0.21 MJ/kg for each increase in the unsaturation degree of fatty acid methyl esters. The unsaturated esters have higher volumetric energy amount (MJ/gal.) and lower mass energy amount (MJ/kg) which compared with saturated esters [39]. Higher CN implies shorter ignition delay, lower combustion noise, higher power, less gaseous and particulate exhaust emissions, and better cold start behavior [41]. A number of studies showed that CN was enhanced with the increasing saturation and chain length [42]. The more unsaturated the molecules along with shorter fatty acid chains, the lower the CN is [41]. Zhang et al. [43] found that CN was extremely negatively correlated with unsaturation degree but extremely positively correlated with long chain saturated factor.
KV and CFPP are two key indicators of the biodiesel flow property. High KV can cause larger droplets, poorer vaporization and combustion, and higher emissions [39,44]. High KV also affects the fluidity of the fuel under low ambient temperature and cold-start engine conditions. Low KV may not provide sufficient lubrication for fuel injection pumps, resulting in leakage or increased wear [45]. KV increases with chain length or saturation degree. It is also affected by double bond configuration, with cis double bond configuration giving a lower viscosity than trans [45,46]. CFPP is often used as an indicator of the cold flow performance of a fuel. Biodiesel made from feedstocks containing lower concentrations of high-melting point saturated long-chain fatty acids tends to have better cold flow properties [39,44]. Dunn [47] concluded that a biodiesel mixture with a high content of saturated esters (>20%) has poor cold flow properties.
Storage stability is another important property for fuel. Generally, the FP range of biodiesel is higher than that of petrodiesel, which makes biodiesel safer in terms of storage and transformation. A close relationship was found between the FP and the content of light constituents (≤C12) or unsaturated compounds. A higher amount of light constituents or unsaturated compounds leads to a lower FP [41]. OS is one of the major issues affecting the use of biodiesel because biodiesel is more sensitive to oxidative degradation during the storage period than petrodiesel. Kumar [48] summarized the results of previous studies and proposed the following conclusions: (1) OS increases with a decrease in the number of double bonds, location of unsaturation closer to the ester head group, and elimination of hydroxyl groups. It decreases with an increase in chain length and unsaturation; (2) ester with multiple double bonds on the same fatty acid chain is more susceptible to degradation; (3) the trans configuration is more stable than cis; (4) conjugated trans unsaturations are more sensitive to oxidation than cis unsaturations.
Long-chain saturated fatty acid alkyl esters have higher combustion efficiency, but poor cold flow performance, while polyunsaturated fatty acid alkyl esters easily lead to oxidative deterioration. The consensus view of previous studies is that an ideal plant oil used as feedstock for biodiesel production should have lower content of saturated and polyunsaturated fatty acid and higher content of monounsaturated fatty acid [44,49]. The fatty acid profiles of the two-soapberry kernel oils indicate that they have great potential for high-quality biodiesel production.

5. Conclusions

Under the optimized extraction conditions (the ultrasonic power was 109 W, extracting at 65 °C for 25 min, and the liquid–solid ratio was 9 mL·g−1), the oil yield of S. delavayi was as high as 43.67% ± 0.16%, similarly, the oil yield of S. mukorossi was as high as 45.96% ± 0.21% under the optimized extraction conditions (the ultrasonic power of 114 W, extraction temperature of 68 °C, extraction time of 26 min, and liquid–solid ratio of 9 mL·g−1). The main fatty acid components of the two-soapberry kernel oils were oleic acid, eicosenoic acid, linoleic acid, arachidic acid, and palmitic acid. Both kernel oils contained high percentages of monounsaturated fatty acid and low percentages of saturated fatty acid and polyunsaturated fatty acid. The physicochemical properties of the two biodiesels met the criteria outlined in the standards which indicated that S. delavayi and S. mukorossi were potentially useful feedstocks for industrial biodiesel production. Although the two species have a little difference in terms of kernel oil yield, fatty acid composition and biodiesel properties, they are still valuable for plant introduction and hybrid breeding programs in further research.

Author Contributions

Conceptualization, Y.-Q.Z., L.J., J.D. and S.-C.S.; methodology, Y.-Q.Z. and L.J.; data curation, Y.-Q.Z., Y.-Y.X. and G.C.Z.; software, Y.-Q.Z. and L.J.; formal analysis, Y.-Q.Z. and L.J.; project administration, J.D., J.-M.L. and S.-C.S.; supervision, L.J., J.-M.L. and Y.-Y.X.; validation, G.-C.Z., Y.-Y.X. and L.J.M.; writing—original draft, Y.-Q.Z.; writing—review and editing, J.D., L.-M.J., Y.-B.H. and S.-C.S. All authors have read and agreed to the published version of the manuscript.

Funding

This research was funded by the Fundamental Research Funds for the Central Universities (No. 2015ZCQ-LX-02).

Acknowledgments

We would like to thank Qiang Han from EasyScience Platform (www.yikexue.com) for detection of fatty acid composition by GC-MS.

Conflicts of Interest

The authors declare no conflicts of interest.

Nomenclature

B3030% by volume of biodiesel in petrodiesel
SDsteam distillation
MPmechanical press
SEsolvent extraction
EEenzymatic extraction
SFEsupercritical fluid extraction
MAEmicrowave-assisted extraction
UAEultrasound-assisted extraction
CPEcold-pressing extraction
SXESoxhlet extraction
RSMresponse surface methodology
BBDBox-Behnken design
GC-MSgas chromatography-mass spectrometer
EIelectron ionization
SDS. delavayi
SMS. mukorossi
SDMEsS. delavayi methyl esters
SMMEsS. mukorossi methyl esters
ASTMAmerican Society for Testing and Materials
EUEuropean Union
ISSRinter-simple sequence repeat
KVKinematic viscosity
CVcalorific value
CFPPcold filter plugging point
CNcetane number
OSoxidation stability
FPFlash point

Appendix A

Figure A1. Single-factor experiments with 4 factors and 5 levels for S. delavayi oil extraction: (a) effect of ultrasonic power (W) on oil yield with extraction temperature of 60 °C, extraction time of 30 min, and liquid–solid ratio of 8 mL·g−1; (b) effect of extraction temperature (°C) on oil yield with ultrasonic power of 100 W, extraction time of 30 min, and liquid–solid ratio of 8 mL·g−1; (c) effect of extraction time (min) on oil yield with ultrasonic power of 100 W, extraction temperature of 60 °C, and liquid–solid ratio of 8 mL·g−1; (d) effect of liquid–solid ratio (mL·g−1) on oil yield with ultrasonic power of 100 W, extraction temperature of 60 °C, and extraction time of 20 min.
Forests 11 00212 g0a1
Figure A2. Single-factor experiments with 4 factors and 5 levels for S. mukorossi oil extraction: (a) effect of ultrasonic power (W) on oil yield with extraction temperature of 60 °C, extraction time of 30 min, and liquid–solid ratio of 8 mL·g−1; (b) effect of extraction temperature (°C) on oil yield with ultrasonic power of 110 W, extraction time of 30 min, and liquid–solid ratio of 8 mL·g−1; (c) effect of extraction time (min) on oil yield with ultrasonic power of 110 W, extraction temperature of 70 °C, and liquid–solid ratio of 8 mL·g−1; (d) effect of liquid–solid ratio (mL·g−1) on oil yield with ultrasonic power of 110 W, extraction temperature of 70 °C, and extraction time of 20 min.
Forests 11 00212 g0a2

References

  1. Xia, N.H.; Gadek, P.A. Sapindaceae. In Flora of China; Wu, Z.Y., Raven, P.H., Eds.; Science Press: Beijing, China, 2007; Missouri Botanical Garden Press: St. Louis, MO, USA, 2007; Volume 12, pp. 11–12. [Google Scholar]
  2. SFA. National Forestry Biomass Energy Development Plan for 2011–2020; The State Forestry Administration of the People’s Republic of China: Beijing, China, 2013.
  3. Maity, J.P.; Huang, Y.M.; Fan, C.W.; Chen, C.C.; Li, C.Y.; Hsu, C.M.; Chang, Y.F.; Wu, C.I.; Chen, C.Y.; Jean, J.S. Evaluation of remediation process with soapberry derived saponin for removal of heavy metals from contaminated soils in Hai-Pu, Taiwan. J. Environ. Sci. 2013, 25, 1180–1185. [Google Scholar] [CrossRef]
  4. Upadhyay, A.; Singh, D.K. Molluscicidal activity of Sapindus mukorossi, and Terminalia chebula, against the freshwater snail Lymnaea acuminata. Chemosphere 2011, 83, 468–474. [Google Scholar] [CrossRef]
  5. Singh, R.; Kumari, N. Comparative determination of phytochemicals and antioxidant activity from leaf and fruit of Sapindus mukorrossi Gaertn-Avaluable medicinal tree. Ind. Crop. Prod. 2015, 73, 1–8. [Google Scholar] [CrossRef]
  6. Ogunkunle, O.; Ahmed, N.A. A review of global current scenario of biodiesel adoption and combustion in vehicular diesel engines. Energy Rep. 2018, 5, 1560–1579. [Google Scholar] [CrossRef]
  7. Demirbas, A. Importance of biodiesel as transportation fuel. Energy Policy 2007, 35, 4661–4670. [Google Scholar] [CrossRef]
  8. Mahlia, T.M.I.; Syazmi, Z.A.H.S.; Mofjur, M.; Abas, A.E.P.; Bilad, M.R.; Ong, H.C.; Silitonga, A.S. Patent landscape review on biodiesel production: Technology updates. Renew. Sust. Energy Rev. 2020, 118, 1601–1620. [Google Scholar] [CrossRef]
  9. Yesilyurt, M.K.; Cesur, C.; Aslan, V.; Yilbasi, Z. The production of biodiesel from safflower (Carthamus tinctorius L.) oil as a potential feedstock and its usage in compression ignition engine: A comprehensive review. Renew. Sust. Energy Rev. 2020, in press. [Google Scholar] [CrossRef]
  10. Ambat, I.; Srivastava, V.; Sillanpää, M. Recent advancement in biodiesel production methodologies using various feedstock: A review. Renew. Sust. Energy Rev. 2018, 90, 356–369. [Google Scholar] [CrossRef]
  11. Karmakar, B.; Halder, G. Progress and future of biodiesel synthesis: Advancements in oil extraction and conversion technologies. Energy Conv. Manag. 2019, 182, 307–339. [Google Scholar] [CrossRef]
  12. Yusoff, M.M.; Gordon, M.H.; Niranjan, K. Aqueous enzyme assisted oil extraction from oilseeds and emulsion de-Emulsifying methods: A review. Trends Food Sci. Technol. 2015, 41, 60–82. [Google Scholar] [CrossRef]
  13. Tan, C.X.; Chong, G.H.; Hamzah, H.; Ghazali, H.M. Comparison of subcritical CO2 and ultrasound-Assisted aqueous methods with the conventional solvent method in the extraction of avocado oil. J. Supercrit. Fluids 2018, 135, 45–51. [Google Scholar] [CrossRef]
  14. Koubaa, M.; Mhemdi, H.; Barba, F.J.; Roohinejad, S.; Greiner, R.; Vorobiev, E. Oilseed treatment by ultrasounds and microwaves to improve oil yield and quality: An overview. Food Res. Int. 2016, 85, 59–66. [Google Scholar] [CrossRef] [PubMed]
  15. Bezerra, M.A.; Santelli, R.E.; Oliveira, E.P.; Villar, L.S.; Escaleira, L.A. Response surface methodology (RSM) as a tool for optimization in analytical chemistry. Talanta 2008, 76, 965–977. [Google Scholar] [CrossRef] [PubMed]
  16. Carabajal, M.; Teglia, C.M.; Cerutti, S.; Culzoni, M.J.; Goicoechea, H.C. Applications of liquid-phase microextraction procedures to complex samples assisted by response surface methodology for optimization. Microchem J. 2020, 152, 104436. [Google Scholar] [CrossRef]
  17. Tarley, C.R.T.; Silveira, G.; Santos, W.N.L.D.; Matos, G.D.; Da Silva, E.G.P.; Bezerra, M.A.; Miró, M.; Ferreira, S.L.C. Chemometric tools in electroanalytical chemistry: Methods for optimization based on factorial design and response surface methodology. Microchem. J. 2009, 92, 58–67. [Google Scholar] [CrossRef]
  18. Yusri, I.M.; Majeed, A.P.P.A.; Mamat, R.; Ghazali, M.F.; Awad, O.I.; Azmi, W.H. A review on the application of response surface method and artificial neural network in engine performance and exhaust emissions characteristics in alternative fuel. Renew. Sust. Energy Rev. 2018, 90, 665–686. [Google Scholar] [CrossRef]
  19. Zhao, X. Comparison of Sapindus mukorossi Gaertn from different areas in Jiangxi province and study of preparation of biodiesel and other comprehensive utilizations. Master′s Thesis, Jiangxi Agricultural University, Nanchang, China, 2014. [Google Scholar]
  20. Sun, C.; Jia, L.; Xi, B.; Liu, J.; Wang, L.; Weng, X. Genetic diversity and association analyses of fruit traits with microsatellite ISSRs in Sapindus. J. For. Res. 2019, 30, 193–203. [Google Scholar] [CrossRef]
  21. Suh, H.K.; Lee, C.S. A review on atomization and exhaust emissions of a biodiesel-Fueled compression ignition engine. Renew. Sust. Energy Rev. 2016, 58, 1601–1620. [Google Scholar] [CrossRef]
  22. Bhuiya, M.M.K.; Rasul, M.G.; Khan, M.M.K.; Ashwath, N.; Azad, A.K.; Hazrat, M.A. Prospects of 2nd generation biodiesel as a sustainable fuel-part 2: Properties, performance and emission characteristics. Renew. Sust. Energ. Rev. 2016, 55, 1129–1146. [Google Scholar] [CrossRef]
  23. Anahas, A.M.P.; Muralitharan, G. Characterization of heterocystous cyanobacterial strains for biodiesel production based on fatty acid content analysis and hydrocarbon production. Energy Conv. Manag. 2018, 157, 423–437. [Google Scholar] [CrossRef]
  24. Tian, Y.; Xu, Z.; Zheng, B.; Lo, M.Y. Optimization of ultrasonic-Assisted extraction of pomegranate (Punica granatum L.) seed oil. Ultrason. Sonochem. 2013, 20, 202–208. [Google Scholar] [CrossRef] [PubMed]
  25. Senrayan, J.; Venkatachalam, S. Optimization of ultrasound-assisted solvent extraction (UASE) based on oil yield, antioxidant activity and evaluation of fatty acid composition and thermal stability of Coriandrum sativum L. seed oil. Food Sci. Biotechnol. 2019, 28, 377–386. [Google Scholar] [CrossRef] [PubMed]
  26. Liu, P.; Xu, Y.; Gao, X.; Zhu, X.; Du, M.; Wang, Y.; Deng, R.; Gao, J. Optimization of ultrasonic-assisted extraction of oil from the seed kernels and isolation of monoterpene glycosides from the oil residue of Paeonia lactiflora Pall. Ind. Crop. Prod. 2017, 107, 260–270. [Google Scholar] [CrossRef]
  27. Hu, B.; Li, C.; Qin, W.; Zhang, Z.; Liu, Y.; Zhang, Q.; Liu, A.; Jia, R.; Yin, Z.; Han, X.; et al. A method for extracting oil from tea (Camelia sinensis) seed by microwave in combination with ultrasonic and evaluation of its quality. Ind. Crop. Prod. 2019, 131, 234–242. [Google Scholar] [CrossRef]
  28. Ara, K.M.; Karami, M.; Raofie, F. Application of response surface methodology for the optimization of supercritical carbon dioxide extraction and ultrasound-assisted extraction of Capparis spinosa seed oil. J. Supercrit. Fluids 2014, 85, 173–182. [Google Scholar] [CrossRef]
  29. Maran, J.P.; Manikandan, S.; Nivetha, C.V.; Dinesh, R. Ultrasound assisted extraction of bioactive compounds from Nephelium lappaceum L. fruit peel using central composite face centered response surface design. Arab. J. Chem. 2017, 10, S1145–S1157. [Google Scholar]
  30. Xu, G.; Liang, C.; Huang, P.; Liu, Q.; Xu, Y.; Ding, C.; Li, T. Optimization of rice lipid production from ultrasound-assisted extraction by response surface methodology. J. Cereal Sci. 2016, 70, 23–28. [Google Scholar] [CrossRef]
  31. Almeida, B.; Valli, E.; Bendini, A.; Toschi, T.G. Semi-industrial ultrasound-assisted virgin olive oil extraction: Impact on quality. Eur. J. Lipid Sci. Technol. 2017, 119, 1600230. [Google Scholar] [CrossRef]
  32. Mohammadpour, H.; Sadrameli, S.M.; Eslami, F.; Asoodeh, A. Optimization of ultrasound-Assisted extraction of Moringa peregrina oil with response surface methodology and comparison with Soxhlet method. Ind. Crop. Prod. 2019, 131, 106–116. [Google Scholar] [CrossRef]
  33. Górnaś, P.; Siger, A.; Rudzińska, M.; Grygier, A.; Marszałkiewicz, S.; Ying, Q.; Sobieszczańska, N.; Segliņa, D. Impact of the Extraction Technique and Genotype on the Oil Yield and Composition of Lipophilic Compounds in the Oil Recovered from Japanese Quince (Chaenomeles japonica) Seeds. Eur. J. Lipid Sci. Technol. 2019, 121, 1800262. [Google Scholar] [CrossRef] [Green Version]
  34. Chhetri, A.B.; Tango, M.S.; Budge, S.M.; Watts, K.C.; Islam, M.R. Non-Edible plant oils as new sources for biodiesel production. Int. J. Mol. Sci. 2008, 9, 169–180. [Google Scholar] [CrossRef] [PubMed] [Green Version]
  35. Wang, N.; Wu, H.; Weng, Z.; Wang, H.; Yao, W. Characteristics and extraction of Sapindus mukorossi Gaertn. kernel oil with microwave pretreatment. China Oils Fats 2013, 38, 1–3. [Google Scholar]
  36. Sun, C.; Wang, J.; Duan, J.; Zhao, G.; Weng, X.; Jia, L. Association of fruit and seed traits of Sapindus mukorossi Germplasm with environmental factors in southern china. Forests 2017, 8, 491. [Google Scholar] [CrossRef] [Green Version]
  37. Liu, Z.; Gui, M.; Xu, T.; Zhang, L.; Kong, L.; Qin, L.; Zou, Z. Efcient aqueous enzymatic-Ultrasonication extraction of oil from Sapindus mukorossi seed kernels. Ind. Crop. Prod. 2019, 134, 124–133. [Google Scholar] [CrossRef]
  38. Yaşar, F. Comparision of fuel properties of biodiesel fuels produced from different oils to determine the most suitable feedstock type. Fuel 2020, 264, 116817. [Google Scholar] [CrossRef]
  39. Refaat, A.A. Correlation between the chemical structure of biodiesel and its physical properties. Int. J. Environ. Sci. Technol. 2009, 6, 677–694. [Google Scholar] [CrossRef] [Green Version]
  40. Ramírez-Verduzco, L.F.; Rodríguez-Rodríguez, J.E.; Jaramillo-Jacob, A.D.R. Predicting cetane number, kinematic viscosity, density and higher heating value of biodiesel from its fatty acid methyl ester composition. Fuel 2012, 91, 102–111. [Google Scholar] [CrossRef]
  41. Sajjadi, B.; Raman, A.A.A.; Arandiyan, H. A comprehensive review on properties of edible and non-Edible vegetable oil-Based biodiesel: Composition, specifications and prediction models. Renew. Sust. Energ. Rev. 2016, 63, 62–92. [Google Scholar] [CrossRef]
  42. Singh, D.; Sharma, D.; Soni, S.L.; Sharma, S.; Kumari, D. Chemical compositions, properties, and standards for different generation biodiesels: A review. Fuel 2019, 253, 60–71. [Google Scholar] [CrossRef]
  43. Zhang, Y.Q.; Jia, L.M.; Chen, Z.G.; Zhao, X.M.; Su, S.C. Development of new non-Food woody oil-Plant resources and comparative analysis of biodiesel properties. China Oils Fats 2016, 41, 1–8. [Google Scholar]
  44. Hoekman, S.K.; Broch, A.; Robbins, C.; Ceniceros, E.; Natarajan, M. Review of biodiesel composition, properties, and specifications. Renew. Sust. Energ. Rev. 2012, 16, 143–169. [Google Scholar] [CrossRef]
  45. Knothe, G.; Steidley, K.R. Kinematic viscosity of biodiesel fuel components and related compounds. Influence of compound structure and comparison to petrodiesel fuel components. Fuel 2005, 84, 1059–1065. [Google Scholar]
  46. Kumar, N.; Chauhan, S.R. Performance and emission characteristics of biodiesel from different origins: A review. Renew. Sust. Energy Rev. 2013, 21, 633–658. [Google Scholar]
  47. Dunn, R.O. Cold flow properties of biodiesel: A guide to getting an accurate analysis. Biofuels 2015, 6, 115–128. [Google Scholar] [CrossRef]
  48. Kumar, N. Oxidative stability of biodiesel: Causes, effects and prevention. Fuel 2017, 190, 328–350. [Google Scholar] [CrossRef]
  49. Sierra-Cantor, J.F.; Guerrero-Fajardo, C.A. Methods for improving the cold flow properties of biodiesel with high saturated fatty acids content: A review. Renew. Sustain. Energy Rev. 2017, 72, 774–790. [Google Scholar] [CrossRef]
Figure 1. Process flowchart of S. delavayi and S. mukorossi kernel oil to biodiesel.
Forests 11 00212 g001
Figure 2. The response surface plots showing the interactive effect of independent variables on oil extraction: (a) the interactive effect of ultrasonic power and extraction time at constant temperature (60 °C) and liquid–solid ratio (8:1) on the oil yield of S. delavayi; (b) the interactive effect of ultrasonic power and liquid–solid ratio at constant temperature (60 °C) and time (20 min) on the oil yield of S. delavayi; (c) the interactive effect of extraction temperature and liquid–solid ratio at constant ultrasonic power (100 W) and time (20 min) on the oil yield of S. delavayi; (d) the interactive effect of ultrasonic power and extraction time at constant temperature (70 °C) and liquid–solid ratio (8:1) on the oil yield of S. mukorossi.
Forests 11 00212 g002
Figure 3. Total ion current chromatogram (TIC, m/z 45–500) of two kernel oils: (a) S. delavayi kernel oil; (b) S. mukorossi kernel oil.
Forests 11 00212 g003aForests 11 00212 g003b
Table 1. Fruit characteristics of S. delavayi and S. mukorossi.
Fruit TraitsS. delavayiS. mukorossi
100-fruit dry weight (g)431.878 ± 44.538406.070 ± 28.940
100-pericarp dry weight (g)252.089 ± 39.684245.275 ± 26.143
100-seed dry weight (g)179.789 ± 15.984160.795 ± 16.004
100-seed shell dry weight (g)120.211 ± 12.688116.683 ± 6.543
100-seed kernel dry weight (g)59.578 ± 6.59544.112 ± 9.812
Seed content of fruit (%)41.630 ± 5.10039.598 ± 4.873
Kernel content of seed (%)33.138 ± 3.50424.626 ± 4.570
Fruit horizontal diameter (mm)20.830 ± 0.89121.898 ± 1.520
Fruit vertical diameter (mm)19.537 ± 0.58719.348 ± 1.274
Fruit lateral diameter (mm)23.142 ± 4.03718.435 ± 1.134
Pericarp thickness (mm)1.757 ± 0.1641.703 ± 0.303
Table 2. Coded levels, 29 experimental runs with the actual and predicted values used in Box–Behnken design of RSM for the responses.
RunsS. delavayiS. mukorossi
X1 (W)X2 (°C)X3 (min)X4 (mL·g−1)Y1 (%)Y2 (%)X1 (W)X2 (°C)X3 (min)X4 (mL·g−1)Y1 (%)Y2 (%)
180 (−1)50 (−1)20 (0)8 (0)39.3739.46100 (−1)60 (−1)20 (0)8 (0)43.5144.08
2120 (1)50 (−1)20 (0)8 (0)41.2841.11120 (1)60 (−1)20 (0)8 (0)46.5646.17
380 (−1)70 (1)20 (0)8 (0)40.4640.46100 (−1)80 (1)20 (0)8 (0)43.3143.67
4120 (1)70 (1)20 (0)8 (0)42.6042.33120 (1)80 (1)20 (0)8 (0)46.3445.74
5100 (0)60 (0)10 (−1)6 (−1)39.3039.13110 (0)70 (0)10 (−1)6 (−1)43.2343.13
6100 (0)60 (0)30 (1)6 (−1)41.3341.13110 (0)70 (0)30 (1)6 (−1)45.4645.28
7100 (0)60 (0)10 (−1)10 (1)40.4340.46110 (0)70 (0)10 (−1)10 (1)44.3744.52
8100 (0)60 (0)30 (1)10 (1)42.7142.71110 (0)70 (0)30 (1)10 (1)47.1047.16
980 (−1)60 (0)20 (0)6 (−1)39.2639.31100 (−1)70 (0)20 (0)6 (−1)43.1942.95
10120 (1)60 (0)20 (0)6 (−1)40.6340.67120 (1)70 (0)20 (0)6 (−1)44.4244.63
1180 (−1)60 (0)20 (0)10 (1)40.3840.36100 (−1)70 (0)20 (0)10 (1)44.6944.19
12120 (1)60 (0)20 (0)10 (1)42.5542.52120 (1)70 (0)20 (0)10 (1)46.7146.66
13100 (0)50 (−1)10 (−1)8 (0)39.3439.37110 (0)60 (−1)10 (−1)8 (0)44.3244.28
14100 (0)70 (1)10 (−1)8 (0)40.5640.47110 (0)80 (1)10 (−1)8 (0)44.2743.97
15100 (0)50 (−1)30 (1)8 (0)41.3741.48110 (0)60 (−1)30 (1)8 (0)46.7846.79
16100 (0)70 (1)30 (1)8 (0)42.6242.61110 (0)80 (1)30 (1)8 (0)46.5146.26
1780 (−1)60 (0)10 (−1)8 (0)38.8438.81100 (−1)70 (0)10 (−1)8 (0)42.7242.61
18120 (1)60 (0)10 (−1)8 (0)39.4139.65120 (1)70 (0)10 (−1)8 (0)43.3543.74
1980 (−1)60 (0)30 (1)8 (0)40.1040.02100 (−1)70 (0)30 (1)8 (0)44.1144.05
20120 (1)60 (0)30 (1)8 (0)42.5042.69120 (1)70 (0)30 (1)8 (0)46.6547.09
21100 (0)50 (−1)20 (0)6 (−1)40.3240.35110 (0)60 (−1)20 (0)6 (−1)44.8344.75
22100 (0)70 (1)20 (0)6 (−1)40.7541.01110 (0)80 (1)20 (0)6 (−1)44.3544.74
23100 (0)50 (−1)20 (0)10 (1)41.4541.35110 (0)60 (−1)20 (0)10 (1)46.8646.80
24100 (0)70 (1)20 (0)10 (1)42.7942.91110 (0)80 (1)20 (0)10 (1)45.5645.97
25100 (0)60 (0)20 (0)8 (0)42.8842.97110 (0)70 (0)20 (0)8 (0)47.0047.29
26100 (0)60 (0)20 (0)8 (0)42.9642.97110 (0)70 (0)20 (0)8 (0)47.2647.29
27100 (0)60 (0)20 (0)8 (0)43.1142.97110 (0)70 (0)20 (0)8 (0)47.4247.29
28100 (0)60 (0)20 (0)8 (0)42.8542.97110 (0)70 (0)20 (0)8 (0)47.1347.29
29100 (0)60 (0)20 (0)8 (0)43.0342.97110 (0)70 (0)20 (0)8 (0)47.6647.29
Table 3. ANOVA for response surface quadratic polynomial models.
S. delavayiS. mukorossi
SourceSSdfMSF–valuep-ValueSourceSSdfMSF–valuep-Value
Model55.29143.95123.48<0.0001Model61.30144.3826.62<0.0001
X19.2919.29290.55<0.0001X112.03112.0373.14<0.0001
X23.6913.69115.22<0.0001X315.85115.8596.39<0.0001
X313.55113.55423.57<0.0001X47.4117.4145.05<0.0001
X46.3416.34198.12<0.0001X1X30.8410.845.120.0400
X1X30.8410.8426.180.0002X1216.69116.69101.45<0.0001
X1X40.1610.165.000.0421X223.0513.0518.560.0007
X2X40.2110.216.470.0234X329.4419.4457.38<0.0001
X1212.87112.87402.30<0.0001X426.2016.2037.72<0.0001
X223.3413.34104.31<0.0001
X3210.42110.42325.66<0.0001
X424.6114.61144.27<0.0001
ANOVA
Residual0.45140.032 Residual2.30140.16
Lack of Fit0.40100.0403.520.1184Lack of Fit2.06100.213.370.1264
Pure Error0.04640.011 Pure Error0.2440.061
Total SS55.7428 Total SS63.6128
R2 = 0.9920; Adj R2 = 0.9839; Pred R2 = 0.9572; Adeq Precision = 32.348R2 = 0.9638; Adj R2 = 0.9276; Pred R2 = 0.8076; Adeq Precision = 15.434
Table 4. Fatty acid profiles of S. delavayi and S. mukorossi kernel oils.
Fatty AcidMolecular FormulaRetention Time of SDS. delavayi (%)Retention Time of SMS. mukorossi (%)
Palmitic acidC16H32O210.7294.83 ± 0.1710.7325.32 ± 0.31
Palmitoleic acidC16H30O211.0860.28 ± 0.0411.0890.33 ± 0.02
Stearic acidC18H36O214.1231.43 ± 0.0614.1241.81 ± 0.17
Oleic acidC18H34O214.56452.32 ± 1.2814.56055.21 ± 1.83
Linoleic acidC18H32O215.4428.45 ± 0.7215.4406.63 ± 0.54
Linolenic acidC18H30O216.8612.66 ± 0.3216.8591.20 ± 0.16
Arachidic acidC20H40O218.7316.28 ± 0.2918.7447.15 ± 0.37
Eicosenoic acidC20H38O219.23721.45 ± 0.8119.23420.03 ± 1.12
Behenic acidC22H44O224.2831.09 ± 0.0824.2871.18 ± 0.11
Erucic acidC22H42O224.8250.86 ± 0.1724.8320.75 ± 0.20
Lignoceric acidC24H48O230.3790.35 ± 0.0730.3800.39 ± 0.06
saturated fatty acidsΣC n:013.9815.85
monounsaturated fatty acidsΣC n:174.9176.32
polyunsaturated fatty acidsΣC n:m = 2,311.117.83
Table 5. Fuel properties of biodiesels of S. delavayi and S. mukorossi kernel oils.
S. delavayiS. mukorossiASTMD6751EN14214GB25199
Density (15 °C; kg·m−3)8828791860~900820~900 (20°C)
KV (40 °C; mm2·s−1)4.424.481.9~6.03.5~5.01.9~6.0
CV (MJ·kg−1)39.6339.96222
CFPP (°C)45213
CN5354≥47≥51≥49(S50); ≥51(S10)
OS (110 °C; h)3.63.9≥3≥8≥6
FP (°C)152147≥93≥101≥130
Acid value (mg KOH·g−1)0.160.14≤0.5≤0.5≤0.5
Sulfur content (mg·kg−1)NDND≤15(S15); ≤500(S500)≤10≤50(S50); ≤10(S10)
Sulfated ash content (%mass)NDND≤0.02≤0.02≤0.02
Copper strip corrosion (50 °C; 3 h)1a1aNo. 3 maxNo. 1 maxNo. 1 max
Free glycerol (% mass)0.00.0≤0.02≤0.02≤0.02
Total glycerol (% mass)0.10.1≤0.24≤0.25≤0.24
Water Content (mg·kg−1)119102≤500≤500≤500
1 Not specified variable by location and time of year; 2 No specified limit; 3 To report; ND not detected.

