Article

Carbon Stock and Sequestration Potential of an Agroforestry System in Sabah, Malaysia

1
Faculty of Science and Natural Resources, University Malaysia Sabah, Kota Kinabalu 88400, Sabah, Malaysia
2
Institute for Environment and Development (LESTARI), Universiti Kebangsaan Malaysia (UKM), Bangi 43600, Selangor, Malaysia
*
Authors to whom correspondence should be addressed.
Forests 2020, 11(2), 210; https://doi.org/10.3390/f11020210
Submission received: 15 December 2019 / Revised: 15 January 2020 / Accepted: 23 January 2020 / Published: 12 February 2020

Abstract

:
Total aboveground carbon (TAC) and total soil carbon stock in the agroforestry system at the Balung River Plantation, Sabah, Malaysia were investigated to scientifically support the sustaining of natural forest for mitigating global warming via reducing carbon in the atmosphere. Agroforestry, monoculture, and natural tropical forests were investigated to calculate the carbon stock and sequestration based on three different combinations of oil palm and agarwood in agroforestry systems from 2014 to 2018. These combinations were oil palm (27 years) and agarwood (seven years), oil palm (20 years) and agarwood (seven years), and oil palm (17 years) and agarwood (five years). Monoculture oil palm (16 years), oil palm (six years), and natural tropical forest were set as the control. Three randomly selected plots for agroforestry and monoculture plantation were 0.25 ha (50 × 50 m), respectively, whereas for the natural tropical forest it was 0.09 ha (30 × 30 m). A nondestructive sampling method followed by the allometric equation determined the standing biomass. Organic and shrub layers collected in a square frame (1 × 1 m) were analyzed using the CHN628 series (LECO Corp., MI, USA) for carbon content. Soil bulk density of randomly selected points within the three different layers, that is, 0 to 5, 5 to 10, and 10 to 30 cm were used to determine the total ecosystem carbon (TEC) stock in each agroforestry system which was 79.13, 85.40, and 78.28 Mg C ha−1, respectively. The TEC in the monoculture oil palm was 76.44 and 60.30 Mg C ha−1, whereas natural tropical forest had the highest TEC of 287.29 Mg C ha−1. The forest stand had the highest TEC capacity as compared with the agroforestry and monoculture systems. The impact of planting systems on the TEC showed a statistically significant difference at a 95% confidence interval for the various carbon pools among the agroforestry, monoculture, and natural tropical forests. Therefore, the forest must be sustained because of its higher capacity to store carbon in mitigating global warming.

1. Introduction

Carbon is stored on the Earth in various forms and the major reservoirs are organic compounds in living and dead organisms of the biosphere, carbon dioxide (CO2) and methane (CH4) gases in the atmosphere, in the organic matter of soil, in the lithosphere as fossil fuel and sedimentary rocks, in the oceans as dissolved hydrocarbons, in the shells of marine creatures as calcium carbonate, etc. The movement of carbon in many forms among the atmosphere, hydrosphere, biosphere, pedosphere, and lithosphere is known as the global carbon cycle [1]. In the sub-cycle, carbon continuously moves among the atmosphere, plants, and soils through photosynthesis, plant respiration, harvesting, fire, and decomposition [2]. The carbon cycle has an important role in the regulation of the Earth’s climate through stabilizing the CO2 concentration in the atmosphere. Natural forest ecosystems offer a significant function of carbon storage as well as timber production for economic benefits [3,4]. An undisturbed tropical forest area stores a higher amount of carbon stocks in the living biomass and in the soil as compared with other land uses [5]. The natural forest of Southeast Asia usually stores a higher amount of carbon with the capability of accumulating up to 500 Mg C ha−1 and is estimated to absorb up to 3 Gt CO2 yr−1 [6]. Therefore, the conversion of forest ecosystems into various land uses and land cover changes (i.e., forest conversion into other land cover) is believed to be one of the major sources of greenhouse gases (GHGs) emissions in the atmosphere [7]. Conversion of the natural ecosystem into various land use purposes destroys the landscape and the deforested landscapes fail to capture and store CO2, which is the main GHGs component.
High concentrations of CO2 in the atmosphere are associated with global warming because CO2 is a heat-trapping gas that significantly increases the Earth’s temperature [8]. The Intergovernmental Panel on Climate Change (IPCC), in 2013, reported that CO2 has been contributing more than any other driver to change the climate between 1750 and 2011, mainly because of anthropogenic activities and land-use changes [9]. The IPCC also reported an increasing trend in the total annual emission of GHGs from 27 Gt CO2 yr−1 in 1970 to 49 Gt CO2 yr−1 in 2010 [6]. Deforestation activities undermine the carbon sink function of a forest and release back the potential stored carbon into the atmosphere, although the forest attributes up to 50% of the carbon stock. The major driving force of deforestation is led by the needs of a specific areas’ plantation and agricultural activities [10]. Approximately 90% of deforestation has been driven by agriculture activities of which 60% have been attributed to the extension of agro-industrial farming such as oil palm and rubber plantations, whereas the remaining 30% has been caused by small scale and subsistence farmers [11]. The conversion of forest areas into oil palm plantation results in higher carbon loss into the atmosphere. From 1990 to 2005, about 50% to 60% of oil palm plantation’s expansions were from the clearance of forest area [12]. According to the study of FAO [13], in 2013, oil palm plantations cover an area of 16.4 million hectares worldwide, of which 85% of it is grown in Indonesia and Malaysia. The large areas of oil palm plantations is attributed to the clearance of tropical forest areas. The massive clearance of tropical forest areas to make way for oil palm plantation establishments has contributed to high emissions of GHGs because tropical forests store a significant amount of carbon. Palm oil production in Malaysia and Indonesia has become a focus of debate on GHGs emissions because the palm oil sector has been responsible for 16% of the total emissions in Indonesia and 32% in Malaysia between 2006 and 2010 [14]. The Roundtable on Sustainable Palm Oil (RSPO) [15] identified that emissions can be the result of such activities as the following: (i) Land clearing for establishment of new plantations, (ii) use of fossil fuels for plantation internal transport and machinery, (iii) use of fertilizers, (iv) use of fuels in palm oil milling, (v) palm oil mill effluent, etc. According to the research by Hashim et al. [16], the estimation of GHGs emission of oil palm planted on peat in Malaysia has been divided into three main components which are GHG emissions from land use change, peat oxidation due to the establishment of oil palm plantations, and operations during cultivation and milling processes. Notably, the carbon emissions from the oil palm sector in Malaysia mainly resulted from oxidation of peat as most of the oil palm plantations were established on peat soil and from land clearing for the establishment of new plantations [14].
Oil palm (Elaeis guineensis) is an important crop in Southeast Asia, and both Malaysia and Indonesia collectively produce about 86% of the world’s palm oil [17,18]. Total palm oil production until June 2015 was dominated by Indonesia with about 54% (35 million metric tonnes yr−1), Malaysia 32% (21 million metric tonnes yr−1), Thailand 3% (two million metric tonnes yr−1), Columbia and Nigeria about 2% (one million metric tonnes yr−1). Malaysia has large oil palm plantation areas which cover an area of 5.64 million hectares. The demand for palm oil continues to grow and this sector continues to invest in expanded production through multiple strategies, which include increasing yield and avoiding waste, and also expanding the area under cultivation. The maximum oil palm plantation areas practice monoculture (single species) planting. Although the plantation areas have also carried out some carbon sink functions as the CO2 is stored in the oil palm biomass, however, it has been estimated that monoculture oil palm plantations are only capable of storing aboveground carbon stock ranging between 30 and 40 Mg C ha−1 which is less than a quarter percent of the carbon stock stored in the tropical forests in Southeast Asia [14,19].
In order to mitigate the impact of climate change and global warming, it is crucial to carry out efficient afforestation, reforestation, and avoidance of deforestation strategies. Increasing global carbon (C) sequestration through enlargement of the proportion of forested land on the planet has been suggested as an effective measure for mitigating elevated concentrations of atmospheric carbon dioxide [20,21]. However, massive deforestation has been a major concern and remains a challenge due to unsustainable agriculture activities that degrade natural ecosystems. Under the Kyoto protocol and REDD+ (reducing emissions from deforestation and forest degradation) in developing countries and the role of conservation, sustainable management of forests and enhancement of forest carbon stocks, agroforestry systems have been increasingly recognized and approved to be a viable solution in combating climate change [22].
Well-designed, multipurpose plantations such as the adoption of agroforestry systems can reduce pressure on natural forests, restore some ecological services provided by natural forests, and mitigate climate change through direct carbon sequestration [23]. Agroforestry practices are the cultivation of long-term production perennial timber trees with short-term production annual crops or livestock on the same land. These combinations increase the land capability in sequestering carbon above and below ground [24]. Following first-class forest and long-term forest plantation systems, an agroforestry system contributes greatly to carbon sequestration [25]. It has been shown that an agroforestry system can have a positive impact on conventional agriculture and forest tree production through increases in productivity and biodiversity with social, economic, and ecological benefits [26]. There are four factors that can contribute to more efficient carbon sequestration which are the level of soil fertility, crop management efficiency, diversification of crops on the same land unit, and the ability of plants to absorb carbon [27]. Adopting an agroforestry system in a monoculture oil palm plantation can help to also increase the potential carbon stock of the land use, increase the carbon sequestration in the atmosphere, as well as provide other various environmental benefits.
In Malaysia, agroforestry systems that were practiced include the agrisilviculture, silvopasture, and agrosilvopasture systems [28]. Agroforestry systems were commercialized in the early 1920s when it also started the agrisilviculture system of rubber (Hevea brasiliensisis) trees with coffee (Coffea liberica) trees [29]. However, agroforestry systems were not widely practiced and decreased as a result of lack of exposure and awareness about their importance. Particularly in Sabah, oil palm agroforestry was minimally practiced, as well as limited reports of the study on its carbon stock potential. The importance in quantifying variations in the carbon stock of oil palm agroforestry and monoculture at different ages of trees and different systems provides different plant growth, shade, and carbon storage. Agroforestry practices on oil palm plantations in Sabah usually incorporate a species mixture of oil palm with laran (Anthocephalus chinensis), teak (Tectona grandis), and agarwood (Aquilaria malaccensis). A study by Rochmayanto [30], in 2011, on the aboveground carbon stock of the agroforestry system of oil palm and agarwood mixture in Riau, Indonesia reported that the agroforestry system had a positive influence on the total tree carbon stock. The same study also recorded an increase in carbon stock of 224.4% for the oil palm agroforestry system at 25 years rotation as compared with monoculture oil palm plantation.
Natural forest, forest plantation, monoculture plantation, agroforestry, and other agricultural activities act as a sink for carbon dioxide (CO2). Carbon dioxide is stored as biomass in aboveground living trees through photosynthesis [31]. Biomass production in planted trees depends on many factors such as soil type, environmental conditions, degradation, and the period length of planting. Soil also acts as a carbon sink. Both aboveground living trees and soil help to absorb carbon dioxide in the atmosphere and balance the global climate. Good management of aboveground and soil carbon can help to increase carbon stock and C sequestration in the atmosphere. The general objective of this study was to estimate the amount of carbon stored in the agroforestry systems of oil palm and agarwood mixtures at the Balung River Plantation, Tawau, Sabah. Specifically, this study was initiated to determine the total aboveground carbon stock and soil carbon stock among the different land uses (agroforestry system, monoculture plantation, and natural tropical forest), as well as the factors that affect the carbon storage.

2. Materials and Methods

2.1. Study Area

The Balung River Plantation is in the northeastern part of Tawau City (40 km from the city) with a total land area of approximately 1500 hectares and located between N 04° 26’ 18.50” latitude and E 118° 02’ 55.90” longitude, as shown in the map (Figure 1). The plantation area has relatively plain lands surrounded by hills with an elevation ranging from 300 to 470 m above sea level. The mean annual temperature of the study area was high year round ranging from 24 to 33° C and the average yearly rainfall ranging between 1800 to 2500 mm. Geologically, the study area has experienced active volcanic activity involving lava flows and pyroclastic deposits in which the study area is widely distributed with volcanic rock consisting of basalt and andesite [32]. According to the Soil Taxonomy Classification System (USDA), the soil at the study site is classified as Typic Haplodult. The type of soil texture is clay loam and clay along with 38% to 77% of clay content.
The Balung River Plantation is one of the plantation companies in Sabah that practices agroforestry systems. In its early establishment, the main crops were cacao trees (Theobroma cacao) and oil palms (Elaeis guineensis) which were planted in 1985 following monoculture plantation. Higher demand for palm oil had caused most of the area planted with cacao to be converted into oil palm plantations. Agroforestry systems were first practiced with the combination of oil palm and teak trees when the teak trees were introduced into the plantation area in 1993. Since then, more agroforestry combined with oil palms has been initiated in combination with other tree species such as the combination of oil palms with agarwood trees.
In this study, the field data collection was conducted from 2014 to 2018. Three different land uses were investigated, that is, agroforestry, monoculture, and natural tropical forest. The natural tropical forest is located at Tawau Hill Park which is adjacent to the northwest boundary of the plantation area. The park occupies an area of approximately 280 km2 in which 60% of the vegetation is a virgin lowland mixed dipterocarp forest, while the remaining areas, especially in the lower elevations of the eastern and western areas, have been previously logged before the park was gazetted in the year 1979 [33]. The forest structure resembles a typical tropical forest structure with 4 layers (i.e., emergent, canopy, understorey, and undergrowth layers). The maximum canopy height is about 55 m or higher based on the collected field data. Tawau Hill Park is known to be the home of giant tropical trees where, previously, the Shorea faguetiana species from the Diptorecarpaceae family was found and recorded as the world’s tallest tropical tree at an estimated height of 96.9 m, in 2018. The agroforestry system and monoculture plantation are located within the Balung River Plantation. Both natural tropical forest and monoculture plantation were treated as a control in this study. The combinations of agroforestry systems with different ages of trees were oil palm (27 years) and agarwood (7 years), oil palm (20 years) and agarwood (7 years), and oil palm (17 years) and agarwood (5 years). For the monoculture plantation, oil palm (16 years) and oil palm (6 years) were investigated. The carbon stock in four different types of carbon pools was estimated for each land use which included the living trees, shrub layer, organic matter, and soil. Litterfall and roots carbon stock were not estimated.

2.2. Aboveground Carbon Stock Estimation (Living Tree)

To estimate the aboveground carbon stock of the tree components in the different land-use systems, the nondestructive sampling method was used as it is more practical and convenient. An equal number of plots was established (3 plots) and was randomly distributed within each land use type. In the plantation area (agroforestry and monoculture oil palm), square plots of 0.25 ha (50 × 50 m) were used, whereas for the natural tropical forest, square plots of 0.09 ha (30 × 30 m) were used. At every sampling plot, the diameter at breast height (DBH) and tree height were measured and recorded by using diameter tape and laser range finder, respectively. For the tropical forest plots, data was only recorded for trees of >10 cm DBH and higher. In addition, the plots’ locations (center) were recorded with a differential global positioning system (DGPS Triumph 1, brand Javad).

2.3. Allometric Equations

Allometric equations were used to convert field measured attributes (i.e., height and DBH) into stand biomass, as shown in Table 1. The allometric equation used in this study was specifically developed for oil palm by Khalid [34], that is, w = 725 + 197 h, where W refers to tree fresh biomass (kg) and h refers to tree height (m). Allometric equations, also developed by Hairiah and Rahayu [35], specifically for branched vegetation on agroforestry were used to calculate the tree biomass of agarwood stand, that is, w = 0.1043 × DBH2.6, where w is tree biomass (kg) and D is tree diameter at breast height. The allometric equation developed by Basuki [36] for estimating aboveground biomass in tropical lowland dipterocarp forests, that is, w = exp − 1.935 + (1.981 × ln DBH + (0.541 × ln h) was used to calculate tree biomass in the forest stand, where W refers to tree biomass (kg), d refers to tree diameter at breast height, and h is tree height (m). Total stand carbon was estimated to be 50 percent of the total tree biomass [37].

2.4. Organic and Shrub Layer Carbon Estimation

The organic layer on the surface such as leaves, fine wood debris (FWD), and other (bud, fruits, and nut) was collected from 5 random points within each plot of all the different land uses (agroforestry, monoculture, and natural tropical forest). The shrub layer on the ground surface was also collected from the same 5 random points. After all the organic layers were collected, the residual was herbaceous vegetation and grassland vegetation. Sampling was conducted at each point within a quadrat size of 1 × 1 m (1 m²). In total, the samples were collected from 15 sampling points for every land use. The organic and shrub layer samples were prepared in the Soil Science Lab of Forestry Complex, the Faculty of Science and Natural Resources (FSSA), University of Malaysia Sabah (UMS) and analyzed in the Soil Science Lab of Faculty of Sustainable Agriculture (FSA), UMS. The destructive sampling technique was used for the collection of organic and shrub layer samples in which all samples were weighed and dried at 70 °C for 72 h and, then, weighed again to obtain the dry weight (biomass). The percentage of carbon in the organic and shrub layer was obtained from the carbon analysis using the CHN628 series elemental analyzer. The carbon stock of organic and shrub layer was calculated using the following equation:
C-stock (Mg ha−1) = [Sample biomass (dry weight, g) x Carbon percentage (%)] / [100 × Quadrat area (m²)]

2.5. Soil Carbon Estimation

Soil samples were collected from 3 random points in each of the plots. In total, for each land use, soil samples were collected from 9 sampling points. The soil samples were collected at three different depths which were 0 to 5 cm, 5 to 10 cm, and 10 to 30 cm. Undisturbed soil samples were also collected at each depth by using standard soil ring corers with 100 cm³ volume for bulk density analysis. The soil samples were prepared in the Soil Science Lab of Forestry Complex, FSSA, UMS and were analyzed in the Soil Science Lab of FSA, UMS. A CHN628 series elemental analyzer was used to measure the soil carbon. Soil carbon stock was calculated using the following equation:
C-stock (Mg ha−1) = [Bulk density (g/cm²) × Soil depth (cm) × Carbon percentage (%)] × 100

2.6. Statistical Analysis

One-way analysis of variance (ANOVA) was performed using Statistical Package for Social Science (SPSS) software (IBM Corp., Armonk, NY, USA, Version 21.0) to compare the average carbon stock of the four different pools (i.e., living tree, shrub layer, organic layer, and soil) among the three different land uses (agroforestry systems, monoculture plantations, and natural tropical forest). Post-hoc analysis was conducted if there were any significant differences in terms of carbon stock of various pools among the studied different land uses. Means were compared using Tukey’s test at p < 0.05.

3. Results

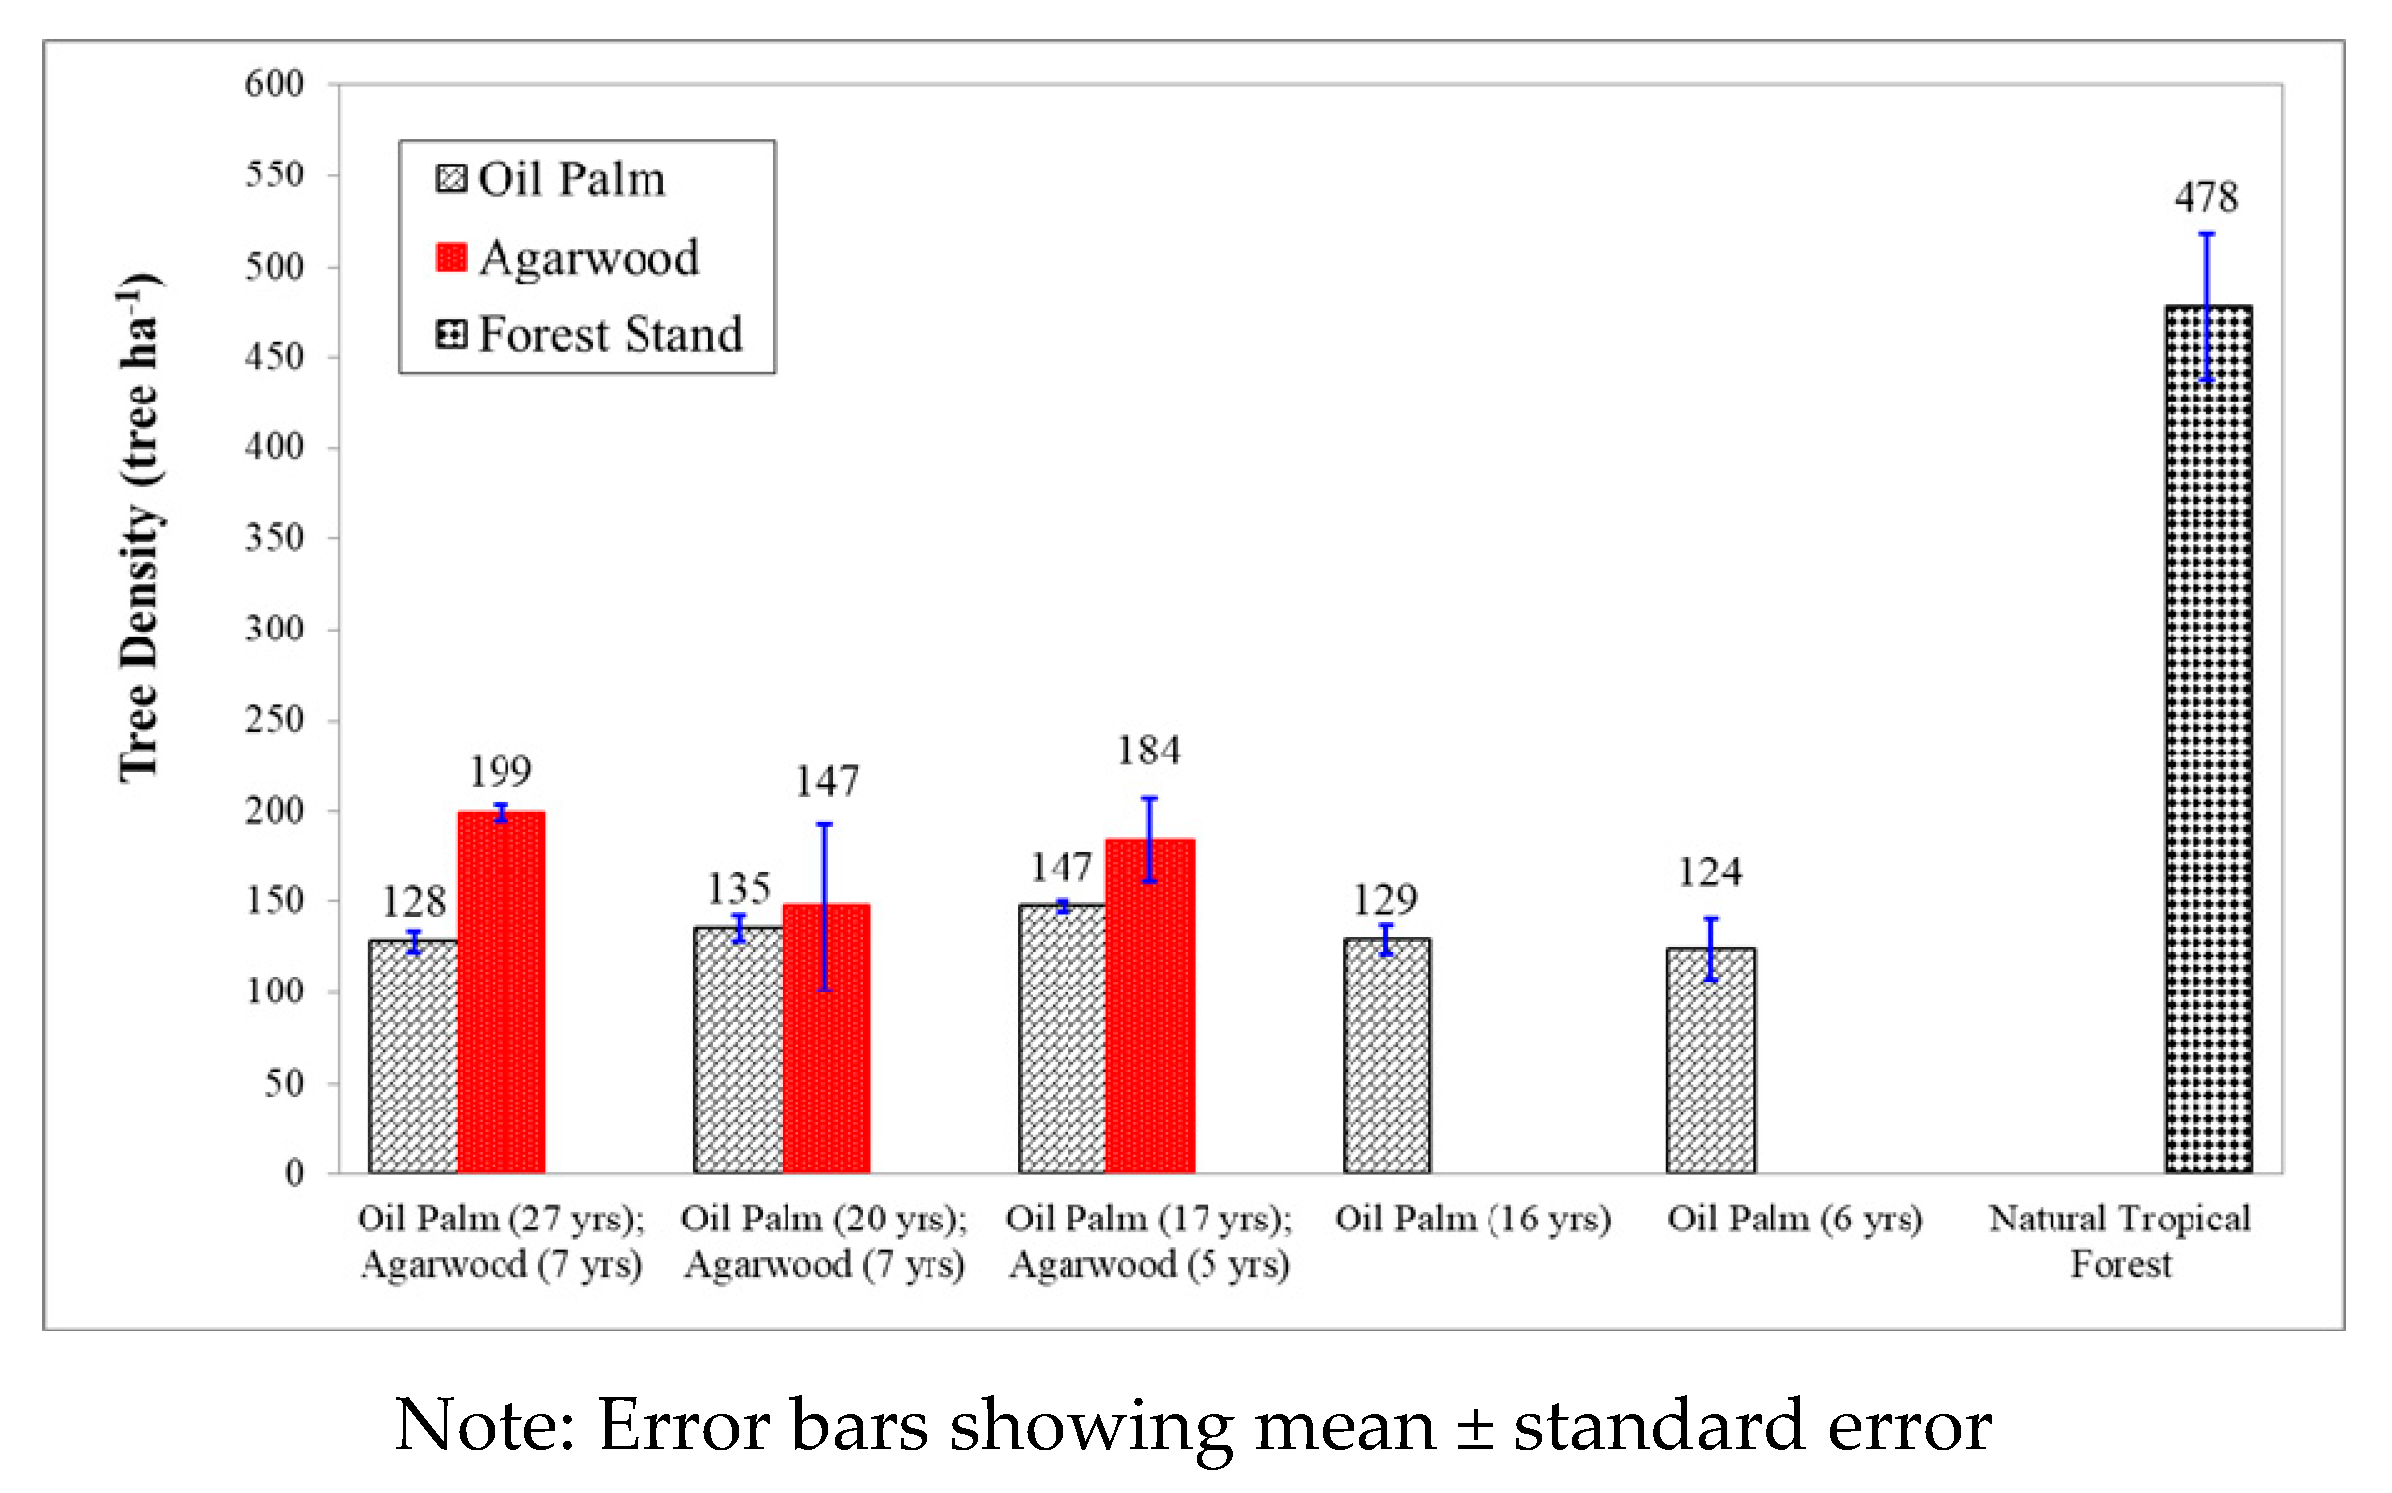
3.1. Total Tree per Hectare

The number of trees per hectare in agroforestry, monoculture, and natural tropical forest are shown in Figure 2. Among the different land uses, the natural tropical forest has the highest tree density at 478 ± 65 tree ha−1, whereas the tree density of oil palm and agarwood species in the plantation site is 50% less than the forest area. The oil palm density in the agroforestry system of oil palm (17 years) and agarwood (5 years) was the highest at 147 ± 3 tree ha−1 as compared with the agroforestry systems (128 to 135 tree ha−1) and monoculture plantations (124 to 129 tree ha−1). However, the tree density of oil palm between the agroforestry systems and monoculture plantations shows no significant difference (p > 0.05) for five plantation combinations (F (4, 9) = 1.601, p = 0.256). The tree density of agarwood trees ranged from 128 to 144 tree ha−1 in the agroforestry systems. There was no clear pattern in the tree density of agarwood trees between the agroforestry systems. The tree density of agarwood was also relatively similar between the agroforestry systems (no significant difference at p < 0.05, F (2, 6) = 0.790, p = 0.496).

3.2. Total Aboveground Carbon Stock

The aboveground carbon stock of the living tree was derived as half of the aboveground biomass (Table 2). The natural tropical forest, namely Tawau Hill Park, was estimated to store approximately 249.90 ± 61.44 Mg C ha−1 which is 85% more than the carbon stored by various systems in the plantation site. One-way statistical analysis of ANOVA showed a significant difference among all the land uses at p < 0.05, F (5, 12) = 11.242, p < 0.001. On the one hand, the post-hoc analysis revealed that there are significant differences in terms of the carbon stock of living trees between the natural forest (M = 249.90, SD = 106.43, SEM = 61.44) and the plantations (agroforestry and monoculture). No significant differences were observed between all agroforestry systems and monoculture plantations.
On the other hand, all the agroforestry systems of oil palm and agarwood mixture show the second highest in living tree carbon stock density. The agroforestry systems of oil palm (27 years) + agarwood (seven years), oil palm (20 years) + agarwood (seven years) and oil palm (17 years) + agarwood (five years) each stored 37.88 ± 3.20 Mg C ha−1, 35.51 ± 1.78 Mg C ha−1 and 39.01 ± 2.42 Mg C ha−1, respectively. Aboveground carbon stock of living trees in the monoculture oil palm plantations are the lowest with 33.19 ± 1.40 Mg C ha−1 in oil palm (16 years) and 14.35 ± 1.38 Mg C ha−1 in oil palm (six years).
The shrub layer’s carbon stock ranging from 0.03 to 0.14 Mg C ha−1 was found to be lowest within all of the land uses. The monoculture plantation of oil palm (six years) had the highest shrub layer’s carbon stock of 0.14 Mg C ha−1 as compared with other land uses. One-way ANOVA analysis showed that there are significant differences (p < 0.05) for the carbon stock of the shrub layer among the land uses (F (5, 84) = 6.109, p = 0.006). The post-hoc analysis revealed that there were significant differences between monoculture oil palm six years (M = 0.14, SD = 0.07, SEM = 0.05) with the agroforestry system and natural tropical forest. No significant difference was observed between oil palm (six years) and oil palm (16 years) plantations. There were also no significant differences between oil palm 16 years with all agroforestry systems and natural tropical forests, as well as between natural tropical forests and all the agroforestry systems.
The organic layer’s carbon stock of the natural tropical forest with 1.02 ± 0.25 Mg C ha−1 was the highest, followed by oil palm (six years) with 0.34 ± 0.05 Mg C ha−1. The agroforestry systems had an organic layer’s carbon stock that ranged between 0.10 and 0.12 Mg C ha−1. The lowest organic layer’s carbon stock was found in the monoculture oil palm (16 years) with 0.07 Mg C ha−1. There were significant differences (p < 0.05) among the land uses in terms of organic layer’s carbon stock shown in the one-way ANOVA analysis (F (5, 84) = 10.854, p < 0.001). The post-hoc analysis showed a significant difference between the natural tropical forest (M = 1.02, SD = 0.44, SEM = 0.25) with all plantation systems. There were no significant differences among agroforestry systems and monoculture plantations (p > 0.05).

3.3. Soil Carbon Stock

The soil carbon stock has been determined in different land use of agroforestry, monoculture and natural tropical forest (Table 3). The total soil carbon stock was higher in the plantation site as compared with the natural tropical forest. The agroforestry of oil palm (20 years) and agarwood (seven years) had the highest soil carbon at 49.75 ± 2.33 Mg C ha−1. In contrast, the lowest soil carbon at 36.30 ± 4.74 Mg C ha−1 was found in the natural tropical forest. The total soil carbon stock for the whole soil profile (0 to 30 cm) did not differ much between different land uses (F (5, 48) = 0.800, p = 0.562). There were also no significant differences (p > 0.05) for soil carbon stock among all of the land uses regardless of the soil depth (0 to 5 cm: F (5, 48) = 0.564, p = 0.727; 5 to 10 cm: F (5, 48) = 1.468, p = 0.244; and 10 to 30 cm: F (5, 48) = 2.313, p = 0.082).

3.4. Total Ecosystem Carbon Stock

The total ecosystem carbon (TEC) in this study was calculated based on the sum of carbon stock densities from four different pools (living tree, shrub layer, an organic layer, and soil). The TEC consists of the aboveground living tree, organic layer, shrub layer, and belowground soil carbon (Table 4). The highest TEC was observed in the natural tropical forest which is about 287.29 ± 61.21 Mg C ha−1. The TEC in oil palm (20 years) and agarwood (seven years) was the second highest at 85.40 ± 1.79 Mg C ha−1. The lowest TEC was found in the monoculture plantation of oil palm (six years), which was about 60.29 ± 1.38 Mg C ha−1. The TEC stocks were significantly correlated to land-use type (p < 0.05) (F (5, 12) = 11.417, p < 0.001).
The post-hoc analysis also shows that the TEC in natural tropical forest (M = 250.98, SD = 106.02, SEM = 61.21) was significantly different than the TEC in the plantation site. There were no significant differences observed between agroforestry systems and monoculture plantation in terms of TEC (p > 0.05). Despite that, the agroforestry systems stored higher TEC, ranging between 78.29 and 85.40 Mg C ha1 as compared with monoculture oil palm plantations that ranged between 60.29 and 76.44 Mg C ha1. Soil carbon pool had contributed to the highest carbon stock portion in both agroforestry systems and monoculture plantations TEC which is more than 50%. Shrubs and organic layer had contributed less than 1% to the TEC of all land uses in this study.

4. Discussion

4.1. Tree per Hectare of the Different Land Use

Our result showed that the tree density varied among the different land uses. The natural tropical forest has the highest tree density which reflects a randomly distributed pattern of trees growing in the forest ecosystems. On the contrary, the tree density for the trees in the plantation system was influenced by the planting distance applied on the site. Oil palms were planted at 9 × 9 m distance in both agroforestry and monoculture. For agarwood trees, they were planted at 4 × 9 m distance. For the tropical forest, measurement was taken only for the trees with DBH >10 cm and above. The tree density in Figure 2 was based on tree/ha unit in order to make it comparable between the different land use systems. Different plot sizes were used in this study, because using a smaller plot size (30 × 30 m) in the plantation area resulted in only a few oil palm trees measured (less than 10 trees per plot). Thus, the plot size was expanded to 50 × 50 m in order to get an optimal number of oil palm trees for above ground carbon stock measurement.
A comparison between the agroforestry and monoculture plantation showed that the agroforestry system has slightly higher oil palm tree density. According to Darus et al. [38], G. boninense ganoderma disease starts to infect oil palm after 12 to 24 months of planting. This could explain the lower tree density in monoculture plantations as it could be attributed to the higher mortality rate due to the Ganoderma attack in the early stage of the plantation. The oil palm density in the agroforestry system that shows a decreasing pattern with increasing age could also be attributed to disease, pests, and weeds. On the basis of the research of Turner [39], Ganoderma infections can increase up to 50% or more for oil palm with an age of 20 to 25 years, suggesting that a higher mortality rate of oil palm also occurs with increasing oil palm age. Nevertheless, the statistical analysis showed no significance difference between the density of oil palm trees in both land uses which indicated that the tree density of oil palm was relatively the same. As mentioned earlier, the spacing distance applied in the plantation site for oil palm is the same, and thus the tree density would not differ from the others. Similarly, the planting distance applied in the plantations also resulted in the homogeneous tree density of agarwood between the agroforestry systems.

4.2. Total Aboveground Carbon Stock

The accumulation of aboveground carbon stock of living trees was the highest in the natural tropical forest as compared with all agroforestry systems and monoculture oil palm plantations. This shows that the natural tropical forest contains the largest carbon pool, and thus is significant in the global carbon cycle. The estimated aboveground carbon stock of living trees in Tawau Hill’s natural tropical forest is comparable with the existing estimates for natural forests elsewhere in Sabah. The aboveground carbon stock densities of undisturbed natural forests in Sabah ranged from 200 to 500 Mg C ha1 [40]. According to the research of Zarin et al. [41], it was estimated that the carbon emission rate from gross tropical deforestation was at 2.27 Gt CO2 y1 between 2001 and 2013. More recent findings reported by World Resources Institute (WRI), in 2018 [42], showed that the annual gross carbon dioxide emissions attributed from deforestation in the tropical countries averaged 4.8 Gt CO2 y1 between 2015 and 2017. The reported annual CO2 emissions only mentioned the emission rate due to forest tree cover loss, however, there is no available data about what happens when it is converted into other land use, for example, oil palm plantation.
For the agroforestry systems, most of the carbon in the systems was contributed by the oil palm while the associated agarwood species contributing very little carbon stocks to the planting systems. The high carbon content of oil palm was attributed to the fact that it is much taller and larger (diameter at breast height) than the agarwood trees. In the agroforestry system of oil palm and agarwood species, the shading of oil palms at the upper canopy on the agarwood trees reduces the agarwood’s growth rate, hence, reducing the amount of carbon storage in the understory trees. The difference in the carbon content among the different land uses in the plantation site could be attributed to the ages of the plantation that ranged from immature to mature. Another factor is the density of oil palm in which the higher the tree density, the higher the carbon stock [43].
The agarwood trees contributed less than 1% to the total aboveground carbon stock of living trees in the agroforestry systems. Despite the lower carbon stock, it could have a significant role in carbon storage at the end of the oil palm plantation rotation. Oil palms production peaks at nine to 18 years and usually is left on the field up to 25 to 30 years when the fruits become too tall to harvest [44]. At the end of the rotation, oil palms are usually cut down for replanting purposes. Carbon is released to the atmosphere when oil palms are felled and left decomposing at the site. The existing agarwood trees in the agroforestry systems absorb some of the carbon as compared with the monoculture oil palm plantation.
In addition, the significant variation of shrub layer carbon stock in monoculture plantation of oil palm (six years) as compared to the other land uses could have been attributed to the height of trees and crown density in the plantation area. Monoculture plantation of oil palm (six years) has the youngest tree stand and relatively shorter in height as compared with other land uses. The crown density was relatively lower (due to shorter fronds) than other land use, and thus higher intensity of sunlight could penetrate the oil palm canopy and reach the understory vegetation. This enabled shrubs to grow and higher carbon stock was accumulated as compared with mature oil palm plantations and natural tropical forest. In addition, the shrub layer’s biomass of the natural tropical forest was relatively low due to the competitive nature between overstory and multiple understory forest layers. In primary or old-growth forests, aboveground biomass is mostly accumulated in a few large trees. The shrub layer’s carbon stock in the mature oil palm plantation was also low due to selective spraying (weeding) using herbicide (glyphosate) that is carried out by plantation owners to prevent nutrient competitions and to ease the harvesting process.
In terms of organic layer’s carbon stock, the natural tropical forest had a higher organic layer’s carbon stock as compared with the agroforestry systems and monoculture plantations, due to the trees in the forest gradually losing their leaves and producing a higher amount of litterfalls. Oil palms do not shed their leaves like forest trees, and thus result in a lower amount of litterfall. According to Lawrence [45], the reduced species diversity in agricultural systems can alter the amount of litterfall production, quality, and decomposition rate, which in turn can affect the amount of organic layer and soil carbon.

4.3. Soil Carbon Stock

The higher total soil carbon stock in the plantation site can be attributed to the intensive cropping systems such as the agroforestry system that enhances nutrient and water intake efficiencies, reduces nutrient leaching to groundwater, and improves soil’s physical and biological properties [46]. The use of NPK fertilizer Nitrophoska Blue (EuroChem Agro GmbH, Mannheim, Germany) (12-12-17-2+8S+TE) in the oil palm plantation for agroforestry and monoculture is one of the factors that causes soil organic carbon (SOC) to increase. Campbell et al. [47] found that SOC increased the most through annual cropping with the application of adequate nitrogen and phosphorus fertilizers. Soil organic carbon and total nitrogen, microbial biomass, light fraction organic carbon and nitrogen, mineralizable nitrogen, and wet aggregate stability have positive responses to fertilization [47]. Continuous application of NPK fertilizer, in addition to farmyard manure, leads to an increase in organic carbon and total nitrogen [48]. Lal et al. [27], in 1997, showed that four factors contributed to the increase of efficiency of carbon sequestration, that is, soil fertility, good crop management, high crop diversity at the same unit of land, and the ability of the crop to absorb carbon in the atmosphere.
Belowground carbon is difficult to estimate in multiple locations [49,50]. Lack of methodological standardization in belowground carbon assessment and specific depth for bulk density measurement is one of the inhibiting factors [50,51]. Other factors that can affect soil carbon in different times and locations include climate, topography, soil types, microbe, nitrogen cycles process, soil management, and land uses [52,53].

4.4. Total Ecosystem Carbon Stock

The main portion of TEC in the natural tropical forest is from living trees carbon pool, which contributed to 87% of the TEC of the natural forest. This was attributed to the higher forest stand density and considerable variations in terms of DBH and height. The soil carbon pool had contributed 13% to the TEC of the natural forest. The findings of this study on the soil carbon portion were almost similar to the study conducted by Neto et al. [54] in the Ayer Hitam Forest in Peninsular Malaysia that contained 17% of carbon portion at 30 cm depth.
The TEC in agroforestry systems can be considered as better than the TEC in the monoculture plantations. Converting conventional agriculture and tree production (monoculture) into agroforestry has a positive impact on productivity, biodiversity, with social, economic and ecological benefit [30]. In this study, oil palms had relatively low carbon stock, but they tended to have higher carbon sequestration potential as compared with natural tropical forests. According to the research report of the High Carbon Stock Science Study [55], in 2015, it was estimated that oil palm plantation has a mean rate of annual C storage of 2.4 C ha1 yr1. C storage potential of an old growth forest was estimated to range between 3.5 and 5.5 C ha1 yr1. Although natural tropical forest has higher carbon sequestration potential as compared with oil palm plantation, introducing diverse species under integrated agroforestry of the agrisilvicultural system in oil palm plantation could increase the aboveground carbon (AGC) densities and carbon sequestration potential of the area which could outnumber the AGC densities of monoculture oil palm plantation. The total carbon stock per year was higher in young oil palm plantation. Oil palm (17 years) and oil palm (six years) had 2.29 and 2.39 Mg C ha1 yr1 but older oil palm (27 years) had only about 1.40 Mg C ha1 yr1. A higher rate of carbon sequestration was observed in young oil palm, whereas biomass and carbon accumulation declined in the older plantation.
The monoculture of oil palm has lower carbon stock as compared with the agroforestry system. Converting monoculture oil palm to the agroforestry system can help to increase carbon stock and C sequestration. A study by Rochmayanto [30] showed that the agroforestry system of oil palm and agarwood had a positive impact on carbon storage. For 25-year crop rotation, the carbon stock stored in an agroforestry system is much higher than in monoculture oil palm, that is, about 224.4% from 16.43 to 36.87 Mg C ha1. The aboveground carbon stock reported by Rochmayanto [30] was similar to the findings of this study which ranged from 30 to 50 Mg C ha1.
A study on carbon stock and sequestration potential of agroforestry systems in smallholder agroecosystems of sub-Saharan Africa by Thangata and Hildebrand [56], in 2012, showed that the agroforestry system can increase C sequestration in farmlands. The introduction of agroforestry increases C sequestration about 57% in annual crops without a major change to their crop combinations. Similarly, combining oil palm and agarwood in the same piece of land can help to increase carbon stock and C sequestration in oil palm plantation. Forest area has much higher aboveground carbon stock as compared with oil palm plantation. Since C sequestration is one of the main concerns in the palm oil industry, a new oil palm plantation should be established in the non-forest area or those with very low carbon stock.
Research findings on TEC were compared to a research conducted by Ziegler et al. [19] in tropical countries in Southeast Asia. Logged-over forest TEC was about 101 to 474 Mg C ha1, followed by agroforestry TEC at about 77 to 316 Mg C ha1, whereas monoculture oil palm TEC was about 85 to 292 Mg C ha1. In this study, TEC was lower as compared with the research conducted by Ziegler et al. [19]. Hamdan [49] stated that average AGC in the Malaysian forest is about 193.22 Mg C ha1 with trees density 408 tree ha1. Saner et al. [50], in 2012, showed the TEC in Malua Forest Reserve was lower as compared with Tawau Hill Park, which is about 167.9 Mg C ha1. Further comparison showed that the TEC in Tawau Hill Park is lower than the findings of Ziegler et al. [19] but higher than findings reported by Hamdan [57] and Saner et al. [58]. Similarly, this study was conducted in the tropical climate conditions and the TEC estimation followed the same method as the studies compiled by Ziegler et al. [19]. Despite the lower TEC values, this study showed similar pattern to the research conducted by Ziegler et al. [19] in which the forest contributed to higher TEC, followed by agroforestry and monoculture plantation.

5. Conclusions

Total carbon stock in the three agroforestry systems (i.e., agroforestry, monoculture, and natural forest) were 79.13, 85.40, and 78.28 Mg C ha1, respectively. Monoculture oil palm (16 and six years) had carbon stock of 76.44 and 60.29 Mg C ha1, respectively, whereas Tawau Hill Park had a total carbon stock of 287.29 Mg C ha1. Total carbon stock in the natural tropical forest is the highest, followed by the agroforestry system and monoculture. Therefore, forest area as the major carbon storage must be sustained to reduce the effect of global warming caused by increased emission of carbon in the atmosphere. The amount of carbon stock in a high-to-low order is the natural tropical forest, the oil palm agroforestry systems, and the monoculture oil palm plantation. The total ecosystem carbon stock in agroforestry systems is higher than the monoculture plantation. In terms of soil, the agroforestry and monoculture systems have higher soil carbon as compared with the natural tropical forest, whereas the natural tropical forest contains higher carbon stocks in its living tree biomass. Nonetheless, agroforestry systems have the potential to sequester C in above- and belowground. Converting a monoculture plantation into an agroforestry system can contribute to increasing carbon storage and C sequestration, although the total carbon stock in different land uses depends on vegetation, tree ages, and soil management. Therefore, this study suggests preserving the natural tropical forest, as well as promoting agroforest systems instead of monoculture plantation, which is in line with the national forest policy of Malaysia.

Author Contributions

All authors have read and agree to the published version of the manuscript. Conceptualization, N.A.B. and M.F.A.; methodology, H.S. and M.-H.P.; software, D.J.; validation, N.A.B., and H.S.; M.-H.P. and D.J.; formal analysis, N.A.B.; investigation, N.A.B. and M.F.A.; resources, N.A.B.; data curation, N.A.B.; writing—original draft preparation, N.A.B.; writing—review and editing, M.F.A.; visualization, M.B.M.; supervision, M.B.M.; project administration, N.A.B.; funding acquisition, M.B.M.

Funding

The authors acknowledge the Ministry of Higher Education’s (MOHE) research grant RACE/F1/STWN2/UMS/6 to the University Malaysia Sabah and the research grant MI-2019-013 to the Universiti Kebangsaan Malaysia (UKM) to conduct this study.

Acknowledgments

The authors acknowledge the support of the Balung River Plantation Sdn. Bhd. to conduct this study as well as the Sabah Parks for the permission granted to conduct the field sampling in the Tawau Hill Park forest.

Conflicts of Interest

The authors declare no conflict of interest.

References

  1. Jones, A.; Stolbovoy, V.; Tarnocai, C.; Broll, G.; Spaargaren, O.; Montanarella, L. Soil Atlas of the Northern Circumpolar Region; European Commission, Office for Official Publications of the European Communities: Luxembourg, Belgium, 2010; p. 119. [Google Scholar]
  2. Jacobson, M.; Charlson, R.J.; Rodhe, H.; Orians, G.H. Earth System Science: From Biogeochemical Cycles to Global Changes; Academic Press: Cambridge, MA, USA, 2000; Volume 72. [Google Scholar]
  3. Ismail, M.S. Forest management systems in Southeast Asia. In Advances in Asian Human-Environmental Research; Springer International Publishing: New York City, NY, USA, 2011; Volume 2, pp. 1–20. [Google Scholar]
  4. Islam, R.; Siwar, C.; Ismail, M.S. Impacts on tropical timber market developments in Malaysia. J. Appl. Sci. Res. 2010, 6, 324–330. [Google Scholar]
  5. Houghton, R.A. Balancing the global carbon budget. Annu. Rev. Earth Planet. Sci. 2007, 35, 313–347. [Google Scholar] [CrossRef] [Green Version]
  6. The Intergovernmental Panel on Climate Change (IPCC). Climate Change 2014. Summary for Policymakers; Synthesis Report; Intergovernmental Panel on Climate Change (IPCC): Geneva, Switzerland, 2014. [Google Scholar]
  7. Raihan, A.; Said, M.N.M.; Abdullaha, S.M.S. Climate change mitigation options in the Forestry Sector of Malaysia. J. Kejuruter. 2018, 1, 89–98. [Google Scholar] [CrossRef]
  8. Union of Concerned Scientist (UCS). Why does CO2 get most of the attention when there are so many other heat-trapping gases? USA. 2017. Available online: http://www.ucsusa.org/global_warming/science_and_impacts/science/CO2-and-global-warming-faq.html (accessed on 10 March 2017).
  9. Intergovernmental Panel on Climate Change (IPCC). Climate Change 2013: The Physical Science Basis; Working Group I Contribution to the Fifth Assessment Report of the Intergovernmental Panel on Climate Change (IPCC); Cambridge University Press: Cambridge, UK, 2013. [Google Scholar]
  10. Lasco, R.D. Forest carbon budgets in Southeast Asia following harvesting and land cover change. Sci. China Ser. C Life Sci. Engl. Ed. 2002, 45, 55–66. [Google Scholar]
  11. Laporte, N.T.; Stabach, J.A.; Grosch, R.; Lin, T.S.; Goetz, S.J. Expansion of industrial logging in Central Africa. Science 2007, 316, 1451. [Google Scholar]
  12. Koh, L.P.; Wilcove, D.S. Is oil palm agriculture really destroying tropical biodiversity? Conserv. Lett. 2008, 1, 60–64. [Google Scholar] [CrossRef]
  13. Food and Agriculture Organization of the United Nations (FAO). FAOSTAT; Food and Agriculture Organization of the United Nations: Rome, Italy, 2013; Available online: http://faostat.fao.org (accessed on 27 February 2018).
  14. Agus, F.; Henson, I.E.; Sahardjo, B.H.; Harris, N.; Van Noordwijk, M.; Killeen, T.J. Review of Emission Factors for Assessment of CO2 Emission from Land Use Change to Oil Palm in Southeast Asia; Reports from the Technical Panels of the second Greenhouse gas Working Group; Roundable on sustainable Palm Oil (RSPO): Kuala Lumpur, Malaysia, 2013; pp. 7–27. [Google Scholar]
  15. Consultancy, B. Greenhouse Gas Emissions from Palm Oil Production. In Literature Review and Proposals from the RSPO Working Group on Greenhouse Gases; Roundable on sustainable Palm Oil (RSPO): Kuala Lumpur, Malaysia, 2009; p. 57. [Google Scholar]
  16. Hashim, Z.; Subramaniam, V.; Harun, M.H.; Kamarudin, N. Carbon footprint of oil palm planted on peat in Malaysia. Int. J. Life Cycle Assess. 2018, 23, 1201–1217. [Google Scholar] [CrossRef]
  17. United Stated Department of Agriculture (USDA). Oilseeds: World Markets and Trades; Foreign Agricultural Service, United Stated Department of Agriculture (USDA): Washington, DC, USA, 2015; p. 16.
  18. Othman, J.; Alias, M.H.; Jusoh, M. Sustainability of growth in the Malaysian oil palm farm subsector. J. Int. Food Agribus. Mark. 2004, 16, 85–101. [Google Scholar] [CrossRef]
  19. Ziegler, A.D.; Phelps, J.; Yuen, J.Q.; Webb, E.L.; Lawrence, D.; Fox, J.M.; Bruun, T.B.; Leisz, S.J.; Ryan, C.M.; Dressler, W.; et al. Carbon outcomes of major land-cover transitions in SE Asia: Great uncertainties and REDD+ policy implications. Glob. Chang. Biol. 2012, 18, 3087–3099. [Google Scholar] [CrossRef]
  20. Chinade, A.A.; Siwar, C.; Ismail, S.M.; Isahak, A. A Review on carbon sequestration in Malaysian forest soils: Opportunities and barriers. Int. J. Soil Sci. 2015, 10, 17–27. [Google Scholar] [CrossRef]
  21. Chinade, A.A.; Ismail, S.M.; Siwar, C.; Isahak, A. Leveraging the potentials of soil carbon sequestration in sustaining forest ecosystems in Malaysia. Malays. For. 2014, 77, 91–100. [Google Scholar]
  22. Takimoto, A.; Nair, P.R.; Nair, V.D. Carbon stock and sequestration potential of traditional and improved agroforestry systems in the West African Sahel. Agric. Ecosyst. Environ. 2008, 125, 159–166. [Google Scholar] [CrossRef]
  23. SiwSiwar, C.; Chinade, A.A.; Mohamad, S.; Isahak, A. Economic valuation of soil carbon sequestration services in Malaysia’s forest sector: A review of possible approaches. J. Sustain. Sci. Manag. 2016, 11, 14–28. [Google Scholar]
  24. Udawatta, R.P.; Jose, S. Agroforestry strategies to sequester carbon in temperate North America. Agrofor. Syst. 2012, 86, 225–242. [Google Scholar] [CrossRef]
  25. Montagnini, F.; Nair, P.K.R. Carbon sequestration: An underexploited environmental benefit of agroforestry systems. Agrofor. Syst. 2004, 61, 281–295. [Google Scholar]
  26. Van Houten, H. Annual Report, 1996; International Centre for Research in Agroforestry (ICRAF): Nairobi, Kenya, 1997. [Google Scholar]
  27. Lal, R.; Kimble, J.M. Conservation tillage for carbon sequestration. Nutr. Cycl. Agroecosyst. 1997, 49, 243–253. [Google Scholar] [CrossRef]
  28. Mohamed, A.H.; Ibrahim, N.I.; Ghani, A.N.A. Agroforestry education and professional level links in Peninsular Malaysia. J. Sustain. Sci. Manag. 2013, 8, 161–170. [Google Scholar]
  29. Najib, L.A.; Mahmud, A.W. Agroforestry: An alternative approach towards timber and non-timber production. In Proceedings of the AIM Seminar on Maximizing Land Use Through Integrated Farming, Kuala Lumpur, Malaysia, 13 April 1999. [Google Scholar]
  30. Rochmayanto, Y. Enhancing carbon stock and economic potency of REDD+ activity on Oil Palm-Eaglewood Agroforestry Systems. In Proceedings of the First International Conference of Indonesian Forestry Researchers (INAFOR), Forestry Research Institute of Kuok, Indonesia, 5–7 December 2011. [Google Scholar]
  31. Benites, J.; Dudal, R.; Koohafkan, P. Land, the Platform for Local Food Security and Global Environmental Protection. In Prevention of Land Degradation, Enhancement of Carbon Sequestration and Conservation of Biodiversity Through Land Use Change and Sustainable Land Management with a Focus on Latin America and the Caribbean; Food and Agriculture Organization of the United Nations (FAO): Rome, Italy, 1999; pp. 37–42. [Google Scholar]
  32. Soehady, H.F.W.; Musta, B. Effect of micro-fabrics on uniaxial strength of weathered volcanic rocks from Tawau, Sabah. Borneo Sci. 2012, 30, 14–23. [Google Scholar]
  33. Huaimei, Y.; Wong, A.; Zakaria, M.A.B. Diversity of Frogs in Tawau Hills Park, Sabah, Malaysia. J. Trop. Biol. Conserv. 2019, 16, 229–251. [Google Scholar]
  34. Khalid, H.; Zin, Z.; Anderson, J.M. Quantification of oil palm biomass and nutrient value in a mature plantation: Above ground biomass. J. Oil Palm Res. 1999, 2, 23–32. [Google Scholar]
  35. Hairiah, K.; Rahayu, S. Pengukuran Karbon Tersimpan di Berbagai Macam Penggunaan Lahan; World Agroforestry Centre-ICRAF, SEA Regional Office: Bogor, Indonesia; University of Brawijaya: Unibraw, Indonesia, 2007. [Google Scholar]
  36. Basuki, T.M.; Van Laake, P.E.; Skidmore, A.K.; Hussin, Y.A. Allometric equations for estimating the above-ground biomass in tropical lowland Dipterocarp forests. For. Ecol. Manag. 2009, 257, 1684–1694. [Google Scholar]
  37. Houghton, R.A.; Hackler, J.L. Changes in terrestrial carbon storage in the United States. 1: The roles of agriculture and forestry. Glob. Ecol. Biogeogr. 2000, 9, 125–144. [Google Scholar]
  38. Darus, A.; Guerrero, H.C.; Paez, L.E.N.; Garcia, A.A.; Alvarez, F.A.; Toquica, S.M. Spread of Ganoderma Boninense and Vegetative Compatibility Studies of a Single Field Palm Isolates; Palm Oil Research Institute of Malaysia: Kuala Lumpur, Malaysia, 1996. [Google Scholar]
  39. Turner, P.D. Oil Palm Diseases and Disorders; The Incorporated Society of Planters: Kuala Lumpur, Malaysia; Oxford University Press: Oxford, UK, 1981; p. 280. [Google Scholar]
  40. Asner, G.P.; Brodrick, P.G.; Philipson, C.; Vaughn, N.R.; Martin, R.E.; Knapp, D.E.; Heckler, J.; Evans, L.J.; Jucker, T.; Goossens, B.; et al. Mapped aboveground carbon stocks to advance forest conservation and recovery in Malaysian Borneo. Biol. Conserv. 2018, 217, 289–310. [Google Scholar]
  41. Zarin, D.J.; Harris, N.L.; Baccini, A.; Aksenov, D.; Hansen, M.C.; Azevedo-Ramos, C.; Azevedo, T.; Margono, B.A.; Alencar, A.C.; Gabris, C.; et al. Can carbon emissions from tropical deforestation drop by 50% in 5 years? Glob. Chang. Biol. 2016, 4, 1336–1347. [Google Scholar]
  42. World Resources Institute (WRI). By the Numbers: The Value of Tropical Forests in the Climate Change Equation; World Resources Institute: Washington, DC, USA, 2018; Available online: https://www.wri.org/blog/2018/10/numbers-value-tropical-forests-climate-change-equation (accessed on 10 January 2019).
  43. Roshetko, J.M.; Lasco, R.D.; Angeles, M.S.D. Smallholder agroforestry systems for carbon storage. Mitig. Adapt. Strateg. Glob. Chang. 2007, 12, 219–242. [Google Scholar]
  44. Foreign Agricultural Service of United States Department of Agriculture (USDA). Malaysia: Stagnating Palm Oil Yields Impede Growth; Foreign Agricultural Service of United States Department of Agriculture (USDA): Washington, DC, USA, 2012.
  45. Lawrence, D. Regional-Scale variation in litter production and seasonality in tropical dry forests of southern Mexico. Biotropica 2008, 37, 561–570. [Google Scholar]
  46. International Atomic Energy Agency (IAEA). Management of Agroforestry Systems for Enhancing Resource Use Efficiency and Crop Productivity; Joint FAO/IAEA Division of Nuclear Techniques in Food and Agriculture; International Atomic Energy Agency (IAEA): Vienna, Austria, 2008. [Google Scholar]
  47. Campbell, C.A.; Selles, F.; Lafond, G.P.; Zentner, R.P. Adopting zero tillage management: Impact on soil C and N under long-term crop rotations in a thin Black Chernozem. Can. J. Soil Sci. 2001, 81, 139–148. [Google Scholar]
  48. Reddy, K.S.; Singh, M.; Tripathi, A.K.; Singh, M.; Saha, M.N. Changes in amount of organic and inorganic fractions of nitrogen in an Eutrochrept soil after long-term cropping with different fertilizer and organic manure inputs. J. Plant Nutr. Soil Sci. 2003, 166, 232–238. [Google Scholar]
  49. Dixon, R.K.; Brown, S.; Houghton, R.A.; Solomon, A.M.; Trexler, M.C.; Wisniewski, J. Carbon pools and flux of global forest ecosystems. Science 1994, 263, 185–190. [Google Scholar]
  50. Don, A.; Schumacher, J.; Greibauer, A. Impact of tropical land-use change on soil organic carbon stocksA meta-analysis. Glob. Chang. Biol. 2011, 17, 1658–1670. [Google Scholar]
  51. Guo, L.B.; Gifford, R.M. Soil carbon stocks and land use change: A meta-analysis. Glob. Chang. Biol. 2002, 8, 345–360. [Google Scholar]
  52. Murty, D.; Kirschbaum, M.U.F.; McMurtrie, R.E.; McGilvray, A. Does conversion of forest to agricultural land change soil carbon and nitrogen? A review of the literature. Glob. Chang. Biol. 2002, 8, 105–123. [Google Scholar]
  53. Bruun, T.B.; Mertz, O.; Elberling, B. Linking yields of upland rice in shifting cultivation to fallow length and soil properties. Agric. Ecosyst. Environ. 2006, 113, 139–149. [Google Scholar] [CrossRef]
  54. Neto, V.; Ainuddin, N.A.; Wong, M.Y.; Ting, H.L. Contributions of forest biomass and organic matter to above-and belowground carbon contents at Ayer Hitam Forest Reserve, Malaysia. J. Trop. For. Sci. 2012, 24, 217–230. [Google Scholar]
  55. The High Carbon Stock Science Study. TFA2020. Geneva, Switzerland. 2015. Available online: https://www.tfa2020.org/en/publication/high-carbon-stock-science-study/ (accessed on 15 February 2018).
  56. Thangata, P.H.; Hildebrand, P.E. Carbon stock and sequestration potential of agroforestry systems in smallholder agroecosystems of sub-Saharan Africa: Mechanisms for ‘reducing emissions from deforestation and forest degradation’ (REDD+). Agric. Ecosyst. Environ. 2012, 158, 172–183. [Google Scholar] [CrossRef]
  57. Hamdan, O. Remote sensing for tropical forest biomass in Malaysia. In Proceedings of the Workshop on New Approaches for Measuring and Monitoring Carbon Stock and Forest Cover in the Tropics, Cat Tien National Park, Vietnam, 9–12 November 2009; Forest Research Institute Malaysia (FRIM): Kuala Lumpur, Malaysia, 2009. [Google Scholar]
  58. Saner, P.; Loh, Y.Y.; Ong, R.C.; Hector, A. Carbon stocks and fluxes in tropical lowland dipterocarp rainforests in Sabah, Malaysian Borneo. PLoS ONE 2012, 7, 29642. [Google Scholar] [CrossRef] [Green Version]
Figure 1. The Balung River Plantation area in Tawau City, Sabah, Malaysia.
Forests 11 00210 g001
Figure 2. Tree density in different land use.
Forests 11 00210 g002
Table 1. Allometric equations used for tree aboveground biomass estimation.
Tree SpeciesAllometric EquationSource
Forest Standw = exp (−1.935 + (1.981 × ln DBH) + (0.541 × ln h))[36]
Oil Palmw = (725 + 197h) × 0.2[34]
Agarwoodw = 0.1043 × DBH2.6[35]
Note: w, aboveground biomass (AGB); DBH, diameter at breast height; and h, tree height.
Table 2. Aboveground carbon stock density across different pools (living tree, shrub layer, and organic layer) in different land use.
Land UseLiving Tree Carbon Stock (Mg C ha−1)Shrub Layer Carbon Stock (Mg C ha−1)Organic Layer Carbon Stock (Mg C ha−1)
Oil PalmAgarwoodForest StandTotal
Oil Palm (27 yrs);
Agarwood (7 yrs)
35.04 ± 1.90 a2.84 ± 1.32 a-37.88 ± 3.20 a0.05 ± 0.01 a0.14 ± 0.02 a
Oil Palm (20 yrs);
Agarwood (7 yrs)
35.43 ± 1.79 a0.08 ± 0.03 a-35.51 ± 1.78 a0.04 ± 0.005 a0.10 ± 0.02 a
Oil Palm (17 yrs);
Agarwood (5 yrs)
38.94 ± 2.41 a0.07 ± 0.04 a-39.01 ± 2.42 a0.03 ± 0.002 a0.12 ± 0.04 a
Oil Palm (16 yrs)33.19 ± 1.40 a--33.19 ± 1.40 a0.09 ± 0.01 ab0.07 ± 0.01 a
Oil Palm (6 yrs)14.35 ± 1.38 b--14.35 ± 1.38 a0.14 ± 0.05 b0.34 ± 0.05 a
Natural Tropical
Forest
--249.90 ± 61.44249.90 ± 61.44 b0.07 ± 0.01 a1.02 ± 0.25 b
p-valuep = 0.003p = 0.068-p < 0.001p = 0.006p < 0.001
Note: Data are mean ± standard error (living tree, n = 3; shrub layer and organic layer, n = 15); different letters between columns indicate significant difference across the groups according to Tukey’s test (p < 0.05).
Table 3. Soil carbon stock in different soil layers of different land use.
Land UseSoil Carbon Stock (Mg C ha−1)
0–5 cm5–10 cm10–30 cmTotal Soil Carbon (0–30 cm)
Oil Palm (27 yrs);
Agarwood (7 yrs)
9.97 ± 1.08 a7.41 ± 0.89 a23.68 ± 1.36 a41.06 ± 2.82 a
Oil Palm (20 yrs);
Agarwood (7 yrs)
11.32 ± 1.20 a10.35 ± 0.76 a28.08 ± 1.03 a49.75 ± 2.33 a
Oil Palm (17 yrs);
Agarwood (5 yrs)
9.65 ± 1.73 a7.43 ± 0.97 a22.04 ± 1.87 a39.12 ± 3.99 a
Oil Palm (16 yrs)10.28 ± 1.63 a10.75 ± 1.07 a22.06 ± 1.89 a43.09 ± 2.02 a
Oil Palm (6 yrs)9.68 ± 0.76 a11.34 ± 3.41 a24.44 ± 6.99 a45.46 ± 9.64 a
Natural Tropical
Forest
12.60 ± 2.32 a7.06 ± 1.28 a16.64 ± 1.75 a36.30 ± 4.74 a
p-valuep = 0.727p = 0.244p = 0.082p = 0.562
Note: Data are mean ± standard error (n = 9); different letters between columns indicate significant difference across the groups according to Tukey’s test (p < 0.05).
Table 4. Total ecosystem carbon stock in different land use.
Land UseCarbon Stock (Mg C ha−1)Total Ecosystem Carbon Stock (Mg C ha−1)
Living TreeShrub LayerOrganic LayerSoil
Oil Palm (27 yrs);
Agarwood (7 yrs)
37.88 (48%)0.05 (<1%)0.14 (<1%)41.06 (52%)79.13 ± 3.18 a
Oil Palm (20 yrs);
Agarwood (7 yrs)
35.51 (42%)0.04 (<1%)0.10 (<1%)49.75 (58%)85.40 ± 1.79 a
Oil Palm (17 yrs);
Agarwood (5 yrs)
39.01 (50%)0.03 (<1%)0.12 (<1%)39.12 (50%)78.28 ± 2.39 a
Oil Palm (16 yrs)33.19 (43%)0.09 (<1%)0.07 (<1%)43.09 (56%)76.44 ± 4.40 a
Oil Palm (6 yrs)14.35 (24%)0.14 (<1%)0.34 (1%)45.46 (75%)60.29 ± 1.38 a
Natural Tropical
Forest
249.90 (87%)0.07 (<1%)1.02 (<1%)36.30 (13%)287.29 ± 61.21 b
p-value----p < 0.001
Note: Data are mean ± standard error (n = 3); different letters between columns indicate significant difference across the groups according to Tukey’s test (p < 0.05); shown in parentheses are the percentage compositions of the different carbon pools.

