Abstract
Although the understory vegetation abundance, diversity, and composition associated with stand development in natural forests have been well reported, only a few studies have examined the age-related changes of understory vegetation in fast-growing planted forests in reclaimed soils. This study measured the understory vegetation and soil variables in 8-, 12-, and 18-year-old poplar plantations in reclaimed coastal saline soil of Eastern China. This study examined how the abundance, diversity, and composition changed with stand development and the soil variables. Further, structural equation modeling (SEM) was used to evaluate the direct and indirect factors influencing the abundance and plant diversity throughout stand development. Herb abundance was significantly higher in the youngest and oldest stands, whereas shrub abundance was higher in the middle-aged stands. Shannon’s diversity index was significantly higher in the youngest stand for herbs, whereas it was highest in the middle-aged stands for shrubs. A multivariate analysis revealed that the herb and shrub composition were influenced by the stand age, total soil carbon and soil pH. The most parsimonious SEM model showed the negative direct effects of the stand age and the negative indirect effects of the stand age via the soil variables on shrub abundance, shrub diversity, and herb diversity, suggesting that the increase of overstory biomass with the stand age reduces resources available for the understory. Our results revealed that understory diversity and composition might change with stand development mediated by the changes in understory light and soil resources in fast-growing plantations.
Keywords:
understory; Poplar plantation; abundance; diversity; composition; stand age; SEM; soil properties 1. Introduction
Understory vegetation (woody and non-woody) is an essential constituent of forest ecosystems [1], as it comprises the majority of plant diversity, containing up to 90% of the plant species in temperate deciduous forests, and plays a significant role in maintaining the structure and functionality of forest ecosystems [2]. Understory vegetation is an integral component of food chains [1] (e.g., as habitat for wildlife also providing microclimatic regulation). Despite the low (1–2%) contribution of understory vegetation to aboveground biomass in forest ecosystems, its role in facilitating energy flows and nutrient recycling is very significant in proportion to its biomass [2,3,4,5]. These characteristics may highlight the importance of understory vegetation in a framework of ecosystem functionality.
In recent decades, fast-growing exotic tree species, such as eucalyptus [6], pine [7], and poplar [8] have been widely planted to meet increasing demands for industrial timber and pulp. Poplar (Populus deltoides L. ‘Lux’) is a fast-growing deciduous tree species that is extensively planted in the Northern Jiangsu Province of China, due to its high productivity and diverse end uses being the dominant broadleaved forest species in China [9]. In 2003, poplar accounted for 13.5% of the total planted forest area in China [10]. Plantation forests are also recognized as an important element of the global forest cover [11], and are increasingly emerging as highly relevant in mitigating global climate change. The intensive management of fast-growing tree species in plantations does not only assist with mitigating the increased demand for timber, but also enhancing carbon sequestration [12].
Planted poplar trees accumulate and store carbon and nutrients aboveground, which in due time, are cycled influencing soil processes [13,14]. However, this might increase the competition for available resources at some stages during stand development. Understory composition shifts from pioneer to shade-tolerant species following canopy closure [15]. The overstory may create altered understory conditions in terms of more shade and coolness, along with changes in moisture that facilitate the establishment of shade-tolerant plant species [16,17]. Plant diversity seems to decline with age, which is governed by the competition for light and the loss of shade-intolerant species [8]. Understory biomass, production and turnover are mainly influenced by the stand age, soil resources and heterogeneity in light conditions mediated by the overstory composition [18]. At the initial stage, there is rapid colonization of herbaceous species in the understory due to high light intensity, soil nutrients and abundant space [5,15,19].
Overstory development reduces the resources available to the understory, thereby decreasing the abundance of shade-intolerant and nutrient-demanding herbaceous understory in natural forests [20,21,22,23,24]. Therefore, the understory abundance, diversity, and composition are also expected to change with stand development because of changes in resource availability [5,25]. The light and soil resources also have profound effects on the abundance, diversity and composition of the understory vegetation of reclaimed highly disturbed areas [26]. A chronosequence study of 5, 16 and 27 years-old Pinus radiata D. Don plantation forests in different biogeographic regions of New Zealand showed that both understory richness and the cover of exotic species decreased significantly with stand development, richness and the cover of indigenous species was highest in the oldest stands, while the overall richness was lowest at middle-aged stands [27].
Understory abundance and diversity are significantly affected by light, as the understory abundance decreases under low light, which reduces the competition for soil resources and thus, increases understory species richness [23]. Soil nutrients also have a positive influence on species richness in natural boreal forests [2,23,28,29]. The changes in environmental conditions as the result of fast-growing tree plantations have been considered as a key factor that drives the variation in understory plant diversity and composition [30,31,32,33]. A previous study in natural Pinus ponderosa Douglas ex C.Lawson forests showed that the richness and cover of understory vegetation were significantly affected by soil organic matter and soil nitrogen, being also associated to overstory plant composition and soil physical properties [34]. The soil moisture has shown to influence species distributions across different stand ages [35]. Collectively, soil properties can enforce direct and indirect restrictions on plant diversity [34]. Therefore, the soil physical and chemical properties are relevant to changes in understory diversity and composition over the life of a stand.
Understory vegetation makes a significant contribution to overall species diversity in forest plantations as many plant species are restricted to this layer [36,37]. Although previous studies of the abundance, diversity, and composition of understory vegetation have been carried out in natural forests [38,39], the dynamics of understory vegetation in plantation forests, in particular by various life forms, in relation to stand development remain poorly understood. This study was designed to examine how (1) the abundance, diversity, and composition of understory vegetation change with stand development in a fast-growing poplar plantation, and (2) the soil factors affect the abundance, diversity, and composition of understory vegetation. This study hypothesized that the abundance, diversity, and composition of understory vegetation are significantly influenced by the stand age, because of the direct effect of time for understory colonization [18,40]. In addition, it was hypothesized that understory abundance and diversity would decrease with stand development because of a decrease in available resources, i.e., light and nutrients [5].
2. Materials and Methods
2.1. Site Description
This study was conducted at the Dongtai Forestry Farm, which is located in a coastal area of the Yellow Sea in the Northern Jiangsu Province of Eastern China (102°49′E, 32°52′ N). This area experiences a north subtropical to warm, temperate climate with monsoon influences. The growing season extends from May to October, whereas the dry season spans from November to April [14]. The mean annual temperature is 14.6 °C, with small monthly variations during the growing season (i.e., 24.1 °C in June, 28.1 °C in July, 27.7 °C in August, and 21.6 °C in September), and a frost-free period of 220 days [14]. The mean annual precipitation is 1051 mm, with a mean relative humidity of about 88%. The plantation is located on reclaimed land from the sea via the construction of coastal levees, characterized as saline land of the silting lower reaches of the coastal alluvial soils [14]. Once the alluvial soils started to form above sea level after five to ten years, the land was typically converted to tree plantations with species such as Populus deltoides L. ‘Lux’ (Italy-69/55), Populus euramericana ‘San martino’ (Italy-72/58), Populus deltoides L. ‘35/66’, Populus euramericana L. ‘JP7’, Metasequoia glyptostroboides Miki ex Hu, and Ginkgo biloba L. [14]. During the establishment of these plantations, the shrub and herb species present were retained.
2.2. Sampling Design and Field Measurement
This study followed a chronosequence approach by sampling stands of the different ages [41,42]. The selection was 8-, 12-, and 18-year-old poplar (Populusdeltoidescv. ‘I-35’) plantations with approximately uniform site conditions and management histories [42,43]. A completely randomized design was used with 15 replications (sites) for each age class plantation, i.e., stratified random sampling. The distance between any two adjacent 25 m × 30 m sample plots was greater than 10 m. A total of 45 plots (three age classes × 15 plots) were established.
Within each sample plot, five quadrats of 1 × 1 m and 2 × 2 m to for the herb and shrub layer, respectively, were systematically established. The shrubs were defined as any species with heights between 1.3 and 4.0 m [19], and as such, the species found in the shrub layer could also be present in the herb layer. All vascular and non-vascular plants of <1.3 m in height were sampled as herb understory vegetation [5,19]. Understory vegetation surveys were conducted during July 2013 when the peak of vegetation cover occurs, and all plants could be identified to the species level. The cover (%) of each species was visually determined following methods previously described [5,19]. The quadrat data were pooled by individual sample plot prior to the statistical analysis. All analyses were done separately for herbs and shrubs.
2.3. Laboratory Analyses
Within each of the 45 sample plots, five random locations were chosen to conduct soil sampling by excavating to a depth of 30 cm using a hand shovel. The soil samples from the five locations within each sample plot were pooled to a composite sample and transported to the laboratory in ice coolers for the analysis of soil physical and chemical properties. In the laboratory, total carbon, total nitrogen, C:N ratio, soil moisture, and soil pH content in the 0–30 cm layers were determined. The soil moisture content was determined using the classical methods of drying and weighing [44]. The air dried samples were used to analyze the total carbon and total nitrogen using an element analyzer (Elementtar, vario ELIII Analysen Systeme GMbH, Hanau, Germany). The soil pH was measured in a 1:2.5 soil to the water suspension [45].
2.4. Data Analysis
2.4.1. Species Diversity Indices
Species abundance (% cover) was used to calculate the Shannon-Wiener index (H′), which is most widely used to assess the diversity of the understory vegetation [46] as, H′ = Σ(pi)ln(pi), where, pi is the relative abundance of the ith species, expressed as a proportion of the total in the community, and ln is log base-e. These calculations were performed separately for the herb and shrub layers.
2.4.2. Influence of Stand Age and Environmental Factors on Understory Abundance, Diversity, and Composition
The effects of stand age on the abundance (% cover) and diversity (Shannon’s diversity index) of the herbs and shrubs and soil properties were tested by a one-way analysis of variance (ANOVA). Additionally, Pearson’s correlation analysis was used to test the associations of soil variables with the abundance and diversity of herbs and shrubs. The effects of the stand age and soil variables on the species composition (all species covers as a matrix) were tested by permutational multivariate analysis of variance (perMANOVA) [47]. PerMANOVA was performed using the adonis function of the vegan package in R software [48]. Nonmetric multidimensional scaling (NMDS) was then used to graphically show how the soil properties affect the understory composition [49,50,51]. NMDS is recognized as a robust ordination technique that avoids normality and homogeneity assumptions, which are commonly not met for ecological community data [52]. NMDS ordinations were carried out to test the effects of stand age and soil variables on the species composition with the metaMDS and envfit function of the vegan package in the R software [48]. All analyses were conducted with the R statistical software, version 3.5.2 [53].
2.4.3. Structural Equation Modeling
Structural equation modeling (SEM) is a multivariate statistical technique that provides the link between empirical observations and theoretical hypotheses [54]. This method is preferred by the researcher because it estimates the multiple and interrelated dependence among variables in a single analysis [5]. As the soil variables were highly correlated, a composite soil variable, which is a combined influence of measured soil variables (e.g., total carbon, total nitrogen, C:N ratio, soil moisture, and soil pH), was created separately for the abundance and diversity of herb and shrub vegetation using linear regression. It was found that the soil variables were insignificant (p < 0.05) for the herb abundance. Therefore, SEM was fitted with the direct effects of the stand age and soil variables and the indirect effects of the stand age via soil variables on the shrub abundance, shrub diversity, and herb diversity. The model structure was based on our introduced hypotheses. Several tests were used to determine the final models. The maximum likelihood chi-square tests were used to determine the model’s goodness of fit, and the model was considered a good fit if the p-value was >0.05 [55]. Asthe chi-square test may be influenced by the sample size [56], the comparative fit index (CFI) and Tucker-Lewis index (TLI) were also employed to examine the adequacy of the model fit to the data. The CFI and TLI are known to be less affected by the sample size, ranging from 0 to 1, with values >0.9 indicating an acceptable model fit [57]. The standardized coefficient value, which ranged from 0 to 1 (i.e., values closer to 1 indicate a greater degree of influence), was examined to evaluate the relative importance of the relationships between the variables. The SEM was fitted and analyzed using the sem function of the laavan package in the R statistical software [57].
3. Results
3.1. Influence of Stand Age on Understory Abundance and Diversity
A total of 98 understory species were recorded across the 45 sample plots, which included 75 herb species and 23 shrub species. The ANOVA revealed that herb abundance was significantly lower in the 12-year-old whereas shrub abundance was the highest in the 12-year-old compared to other stands (Figure 1A; Table 1). Herb diversity was significantly higher in the 8-year-old stands without significant differences in diversity between the 12- and 18-year-old stands (Figure 1B; Table 1). Shrub diversity was the highest in the 12-year-old stands with the lowest in 18-year-old stands (Figure 1B; Table 1). Shrubs had higher coefficients of variation for both the abundance and diversity compared to herbs (Table 1).
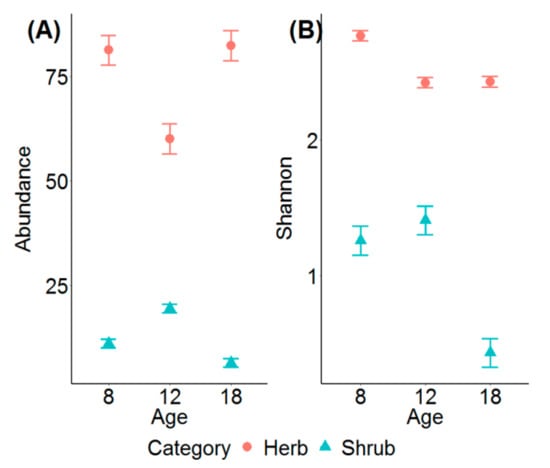
Figure 1.
The differences (mean ± 1SE) in (A) abundance (% cover), and (B) Shannon diversity index of the herb and shrub layers among three stand ages.

Table 1.
One-way analysis of variance (ANOVA). The estimated plot level mean values of the abundance and Shannon’s diversity index for the herb and shrub vegetation categories, the total soil carbon (total C, g kg−1), the total soil nitrogen (total N, g kg−1), C:N ratio, the soil moisture (%), and the soil pH for three stand ages of a poplar plantation. Separation of means was determined by a Tukey test where applicable. Different letters indicate that means were significantly different at p < 0.05. The degrees of freedom were 2 for the nominator and 42 for the denominator for all analyses.
The total carbon was significantly higher in the 12- and 18-year-old than 8-year-old stands, with no difference in soil nitrogen among the stand age classes (Table 1). The C:N ratio and soil moisture were the highest in the 12-year-old stands and the lowest in the 8-year-old stands. The soil pH was the highest in the 18-year-old stands (Table 1). The measured soil properties, except for pH, exhibited high coefficients of variation, indicating that the distribution of soil variables was highly diverse.
3.2. Influence of Soil Factors on the Understory Abundance, Diversity, and Composition
Herb abundance was positively correlated to soil pH (r = 0.35, p < 0.05), whereas shrub abundance was negatively correlated to soil pH (r = −0.61, p < 0.05) and positively correlated to the C:N ratio (r = 0.30, p < 0.05) (Table 2). This suggested that herb species were most abundant in areas with high pH, while shrub abundance decreased with high pH and low C:N ratio. Herb diversity was negatively correlated to total carbon (r = −0.36, p < 0.05) and the C:N ratio (r = −0.32, p < 0.05), whereas shrub abundance was negatively correlated to soil pH (r = −0.57, p < 0.001) (Table 2). This suggested that herb diversity was low in areas with high soil carbon content and the C:N ratio, while shrub diversity decreased at high soil pH.
Table 2.
Pearson’s correlation between the soil properties and the abundance and diversity of herbs and shrubs. Significance of main effects are shown as: *, significant at p < 0.05; and ***, significant at p < 0.001.
The perMANOVA analysis revealed that the composition of herbs and shrubs differed between the stand ages (p < 0.001). The stand age explained the largest proportion of the compositional variation being 51% and 39% for herbs and shrubs, respectively. The grouping of species by stand age in the ordination space revealed clear compositional separations among the stand age classes for herbs (Figure 2A) and shrubs (Figure 2B).
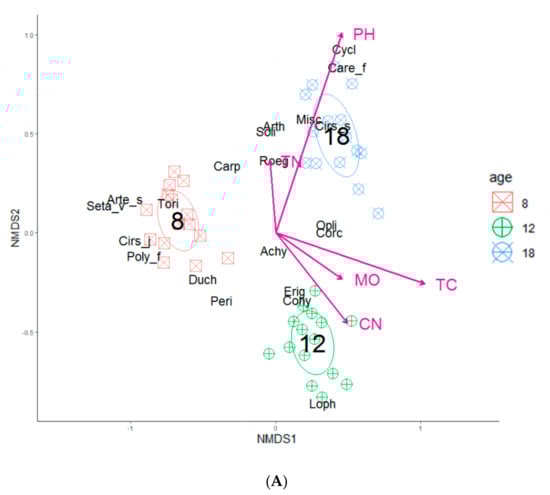
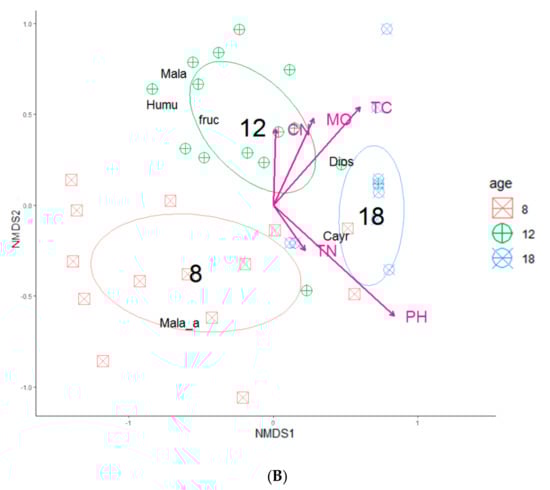
Figure 2.
Non-metric multidimensional scaling (NMDS) ordination of study plots across understory species compositions based on (A) herb and (B) shrub layers across three different strand ages (8-, 12-, and 18-years). In each diagram, only total carbon and soil pH showed significant goodness of fit based on post-hoc correlations (p < 0.05) that were represented as vectors. The abbreviated species names in the figures are given Table S1.
The NMDS analysis using the soil variables indicated that the herb and shrub composition were significantly (p < 0.05) related to total carbon and soil pH (Table 3 and Table 4; Figure 2). Total nitrogen, C:N ratio, and soil moisture were insignificant for both vegetation categories under study.
Table 3.
Permutational multivariate analysis of variance (perMANOVA) examining the influence of the stand age, total soil carbon, total soil nitrogen, C:N ratio, soil moisture, and soil pH content on the herb and shrub species composition. Significance of main effects are shown as: * p < 0.05, ** p < 0.01, *** p < 0.001, and R2 is the fit index of the model.
Table 4.
Nonmetric multi-dimensional scaling (NMDS) showing the associations between the composition of herbs and shrubs and soil variables. The significant relationships are in bold, and R2 is the fit index of the model.
3.3. Structural Equation Modeling
The resultant SEM models (Figure 3) yielded adequate fits for shrub abundance (χ2 = 0.000, df = 3, p = 0.000, CFI = 1; TLI = 1), herb diversity (χ2 = 0.000, df = 3, p = 0.000, CFI = 1; TLI = 1), and shrub diversity (χ2 = 0.000, df = 3, p = 0.000, CFI = 1.000; TLI = 1). In the final SEM, the stand age had a negative direct (standardized coefficient, r = −0.20) and indirect effect via soil properties (r = −0.15 × 0.62 = −0.09) on shrub abundance (Figure 3A). The stand age had a negative direct effect on herb diversity (r = −0.60) and shrub diversity (r = −0.41), and negative indirect effects via soil variables on herb diversity (r = −0.04) and shrub diversity (r = −0.16) (Figure 3B,C).
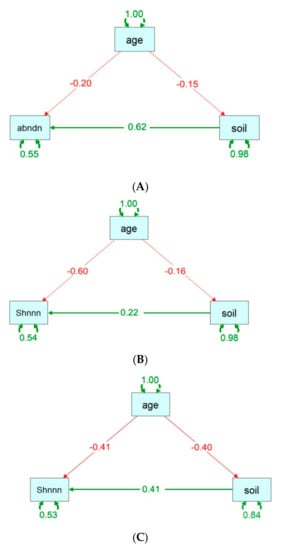
Figure 3.
Structural equation modeling (SEM) for (A) shrub abundance, (B) herb Shannon, and (C) shrub Shannon, linking the soil variables with species abundance and diversity. The stand age was fitted as direct pathways of influence on the abundance or diversity, while the stand age via the soil condition was fitted as indirect pathways of influence. The abbreviations are denoted as follows: abndn (abundance), shnnn (Shannon’s diversity index), age (stand age), and soil (composite soil variables).
4. Discussion
4.1. Influence of Stand Age on Understory Abundance and Diversity
This study supported our fundamental hypothesis that the abundance, diversity and composition of understory species change with stand development in poplar plantations. Our result suggests that young poplar plantations generally exhibit greater herb diversity in contrast to mature stands. The changes in species composition with the stand age and soil variables of this study could be attributed to the measured soil carbon, nitrogen, moisture and pH, as well as the light availability in young stands [10,58]. The prediction of understory plant diversity and composition can be a difficult task [39]. Our results confirmed this as they revealed the diverse results of the increased or decreased abundance and diversity with the stand age, which also varied between herbs and shrubs. For example, herb abundance was greatest in young and old stands, while shrub abundance was greatest in the middle-aged stands.
Our findings of declining herb abundance from young to middle-aged stands are consistent with other studies [59,60]. Our finding of the reduced shrub abundance in the oldest stand might be attributed to reduced light availability in the understory [19,61,62,63,64], lower soil moisture [65], and increased canopy shading [30]. Further, greater aboveground biomass in mature stands may require additional nutrients and thus reduces the nutrients available to herbs and shrubs [14]. The contrasting age-dependent patterns of herb abundance versus shrub abundance suggest that resource competition does not only occur between the overstory and the understory, but also between the shrub and herb layers [22]. The positive relationship between total soil carbon and understory diversity may suggest a positive plant diversity effect on the soil carbon pool [66].
The age-dependent patterns in understory vegetation characteristics could be attributed to understory light availability [5,33]. The studies have suggested that the high light availability in young poplar plantations was well suited for the growth of heliophytes, whereas low light availability in older plantations was better suited for neutrophilia or shade plants [30]. In the study area, the high light availability in young but low in middle-aged poplar stands might have contributed to low herb abundance but greater shrub abundance in the middle-aged stands since understory light availability in young poplar stands tends to be an important determinant for understory vegetation abundance [10]. The structural and environmental heterogeneity increases significantly at later stand development stages in fast-growing tree plantations due to canopy stratification [67]. As such, the increased structural diversity in fast-growing tree plantations is typically associated with increasing plant diversity and abundance [68,69]. Overstory structure, as influenced by stand development, is a key factor that determines the available levels of light and soil resources in the understory [2,19,70,71], which in turn impacts the abundance and diversity of understory species [22,38]. One of the limitations of our study in assessing abundance and diversity was that the overstory structures and understory light availability were not measured, which are considered important factors in the analysis of understory diversity [5].
4.2. Influence of Soil Factors on Understory Abundance, Diversity and Composition
Soil resources are also important drivers of understory abundance, diversity, and composition in poplar plantations, as shown in this study. This study observed the associations between understory abundance and diversity with soil total carbon, C:N ratio, and soil pH as shown by a correlation analysis. The soil factors were recognized as key factors for understory plant diversity [72]. In our study, herb abundance was positively, but shrub abundance was negatively correlated with soil pH. However, the herb diversity was negatively correlated with total carbon and the C:N ratio, and shrub diversity was negatively correlated with soil pH. These results suggest that controls for understory abundance and diversity could be decoupled [15,23].
Our perMANOVA results showed that the soil properties (i.e., total carbon, and soil pH) were the most significant factors that mediated the distribution of understory vegetation, with others reporting similar findings [73,74,75]. It was found that the total carbon and soil pH were critical towards explaining the variation of the understory vegetation composition. This finding is consistent with the ideas that soil nutrition played a vital role in understory species composition [76]. The herb species in middle-aged stands located in the bottom right of the NMDS plot are related to a habitat with a relatively low total carbon, soil moisture, and C:N ratio, while in the older stands, the habitats had a relatively high total nitrogen and soil pH (Figure 2a). The shrub species in the middle-aged stands located in the top left of the NMDS plot are related to a habitat with a relatively high total carbon, soil moisture, and C:N ratio, while in the older stands, the habitats were relatively low in total nitrogen and soil pH (Figure 2b). These results suggest that the soil chemical characteristics play important roles not only in natural forests where substrate heterogeneity is high [5,18], but also in single-tree species plantations from reclaimed soils with low substrate heterogeneity.
4.3. Structural Equation Modeling
This study found that the stand age negatively affected the understory abundance and diversity. This result was not consistent with a previous study where the stand age was shown to have a significant positive effect on understory cover and richness [5]. The difference in the stand age effects between our study and Kumar et al. [5] could be attributed to the fact that bryophytes were included in the latter but not in our study since bryophytes are slow colonizers. Thus, the stand age played strong positive roles in their abundance and diversity. Our finding that the soil properties influence the understory vegetation diversity was similar to other studies [77,78,79]. Our SEM result suggests that the increase of overstory biomass with stand development reduces both light and soil resources available for the understory abundance and diversity. This result was consistent with the understanding that resource availability is a major determinant of understory vegetation abundance and diversity [4,22,80].
5. Conclusions
Our study demonstrated that the abundance, diversity, and composition of understory vegetation differed across a stand age gradient of poplar plantations. The soil properties varied significantly with the stand age and influenced the understory abundance, diversity, and composition. The negative direct effects of the stand age and the negative indirect effects of the stand age via soil factors on the understory vegetation suggest that the development of the overstory reduces the resource available for the understory vegetation in the fast-growing poplar plantations. Our work may contribute to an improved elucidation of the changes in the abundance, diversity, and composition of understory vegetation in forest plantations. To fully elucidate the ecosystem functionality of understory vegetation in plantations, as this study was concentrated on but one experimental setup, there is a need to examine the patterns of understory abundance, diversity, and composition in multiple and more expansive spatial contexts.
Supplementary Materials
The following are available online at https://www.mdpi.com/1999-4907/10/9/764/s1, Table S1: Species name, their abbreviation, plant category and counted numbers by stand ages.
Author Contributions
D.R.P., H.R. and Z.G. designed the study and collected data; M.K.C. analyzed data and drafted the paper; H.E.B. and D.R.P. subsequently contributed to writing; H.Y.H.C., H.R., H.E.B., M.K.C. and D.R.P. reviewed and edited the final version of paper; H.R. administered the project and acquired funding.
Funding
This research was mainly supported by the National Key Research and Development Program of China (No. 2016YFD0600204) and the National Basic Research Program of China (973 Program, No. 2012CB416904), and partially supported by the Priority Academic Program Development of Jiangsu Higher Education Institutions.
Conflicts of Interest
The authors declare no conflicts of interest.
References
- MacLean, D.A.; Wein, R.W. Changes in understory vegetation with increasing stand age in New Brunswick forests: Species composition, cover, biomass, and nutrients. Can. J. Bot. 1977, 55, 2818–2831. [Google Scholar] [CrossRef]
- Gilliam, F.S. The ecological significance of the herbaceous layer in temperate forest ecosystems. BioScience 2007, 57, 845–858. [Google Scholar] [CrossRef]
- Muller, R.N. Nutrient relations of the herbaceous layer in deciduous forest ecosystems. In The Herbaceous Layer in Forests of Eastern North America; Oxford University Press: New York, NY, USA, 2003; pp. 15–37. [Google Scholar]
- Kumar, P.; Chen, H.Y.; Thomas, S.C.; Shahi, C. Effects of coarse woody debris on plant and lichen species composition in boreal forests. J. Veg. Sci. 2017, 28, 389–400. [Google Scholar] [CrossRef]
- Kumar, P.; Chen, H.Y.; Thomas, S.C.; Shahi, C. Linking resource availability and heterogeneity to understorey species diversity through succession in boreal forest of Canada. J. Ecol. 2018, 106, 1266–1276. [Google Scholar] [CrossRef]
- Gerber, J.F. Conflicts over industrial tree plantations in the South: Who, how and why? Glob. Environ. Chang. 2011, 21, 165–176. [Google Scholar] [CrossRef]
- Licata, J.A.; Gyenge, J.E.; Fernández, M.E.; Schlichter, T.M.; Bond, B.J. Increased water use by ponderosa pine plantations in northwestern Patagonia, Argentina compared with native forest vegetation. For. Ecol. Manag. 2008, 255, 753–764. [Google Scholar] [CrossRef]
- Weih, M.; Karacic, A.; Munkert, H.; Verwijst, T.; Diekmann, M. Influence of young poplar stands on floristic diversity in agricultural landscapes (Sweden). Basic Appl. Ecol. 2003, 4, 149–156. [Google Scholar] [CrossRef]
- Fang, S.; Xu, X.; Yu, X.; Li, Z. Poplar in wetland agroforestry: A case study of ecological benefits, site productivity, and economics. Wetl. Ecol. Manag. 2005, 13, 93–104. [Google Scholar] [CrossRef]
- Li, Y.; Chen, X.; Xie, Y.; Li, X.; Li, F.; Hou, Z. Effects of young poplar plantations on understory plant diversity in the Dongting Lake wetlands, China. Sci. Rep. 2014, 4, 6339. [Google Scholar] [CrossRef]
- Wang, H.F.; Lencinas, M.V.; Friedman, C.R.; Wang, X.K.; Qiu, J.X. Understory plant diversity assessment of Eucalyptus plantations over three vegetation types in Yunnan, China. New For. 2011, 42, 101–116. [Google Scholar] [CrossRef]
- Zhang, X.; Zhang, X.; Han, H.; Shi, Z.; Yang, X. Biomass Accumulation and Carbon Sequestration in an Age-Sequence of Mongolian Pine Plantations in Horqin Sandy Land, China. Forests 2019, 10, 197. [Google Scholar] [CrossRef]
- Ge, X.M.; Tian, Y.; Tang, L.Z. Nutrient Distribution Indicated Whole-Tree Harvesting as a Possible Factor Restricting the Sustainable Productivity of a Poplar Plantation System in China. PLoS ONE 2015, 10, e0125303. [Google Scholar] [CrossRef] [PubMed]
- Ge, Z.W.; Fang, S.Y.; Chen, H.Y.H.; Zhu, R.W.; Peng, S.L.; Ruan, H.H. Soil Aggregation and Organic Carbon Dynamics in Poplar Plantations. Forests 2018, 9, 508. [Google Scholar] [CrossRef]
- Hart, S.A.; Chen, H.Y. Understory vegetation dynamics of North American boreal forests. Crit. Rev. Plant Sci. 2006, 25, 381–397. [Google Scholar] [CrossRef]
- Pugnaire, F.I.; Luque, M.T. Changes in plant interactions along a gradient of environmental stress. Oikos 2001, 93, 42–49. [Google Scholar] [CrossRef]
- Hylander, K.; Dynesius, M.; Jonsson, B.G.; Nilsson, C. Substrate form determines the fate of bryophytes in riparian buffer strips. Ecol. Appl. 2005, 15, 674–688. [Google Scholar] [CrossRef]
- Kumar, P.; Chen, H.Y.; Searle, E.B.; Shahi, C. Dynamics of understorey biomass, production and turnover associated with long-term overstorey succession in boreal forest of Canada. For. Ecol. Manag. 2018, 427, 152–161. [Google Scholar] [CrossRef]
- Hart, S.A.; Chen, H.Y. Fire, logging, and overstory affect understory abundance, diversity, and composition in boreal forest. Ecol. Monogr. 2008, 78, 123–140. [Google Scholar] [CrossRef]
- Reiners, W.A. Twenty years of ecosystem reorganization following experimental deforestation and regrowth suppression. Ecol. Monogr. 1992, 62, 503–523. [Google Scholar] [CrossRef]
- Gilliam, F.S.; Turrill, N.L. Herbaceous layer cover and biomass in a young. Bull. Torrey Bot. Club 1993, 120, 445–450. [Google Scholar] [CrossRef]
- Bartels, S.F.; Chen, H.Y.H. Is understory plant species diversity driven by resource quantity or resource heterogeneity? Ecology 2010, 91, 1931–1938. [Google Scholar] [CrossRef] [PubMed]
- Reich, P.B.; Frelich, L.E.; Voldseth, R.A.; Bakken, P.; Adair, E.C. Understorey diversity in southern boreal forests is regulated by productivity and its indirect impacts on resource availability and heterogeneity. J. Ecol. 2012, 100, 539–545. [Google Scholar] [CrossRef]
- Halpern, C.B.; Lutz, J.A. Canopy closure exerts weak controls on understory dynamics: A 30-year study of overstory–understory interactions. Ecol. Monogr. 2013, 83, 221–237. [Google Scholar] [CrossRef]
- Bartels, S.F.; Chen, H.Y.H. Dynamics of epiphytic macrolichen abundance, diversity and composition in boreal forest. J. Appl. Ecol. 2015, 52, 181–189. [Google Scholar] [CrossRef]
- Chen, H.Y.H.; Biswas, S.R.; Sobey, T.M.; Brassard, B.W.; Bartels, S.F. Reclamation strategies for mined forest soils and overstorey drive understorey vegetation. J. Appl. Ecol. 2018, 55, 926–936. [Google Scholar] [CrossRef]
- Brockerhoff, E.G.; Ecroyd, C.E.; Leckie, A.C.; Kimberley, M.O. Diversity and succession of adventive and indigenous vascular understorey plants in Pinus radiata plantation forests in New Zealand. For. Ecol. Manag. 2003, 185, 307–326. [Google Scholar] [CrossRef]
- Tabari, M.; Rostamabadi, A.; Salehi, A. Comparison of Plant Diversity and Stand Characteristics in Alnus subcordata CA Mey and Taxodium distichum (L.) LC Rich. Ecol. Balk. 2011, 3, 15–24. [Google Scholar]
- Kumar, P. Patterns and Mechanisms of Understorey Vegetation Associated with Stand Development in Boreal Forests. Ph.D. Thesis, Lakehead University, Thunder Bay, ON, Canada, 2018. [Google Scholar]
- Archaux, F.; Chevalier, R.; Berthelot, A. Towards practices favourable to plant diversity in hybrid poplar plantations. For. Ecol. Manag. 2010, 259, 2410–2417. [Google Scholar] [CrossRef]
- Franklin, J.; Steadman, D.W. Forest plant and bird communities in the Lau Group, Fiji. PLoS ONE 2010, 5, e15685. [Google Scholar] [CrossRef]
- Gazol, A.; Ibanez, R. Variation of plant diversity in a temperate unmanaged forest in northern Spain: Behind the environmental and spatial explanation. Plant Ecol. 2010, 207, 1–11. [Google Scholar] [CrossRef]
- Boothroyd-Roberts, K.; Gagnon, D.; Truax, B. Can hybrid poplar plantations accelerate the restoration of forest understory attributes on abandoned fields? For. Ecol. Manag. 2013, 287, 77–89. [Google Scholar] [CrossRef]
- Laughlin, D.C.; Abella, S.R.; Covington, W.W.; Grace, J.B. Species richness and soil properties in Pinus ponderosa forests: A structural equation modeling analysis. J. Veg. Sci. 2007, 18, 231–242. [Google Scholar] [CrossRef]
- Yorks, T.E.; Dabydeen, S.; Smallidge, P.J. Understory vegetation-environment relationships in clearcut and mature secondary forests of western Maryland. Northeast. Nat. 2000, 7, 205–221. [Google Scholar] [CrossRef]
- Ramovs, B.; Roberts, M. Understory vegetation and environment responses to tillage, forest harvesting, and conifer plantation development. Ecol. Appl. 2003, 13, 1682–1700. [Google Scholar] [CrossRef]
- Taverna, K.; Peet, R.K.; Phillips, L.C. Long-term change in ground-layer vegetation of deciduous forests of the North Carolina Piedmont, USA. J. Ecol. 2005, 93, 202–213. [Google Scholar] [CrossRef]
- Bartels, S.F.; Chen, H.Y.H. Interactions between overstorey and understorey vegetation along an overstorey compositional gradient. J. Veg. Sci. 2013, 24, 543–552. [Google Scholar] [CrossRef]
- Gilliam, F.S. The Herbaceous Layer in Forests of Eastern North America; Oxford University Press: New York, NY, USA, 2014. [Google Scholar]
- Vellend, M.; Verheyen, K.; Jacquemyn, H.; Kolb, A.; van Calster, H.; Peterken, G.; Hermy, M. Extinction debt of forest plants persists for more than a century following habitat fragmentation. Ecology 2006, 87, 542–548. [Google Scholar] [CrossRef] [PubMed]
- Jules, M.J.; Sawyer, J.O.; Jules, E.S. Assessing the relationships between stand development and understory vegetation using a 420-year chronosequence. For. Ecol. Manag. 2008, 255, 2384–2393. [Google Scholar] [CrossRef]
- Wang, S.; Chen, H.Y.; Tan, Y.; Fan, H.; Ruan, H. Fertilizer regime impacts on abundance and diversity of soil fauna across a poplar plantation chronosequence in coastal Eastern China. Sci. Rep. 2016, 6, 20816. [Google Scholar] [CrossRef]
- Xu, W.; Wang, G.; Deng, F.; Zou, X.; Ruan, H.; Chen, H.Y.H. Responses of soil microbial biomass, diversity and metabolic activity to biochar applications in managed poplar plantations on reclaimed coastal saline soil. Soil Use Manag. 2018, 34, 597–605. [Google Scholar] [CrossRef]
- Dobriyal, P.; Qureshi, A.; Badola, R.; Hussain, S.A. A review of the methods available for estimating soil moisture and its implications for water resource management. J. Hydrol. 2012, 458, 110–117. [Google Scholar] [CrossRef]
- Zhang, Z.H.; Hu, G.; Ni, J. Effects of topographical and edaphic factors on the distribution of plant communities in two subtropical karst forests, southwestern China. J. Mt. Sci. 2013, 10, 95–104. [Google Scholar] [CrossRef]
- Magurran, A.E. Ecological Diversity and Its Measurement; Princeton University Press: Princeton, NJ, USA, 1988. [Google Scholar]
- Anderson, M.J. Permutational Multivariate Analysis of Variance; Department of Statistics, University of Auckland: Auckland, New Zealand, 2005; Volume 26, pp. 32–46. [Google Scholar]
- Oksanen, J.; Blanchet, F.; Kindt, R.; Legendre, P.; Minchin, P.; Ó Hara, R.; Simpson, G.; Solymos, P.; Stevens, M.; Wagner, H. Vegan: Community Ecology Package. R package Version 2.0-10. 2019. Available online: http://cran.r-project.org/ (accessed on 20 May 2019).
- Kruskal, J.B. Multidimensional scaling by optimizing goodness of fit to a nonmetric hypothesis. Psychometrika 1964, 29, 1–27. [Google Scholar] [CrossRef]
- Kruskal, J.B. Nonmetric multidimensional scaling: A numerical method. Psychometrika 1964, 29, 115–129. [Google Scholar] [CrossRef]
- Minchin, P.R. An evaluation of the relative robustness of techniques for ecological ordination. In Theory and Models in Vegetation Science; Springer: Berlin, Germany, 1987; pp. 89–107. [Google Scholar]
- Kenkel, N.C.; Orlóci, L. Applying metric and nonmetric multidimensional scaling to ecological studies: Some new results. Ecology 1986, 67, 919–928. [Google Scholar] [CrossRef]
- R Development Core Team. R: A Language and Environment for Statistical Computing; R Foundation for Statistical Computing: Vienna, Austria, 2018.
- Bollen, K.A. Structural Equations with Latent Variables; John Wiley & Sons: Hoboken, NJ, USA, 2014. [Google Scholar]
- Grace, J.B.; Anderson, T.M.; Olff, H.; Scheiner, S.M. On the specification of structural equation models for ecological systems. Ecol. Monogr. 2010, 80, 67–87. [Google Scholar] [CrossRef]
- Kaplan, D. Evaluating and modifying covariance structure models: A review and recommendation. Multivar. Behav. Res. 1990, 25, 137–155. [Google Scholar] [CrossRef]
- Rosseel, Y. Lavaan: An R package for structural equation modeling. J. Stat. Softw. 2012, 48, 1–36. [Google Scholar] [CrossRef]
- Li, Y.; Qin, H.; Xie, Y.; Wang, W.; Chen, X.; Zhang, C. Physiological mechanism for the reduction in soil water in poplar (Populusdeltoides) plantations in Dongting Lake wetlands. Wetl. Ecol. Manag. 2014, 22, 25–33. [Google Scholar] [CrossRef]
- Rowland, S.; Prescott, C.; Grayston, S.; Quideau, S.; Bradfield, G. Recreating a functioning forest soil in reclaimed oil sands in northern Alberta: An approach for measuring success in ecological restoration. J. Environ. Qual. 2009, 38, 1580–1590. [Google Scholar] [CrossRef]
- Pinno, B.; Hawkes, V. Temporal trends of ecosystem development on different site types in reclaimed boreal forests. Forests 2015, 6, 2109. [Google Scholar] [CrossRef]
- Parrotta, J.A. Influence of overstory composition on understory colonization by native species in plantations on a degraded tropical site. J. Veg. Sci. 1995, 6, 627–636. [Google Scholar] [CrossRef]
- Kuksina, N.; Ulanova, G. Plant species diversity in spruce forest after clear cutting disturbance: 16 year monitoring in Russian Tajo, proceeding of reforestation and management of biodiversity. Finl. August 2000, 18, 21–24. [Google Scholar]
- Yirdaw, E.; Luukkanen, O. Photosynthetically active radiation transmittance of forest plantation canopies in the Ethiopian highlands. For. Ecol. Manag. 2004, 188, 17–24. [Google Scholar] [CrossRef]
- Duan, W.J.; Ren, H.; Fu, S.L.; Wang, J.; Zhang, J.P.; Yang, L.; Huang, C. Community Comparison and Determinant Analysis of Understory Vegetation in Six Plantations in South China. Restor. Ecol. 2010, 18, 206–214. [Google Scholar] [CrossRef]
- Son, Y.; Lee, Y.Y.; Jun, Y.C.; Kim, Z.S. Light availability and understory vegetation four years after thinning in a Larixleptolepis plantation of central Korea. J. For. Res. 2004, 9, 133–139. [Google Scholar] [CrossRef]
- Chen, S.; Wang, W.; Xu, W.; Wang, Y.; Wan, H.; Chen, D.; Tang, Z.; Tang, X.; Zhou, G.; Xie, Z.; et al. Plant diversity enhances productivity and soil carbon storage. Proc. Natl. Acad. Sci. USA 2018, 115, 4027–4032. [Google Scholar] [CrossRef]
- Christian, D.P.; Niemi, G.J.; Hanowski, J.M.; Collins, P. Perspectives on biomass energy tree plantations and changes in habitat for biological organisms. Biomass Bioenergy 1994, 6, 31–39. [Google Scholar] [CrossRef]
- Diaz, M.; Carbonell, R.; Santos, T.; Telleria, J. Breeding bird communities in pine plantations of the Spanish plateaux: Biogeography, landscape and vegetation effects. J. Appl. Ecol. 1998, 35, 562–574. [Google Scholar] [CrossRef]
- Taki, H.; Yamaura, Y.; Okabe, K.; Maeto, K. Plantation vs. natural forest: Matrix quality determines pollinator abundance in crop fields. Sci. Rep. 2011, 1, 132. [Google Scholar] [CrossRef]
- Barbier, S.; Gosselin, F.; Balandier, P. Influence of tree species on understory vegetation diversity and mechanisms involved—A critical review for temperate and boreal forests. For. Ecol. Manag. 2008, 254, 1–15. [Google Scholar] [CrossRef]
- Vockenhuber, E.A.; Scherber, C.; Langenbruch, C.; Meißner, M.; Seidel, D.; Tscharntke, T. Tree diversity and environmental context predict herb species richness and cover in Germany’s largest connected deciduous forest. Perspect. Plant Ecol. Evol. Syst. 2011, 13, 111–119. [Google Scholar] [CrossRef]
- Černý, T.; Doležal, J.; Janeček, Š.; Šrůtek, M.; Valachovič, M.; Petřík, P.; Altman, J.; Bartoš, M.; Song, J.S. Environmental correlates of plant diversity in Korean temperate forests. Acta Oecol. 2013, 47, 37–45. [Google Scholar] [CrossRef]
- Deckers, B.; Hermy, M.; Muys, B. Factors affecting plant species composition of hedgerows: Relative importance and hierarchy. Acta Oecol. Int. J. Ecol. 2004, 26, 23–37. [Google Scholar] [CrossRef]
- Jiang, Y.; Kang, M.; Zhu, Y.; Xu, G. Plant biodiversity patterns on Helan Mountain, China. Acta Oecol. 2007, 32, 125–133. [Google Scholar] [CrossRef]
- Zhang, J.T.; Dong, Y. Factors affecting species diversity of plant communities and the restoration process in the loess area of China. Ecol. Eng. 2010, 36, 345–350. [Google Scholar] [CrossRef]
- Hokkanen, P.J. Environmental patterns and gradients in the vascular plants and bryophytes of eastern Fennoscandian herb-rich forests. For. Ecol. Manag. 2006, 229, 73–87. [Google Scholar] [CrossRef]
- Chipman, S.J.; Johnson, E.A. Understory vascular plant species diversity in the mixedwood boreal forest of western Canada. Ecol. Appl. 2002, 12, 588–601. [Google Scholar] [CrossRef]
- Chen, H.Y.H.; Legare, S.; Bergeron, Y. Variation of the understory composition and diversity along a gradient of productivity in Populustremuloides stands of northern British Columbia, Canada. Can. J. Bot. Rev. Can. Bot. 2004, 82, 1314–1323. [Google Scholar] [CrossRef]
- Hume, A.; Chen, H.Y.H.; Taylor, A.R.; Kayahara, G.J.; Man, R. Soil C: N: P dynamics during secondary succession following fire in the boreal forest of central Canada. For. Ecol. Manag. 2016, 369, 1–9. [Google Scholar] [CrossRef]
- Mills, S.E.; Macdonald, S.E. Predictors of moss and liverwort species diversity of microsites in conifer-dominated boreal forest. J. Veg. Sci. 2004, 15, 189–198. [Google Scholar] [CrossRef]
© 2019 by the authors. Licensee MDPI, Basel, Switzerland. This article is an open access article distributed under the terms and conditions of the Creative Commons Attribution (CC BY) license (http://creativecommons.org/licenses/by/4.0/).