Abstract
Because of its high phosphorus (P) demands, it is likely that the abundance, distribution, and N-fixing capacity of Alnus in boreal forests are tightly coupled with P availability and the mobilization and uptake of soil P via ectomycorrhizal fungi (EMF). We examined whether Alnus shifts EMF communities in coordination with increasingly more complex organic P forms across a 200-year-old successional sequence along the Tanana River in interior Alaska. Root-tip activities of acid phosphatase, phosphodiesterase, and phytase of A. tenuifolia-associated EMF were positively intercorrelated but did not change in a predictable manner across the shrub, to hardwood to coniferous forest successional sequence. Approximately half of all Alnus roots were colonized by Alnicola and Tomentella taxa, and ordination analysis indicated that the EMF community on Alnus is a relatively distinct, host-specific group. Despite differences in the activities of the two Alnus dominants to mobilize acid phosphatase and phosphodiesterase, the root-tip activities of P-mobilizing enzymes of the Alnus-EMF community were not dramatically different from other co-occurring boreal plant hosts. This suggests that if Alnus has a greater influence on P cycling than other plant functional types, additional factors influencing P mobilization and uptake at the root and/or whole-plant level must be involved.
Keywords:
Alnus; phosphorus; ectomycorrhizae; acid phosphatase; phosphodiesterase; phytase; boreal forest; Alaska 1. Introduction
Relative to nitrogen (N), comparatively little is known about terrestrial phosphorus (P) cycling in boreal forests [1,2] despite the tight stoichiometric coupling between N and P in both terrestrial and aquatic ecosystems [3]. During early phases of soil development, P is primarily found in highly reduced inorganic forms of insoluble calcium minerals, such as apatite, which are of limited availability to plants [1]. As soil development progresses, labile inorganic P increases and, for a time, is more available to plants and microbes than in the earliest stages of succession. However, mineral forms become progressively more occluded as Fe and Al oxides [4], and biological activity transforms mineral P into organic forms [5]. Organic P content increases with successional time [6], comprising between 30%–90% of total P in developed soils [7]. Dominant soil organic P compounds include phosphate monoesters (such as phosphorylated sugars and mononucleotides), complex phosphate diesters (predominantly DNA and phospholipids), and more recalcitrant inositol phosphates such as phytic acid [8]. In mid to late soil development, phytates and other large, positively-charged P molecules are tightly bound to soil particles and only available to plants through the release of specialized hydrolyzing enzymes, often with the aid of organic acids.
N-fixing plants play a unique role in P biogeochemical cycling because of the high P demand associated with nitrogenase activity and production of root nodules, which explains the high rates of both N and P cycling in litter of N-fixing plants [9]. How these plants acquire sufficient P to maintain N fixation is somewhat of a puzzle, particularly early in primary succession when N-fixation rates are stimulated by low N and high light availabilities. In old, highly-weathered tropical forests where P availability is often chronically low, it has been suggested that N-fixing plants persist because of their ability to access low-solubility inorganic or recalcitrant organic P forms using extracellular enzymes [10]. In general, extracellular hydrolytic enzymes produced by mycorrhizal associations are a primary mechanism by which plants acquire organic P in soils [11].
Throughout interior Alaska, thin-leaf alder (Alnus incana spp tenuifolia (Nutt.) Breitung, hereafter, A. tenuifolia) forms dense riparian stands where it can contribute >100 kg N ha−1 year−1 to early successional floodplain soils through N fixation [9,12,13]. As stands develop, A. tenuifolia remains an important understory species in both mid-successional hardwood forests dominated by balsam poplar (Populus balsamifera L.), and in late-successional stands dominated by white spruce (Picea glauca (Moench) Voss). Field experiments have shown that ecosystem N inputs by A. tenuifolia are dramatically increased by P fertilization via increases in both nodule biomass and nitrogenase activity [9,13], suggesting that N fixation rates are strongly P-limited in these ecosystems. The fact that A. tenuifolia persists and continues to maintain high nodule biomass and N fixation rates even into late succession [14] suggests this species might change strategies to optimize P access across this successional sequence.
Red alder (Alnus rubra Bong.) has been shown to increase inorganic soil P availability via phosphatase production [15]. Furthermore, enzyme activities measured on individual ectomycorrhizal root tips have shown that many species of ectomycorrhizal fungi (EMF) produce phosphohydrolase enzymes when associated with both Alnus [16] and other plant hosts [17,18]. In general, EMF community composition is affected by a number of factors, including soil chemistry [19], seasonality [20], and successional stage [21]. Alnus associates with a limited number of EMF partners and is often reciprocally selective [22,23,24,25], suggesting that the composition of Alnus-EMF communities may be tied to the ability of individual fungal species to mobilize various forms of inorganic and organic soil P.
Whereas phosphatase activity is frequently measured on EMF root tips [19,26,27], there is little information as to whether these associations can mobilize P from the more complex forms of organic P in the field, or how this capacity varies among EMF species. Because different enzymes are required for the breakdown of various P forms, hydrolyzing phosphate from compounds such as orthophosphate monoesters, phosphodiesters, and phytate may represent different levels of investment. Just as certain non-mycorrhizal plant species may specialize in accessing P from one or more of these forms [28], it is likely that EMF partners have different strategies for acquiring P and may target one source over another. For example, EMF species vary in their capacity to produce phytase [27]; however, compared with the rate of P release from para-nitrophenylphosphate, the rate of Pi release from phytate has been shown to be notably less [29].
The objective of this study was to understand the potential for A. tenuifolia and its associated EMF partners to mobilize P across spatial (mineral and organic soil horizons) and temporal (chronosequence of successional stages) scales. We hypothesized that: (1) Alnus-associated EMF differ in their capacities to mobilize various sources of P, and (2) the variability in EMF enzymatic potential, the community composition of EMF associated with Alnus, and the total P-mobilizing potential of the Alnus-EMF community are coordinated with spatial and temporal variation in soil resources associated with different stages of boreal forest stand development.
2. Materials and Methods
2.1. Site Description
The Bonanza Creek Long-Term Ecological Research (BNZ LTER) program maintains replicate forest stands representing five stages (n = 3 stands/stage) of a 200-year old forest successional sequence along the Tanana River floodplain 40 km SW of Fairbanks, Alaska, that have been studied intensively for the past 30 years (http://www.lter.uaf.edu/). A. tenuifolia is the dominant woody species early in succession and persists in the understory in older stands dominated by balsam poplar and, subsequently, white spruce [30]. Mean annual air temperature is −3.3 °C, with average highs of 16.3 °C in July and lows of −45 °C during winter [31]. Soils are cryofluvents and frequently contain buried organic layers resulting from silt deposits during flooding. Across the three sites, soil pH averaged 6.3 and 7.3 in the organic and mineral horizons, respectively. Annual precipitation averages 287 mm, 35% of which falls as snow between October and April. We randomly selected one of the three replicate BNZ LTER stands from the alder (early; 35 years), balsam poplar (mid; 75 years), and white spruce (late; 150 years) stages for sampling. The location of these study sites, referred to with BNZ LTER designators FP1C, BP1 and FP4C, can be viewed at the online BNZ LTER Study Site Catalog (http://www.lter.uaf.edu/data/sites-catalog). Our previous studies have demonstrated that variation in alder growth, N fixation, and the identity of Frankia partners vary more among individual plants at the 0.1 ha scale within a stand, than they do among replicate stands within a successional stage [9,32,33]. Our sampling design therefore focused on concentrating sampling effort to capture this 0.1 ha-scale variation across the successional gradient, rather than sampling across a larger spatial scale within successional stages.
2.2. Root Tip Selection and Sampling
Plots (30 × 30 m) were established in stands across a chronosequence including early successional thin-leaf alder, mid-successional balsam poplar, and late successional white spruce stands (hereafter referred to as stages). During August of 2009, one soil core (15 × 20 cm) was collected approximately 20 cm from the base of 10 randomly chosen alders at each of the four sites. Cores were stored on ice and transported to the lab, where each core was split into mineral and organic horizons. Root systems were washed in cool water and further cleaned of debris under 10–40× magnification. Alnus fine roots were identified by their reddish coloring and the presence of nodules. EMF root tips, between 2–4 mm in length were excised from Alnus roots under magnification and stored in 0.5 M CaCl2. We collected 50 healthy tips per horizon, and from these, a subsample of seven tips was randomly selected to be assayed for enzymatic activity. Digital pictures of individual root tips were taken through the microscope, and root tip surface areas were determined using root image analysis software Rootfly (Version 1.8.31, 2005–2009, Clemson University). All measurements of enzyme activity are reported per square mm root surface area.
2.3. Enzyme Assays
Within one hour of root tip selection, tips were rinsed of CaCl2 using 50 mM sodium acetate buffer (pH = 5.5) and run sequentially through a series of assays to assess potential activity of acid phosphatase, phosphodiesterase, and phytase (Appendix A). Individual root tips were placed in sieve strips fabricated from 200 µL tubes which fit snugly into 96-well black-bottomed microplates, and were moved among different microplates for multiple enzyme assays without damage to the root tip [34] (Appendix A). The potential activities of acid phosphatase (AP) and phosphodiesterase (PD) were measured with MU-linked substrates: 6,8-difluoro-4-methylumbelliferyl phosphate (diFMUP, Invitrogen D6567) and Bis (4-methylumbelliferyl) phosphate (bisMUP, BioSynth B-3500), respectively, dissolved in dimethylformamide. Root tips were assayed with two concentrations of each enzyme, diFMUP at 100 μM and 250 μM, and bisMUP at 100 μM and 500 μM. Phytase activity was assayed using the EnzCheck Ultra Phytase Assay Kit (Molecular Probes Inc., Eugene, OR, USA). We used a higher substrate concentration in our phytase assays (2 mM), reflecting the predominance of organic P in many soils which may exceed 200 mg kg−1 [35] Fluorescence was read at a wavelength of 360 nm Ex/460 nm Em for both diFMUP and bisMUP and at 540 nm Ex/590 nm Em for phytase on a plate reader (BioTek, Winooski, VT, USA). Incubations were conducted at 20 °C in an environmental chamber and completed within 14 h of soil collection. After incubations, root tips were freeze-dried and stored frozen for molecular analysis.
2.4. Molecular Analyses
To match the enzyme activity with a specific fungal taxon, DNA was extracted from individual root tips using the DNeasy Plant Mini Kit (QIAGEN Inc., Valencia, CA, USA). Prior to extraction, root tips were hydrated in lysis buffer and disrupted using a Kontes pellet pestle attached to a drill. Samples were incubated at 65 °C for 10 min and then for 16 h at 20 °C to improve extraction success. The remainder of the extraction followed the standard protocol for the DNeasy Kit. The EMF species on individual roots tips were identified using Sanger sequencing of the fungal nuclear ribosomal internal transcribed spacer (ITS). This region was amplified using the fungal specific primers ITS1-F and ITS4 [36]. After amplification, PCR products were sent to Functional Biosciences (Madison, WI) for sequencing in both directions (5′ and 3′) with the same primers. We then assembled sequences, removed ambiguous and poor-quality sequences, and grouped sequences into phylobins that were then assigned a fungal identity [37] (Appendix B). Representative sequences from each phylobin and singletons were used to search the GenBank and UNITE databases. Phylobins were identified to species level at higher than 97% similarity; to the genus level at between 93% and 97%, and to the family level at between 83% and 93% [38]. After initial analysis of the fungal community revealed a wide array of fungi not characteristically detected on Alnus, we used restriction length fragment polymorphism (RFLP) to identify the plant host of all samples. This analysis revealed that across all stands, root tips belonged to four plant species: Alnus tenuifolia (n = 151), Populus balsamifera (n = 30), Picea glauca (n = 70), and Salix spp. (n = 19), and a pool of tips for which host was equivocal (n = 138). The latter pool of unidentified host tips is not included in the analyses here.
2.5. Statistical Analyses
All statistical analyses were completed using R statistical software version 3.4.2 [39]. Alpha was set at 0.05, but 0.10 was considered as marginally significant due to low sample size. Outliers were identified as data points above the upper quartile plus three times the inner quartile range, and removed from the final data set prior to analyses. We used mixed-effects models (function lmer in the lmer4 package) to examine the effects of successional stage, soil horizon and their interaction (fixed effects), and plant (random effect) on enzyme activities of alder root tips. Comparisons of models with different fixed effects were made using maximum likelihood, with AIC values compared using anova (lmerTest package) before refitting models using restricted maximum likelihood. Pairwise comparisons between group members were made using the lsmeans function (lsmeans package). Assumptions of normality for model residuals were checked using the Shapiro-Wilks normality test (function shapiro.test). Acid phosphatase and phosphodiesterase values were square-root transformed, and phytase values were natural log transformed for all models; however, in cases where assumptions of homogeneity were not met, we formulated a variance structure among groups using the varIdent function (nlme package), and then refit models using lme [40]. For model runs that produced a singularity warning, we optimized model performance using the optimx function (optimx package) and ran models using lmer. We report marginal (R2m) and conditional (R2c) values for models to evaluate variance explained by fixed and fixed+random effects, respectively (r.squaredGLMM function). Raw phytase data were strongly bimodal, with a large number of 0 values, and fewer numbers of very high values, which made model interpretations difficult even for those that met assumptions and reached a solution. In this case, we compared groups using the non-parametric Mann-Whitney U Test (function wilcox.test in the coin package). Differences in enzyme activities among dominant alder EMF species, and between ascomycetes versus basidiomycetes across all root tips were assessed using mixed-effects models as described above. Although we unexpectedly ended up with other plant hosts in our final data set, due to unequal sample sizes of those hosts across stages, we could only compare enzyme activities of alder with Salicaceae root tips (Salix and balsam poplar root tips pooled) in early succession, and with white spruce in late succession. Non-metric dimensional scaling ordinations of root-tip EMF communities were produced using the metaNMDS function in the vegan package, using Bray Curtis dissimilarities based on species abundance data grouped by host, successional stage, and horizon. We then used permutational multivariate analysis of variance to test for differences in root-tip EMF communities among hosts using the adonis function (pairwiseAdonis package) based on a dissimilarity matrix of species abundance data derived using the function vegdist. Throughout the text and Figures, data are presented as means ± 1 SE.
3. Results
3.1. Alder Root Tip Enzyme Activities
Alder root tip acid phosphatase activity and phosphodiesterase activity showed strong responses to substrate concentration, with rates being approximately double at the higher substrate concentration for both acid phosphatase (6.06 ± 0.35 versus 2.59 ± 0.18 pmoles min−1 mm−2, respectively, p < 0.01) and phosphodiesterase (0.75 ± 0.04 versus 0.44 ± 0.02 pmoles min−1 mm−2, respectively, p < 0.01) when averaged across all stages. Activities of acid phosphatase (100 and 250 µM) and phosphodiesterase (100 and 500 µM) were positively intercorrelated (all four comparisons, p < 0.0001), while phytase activity was positively correlated only with acid phosphatase measured at 250 µM (p < 0.05) and phosphodiesterase measured at 100 µM (p < 0.01).
Mixed effects model comparisons indicated that modeling enzyme activities as a function of fixed effects (STAGE, HORIZON) and a random intercept effect of PLANT provided the lowest AIC score for all enzymes except for phytase, where the full model (also including the STAGE*HORIZON interaction) was the best fit. Although both STAGE and HORIZON appeared in the best model for all enzymes, most of the explained variance was contributed by the random intercept effect of PLANT in all cases, indicating that variability among plants within stages was more important than either successional stage or horizon in predicting enzyme activities (Figure 1). Acid phosphatase activities of alder root tips measured at both 100 and 250 µM tended to be highest in late successional stages and in organic horizons, but the only statistical differences among stages were found at 250 µM, where mid-successional balsam poplar stands had lower rates than either early or late successional stands (both where the full model (also including the STAGE*HORIZON interaction) was the best fit. p < 0.05), which did not differ (Figure 1). In contrast, phosphodiesterase activities were highest in early successional stands when measured at both concentrations. Phytase activity tended to increase across the successional gradient, but differences were not significant. No significant differences were detected for any alder root-tip enzymes harvested from organic versus mineral horizons.
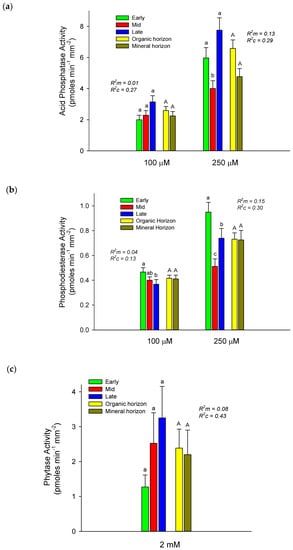
Figure 1.
Mean ± S.E. activities of acid phosphatase (a), phosphodiesterase (b), and phytase (c) for thin-leaf alder root tips harvested from organic and mineral horizons from early, mid, and late successional stages. Different lower- and upper-case letters above bars indicate significant differences (p < 0.05) between stages and horizons, respectively. Marginal (R2m) and conditional (R2c) values generated for linear mixed effects models evaluate variance explained by fixed and fixed + random effects, respectively (see Statistics section above).
3.2. Comparing Alder Enzyme Activities with Other Host Species
Unequal distribution of root tips from other host species among successional stages restricted comparisons of alder enzyme activities with other hosts to specific sites. In early succession, we compared alder (n = 52) and Salicaceae root tips, the latter including both balsam poplar (n = 15) and Salix sp. (n = 17). Alder tended to have lower activities than Salicaceae root tips for all enzymes, although mixed-effects models indicated that differences were only significant for acid phosphatase and phosphodiesterase when measured at high concentrations (Figure 2a). Alder root tips from late successional stands (n = 44) had significantly higher activities of acid phosphatase (p < 0.05) and tended to have higher phosphodiesterase when measured at low concentrations than did white spruce (n = 51), while white spruce tended to have higher activities of phytase (Figure 2b). Mixed effects models failed to resolve differences in phytase activity between alder and Salicaceae, or alder and white spruce. However, Wilcoxon rank sum tests (Mann-Whitney U) indicated that alder had significantly lower phytase activity than Salicaceae (W = 532.5, p < 0.01) in early succession, and tended to have lower phytase activities than white spruce in late succession (W = 1350.5, p = 0.08).
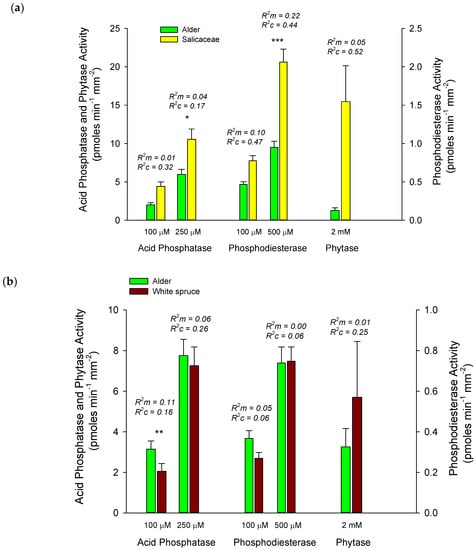
Figure 2.
Comparison of mean ± S.E. activities of acid phosphatase, phosphodiesterase and phytase of alder root tips with Salicaceae root tips in early succession (a), and with white spruce root tips in late succession (b). Significant differences between hosts are indicated above bars at p < 0.10 (*), 0.05 (**), and 0.01 (***). Marginal (R2m) and conditional (R2c) values generated for linear mixed effects models evaluate variance explained by fixed and fixed + random effects, respectively (see Statistics section above).
3.3. Fungal Community Identification
After removal of potential fungal pathogens and non-EMF taxa, we identified 86 unique fungal phylotypes, comprised of 45 basidiomycetes and 41 ascomycetes on 181 roots tips across all plant hosts (Appendix C). The overall fungal community was dominated by basidiomycetes (65%) over ascomycetes (35%). This trend was similar on the 102 Alnus roots tips (69% basidiomycetes versus 31% ascomycetes) as well as for Salix sp. tips (73% basidiomycetes versus 27% ascomycetes). However, on Picea root tips, there tended to be more ascomycetes (61%) than basidiomycetes (39%). No ascomycetes were identified on Populus root tips.
Across all hosts, root tips with basidiomycete fungi had significantly higher activities of all enzymes compared with root tips with ascomycete fungi (Figure 3). In general, there was little overlap of dominant fungal species among the EMF communities on different plant hosts (Figure 4). Analyses of fungal communities indicated that EMF fungal community composition varied significantly among hosts (p < 0.05), with significant differences between alder and Salicaceae root tips (p < 0.01), and between alder and white spruce (p < 0.10), but not between Salicaceae and white spruce (p = 0.45) (Figure 4). Horizon did not explain any of the variation in fungal community structure, and comparisons among stages, while significant (p < 0.05), are difficult to interpret due to unequal representation of host species across stages.
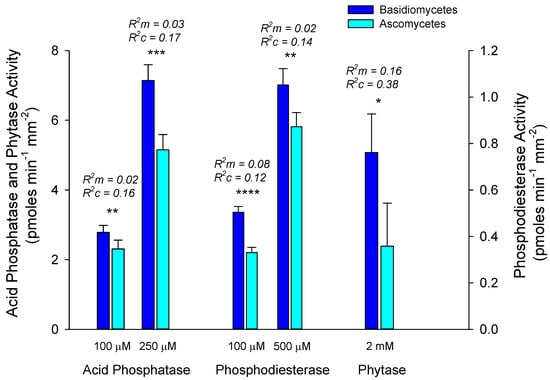
Figure 3.
Comparison of mean ± S.E. activities of acid phosphatase, phosphodiesterase and phytase of alder root tips dominated by Ascomycete versus Basidiomycete ectomycorrhizal fungi (EMF) averaged across all horizons and stages. Significant differences between phylum are indicated above bars at p < 0.10 (*), 0.05 (**), 0.01 (***), and 0.001 (****). Marginal (R2m) and conditional (R2c) values generated for linear mixed effects models evaluate variance explained by fixed and fixed + random effects, respectively (see Statistics section above).
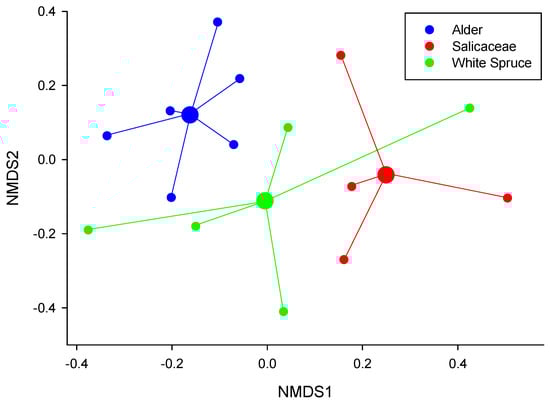
Figure 4.
Spider plot of ectomycorrhizal fungi (EMF) community composition derived from non-metric dimensional scaling ordination and PERMANOVA comparisons (pairwiseAdonis package) based on a dissimilarity matrix of species abundance data which showed that alder root-tip communities were significantly different from both white spruce (p < 0.05) and Salicaceae (p < 0.10). Species clusters identify the centroid (spatial mean) of data points representing combinations of successional stage and horizon for each host.
3.4. EMF Specific Activities within and Among Hosts
Low sample sizes and minimal overlap of EMF species among hosts limited our ability to compare enzyme activities of specific EMF species among hosts or among successional stages on a particular host. However, the two dominant alder-associated EMF taxa, Alnicola luteolofibrillosa 2 and Tomentella sp. 6, which constituted 43% of all alder root tips, showed significant differences in their enzymatic capacity to break down different sources of organic P. Compared to Alnicola luteolofibrillosa 2, Tomentella sp. 6 showed a greater potential acid phosphatase activity at both the low and high substrate concentrations, whereas Alnicola luteolofibrillosa 2 had higher potential phosphodiesterase activity at the higher substrate concentration (Figure 5). Nearly all (96%) of Alnicola luteolofibrillosa 2 found on alder root tips occurred in early succession, while Tomentella sp. 6, also an alder specialist, was more evenly distributed on alder tips between early (44%) and mid (50%) succession.
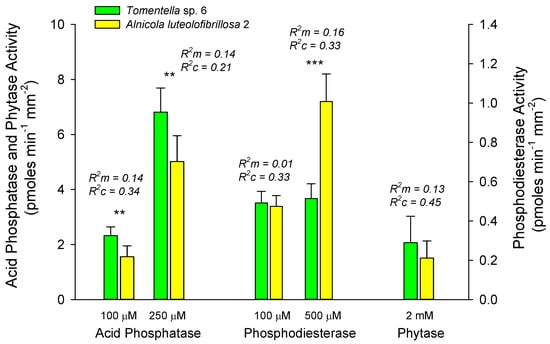
Figure 5.
Comparison of mean ± S.E. activities of acid phosphatase, phosphodiesterase, and phytase of alder root tips dominated by Tomentella sp. 6 versus Alnicola luteolofibrillosa 2 averaged across horizons and stages. Significant differences between species are indicated above bars at p < 0.05 (**), and 0.01 (***). Marginal (R2m) and conditional (R2c) values generated for linear mixed effects models evaluate variance explained by fixed and fixed + random effects, respectively (see Statistics section above).
4. Discussion
4.1. Successional Patterns of Root-Tip P Mobilizing Enzymes
We predicted that as soil P is transformed by the biota during primary succession to progressively more recalcitrant organic forms, activities of P-mobilizing enzymes on Alnus root tips would shift towards increases in phosphodiesterase and phytase [41]. We only found partial support for this prediction in that Alnus root tips showed a progressive increase in acid phosphatase (100 µM) and phytase activity across stands. However, phosphodiesterase when measured at low and high substrate concentrations was highest in the early-successional stand, in contrast to the predicted pattern (Figure 1). Recent 31P-NMR data (K.D. Olson) indicate that while the amount of soil organic P increases during succession on an area basis as soil organic C accumulates, concentrations of organic P, and proportions of the dominant forms of inorganic and organic P within organic horizons are actually quite similar across these floodplain successional stages. Thus, the lack of a significant increase in enzymes specifically targeting organic forms of P may not necessarily be unexpected. The fact that rates of P-mobilizing enzymes were positively intercorrelated across all root tips sampled suggests that ectomycorrhizae are using a coordinated suite of enzymes to meet P demands, or perhaps simply that healthier root tips/mycorrhizae have more intact enzymes. Within our early successional stands, organic horizons are poorly developed, with an approximate thickness of 1 cm. Nevertheless, there is a high root density of early successional woody species in surface soils [42], and likely a rapid turnover of organic P from decaying microbes and plant tissues, which may explain why all three enzymes appear to be up-regulated in a coordinated manner to meet plant P demands.
4.2. Differences in Enzyme Activities among Host Species
Motivations behind this study were the strong growth and physiological responses of A. tenuifolia to field P-fertilization [9,13], and the suggestion that dominance of N-fixing plants in early successional environments is due in part to their unique capacity to access low-solubility inorganic or recalcitrant organic P forms using extracellular enzymes [10]. Although our original intent was to focus on successional patterns of ectomycorrhizal community composition and P-mobilizing enzyme activities in Alnus, root tips of other host species among our samples offer additional insight into whether and how Alnus contributes uniquely to P cycling in these ecosystems. In this regard, it is notable that activities of P-mobilizing enzymes were rarely greater and, at times, lower on Alnus root tips relative to other hosts (Figure 2), contrary to what would be predicted by the high P demands of Alnus [9,43,44], and known capacity of Alnus to increase soil P availability [15,45]. Clearly, a more intensive sampling effort targeting other dominant hosts is required to resolve host differences in enzyme activity at the root-tip scale. However, as we point out below, many other factors will influence the stand-level impacts of alder on mobilization and acquisition both inorganic and organic P forms.
4.3. Structure of Alnus Ectomycorrhizal Communities
Our results support a growing literature indicating that Alnus associates with a relatively low diversity of host-specific ectomycorrhizal fungi of approximately 50–60 species [24]. Moreover, our NMDS/PerMANOVA analyses support the notion that Alnus EMF communities are highly distinct relative to other host species [22,46,47]. We identified 38 fungal phylobins on Alnus, the majority (55%) in the Phylum Basidiomycota. Of these Alnus phylobins, four were found more than four times: Alnicola luteolofibrillosa 2 (26 times), Tomentella sp. 6 (18 times), Ascomycete sp. 3 (six times), and Phialocephala fortinii 4 (five times) (Appendix C). Ten rarer types were found between two and three times; three of these 10 were found in more than one stage. The remaining 23 phylobins were detected only once across all sites combined. Alnicola and Tomentella, the two dominant genera on alder, have been recognized as some of the most common Alnus-specific EMF taxa globally [17,22,48]. Individuals from these two genera made up 43% of the total community on Alnus across our sites. We also detected species from other EMF genera known to be selective towards Alnus, including Alpova [22,49,50], Inocybe [23], Tuber [22], Lactarius [49], and Cortinarius [16], but did not find other common Alnus-specific EMF lineages including/peziza michelii-peziza succosa,/genea–humaria,/pachyphloeus–amylascus, and/tarzetta–geopyxis [22,49].
Although the strong host specificity of EMF on Alnus has been repeatedly confirmed, the reasons behind this are less clear. The specificity of host-EMF relationships may result from geographic isolation; however, some argue that such specialization derives from spatial heterogeneity in soil physical/chemical parameters, and specialization to those conditions [25]. It may be that the unique physiology of N-fixing host species requires EMF partners well suited to facilitating their growth. This could include specialization for P mobilization and uptake, as mentioned above, given the capacity of EMF to aid in P acquisition [51,52,53]. However, specialization could also be tied to micronutrient acquisition; for instance, Mo, which is required by Alnus as a co-factor in the protein complex that reduces atmospheric N2 [54]. Finally, given that Alnus appears to shift Frankia partners across successional stages based on their carbon cost relative to N-fixing capacity [9,33], similar market economies may be at play in Alnus-EMF communities. Ruess et al. suggested that the up-regulation of nodulation and N-fixation by Alnus in P-fertilized plots was enabled by lower carbon partitioning to EMF [9]. The combined costs of having to support both N-fixing bacterial partners and mycorrhizal partners place unique carbon demands on N-fixing plants and suggest that hosts may closely regulate carbon partitioning to EMF mutualists relative to the benefits they afford.
4.4. Patterns of EMF Enzyme Activities
Our analysis of enzyme activities on Alnus root tips suggests pronounced physiological differences in the capacity of the two EMF dominants, A. luteolofibrillosa 2 and Tomentella sp. 6, to mobilize P from compounds across the successional gradient. A. luteolofibrillosa 2 had significantly higher phosphodiesterase activities (500 µM) than Tomentella sp. 6, while Tomentella sp. 6 had significantly higher acid phosphatase activity than A. luteolofibrillosa 2 when measured at both high and low substrate concentrations (Figure 5). Differences in the enzyme activities between EMF dominants suggest that these mycorrhizal species differ in their capacity to access P from different substrates and will thus have differing benefits to Alnus. There have been few other studies that have tested the functionality of Alnus-EMF communities as they relate to P mobilization. However, Walker et al. (2014) [16] found that the potential acid phosphatase activity of the EMF community on Alnus rubra was significantly higher than that of Douglas fir (Pseudotsuga menziesii (Mirb.) Franco) at two sites in central Oregon. We found a similar tendency for higher acid phosphatase in alder relative to white spruce (Figure 2b). Interestingly, they also found that some of the most dominant fungi in the Alnus-EMF community did not demonstrate superior enzymatic activity relative to the community average. Similarly, we found that the higher activities of A. luteolofibrillosa 2 versus Tomentella sp. 6 for phosphodiesterase and acid phosphatase, respectively, were not significantly greater than the rest of the other EMF species when pooled (data not shown).
Given mixed results across the few studies that have investigated the functionality of Alnus-EMF communities, it remains unresolved how Alnus meets its P demands and achieves high foliar P concentrations. Our finding that the enzyme activities of Alnus-EMF dominants and the Alnus-EMF community as a whole are not substantially greater than those found on other plant hosts suggests that if the community of host specific EMF on Alnus are related to P mobilization other factors are involved. These could include differences in EMF foraging strategy, extent of hyphal proliferation in the soil, GPP partitioning to first-order root tips and EMF along a branch, EMF growth rate, or P uptake and transport [51], all of which would influence whole-plant P assimilation. Exploration type of the EMF assemblage is likely an important factor influencing P acquisition. There are significant differences in the mantles and exploration types of EMF fungi [55], and EMF taxa vary in the amount of mantle as a proportion of total structure [56]. A given EMF species may have lower enzyme efficiency or infection frequency across root tips, but a more extensive hyphal system that would facilitate access to P from greater distances could result in greater overall P uptake. Additionally, much of the P assimilated by the EMF is retained by the fungus [53,57], despite a high potential for P hydrolysis at the root surface. Differences among EMF species in the proportion of P transferred to the host would not be detected by measuring root tip enzyme activities but may explain some of the specialization we detected in EMF. Future studies are needed to consider the steps between P hydrolysis and assimilation into plant tissue, and the time and scale at which these processes take place, to fully understand EMF-Alnus specificity.
The similarity in activity rates of P-mobilizing enzymes measured in the laboratory for Alnus growing across very different stand types, and in Alnus relative to other dominant woody plant species may not necessarily translate to in situ equivalences in the effects that these host species have on P biogeochemical cycling at the stand level. In the field, rates of whole plant P hydrolysis and acquisition are impacted by soil temperature and moisture, root density, plant growth and biomass partitioning, and whole-plant P demands. Average growing season soil temperatures decline from early to mid to late-successional sites, and soil moisture across stand types can be highly variable [9]. In early successional stands where Alnus dominates, in situ rates of root-tip P-mobilizing enzyme activity rates may be higher than where Alnus grows in later successional soils where soil temperature is reduced by mosses, litter, and canopy cover, and soil moisture is often lower due to higher terrace heights. Consistent with greater growth and N-fixation, whole plant P demand, as indexed by higher leaf P concentrations and greater N-fixation responses to P fertilization, is higher in these early-successional, dense stands dominated by Alnus [9]. Finally, in both mid- and late-succession, where A. tenuifolia grows in the sub-canopy of balsam poplar and white spruce, respectively, light levels are lower, and Alnus growth rates and N-fixation rates are reduced relative to early successional stands [9].
4.5. Phytase Activity
Although several studies have assessed the potential of EMF to mobilize P from organic sources [18,51,53], most have focused on acid phosphatase activity [16,19,56,58,59] and to a lesser extent phosphodiesterase activity [6]. Phytase activity has rarely been measured on EMF root tips [27] and never before to our knowledge on Alnus, despite the reputedly large proportion of phytate in total soil P pools [8,60]. Reasons behind this may relate to the importance of simple phosphomonoesters as a component of soil organic P. However, this phenomenon may also be methodological; assessing phytase activity on root tips and in soils is difficult. The method we used for measuring phytase activity on root tips has potential to further our understanding of the role of EMF in breaking down complex recalcitrant P molecules, which often make up large proportions of the organic P pool [8,60,61], and may become increasingly important where P is limiting. We were unable to resolve clear differences in phytase activity across succession, between horizons, or hosts; however, we note the high variability of this enzyme activity at all levels, which may suggest large differences among individual EMF species in the capacity to produce phytase.
5. Conclusions
Understanding how host-EMF mutualisms respond to and influence organic soil P fractions is clearly important to broader questions of P biogeochemical cycling in boreal forests. These questions are now approachable given refined methods for the analyses of soil P fractions, enzyme activities, EMF identities, and functional genes. Notwithstanding our low sample size, it is interesting we did not find superior capacity for P mobilization in alder relative to other hosts. However, differences in enzyme activities between the two dominant Alnus associated fungi in our study suggest that the unique alder EMF community composition may be coupled with P nutrition through C-N-P stoichiometry and exchange costs/benefits. Many other studies document variations in the enzyme activities of individual EMF, but assessing the enzyme potential at the whole-plant or ecosystem level is more difficult. This is uniquely true for alder because it commonly forms very dense, monospecific stands across early successional floodplains and in other disturbed areas where mineral soils are exposed.
Author Contributions
The following contributions were made by the authors: conceptualization, R.W.R., D.L.T., J.W.M., and K.K.; methodology, D.L.T., M.M.S., K.D.O., R.W.R., K.K.; formal analysis, R.W.R., D.L.T., K.D.O., M.M.S.; investigation, Swanson, R.W.R., K.D.O., D.L.T., J.W.M.; writing—original draft preparation, R.W.R. and M.M.S.; writing—review and editing, R.W.R.; project administration, R.W.R.; funding acquisition, R.W.R., D.L.T., K.K.
Funding
This work was funded by the Center for Global Change, University of Alaska Fairbanks (UAF), and by the National Science Foundation grants to R.W. Ruess (NSF DEB-0641033) and to the Bonanza Creek Long Term Ecological Research Program (NSF DEB-0620579 and DEB-1026415). Additional support was provided by the Institute of Arctic Biology and the Biology and Wildlife Department at UAF.
Acknowledgments
We are grateful to several NSF Research Experiences for Undergraduates students, Ivan Lein, Laurel Lynch, Mitchel Slife, Collin Stackhouse, and Josh Tanner, who spent long hours in challenging conditions to help collect and process samples and assisted with enzyme assays. Greg Breed and Calvin Heslop provided valuable statistical advice.
Conflicts of Interest
The authors declare no conflict of interest.
Appendix A. Enzyme Analyses
Individual root tips were incubated in diFMUP for 10 min per concentration and in bisMUP for 30 min per concentration based on prior testing to optimize enzyme assays. Between incubations in the same substrate, sieve strips were taken out of microplates, blotted on tissue to remove excess substrate, and rinsed for 3 min in wells of sodium acetate buffer. A similar procedure was followed between incubations in different enzyme substrates; however, the rinse incubation time was increased to 10 min. Additionally, sieve strips were gently rinsed under flowing sodium acetate buffer. At the end of the incubation period for each enzyme, 90 μL of the solution in each well was transferred into new a well containing 10 μL 0.5 M NaOH to stop the reaction and fluorescence was read immediately.
For phytase, root tips were placed into a reaction mixture containing 50 mM sodium acetate buffer (pH = 5.5), maltose phosphorylase, maltose, glucose oxidase, horseradish peroxidase, Amplex UltraRed dissolved in dimethylsulfoxide, and 2.0 mM phytic acid. Inorganic phosphorus (Pi) released from the hydrolysis of phytic acid during the assay reacts with enzymes in the reaction mixture to form H2O2 which reacts with Amplex UltraRed to create a florescent product that is proportional to the amount of Pi released. Wells containing reaction mixture without phytic acid were also included to adjust for autofluorescence of the reaction mixture. Root tips, in sieve strips, were placed in 100 μL of the reaction mixture for one hour. At the end of the incubation, sieve strips were removed and 65 μL solution was transferred from each well into a new read plate. Three reference standards were included in each plate. Standards contained the reaction mixture, with 0, 25, 50, 100, 200, 400, 800, and 1600 μM potassium phosphate replacing the phytic acid in the mixture.
Wells containing substrate without root tips were included in microplates to control for autofluorescence of the substrate. Three reference standards were included in each plate using 0, 0.5, 1, 1.5, 2.5, 3.5, 4.5, and 5.5 mM concentrations of 6,8-difluoro-7- hydroxy-4-methylcoumarin (MU). Standards were used to generate calibration curves that related fluorescence values to the quantity of MU released by the enzyme.
Appendix B. Molecular Characterization of Root Tips
Stock genomic DNA from extracted samples was diluted tenfold. Diluted template (5 μL) was added to a PCR reaction mixture of 10× PCR Buffer (Sigma-Aldrich), 10 mM dNTPs, 25 mM MgCl2, a 50 mM concentration of each primer and 2.5 KU of Taq polymerase (Sigma-Aldrich, St. Louis, MO, USA). The PCR cycling conditions for those reactions included an initial melt at 94 °C for 3 min, followed by 30 cycles of 94 °C for 45 s, 55 °C for 45 s, and 72 °C for 35 s. The program terminated after a final extension at 72 °C for 10 min.
Reads were first trimmed and aligned using CodonCode Aligner 3.7 (Dedham, MA, USA) and then assessed for base quality. Low quality bases, with a phred score below 20, were trimmed from ends, low quality bases within sequences were changed to Ns to remove ambiguous sequences, and sequences were oriented. We grouped sequences into phylogenetic clusters at approximately the species level using a script that carries out the following steps [37]. First, sequences are clustered into broad groups using the genome assembly program TGICL [62], which is based on Cap3 [63], with default settings except a percent identity threshold of 90%. All sequences falling into a Cap3 ‘contig’ are then subject to BLAST searches [64] against the database in GenBank. All unique BLAST matches are added to the file of input sequences for that cluster. Next, the query sequences plus BLAST matches within a cluster are aligned using default parameters in MUSCLE [65]. Then, the best maximum-likelihood phylogenetic tree is sought using the rapid bootstrap protocol in RAxML [66]. Lastly, the script explores the best tree and defines ‘phylobins’ based on a combination of branch length (defaults: minimum 0.001, maximum = 0.03) and bootstrap support (default: minimum = 70%, maximum = 95%).
As standard references, DNA from all abundant woody plant species found in our plot was extracted from fresh tissue using the DNeasy Plant Mini Kit (Qiagen Inc., Germantown, MD, USA. Prior to extraction, plant tissue was ground by hand using liquid nitrogen. Samples were extracted as described above. The trnL region of the plant chloroplast was amplified using the trnC–trnD primer pair [47,67] using DNA from both the plant tissue controls and from all root tip DNA used in enzyme analysis. The PCR cycling conditions for those reactions included an initial melt at 94 °C for 3 min, followed by 30 cycles of 94 °C for 45 s, 55 °C for 45 s, and 72 °C for 35 The program terminated after a final extension at 72 °C for 10 min. PCR products were digested with the TaqI restriction enzyme at 65 °C for 2 h and then run out on 3% agarose gels. Sample fragments were matched to banding patterns of plant standards for host identification.
Appendix C

Table A1.
Ectomycorrhizal fungi associated with Alder, Willow, Balsam poplar, White spruce, and unknown host (UNKN) sampled across early, mid and late successional stands along the Tanana River floodplain, Alaska. Tips with unknown hosts were not included in the analyses presented in this manuscript, but are included in this table as a record of what EMF species were recorded at these sites.
| Phylobin | Assigned Study Name | Best Match | Phylum | GenBank | UNITE ID | Match | Alignment Length (bp) | Score | Alder | Willow | Balsam Poplar | White Spruce | UNKN |
|---|---|---|---|---|---|---|---|---|---|---|---|---|---|
| 292 | Alnicola luteolofibrillosa 1 | Alnicola luteolofibrillosa | Basid | JN943976 | 97.9 | 714 | 1234 | 2 | 0 | 0 | 0 | 0 | |
| 297 | Alnicola luteolofibrillosa 2 | Alnicola luteolofibrillosa | Basid | SH190719.06FU | 99 | 599 | 1072 | 26 | 0 | 1 | 1 | 3 | |
| 274 | Alpova alpestris | Alpova alpestris | Basid | SH241746.06FU | 97.24 | 688 | 1162 | 1 | 0 | 0 | 0 | 0 | |
| 167 | Amphinema sp. 1 | Amphinema sp. | Basid | SH229867.06FU | 99.8 | 507 | 931 | 1 | 0 | 0 | 0 | 0 | |
| 68 | Articulospora sp. | uncultured Articulospora | Asco | SH234748.06FU | 96.55 | 464 | 767 | 1 | 0 | 0 | 0 | 0 | |
| 26 | Ascomycete sp. 1 | Ascomycete sp. | Asco | SH037210.06FU | 91.01 | 367 | 488 | 1 | 0 | 0 | 0 | 0 | |
| 27 | Ascomycete sp. 2 | Ascomycete sp. | Asco | SH037210.06FU | 90.44 | 366 | 473 | 0 | 0 | 0 | 1 | 0 | |
| 28 | Ascomycete sp. 3 | Ascomycete sp. | Asco | SH037210.06FU | 93.44 | 673 | 590 | 6 | 0 | 0 | 6 | 4 | |
| 30 | Cadophora finlandica 1 | Cadophora finlandica | Asco | SH207167.06FU | 98.92 | 465 | 830 | 0 | 0 | 0 | 1 | 0 | |
| 31 | Cadophora finlandica 2 | Cadophora finlandica | Asco | SH207167.06FU | 98.07 | 466 | 809 | 0 | 0 | 0 | 1 | 0 | |
| 364 | Cadophora luteo-olivacea | Cadophora luteo-olivacea | Asco | SH204718.06FU | 97.24 | 544 | 918 | 0 | 0 | 0 | 0 | 1 | |
| 376 | Cenococcum geophilum | Cenococcum geophilum | Asco | JN943893 | 97.61 | 964 | 1648 | 0 | 0 | 0 | 0 | 1 | |
| 139 | Chalara holubovae | Chalara holubovae | Asco | SH209190.06FU | 97.78 | 451 | 773 | 0 | 0 | 0 | 0 | 1 | |
| 141 | Chalara microchona | Chalara microchona | Asco | DQ093752 | 98.9 | 451 | 778 | 0 | 0 | 0 | 1 | 0 | |
| 64 | Cladophialophora sp. 1 | uncultured Cladophialophora | Asco | SH025802.06FU | 98.22 | 506 | 885 | 1 | 0 | 0 | 0 | 0 | |
| 103 | Cortinariaceae sp. 1 | Alnicola luteolofibrillosa | Basid | SH190719.06FU | 89.93 | 606 | 767 | 0 | 0 | 0 | 0 | 1 | |
| 104 | Cortinariaceae sp. 2 | Alnicola luteolofibrillosa | Basid | JN943976 | 90.26 | 688 | 878 | 1 | 0 | 0 | 0 | 0 | |
| 238 | Cortinariaceae sp. 3 | Cortinariaceae sp. | Basid | SH232566.06FU | 99.02 | 612 | 1096 | 0 | 0 | 0 | 1 | 0 | |
| 207 | Cortinarius casimiri 1 | Cortinarius casimiri | Basid | SH232912.06FU | 96.08 | 510 | 830 | 0 | 0 | 0 | 1 | 0 | |
| 208 | Cortinarius casimiri 2 | Cortinarius casimiri | Basid | SH232830.06FU | 99.41 | 507 | 920 | 0 | 0 | 0 | 1 | 1 | |
| 237 | Cortinarius cephalixu | Cortinarius cephalixu | Basid | AY174784 | 99.29 | 708 | 1279 | 1 | 0 | 0 | 0 | 0 | |
| 199 | Cortinarius sp. 1 | Cortinarius subsertipes | Basid | HQ604709 | 96.75 | 615 | 1020 | 0 | 0 | 2 | 0 | 3 | |
| 183 | Cyathicula microspora | Cyathicula microspora | Asco | SH014066.06FU | 99.36 | 469 | 850 | 0 | 0 | 0 | 0 | 1 | |
| 34 | Geomyces sp. 1 | Geomyces destructans | Asco | EU854569 | 96.73 | 888 | 1476 | 0 | 1 | 0 | 0 | 1 | |
| 129 | Gloeotinia temulenta | Gloeotinia temulenta | Asco | SH235673.06FU | 99.8 | 506 | 928 | 2 | 0 | 0 | 2 | 2 | |
| 349 | Gyoerffyella sp. 1 | Gyoerffyella sp. | Asco | SH234755.06FU | 97.35 | 452 | 765 | 1 | 0 | 0 | 0 | 2 | |
| 1 | Helotiaceae sp. 1 | Leohumicola minima | Asco | AY706329 | 91.95 | 559 | 765 | 0 | 0 | 0 | 2 | 0 | |
| 92 | Helotiaceae sp. 2 | Helotiaceae sp. | Asco | HQ157915 | 93.11 | 537 | 784 | 0 | 0 | 0 | 0 | 1 | |
| 180 | Helotiaceae sp. 3 | uncultured Helotiaceae | Asco | SH030055.06FU | 97.38 | 458 | 774 | 0 | 0 | 0 | 1 | 0 | |
| 377 | Helotiaceae sp. 4 | Helotiales sp. | Asco | SH444216.06FU | 87.31 | 536 | 592 | 2 | 0 | 0 | 0 | 0 | |
| 329 | Helotiales sp. 1 | Leptodontidium sp. | Asco | SH034136.06FU | 99.06 | 531 | 953 | 0 | 0 | 0 | 0 | 1 | |
| 347 | Hyaloscyphaceae sp. 1 | Calycina languida | Asco | SH208263.06FU | 90.74 | 475 | 638 | 0 | 0 | 0 | 1 | 0 | |
| 175 | Hygrophorus pustulatus | Hygrophorus pustulatus | Basid | FJ845412 | 99.8 | 501 | 920 | 0 | 0 | 0 | 1 | 0 | |
| 282 | Inocybaceae sp. 1 | Inocybaceae sp. | Basid | SH240210.06FU | 99.31 | 583 | 1051 | 1 | 0 | 1 | 0 | 0 | |
| 6 | Lachnum sp. 1 | uncultured Lachnum | Asco | SH189775.06FU | 97.44 | 468 | 795 | 3 | 0 | 0 | 3 | 1 | |
| 89 | Lactarius lilacinus | Lactarius lilacinus | Basid | SH238120.06FU | 99.21 | 630 | 1136 | 2 | 0 | 0 | 0 | 0 | |
| 284 | Leohumicola minima | Leohumicola minima | Asco | AY706329 | 97.27 | 549 | 928 | 1 | 0 | 0 | 0 | 0 | |
| 357 | Leptodontidium orchidicola 1 | Leptodontidium orchidicola | Asco | AF486133 | 98.93 | 652 | 1168 | 0 | 0 | 0 | 0 | 5 | |
| 359 | Leptodontidium orchidicola 2 | Leptodontidium orchidicola | Asco | AF486133 | 97.85 | 650 | 1118 | 0 | 0 | 0 | 0 | 1 | |
| 360 | Leptodontidium orchidicola 3 | Leptodontidium orchidicola | Asco | AF486133 | 98.29 | 644 | 1125 | 1 | 0 | 0 | 0 | 0 | |
| 361 | Leptodontidium orchidicola 4 | Leptodontidium orchidicola | Asco | AF486133 | 98.59 | 638 | 1127 | 0 | 0 | 0 | 0 | 1 | |
| 363 | Leptodontidium orchidicola 5 | Leptodontidium orchidicola | Asco | AF486133 | 98.9 | 637 | 1138 | 0 | 0 | 0 | 0 | 1 | |
| 14 | Lycoperdon foetidum | Lycoperdon foetidum | Basid | SH244736.06FU | 97.42 | 658 | 1120 | 1 | 0 | 0 | 0 | 0 | |
| 76 | Meliniomyces bicolor | Meliniomyces bicolor | Asco | SH207170.06FU | 99.79 | 475 | 872 | 1 | 0 | 0 | 0 | 0 | |
| 46 | Phialocephala fortinii 1 | Phialocephala fortinii | Asco | SH213468.06FU | 98.32 | 476 | 833 | 0 | 0 | 0 | 1 | 0 | |
| 47 | Phialocephala fortinii 2 | Phialocephala fortinii | Asco | SH213468.06FU | 98.82 | 592 | 1055 | 2 | 0 | 0 | 0 | 0 | |
| 49 | Phialocephala fortinii 3 | Phialocephala fortinii | Asco | SH213468.06FU | 98.95 | 476 | 850 | 1 | 0 | 0 | 0 | 0 | |
| 339 | Phialocephala fortinii 4 | Phialocephala fortinii | Asco | SH213468.06FU | 97.69 | 477 | 824 | 5 | 0 | 0 | 2 | 1 | |
| 366 | Phialocephala lagerbergii | Phialocephala lagerbergii | Asco | SH204727.06FU | 99.2 | 500 | 900 | 0 | 0 | 0 | 0 | 1 | |
| 320 | Piloderma sp. 1 | Piloderma sp. | Basid | UDB001733 | 100 | 621 | 1147 | 1 | 0 | 0 | 1 | 0 | |
| 128 | Plectosphaerellaceae sp. | Verticillium leptobactrum | Asco | SH235676.06FU | 94.11 | 475 | 715 | 0 | 0 | 0 | 0 | 1 | |
| 61 | Russula cessans | Russula cessans | Basid | FJ845437 | 98.92 | 646 | 1151 | 0 | 0 | 0 | 2 | 0 | |
| 59 | Russula sp. 1 | Russula cessans | Basid | FJ845437 | 93.32 | 704 | 1044 | 0 | 0 | 0 | 1 | 0 | |
| 60 | Russula sp. 2 | Russula cessans | Basid | FJ845437 | 94.64 | 634 | 976 | 1 | 0 | 0 | 0 | 0 | |
| 380 | Russula sp. 3 | Russula cessans | Basid | FJ845437 | 95.04 | 605 | 941 | 0 | 0 | 0 | 1 | 0 | |
| 262 | Russula versicolor | Russula versicolor | Basid | SH224391.06FU | 98.69 | 610 | 1081 | 0 | 0 | 0 | 0 | 2 | |
| 343 | Sebacina dimitica | Sebacina dimitica | Basid | SH231629.06FU | 98.49 | 530 | 931 | 0 | 0 | 0 | 0 | 1 | |
| 85 | Sebacina epigaea | Sebacina epigaea | Basid | EU819519 | 95.69 | 532 | 907 | 0 | 6 | 0 | 1 | 0 | |
| 119 | Sebacina sp. 2 | Sebacina sp. | Basid | SH305078.06FU | 98.3 | 529 | 926 | 0 | 3 | 8 | 0 | 1 | |
| 159 | Sebacina sp. 3 | Sebacina sp. | Basid | SH231609.06FU | 99.25 | 534 | 963 | 1 | 0 | 0 | 0 | 0 | |
| 161 | Sebacina sp. 4 | Sebacina sp. | Basid | SH231664.06FU | 98.71 | 541 | 957 | 3 | 0 | 0 | 0 | 0 | |
| 344 | Sebacina sp. 5 | Sebacina sp. | Basid | SH231595.06FU | 99.26 | 541 | 977 | 0 | 0 | 1 | 0 | 3 | |
| 24 | Tetracladium maxilliforme | Tetracladium maxilliforme | Asco | EU883429 | 97.13 | 593 | 1000 | 2 | 0 | 0 | 0 | 0 | |
| 100 | Thelephora terrestris | Thelephora terrestris | Basid | HM189958 | 93.22 | 708 | 1031 | 3 | 0 | 0 | 0 | 0 | |
| 20 | Thelephoraceae sp. 1 | Thelephoraceae sp. | Basid | SH195974.06FU | 94.75 | 590 | 917 | 0 | 0 | 0 | 0 | 1 | |
| 21 | Thelephoraceae sp. 2 | Thelephoraceae sp. | Basid | SH195974.06FU | 93 | 586 | 848 | 1 | 0 | 0 | 0 | 0 | |
| 99 | Thelephoraceae sp. 3 | Thelephoraceae sp. | Basid | SH219843.06FU | 95.52 | 536 | 856 | 1 | 0 | 0 | 0 | 0 | |
| 132 | Tomentella ferruginea 1 | Tomentella ferruginea | Basid | AF272909 | 98.74 | 555 | 985 | 0 | 1 | 0 | 1 | 0 | |
| 134 | Tomentella ferruginea 2 | Tomentella ferruginea | Basid | AF272909 | 98.17 | 546 | 952 | 0 | 0 | 5 | 0 | 2 | |
| 7 | Tomentella sp. 1 | Tomentella sp. | Basid | SH213382.06FU | 99.65 | 576 | 1055 | 2 | 0 | 0 | 0 | 0 | |
| 239 | Tomentella sp. 10 | Tomentella ellisii | Basid | SH222911.06FU | 96.61 | 590 | 977 | 1 | 0 | 0 | 0 | 0 | |
| 264 | Tomentella sp. 12 | uncultured Tomentella | Basid | SH202475.06FU | 97.74 | 576 | 992 | 0 | 0 | 0 | 0 | 1 | |
| 269 | Tomentella sp. 13 | Tomentella sp. | Basid | U83482 | 96.05 | 683 | 1110 | 1 | 0 | 0 | 0 | 0 | |
| 379 | Tomentella sp. 14 | Tomentella sp. | Basid | SH202538.06FU | 99.15 | 587 | 1055 | 0 | 1 | 0 | 0 | 0 | |
| 8 | Tomentella sp. 2 | uncultured Tomentella | Basid | SH199023.06FU | 98.78 | 572 | 1016 | 0 | 0 | 2 | 3 | 2 | |
| 22 | Tomentella sp. 6 | Tomentella sublilacina | Basid | HM189994 | 95.83 | 695 | 1120 | 18 | 0 | 0 | 1 | 0 | |
| 98 | Tomentella sp. 7 | uncultured Tomentella | Basid | SH021829.06FU | 94.67 | 582 | 896 | 0 | 0 | 0 | 0 | 1 | |
| 223 | Tomentella sp. 9 | uncultured Tomentella | Basid | SH219870.06FU | 98.14 | 590 | 1027 | 0 | 0 | 0 | 0 | 2 | |
| 224 | Tomentella viridula | Tomentella viridula | Basid | AF272914 | 99.66 | 581 | 1061 | 0 | 0 | 0 | 0 | 1 | |
| 280 | Tomentellopsis sp. 1 | Tomentellopsis submollis | Basid | SH199523.06FU | 96.98 | 597 | 1009 | 1 | 0 | 0 | 0 | 0 | |
| 192 | Trichophaea sp. 1 | Trichophaea cf hybrida | Asco | SH227980.06FU | 100 | 522 | 965 | 1 | 0 | 0 | 0 | 0 | |
| 10 | Tuber sp. 1 | uncultured Tuber | Asco | SH204354.06FU | 99.66 | 592 | 1081 | 0 | 3 | 0 | 5 | 0 | |
| 62 | Tuber sp. 2 | Tuber rapaeodorum | Asco | EU784430 | 95.88 | 582 | 937 | 1 | 0 | 0 | 0 | 0 | |
| 384 | Tuber sp. 3 | uncultured Tuber | Asco | SH204354.06FU | 99.66 | 592 | 1081 | 0 | 0 | 0 | 0 | 1 | |
| 41 | Vibrisseaceae sp. 1 | Phialocephala fortinii | Asco | SH016932.06FU | 84.11 | 151 | 147 | 0 | 0 | 0 | 0 | 1 | |
| 150 | Wilcoxina rehmii 2 | Wilcoxina rehmii | Asco | SH023929.06FU | 97.58 | 455 | 778 | 0 | 0 | 0 | 1 | 0 |
References
- Marion, G.M.; Van Cleve, K.; Dyrness, C.T.; Black, C.H. The soil chemical environment along a primary successional sequence on the Tanana River floodplain, interior Alaska. Can. J. For. Res. 1993, 23, 923–927. [Google Scholar] [CrossRef]
- Giesler, R.; Petersson, T.; Hogberg, P. Phosphorus limitation in boreal forests: Effects of aluminum and iron accumulation in the humus layer. Ecosystems 2002, 5, 300–314. [Google Scholar] [CrossRef]
- Sterner, R.W.; Elser, J.J. Ecological Stoichiometry: The Biology of Elements from Molecules to the Biosphere; Princeton University Press: Princeton, NJ, USA, 2002. [Google Scholar]
- Walker, T.W.; Syers, J.K. The fate of phosphorus during pedogenesis. Geoderma 1976, 1, 1–19. [Google Scholar] [CrossRef]
- Crews, T.E.; Kitayama, K.; Fownes, J.H.; Riley, R.H.; Herbert, D.A.; Mueller-Dombois, D.; Vitousek, P.M. Changes in soil phosphorus fractions and ecosystem dynamics across a long chronosequence in Hawaii. Ecology 1995, 76, 1407–1424. [Google Scholar] [CrossRef]
- Allison, V.J.; Condron, L.M.; Peltzer, D.A.; Richardson, S.J.; Turner, B.L. Changes in enzyme activities and soil microbial community composition along carbon and nutrient gradients at the Franz Josef chronosequence, New Zealand. Soil Biol. Biochem. 2007, 39, 1770–1781. [Google Scholar] [CrossRef]
- Harrison, A.F. Labile organic phosphorus mineralization in relationship to soil properties. Soil Biol. Biochem. 1982, 14, 343–351. [Google Scholar] [CrossRef]
- Turner, B.L.; Condron, L.M.; Richardson, S.J.; Peltzer, D.A.; Allison, V.J. Soil organic phosphorus transformations during pedogenesis. Ecosystems 2007, 10, 1166–1181. [Google Scholar] [CrossRef]
- Ruess, R.W.; Anderson, M.D.; McFarland, J.M.; Kielland, K.; Olson, K.; Taylor, D.E. Ecosystem-level consequences of symbiont partnerships in a N2-fixing shrub from interior Alaskan floodplains. Ecol. Monogr. 2013, 83, 177–194. [Google Scholar] [CrossRef]
- Houlton, B.Z.; Wang, Y.P.; Vitousek, P.M.; Field, C.B. A unifying framework for dinitrogen fixation in the terrestrial biosphere. Nature 2008, 454, 327–334. [Google Scholar] [CrossRef]
- Smith, S.E.; Read, D.J. Mycorrhizal Symbiosis, 3rd ed.; Academic Press: London, UK, 2008. [Google Scholar]
- Ruess, R.W.; McFarland, J.M.; Trummer, L.M.; Rohrs-Richey, J.K. Disease-mediated declines in N-fixation inputs by Alnus tenuifolia to early-successional floodplains in interior and south-central Alaska. Ecosystems 2009, 12, 489–501. [Google Scholar] [CrossRef]
- Uliassi, D.D.; Ruess, R.W. Limitations to symbiotic nitrogen fixation in primary succession on the Tanana River floodplain, Alaska. Ecology 2002, 83, 88–103. [Google Scholar] [CrossRef]
- Anderson, M.D.; Ruess, R.W.; Uliassi, D.D.; Mitchell, J.S. Estimating N2 fixation in two species of Alnus in interior Alaska using acetylene reduction and 15N2 uptake. Ecoscience 2004, 11, 102–112. [Google Scholar] [CrossRef]
- Giardina, C.P.; Huffman, S.; Binkley, D.; Caldwell, B.A. Alders increase soil phosphorus availability in a Douglas-fir plantation. Can. J. For.Res. 1995, 25, 1652–1657. [Google Scholar] [CrossRef]
- Walker, J.K.M.; Cohen, H.; Higgins, L.M.; Kennedy, P.G. Testing the link between community structure and function for ectomycorrhizal fungi involved in a global tripartite symbiosis. New Phytol. 2014, 202, 287–296. [Google Scholar] [CrossRef] [PubMed]
- Pritsch, K.; Munch, J.C.; Buscot, F. Morphological and anatomical characterisation of black alder Alnus glutinosa (L.) Gaertn. ectomycorrhizas. Mycorrhiza 1997, 7, 201–216. [Google Scholar] [CrossRef]
- Plassard, C.; Louche, J.; Ali, M.A.; Duchemin, M.; Legname, E.; Cloutier-Hurteau, B. Diversity in phosphorus mobilisation and uptake in ectomycorrhizal fungi. Ann. For. Sci. 2011, 68, 33–43. [Google Scholar] [CrossRef]
- Courty, P.E.; Pritsch, K.; Schloter, M.; Hartmann, A.; Garbaye, J. Activity profiling of ectomycorrhiza communities in two forest soils using multiple enzymatic tests. New Phytol. 2005, 167, 309–319. [Google Scholar] [CrossRef]
- Koide, R.T.; Courty, P.E.; Garbaye, J. Research perspectives on functional diversity in ectomycorrhizal fungi. New Phytol. 2007, 174, 240–243. [Google Scholar] [CrossRef]
- Tedersoo, L.; Suvi, T.; Jairus, T.; Kõljalg, U. Forest microsite effects on community composition of ectomycorrhizal fungi on seedlings of Picea abies and Betula pendula. Environ. Microbiol. 2008, 10, 1189–1201. [Google Scholar] [CrossRef]
- Tedersoo, L.; Suvi, T.; Jairus, T.; Ostonen, I.; Polme, S. Revisiting ectomycorrhizal fungi of the genus Alnus: Differential host specificity, diversity and determinants of the fungal community. New Phytol. 2009, 182, 727–735. [Google Scholar] [CrossRef]
- Kennedy, P.G.; Hill, L.T. A molecular and phylogenetic analysis of the structure and specificity of Alnus rubra ectomycorrhizal assemblages. Fungal Ecol. 2010, 3, 195–204. [Google Scholar] [CrossRef]
- Põlme, S.; Bahram, M.; Yamanaka, T.; Nara, K.; Dai, Y.C.; Grebenc, T.; Kraigher, H.; Toivonen, M.; Wang, P.H.; Matsuda, Y.; et al. Biogeography of ectomycorrhizal fungi associated with alders (Alnus spp.) in relation to biotic and abiotic variables at the global scale. New Phytol. 2013, 198, 1239–1249. [Google Scholar] [CrossRef]
- Roy, M.; Rochet, J.; Manzi, S.; Jargeat, P.; Gryta, H.; Moreau, P.A.; Gardes, M. What determines Alnus-associated ectomycorrhizal community diversity and specificity? A comparison of host and habitat effects at a regional scale. New Phytol. 2013, 198, 1228–1238. [Google Scholar] [CrossRef] [PubMed]
- Kroehler, C.J.; Linkins, A.E. The root surface phosphatases of Eriophorum vaginatum: Effects of temperature, pH, substrate concentration and inorganic phosphorus. Plant Soil 1988, 105, 3–10. [Google Scholar] [CrossRef]
- Colpaert, J.V.; Van Laere, A.; Van Tichelen, K.K.; Van Assche, J.A. The use of inositol hexaphosphate as a phosphorus source by mycorrhizal and non-mycorrhizal Scots Pine (Pinus sylvestris). Funct. Ecol. 1997, 11, 407–415. [Google Scholar] [CrossRef]
- Turner, B.L. Resource partitioning for soil phosphorus: a hypothesis. J. Ecol. 2008, 96, 698–702. [Google Scholar] [CrossRef]
- Louche, J.; Ali, M.A.; Cloutier-Hurteau, B.; Sauvage, F.X.; Quiquampoix, H.; Plassard, C. Efficiency of acid phosphatases secreted from the ectomycorrhizal fungus Hebeloma cylindrosporum to hydrolyse organic phosphorus in podzols. FEMS Microbiol. Ecol. 2010, 73, 323–335. [Google Scholar] [CrossRef] [PubMed]
- Hollingsworth, T.N.; Lloyd, A.H.; Nossov, D.; Ruess, R.W.; Charlton, B.A.; Kielland, K. Twenty-five years of vegetation change along a putative successional chronosequence on the Tanana River, Alaska. Can. J. For. Res. 2010, 40, 1273–1287. [Google Scholar] [CrossRef]
- Viereck, L.A.; Vancleve, K.; Adams, P.C.; Schlentner, R.E. Climate of the Tanana River floodplain near Fairbanks, Alaska. Can. J. For. Res. 1993, 23, 899–913. [Google Scholar] [CrossRef]
- Anderson, M.D.; Ruess, R.W.; Taylor, D.L.; Myrold, D.D. Host species and habitat affect nodulation by specific Frankia genotypes in two species of Alnus in interior Alaska. Oecologia 2009, 160, 619–630. [Google Scholar] [CrossRef]
- Anderson, M.D.; Taylor, D.E.; Ruess, R.W. Phylogeny and assemblage composition of Frankia in Alnus tenuifolia nodules across a primary successional sere in interior Alaska. Mol. Ecol. 2013, 22, 3864–3877. [Google Scholar] [CrossRef] [PubMed]
- Pritsch, K.; Raidl, S.; Marksteiner, E.; Blaschke, H.; Agerer, R.; Schloter, M.; Hartmann, A. A rapid and highly sensitive method for measuring enzyme activities in single mycorrhizal tips using 4-methylumbelliferone-labelled fluorogenic substrates in a microplate system. J. Microbiol. Methods 2004, 58, 233–241. [Google Scholar] [CrossRef] [PubMed]
- Giles, C.D.; Cade-Menun, B.J.; Hill, J.E. The inositol phosphates in soils and manures: Abundance, cycling, and measurement. Can. J. Soil Sci. 2011, 91, 397–416. [Google Scholar] [CrossRef]
- Gardes, M.; Bruns, T.D. ITS primers with enhanced specificity for basidiomycetes - application to the identification of mycorrhizae and rusts. Mol. Ecol. 1993, 2, 113–118. [Google Scholar] [CrossRef]
- Taylor, D.L.; Houston, S. A bioinformatics pipeline for sequence-based analyses of fungal biodiversity. In Methods in Molecular Biology; Xu, J.R., Bluhm, B.H., Eds.; Humana Press: Totowa, NJ, USA, 2011; Volume 722, pp. 141–155. [Google Scholar]
- Timling, I.; Walker, D.A.; Nusbaum, C.; Lennon, N.J.; Taylor, D.L. Rich and cold: Diversity, distribution and drivers of fungal communities in patterned-ground ecosystems of the North American Arctic. Mol. Ecol. 2014, 23, 3258–3272. [Google Scholar] [CrossRef]
- R Development Core Team. R: A Language and Environment for Statistical Computing; R Foundation for Statistical Computing: Vienna, Austria, 2017. [Google Scholar]
- Zuur, A.F.; Ieno, E.N.; Walker, N.J.; Saveliev, A.A.; Smith, G.M. Mixed Effects Models and Extensions in Ecology with R; Springer: New York, NY, USA, 2009. [Google Scholar]
- Flanagan, P.W.; Van Cleve, K. Nutrient cycling in relation to decomposition and organic matter quality in taiga ecosystems. Can. J. For. Res. 1983, 13, 795–817. [Google Scholar] [CrossRef]
- Ruess, R.W.; Hendrick, R.L.; Bryant, J.P. Regulation of fine root dynamics by mammalian browsers in early successional Alaskan taiga forests. Ecology 1998, 79, 2706–2720, Erratum in 1999, 80, 1101. [Google Scholar] [CrossRef]
- Gentili, F.; Wall, L.G.; Huss-Danell, K. Effects of phosphorus and nitrogen on nodulation are seen already at the stage of early cortical cell divisions in Alnus incana. Ann. Bot. 2006, 98, 309–315. [Google Scholar] [CrossRef]
- Huss-Danell, K.; Gentili, F.; Valverde, C.; Wall, L.G.; Wiklund, A. Phosphorus is important in nodulation of actinorhizal plants and legumes. In Nitrogen Fixation: Global Perspectives; Finan, T., O’Brian, N., Layzell, D., Vessey, K., Newton, W., Eds.; CAB International: Wallingford, UK, 2002; pp. 163–166. [Google Scholar]
- Mitchell, J.S.; Ruess, R.W. N2-fixing alder (Alnus viridis spp. fruticosa) effects on soil properties across a secondary successional chronosequence in interior Alaska. Biogeochemistry 2009, 95, 215–229. [Google Scholar] [CrossRef]
- Molina, R. Ectomycorrhizal specificity in the genus Alnus. Can. J. Bot. 1981, 59, 325–334. [Google Scholar] [CrossRef]
- Kennedy, P.G.; Garibay-Orijel, R.; Higgins, L.M.; Angeles-Arguiz, R. Ectomycorrhizal fungi in Mexican Alnus forests support the host co-migration hypothesis and continental-scale patterns in phylogeography. Mycorrhiza 2011, 21, 559–568. [Google Scholar] [CrossRef] [PubMed]
- Moreau, P.A.; Peintner, U.; Gardes, M. Phylogeny of the ectomycorrhizal mushroom genus Alnicola (Basidiomycota, Cortinariaceae) based on rDNA sequences with special emphasis on host specificity and morphological characters. Mol. Phylogenet. Evolut. 2006, 38, 794–807. [Google Scholar] [CrossRef] [PubMed]
- Rochet, J.; Moreau, P.A.; Manzi, S.; Gardes, M. Comparative phylogenies and host specialization in the alder ectomycorrhizal fungi Alnicola, Alpova and Lactarius (Basidiomycota) in Europe. BMC Evolut. Biol. 2011, 11. [Google Scholar] [CrossRef] [PubMed]
- Bogar, L.M.; Kennedy, P.G. New wrinkles in an old paradigm: Neighborhood effects can modify the structure and specificity of Alnus-associated ectomycorrhizal fungal communities. FEMS Microbiol. Ecol. 2013, 83, 767–777. [Google Scholar] [CrossRef] [PubMed]
- Bolan, N.S. A critical review on the role of mycorrhizal fungi in the uptake of phosphorus by plants. Plant Soil 1992, 134, 189–207. [Google Scholar] [CrossRef]
- Cairney, J.W.G. Intraspecific physiological variation: Implications for understanding functional diversity in ectomycorrhizal fungi. Mycorrhiza 1999, 9, 125–135. [Google Scholar] [CrossRef]
- Cairney, J.W.G. Ectomycorrhizal fungi: The symbiotic route to the root for phosphorus in forest soils. Plant Soil 2011, 344, 51–71. [Google Scholar] [CrossRef]
- Wurzburger, N.; Bellenger, J.P.; Kraepiel, A.M.L.; Hedin, L.O. Molybdenum and phosphorus interact to constrain asymbiotic nitrogen fixation in tropical forests. PLoS ONE 2012, 7. [Google Scholar] [CrossRef]
- Agerer, R. Exploration types of ectomycorrhizae: A proposal to classify ectomycorrhizal mycelial systems according to their patterns of differentiation and putative ecological importance. Mycorrhiza 2001, 11, 107–114. [Google Scholar] [CrossRef]
- Alvarez, M.; Huygens, D.; Díaz, L.M.; Villanueva, C.A.; Heyser, W.; Boeckx, P. The spatial distribution of acid phosphatase activity in ectomycorrhizal tissues depends on soil fertility and morphotype, and relates to host plant phosphorus uptake. Plant Cell Environ. 2012, 35, 126–135. [Google Scholar] [CrossRef]
- Colpaert, J.V.; Van Tichelen, K.K.; Van Assche, J.A.; Van Laere, A. Short-term phosphorus uptake rates in mycorrhizal and non-mycorrhizal roots of intact Pinus sylvestris seedlings. New Phytol. 1999, 143, 589–597. [Google Scholar] [CrossRef]
- Rineau, F.; Garbaye, J. Does forest liming impact the enzymatic profiles of ectomycorrhizal communities through specialized fungal symbionts? Mycorrhiza 2009, 19, 493–500. [Google Scholar] [CrossRef] [PubMed]
- van Aarle, I.M.; Plassard, C. Spatial distribution of phosphatase activity associated with ectomycorrhizal plants is related to soil type. Soil Biol. Biochem. 2010, 42, 324–330. [Google Scholar] [CrossRef]
- Turner, B.L.; Papházy, M.J.; Haygarth, P.M.; McKelvie, I.D. Inositol phosphates in the environment. Philos. Trans. Royal Soc. B Biol. Sci. 2002, 357, 449–469. [Google Scholar] [CrossRef]
- Dalai, R.C. Soil Organic Phosphorus. In Advances in Agronomy; Brady, N.C., Ed.; Academic Press: New York, NY, USA, 1977; Volume 29, pp. 83–117. [Google Scholar]
- Pertea, G.; Huang, X.; Liang, F.; Antonescu, V.; Sultana, R.; Karamycheva, S.; Lee, Y.; White, J.; Cheung, F.; Parvizi, B.; et al. TIGR gene indices clustering tools (TGICL): A software system for fast clustering of large EST datasets. Bioinformatics 2003, 19, 651–652. [Google Scholar] [CrossRef]
- Huang, X.; Madan, A. CAP3: A DNA sequence assembly program. Genome Res. 1999, 9, 868–877. [Google Scholar] [CrossRef] [PubMed]
- Altschul, S.F.; Madden, T.L.; Schäffer, A.A.; Zhang, J.; Zhang, Z.; Miller, W.; Lipman, D.J. Gapped BLAST and PSI-BLAST: A new generation of protein database search programs. Nucleic Acids Res. 1997, 25, 3389–3402. [Google Scholar] [CrossRef]
- Edgar, R.C. MUSCLE: Multiple sequence alignment with high accuracy and high throughput. Nucleic Acids Res. 2004, 32, 1792–1797. [Google Scholar] [CrossRef]
- Stamatakis, A.; Hoover, P.; Rougemont, J. A rapid bootstrap algorithm for the RAxML web servers. Syst. Biol. 2008, 57, 758–771. [Google Scholar] [CrossRef]
- Taberlet, P.; Gielly, L.; Pautou, G.; Bouvet, J. Universal primers for amplification of three non-coding regions of chloroplast DNA. Plant Mol. Biol. 1991, 17, 1105–1109. [Google Scholar] [CrossRef]
© 2019 by the authors. Licensee MDPI, Basel, Switzerland. This article is an open access article distributed under the terms and conditions of the Creative Commons Attribution (CC BY) license (http://creativecommons.org/licenses/by/4.0/).