Article

Two Centuries-Long Streamflow Reconstruction Inferred from Tree Rings for the Middle Reaches of the Weihe River in Central China

1
Shaanxi Key Laboratory of Disaster Monitoring and Mechanism Simulating, College of Geography and Environment, Baoji University of Arts and Sciences, Baoji 721013, China
2
State Key Laboratory of Loess and Quaternary Geology, Institute of Earth Environment, Chinese Academy of Sciences, Xi’an 710061, China
3
Regional Climate Group, Department of Earth Sciences, University of Gothenburg, Box 460, 405 30 Gothenburg, Sweden
*
Author to whom correspondence should be addressed.
Forests 2019, 10(3), 208; https://doi.org/10.3390/f10030208
Submission received: 20 January 2019 / Revised: 14 February 2019 / Accepted: 25 February 2019 / Published: 26 February 2019
(This article belongs to the Special Issue Forest Hydrology and Watershed)

Abstract

:
Water source is one of the most important concerns for regional society and economy development, especially in the Weihe River basin which is located in the marginal zone of the Asian summer monsoon. Due to the weakness of short instrumental records, the variations of streamflow during the long-term natural background are difficult to access. Herein, the average June–July streamflow variability in the middle reaches of the Weihe River was identified based on tree-ring width indices of Chines pine (Pinus tabulaeformis Carr.) from the northern slope of the Qinling Mountains in central China. Our model could explain the variance of 39.3% in the observed streamflow period from 1940 to 1970 AD. There were 30 extremely low years and 26 high years which occurred in our reconstruction for the effective span of 1820 to 2005. Several common dryness and wetness periods appeared in this reconstructed streamflow, and other tree-ring precipitation series suggested the coherence of hydroclimate fluctuation over the Weihe River basin. Some significant peaks in cycles implied the linkages of natural forcing on the average June–July streamflow of the Weihe River, such as the Pacific Decadal Oscillation (PDO) and El Niño-Southern Oscillation (ENSO) activities. Spatial correlation results between streamflow and sea surface temperature in the northern Pacific Ocean, as well as extremely low/high years responding to the El Niño/La Nina events, supported the teleconnections. The current 186-year streamflow reconstruction placed regional twentieth-century drought and moisture events in a long-term perspective in the Weihe River basin, and provided useful information for regional water resource safety and forest management, particularly under climate warming conditions.

1. Introduction

Weihe River is the largest tributary of the Yellow River, China, with a basin area of 134,800 km2. The length of the Weihe River is 818 km, crossing three provinces of Gansu, Ningxia, and Shaanxi in the eastern part of the Northwest China [1,2]. The upper reaches locate in the semi-arid region of eastern Gansu and southern Ningxia, and the middle and down reaches locate in the semi-humid region of Shaanxi. Hydroclimate in the Weihe River basin is mainly influenced by the Asian summer monsoon, and is sensitive to climate anomalies [3,4]. Total annual precipitation over the basin is about 573 mm, and most precipitation occurs in the summer rainy season. The mean natural discharge is 10.4 × 10⁹ m3, accounting for 17.3% of total annual runoff of the Yellow River. As the major water source utilized for the middle and down reaches, the most important region of industrial–agricultural production and ecosystem protection in Northwest China, the Weihe River plays an important role in the sustainable development of Shaanxi province. The average water resources of the Weihe River basin accounts for 17.4% of the total amount in Shaanxi, but it supports 63.6% of the population, 53% of the cultivated land area, 63.4% of the grain output and 64.8% of the gross domestic product (GDP) of Shaanxi [5]. Compared to industrial water and domestic water consumption, the rate of agricultural water is more than 60% of the total economic water consumption in the Weihe River in Shaanxi Province based on the period of 1997 to 2013 [6]. However, due to the influences of human activity and climate warming, water source availability has become a major limitation for regional sustainability during the last decades [2]. The Weihe River runoff is mainly dominated by precipitation which is strongly affected by the variations of the East Asian summer monsoon. The fluctuation of runoff is consistent with variability in precipitation during dry and wet seasons on the annual scale. Therefore, 415 reservoirs have been built in the middle and down reaches of the Weihe River to effectively utilize water resources, with a total storage capacity of 2.202 × 10⁹ m3 [7]. There are 274 irrigation divisions, including the areas of facilities irrigation and water-saving irrigation which are 11.32 × 10⁹ m2 and 71.95 × 10⁹ m2, respectively [7]. In addition, previous study shows that the synergistic effect of decreasing precipitation, increasing temperature, and increasing evaporation in the Weihe River basin during the past decades has a negative influence on the runoff variations [8]. Therefore, human activities and climatic conditions mentioned above have significantly changed the characteristics of runoff in the Weihe River.
Enhancing the understanding of regional hydroclimatical change mechanisms and runoff evolution characteristics is an urgent requirement for assessing current water resources security and future planning. However, relative shorter hydrological observations limit us in identifying hydrological variability during long historical periods. Tree-rings have proved to be one of the effective proxies for hydroclimatical changes study prior to the measured period, due to its wide spatial distribution, high resolution with an exact calendar, and sensitivity to hydroclimate [9].
Several hydroclimatical studies based on tree rings have been performed in the Weihe River basin, including seasonal precipitation reconstructions for the Huashan Mountain in the down reaches [10,11] and Tianshui in the upper reaches of the river [3], as well as the drought variability estimation for the Guiqing Mountain in Gansu province [12].
However, runoff or streamflow tree-ring reconstructions conducted in the Weihe River have not been reported. In this research, the variations of streamflow in the middle reaches were studied using tree-ring samples of Chinese pine collected from the Nanwutai area (NWT), northern slope of the Qinling Mountains. The relationships between the radial growth of pines, streamflow, and climatic factors are discussed. The driving mechanisms of hydroclimatical variability in the Weihe River basin need to be explored in the context of climatic circulation systems on the regional or global scale. Spatial correlation patterns between streamflow and sea surface temperature anomalies in key ocean areas is an effective method to establish remote linkages. Knowledge of atmospheric–ocean–land teleconnections could be of benefit in the assessment and prediction of hydrological and climate change over the Weihe River basin. Therefore, the features of the extreme streamflow event and teleconnection with remote climate forcing were also analyzed.
Our results provide the first hydrological reconstruction inferred from tree rings for the Weihe River, which will be valuable for water resources management and planning in the future.

2. Materials and Methods
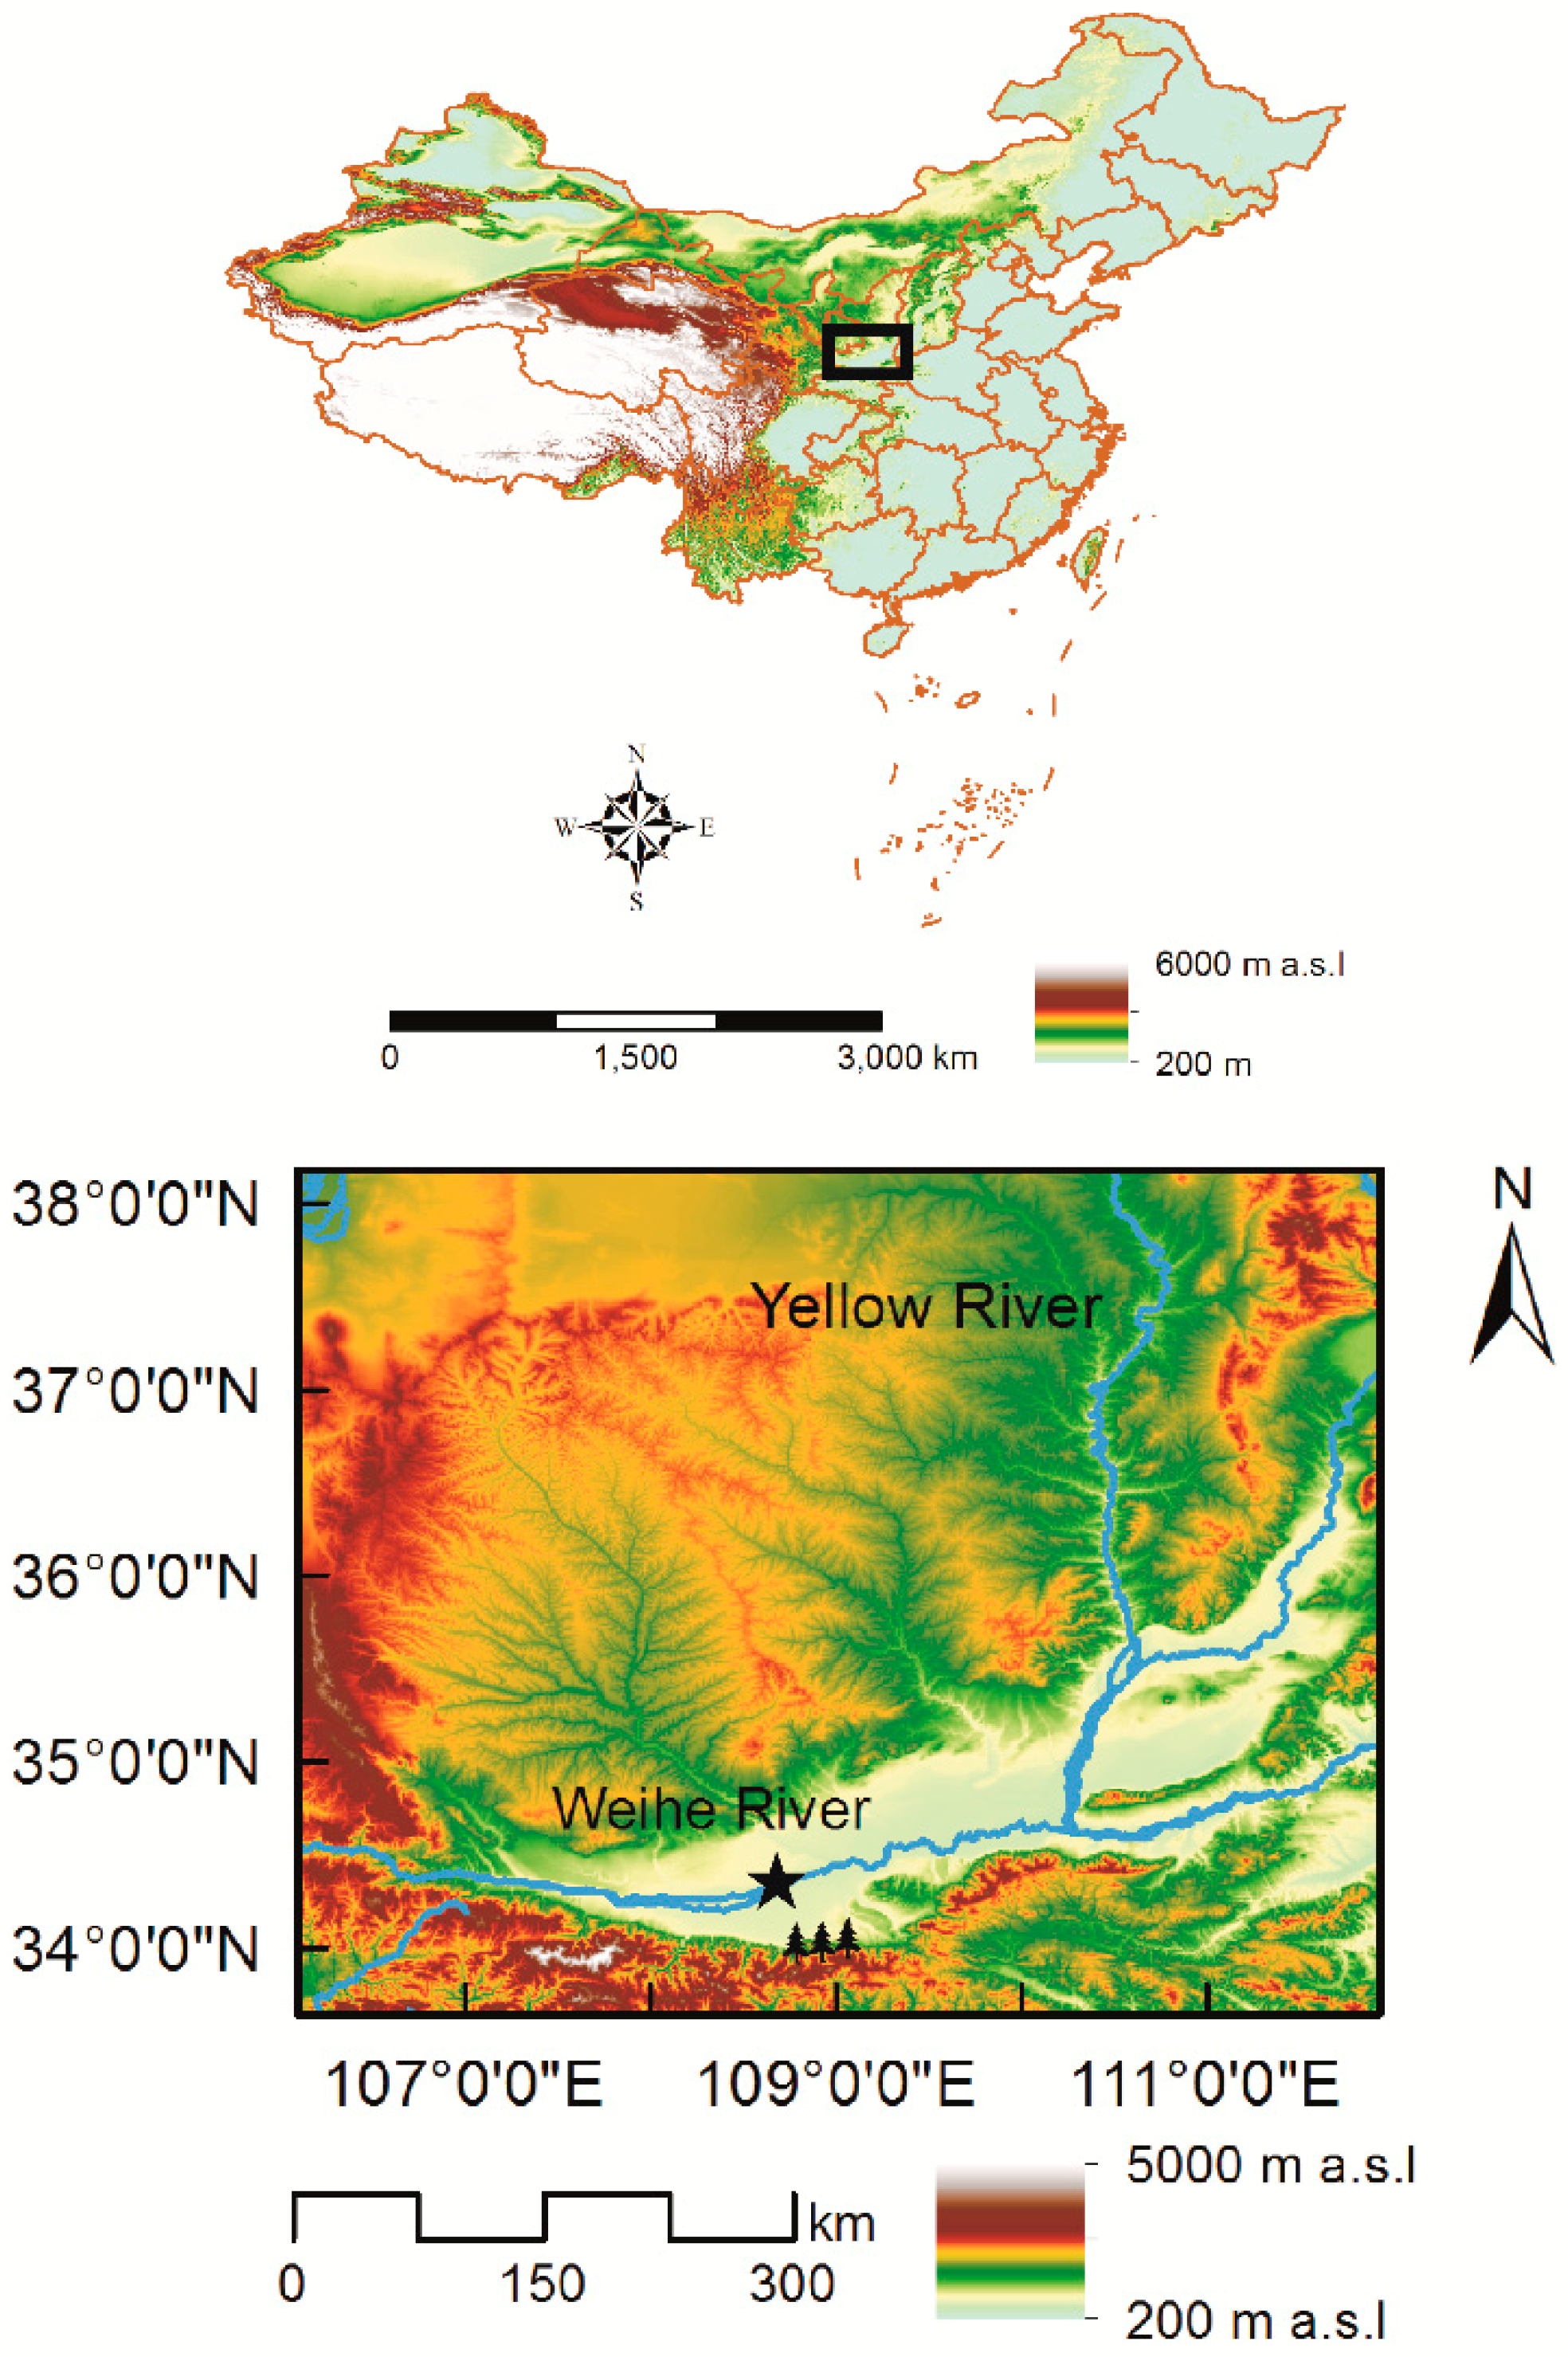
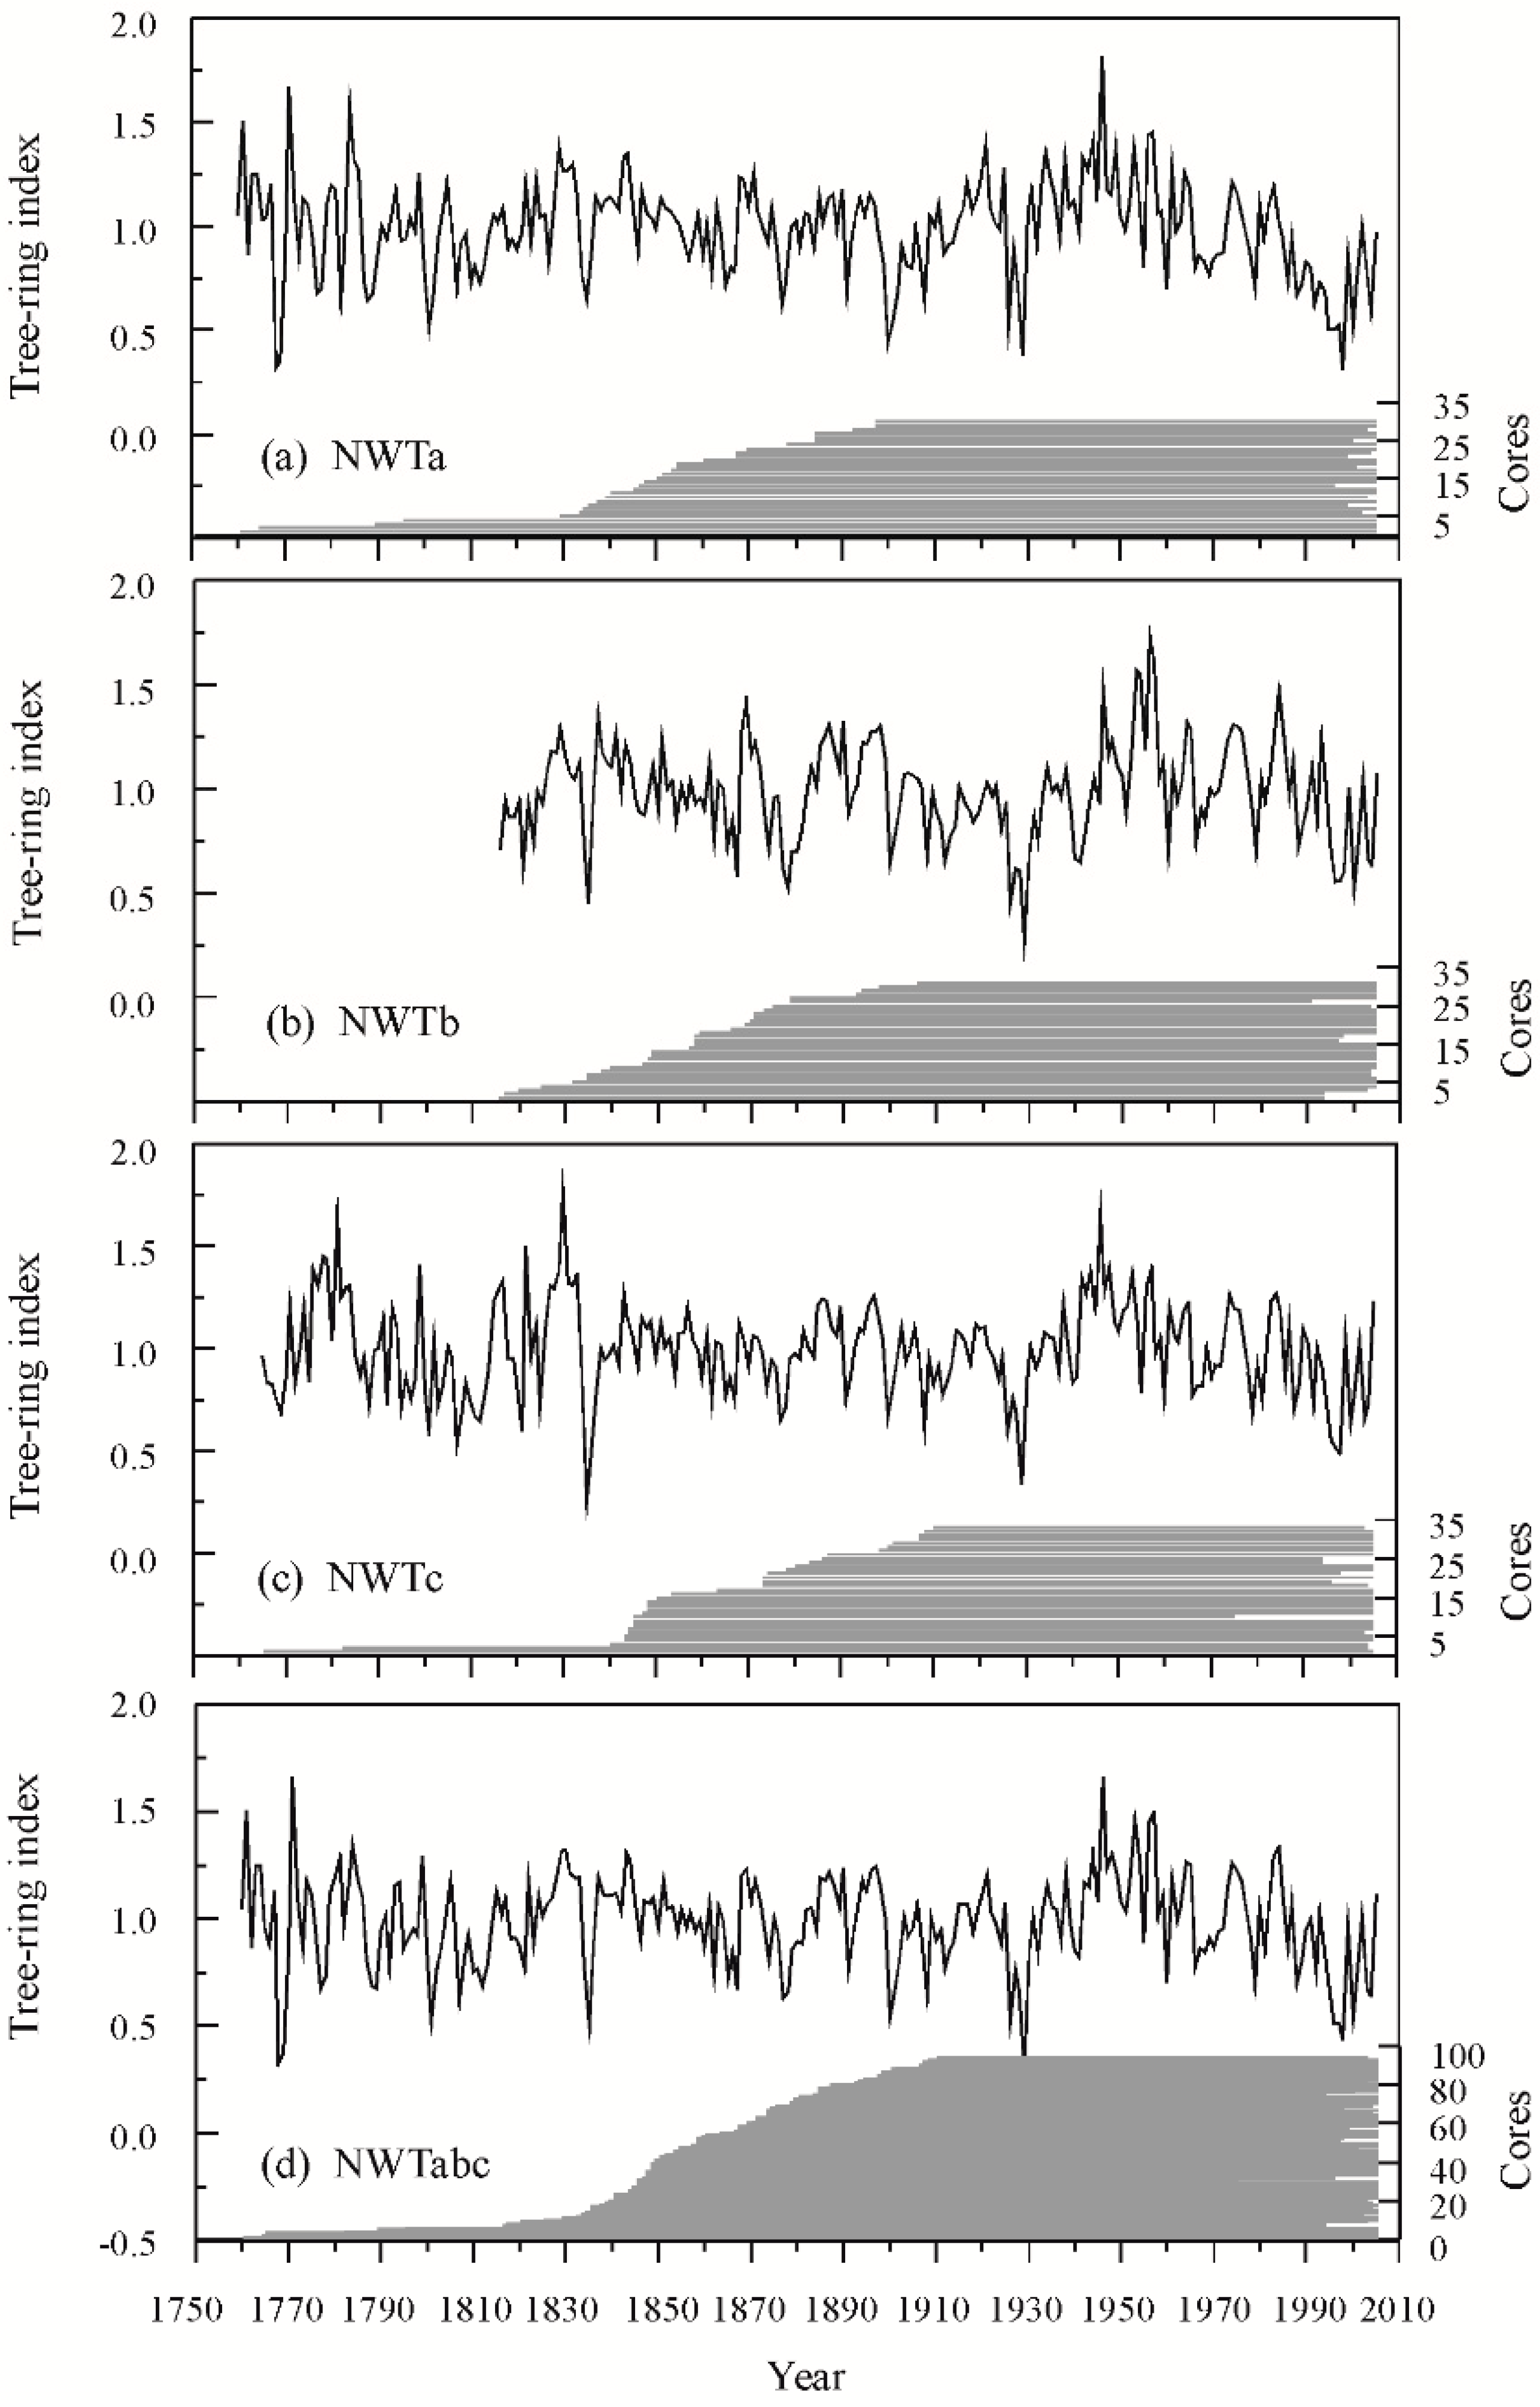
2.1. Tree-ring Data

Increment cores from Chinese pine (Pinus tabulaeformis) were collected at the Nanwutai area (NWT) (33°58′–34°02′ N, 108°57′–108°59′ E, elevation 1500 m–1600 m), northern slope of the Qinling Mountains [13]. To reveal the representativeness of the tree growth–climate response, we collected the cores at three sampling sites where old trees concentrated. A total of 94 samples were from three groups, i.e., NWTa, NWTb, NWTc, 30 cores/17trees, 31 cores/18trees, and 33 cores/18trees, respectively (Figure 1). All the samples were treated following the standard dendrochronological procedures [14]. The ring-width was measured using the Lintab system with a precision of 0.01 mm (www.rinntech.de), then each tree-ring series were given an accurate calendar year after cross-dating process performed by the output of COFECHA software [15]. Then each dated ring-width series was detrended and standardized to tree-ring width indices utilizing the ARSTAN software [16]. Negative exponential or linear regressions were applied to remove the age-related growth trends for 91 cores, and 3 cores from two trees were treated by cubic smoothing splines. Standard tree-ring width chronologies were established for NWTa, NWTb, NWTc and the variation and the sample depth are shown in Figure 2. Similar variability features were displayed by three groups, and significant correlation coefficients existed between three chronologies, i.e., 0.657 (p < 0.001, 1816–2005 for NWTa and NWTb), 0.666 (p < 0.001, 1765–2005 for NWTa and NWTc) and 0.724 (p < 0.001, 1816–2005 for NWTb and NWTc). Therefore, the regional standard chronology NWTabc were built based on 94 cores from 53 trees for the study area (Figure 2). The full length of NWTabc covered the period of 1760 to 2005AD. The mean sensitivity and all series correlation were 0.193 and 0.448, respectively. Statistical characteristics of the common span from 1880 to 2005 as follows, expressed population signal (EPS) was 0.948, signal-to-noise ratio (SNR) was 18.146, and variance in the first eigenvector was 30.6%. To make sure the reliability of the reconstruction, subsample signal strength (SSS) was used to identify the adequacy of replication of NWTabc chronology [17]. We restricted the further analysis to the period from 1820 to 2005 with the SSS value greater than 0.80, and the first year included 9 cores from 5 trees.

2.2. Climatic and Hydrological Data

Regional monthly average temperature and precipitation from CRU (Climate Reach Unit) TS4.01 grid data within the range of 34°–35°N and 107°–109°E [18], and monthly streamflow data of the Xianyang hydrological station in the middle reaches of the Weihe River (108°42′ E, 34°19′ N, with a catchment area 46,827 km2) provided by Hydrology Bureau of the Yellow River Conservancy Commission were selected to explore the response relationships between trees’ radial growth and climatic hydrological elements (Figure 1). The calculation results showed that the study area was cold and dry in winter while hot and wet in summer, indicating East Asian monsoon climate characteristics (Figure 3). The average annual precipitation in the region was 642.59 mm, the maximum precipitation 121.97 mm occurred in July, and the minimum amount of precipitation in January was 4.25 mm over the period 1940 to 2005. The annual average temperature was 11.63 °C, the highest and lowest monthly average temperatures appeared in July (23.95 °C) and January (−1.38 °C), respectively. Many water conservancy projects have been developed since the 1970s in the upper reaches of the Weihe River, and natural runoff changes have been significantly affected by human activities [2,19]. Therefore, monthly streamflow during the period from 1940 to 1970 was selected for subsequent analysis. The high-value period of the streamflow appeared from July to September during the monsoon rain season (Figure 3). The maximum flow occurred in September, but not in July, indicated that there was a lag effect in the river basin convergence process. It should be pointed out that the streamflow in June was the smallest one during the growing period from May to October. The main possible reason could be due to more evaporation loss relating to higher temperatures in June, resulting in less runoff.

2.3. Statistical Methods

The relationships between climate/streamflow factors and tree-ring width index were performed using Pearson correlation analysis in this study [14]. Considering tree growth is affected by environmental conditions in the present growing season, as well as by factors in the previous year [14], previous October to current September data were selected for growth response analysis. The linear regression model and split calibration–verification were employed to identify the reliability of streamflow reconstruction [16]. Verification statistics of reduction of error (RE), coefficient of efficiency (CE), and the sign test (ST) were given [16]. Positive values of RE and CE suggested the regression model was valid and skillful for reconstruction. The ST demonstrated the numbers of agreements and disagreements between the estimated and measured streamflow data [14]. All the statistical results were performed using the software of Statistical Program for Social Sciences 19. Cycles of the dominant oscillation signals in streamflow series were done by spectral analysis of the multi-taper method (MTM) [20]. The MTM analysis could exactly reveal the signals of oscillation modes in reconstructed streamflow series based on a couple of tapers reducing the variance of spectral estimates. Parameters including red noise background estimation with the resolution of 2 and taper numbers of 3 were performed in this study [20]. To explore regional hydroclimatical variations and teleconnections reflected by current streamflow reconstruction, spatial correlations of our reconstructed streamflow with the gridded data including Standard precipitation evapotranspiration Index (SPEI) on the four-month scale [21], self-calibrating Palmer Drought Severity Index (scPDSI) [22] and sea surface temperature (SST) dataset of ERSST (Extended Reconstructed Sea Surface Temperature) v5 [23] were conducted for the period 1901 to 2005 through the online tool of KNMI (The Royal Netherlands Meteorological Institute) climate explorer (http://climexp.knmi.nl).

3. Results and Discussion

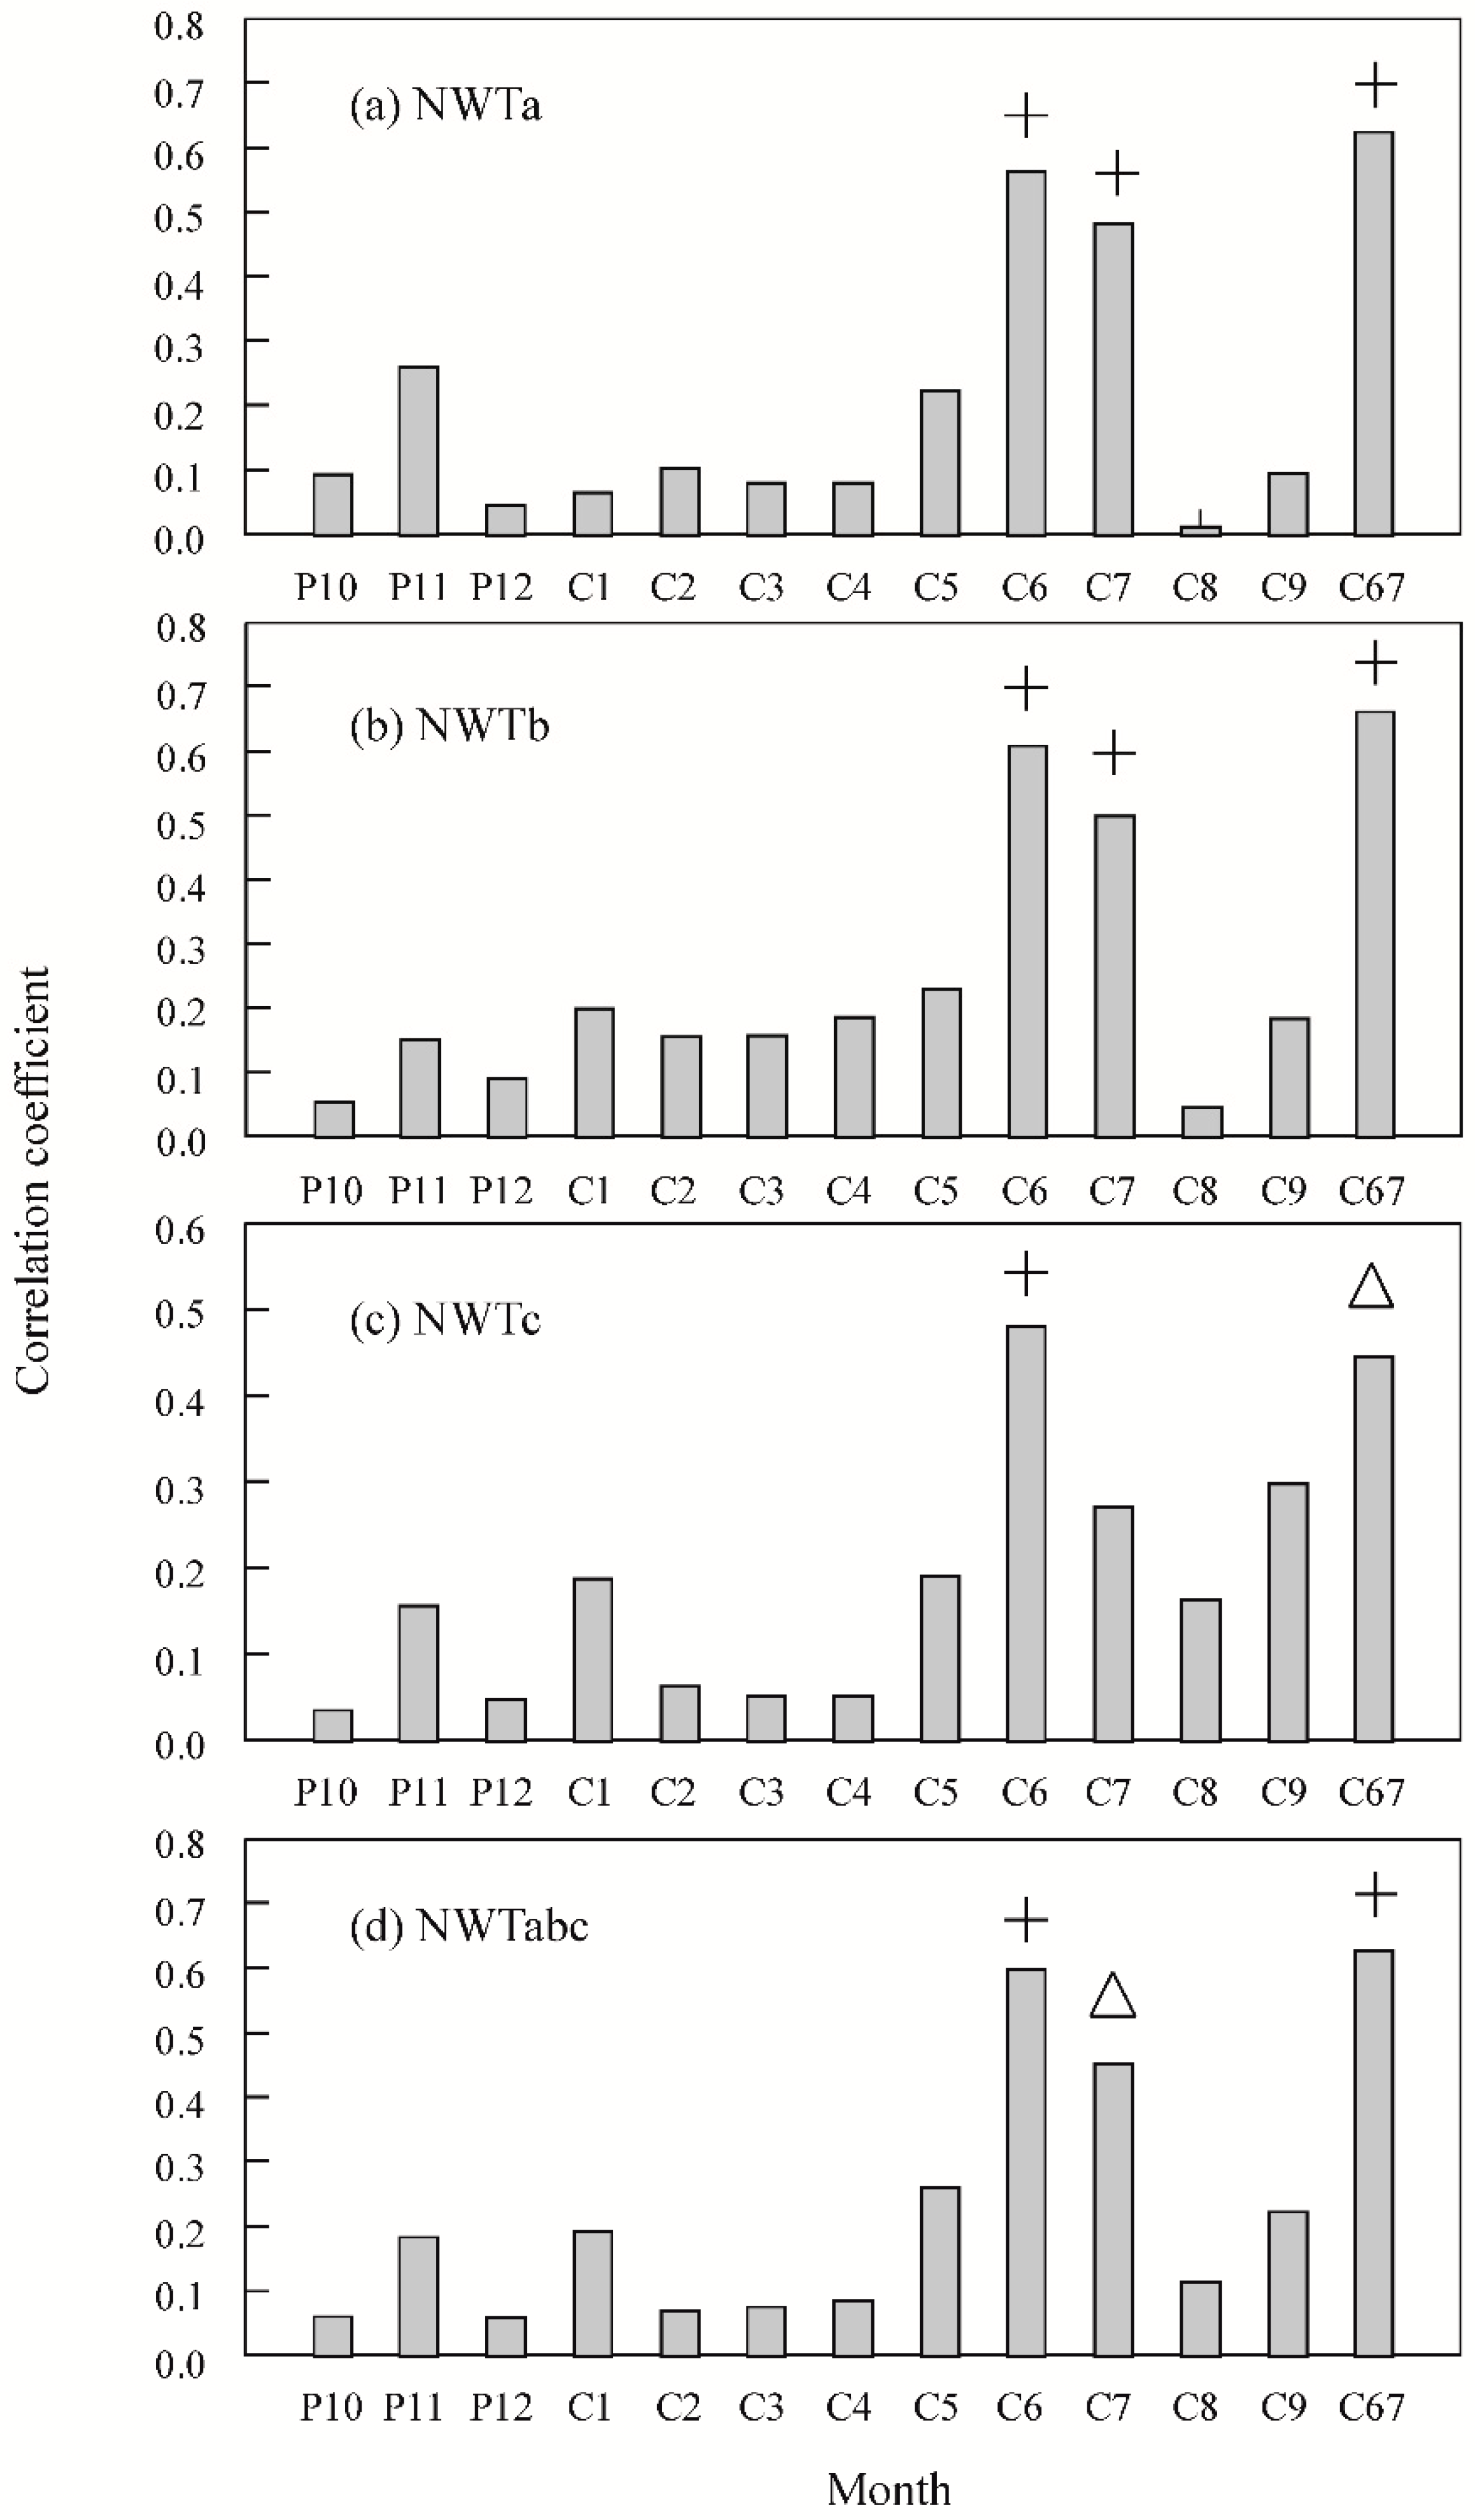
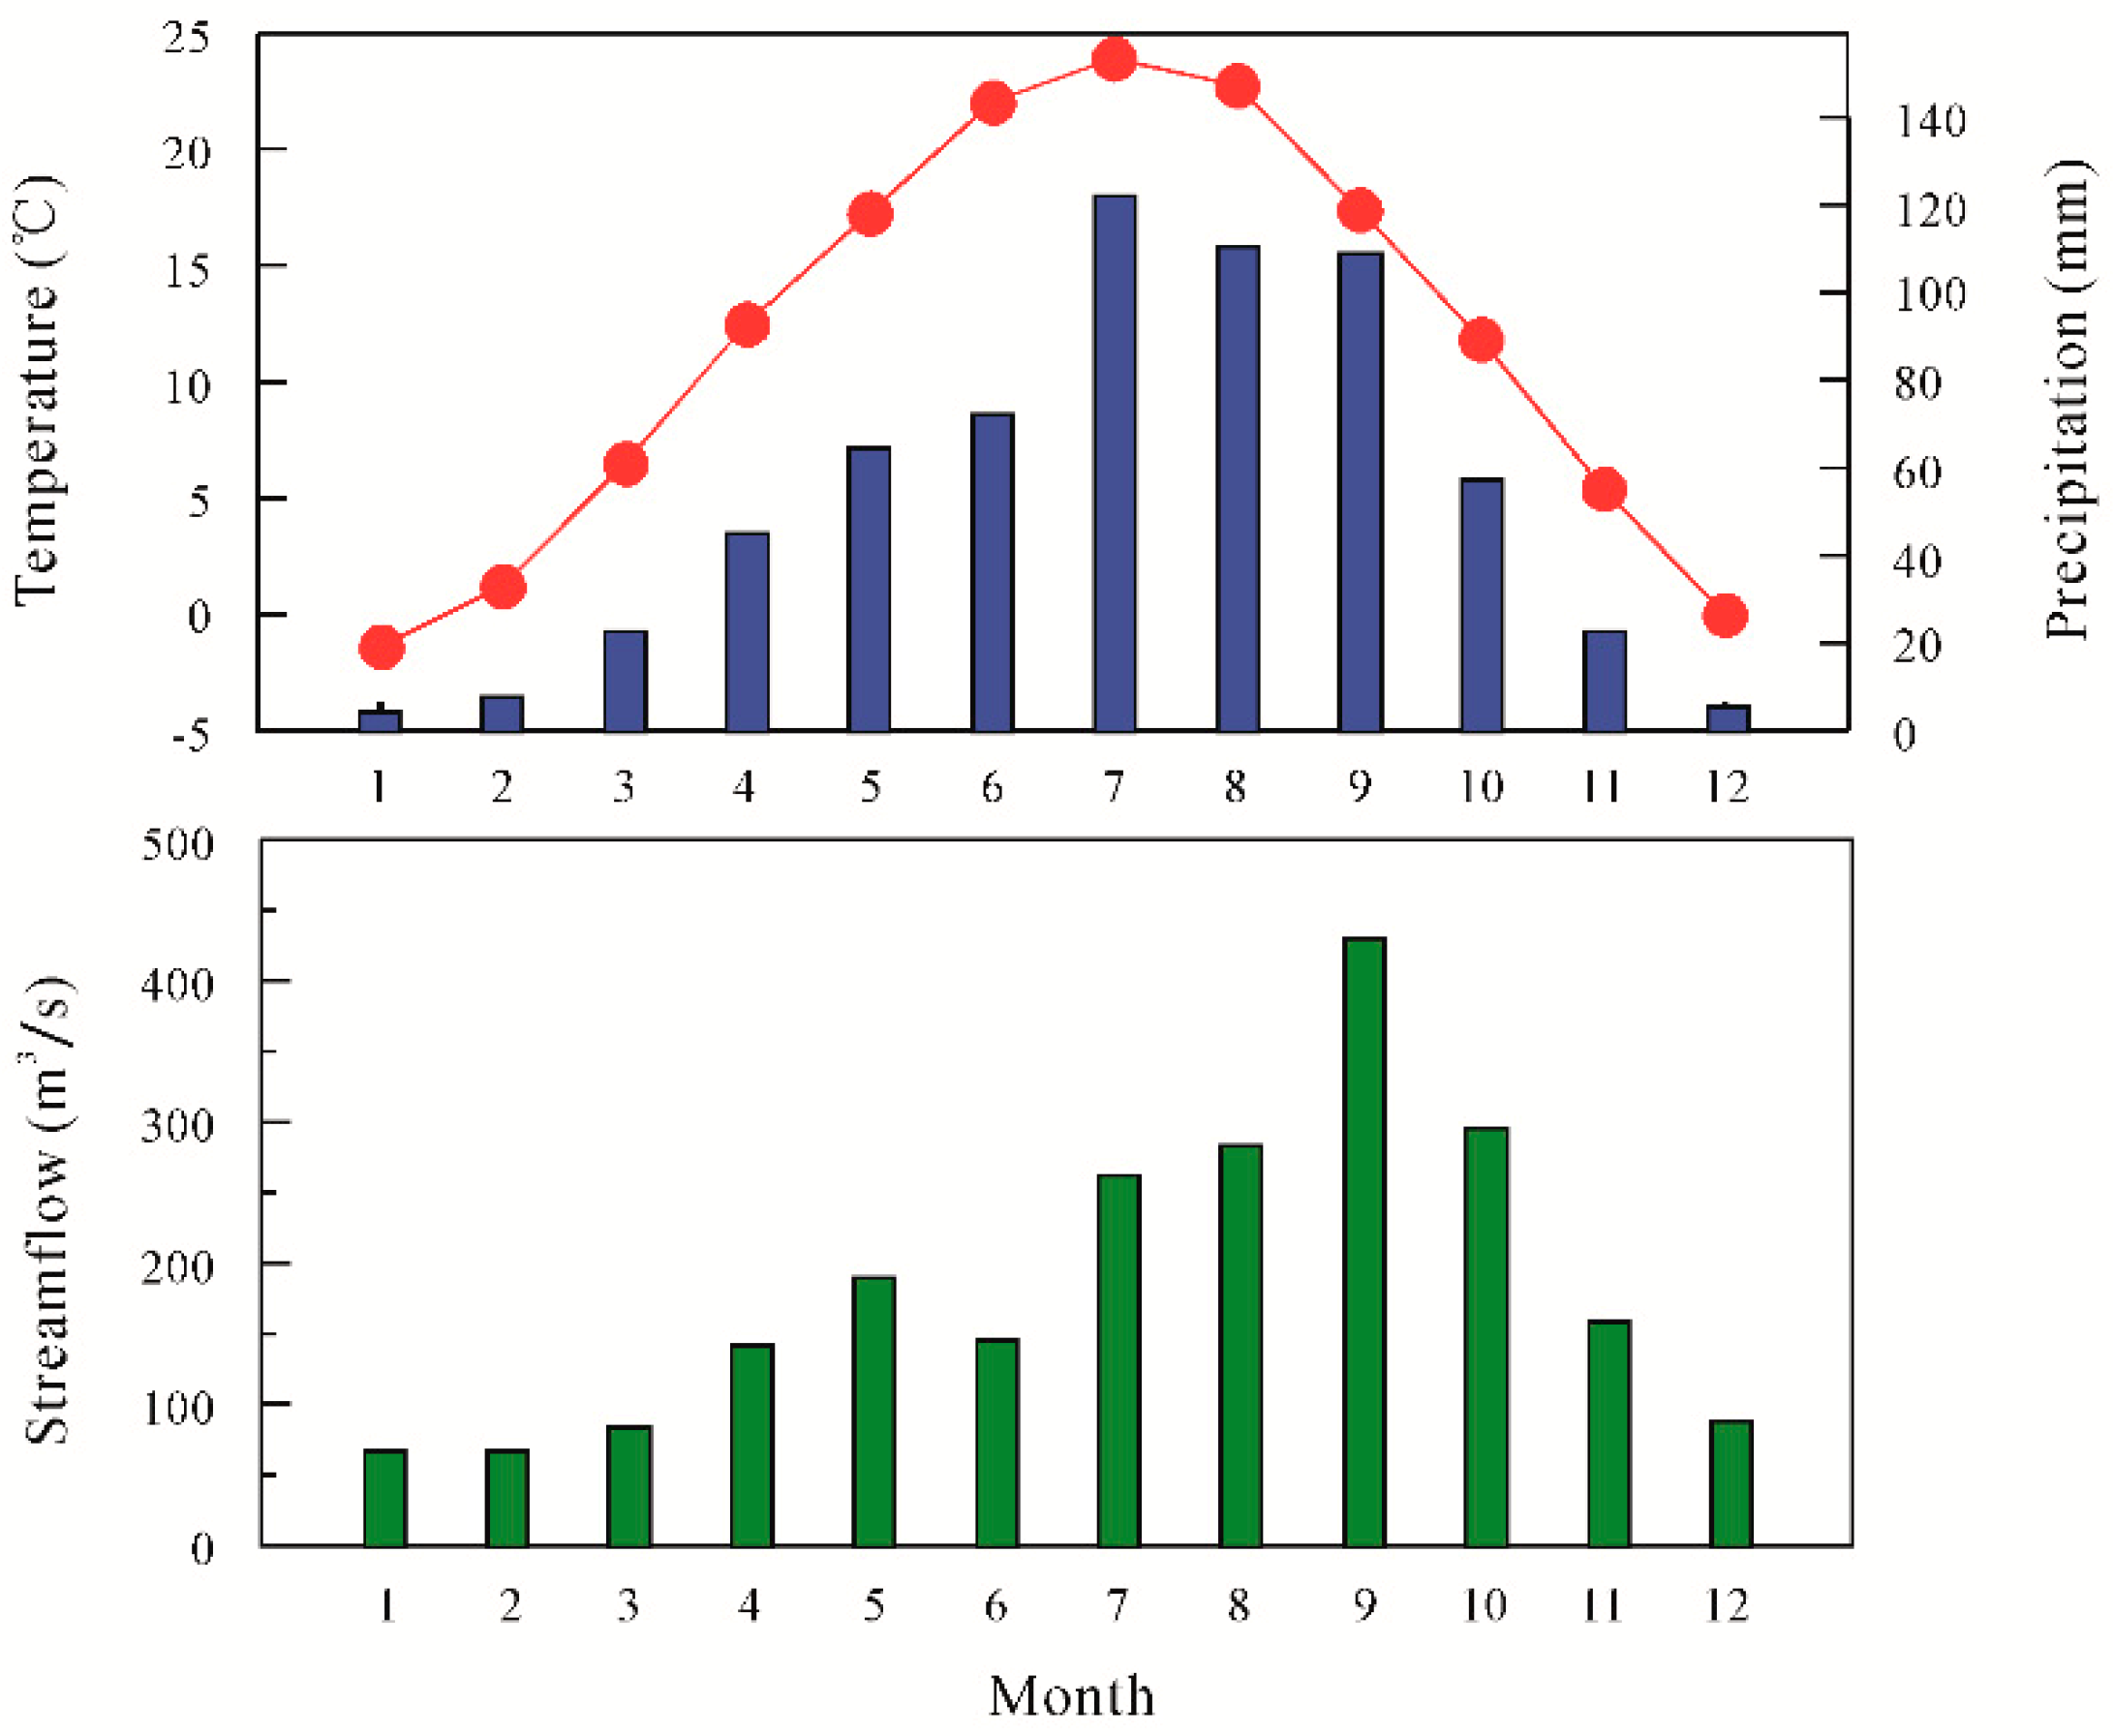
3.1. Climate/Streamflow-Growth Response

The responses of tree radial growth to climatic factors showed that the NWTabc chronology was significantly positively correlated with precipitation in June (r = 0.572, n = 31, 1940–1970, p < 0.01), significantly negatively correlated with temperature in June (r = −0.401, n = 31, 1940–1970, p < 0.05), and not correlated with precipitation and temperature in July, indicating that the growth of Pinus tabulaeformis was very sensitive to humidity conditions before the East Asian monsoon season started in July. Due to the river basin convergence process which mainly includes precipitation, surface infiltration, soil saturation, slope convergence, and river network convergence, a lag effect existed in the response of river runoff forming to precipitation. Therefore, the regional tree-ring chronology significantly correlated with the average June–July streamflow of the Weihe River, which inevitably reflected the hysteresis effect. Significant correlations occurred between June–July streamflow, June precipitation (r = 0.753, n = 31, p < 0.01) and June temperature (r = −0.568, n = 31, p < 0.05), while no responses existed in July precipitation and temperature. Runoff reflected the combined effects of climatic factors, such as temperature and precipitation, in the basin. Therefore, using the tree-ring chronology to reconstruct the average June–July streamflow of the Weihe River had a reliable physiological significance and physical basis (Figure 4).

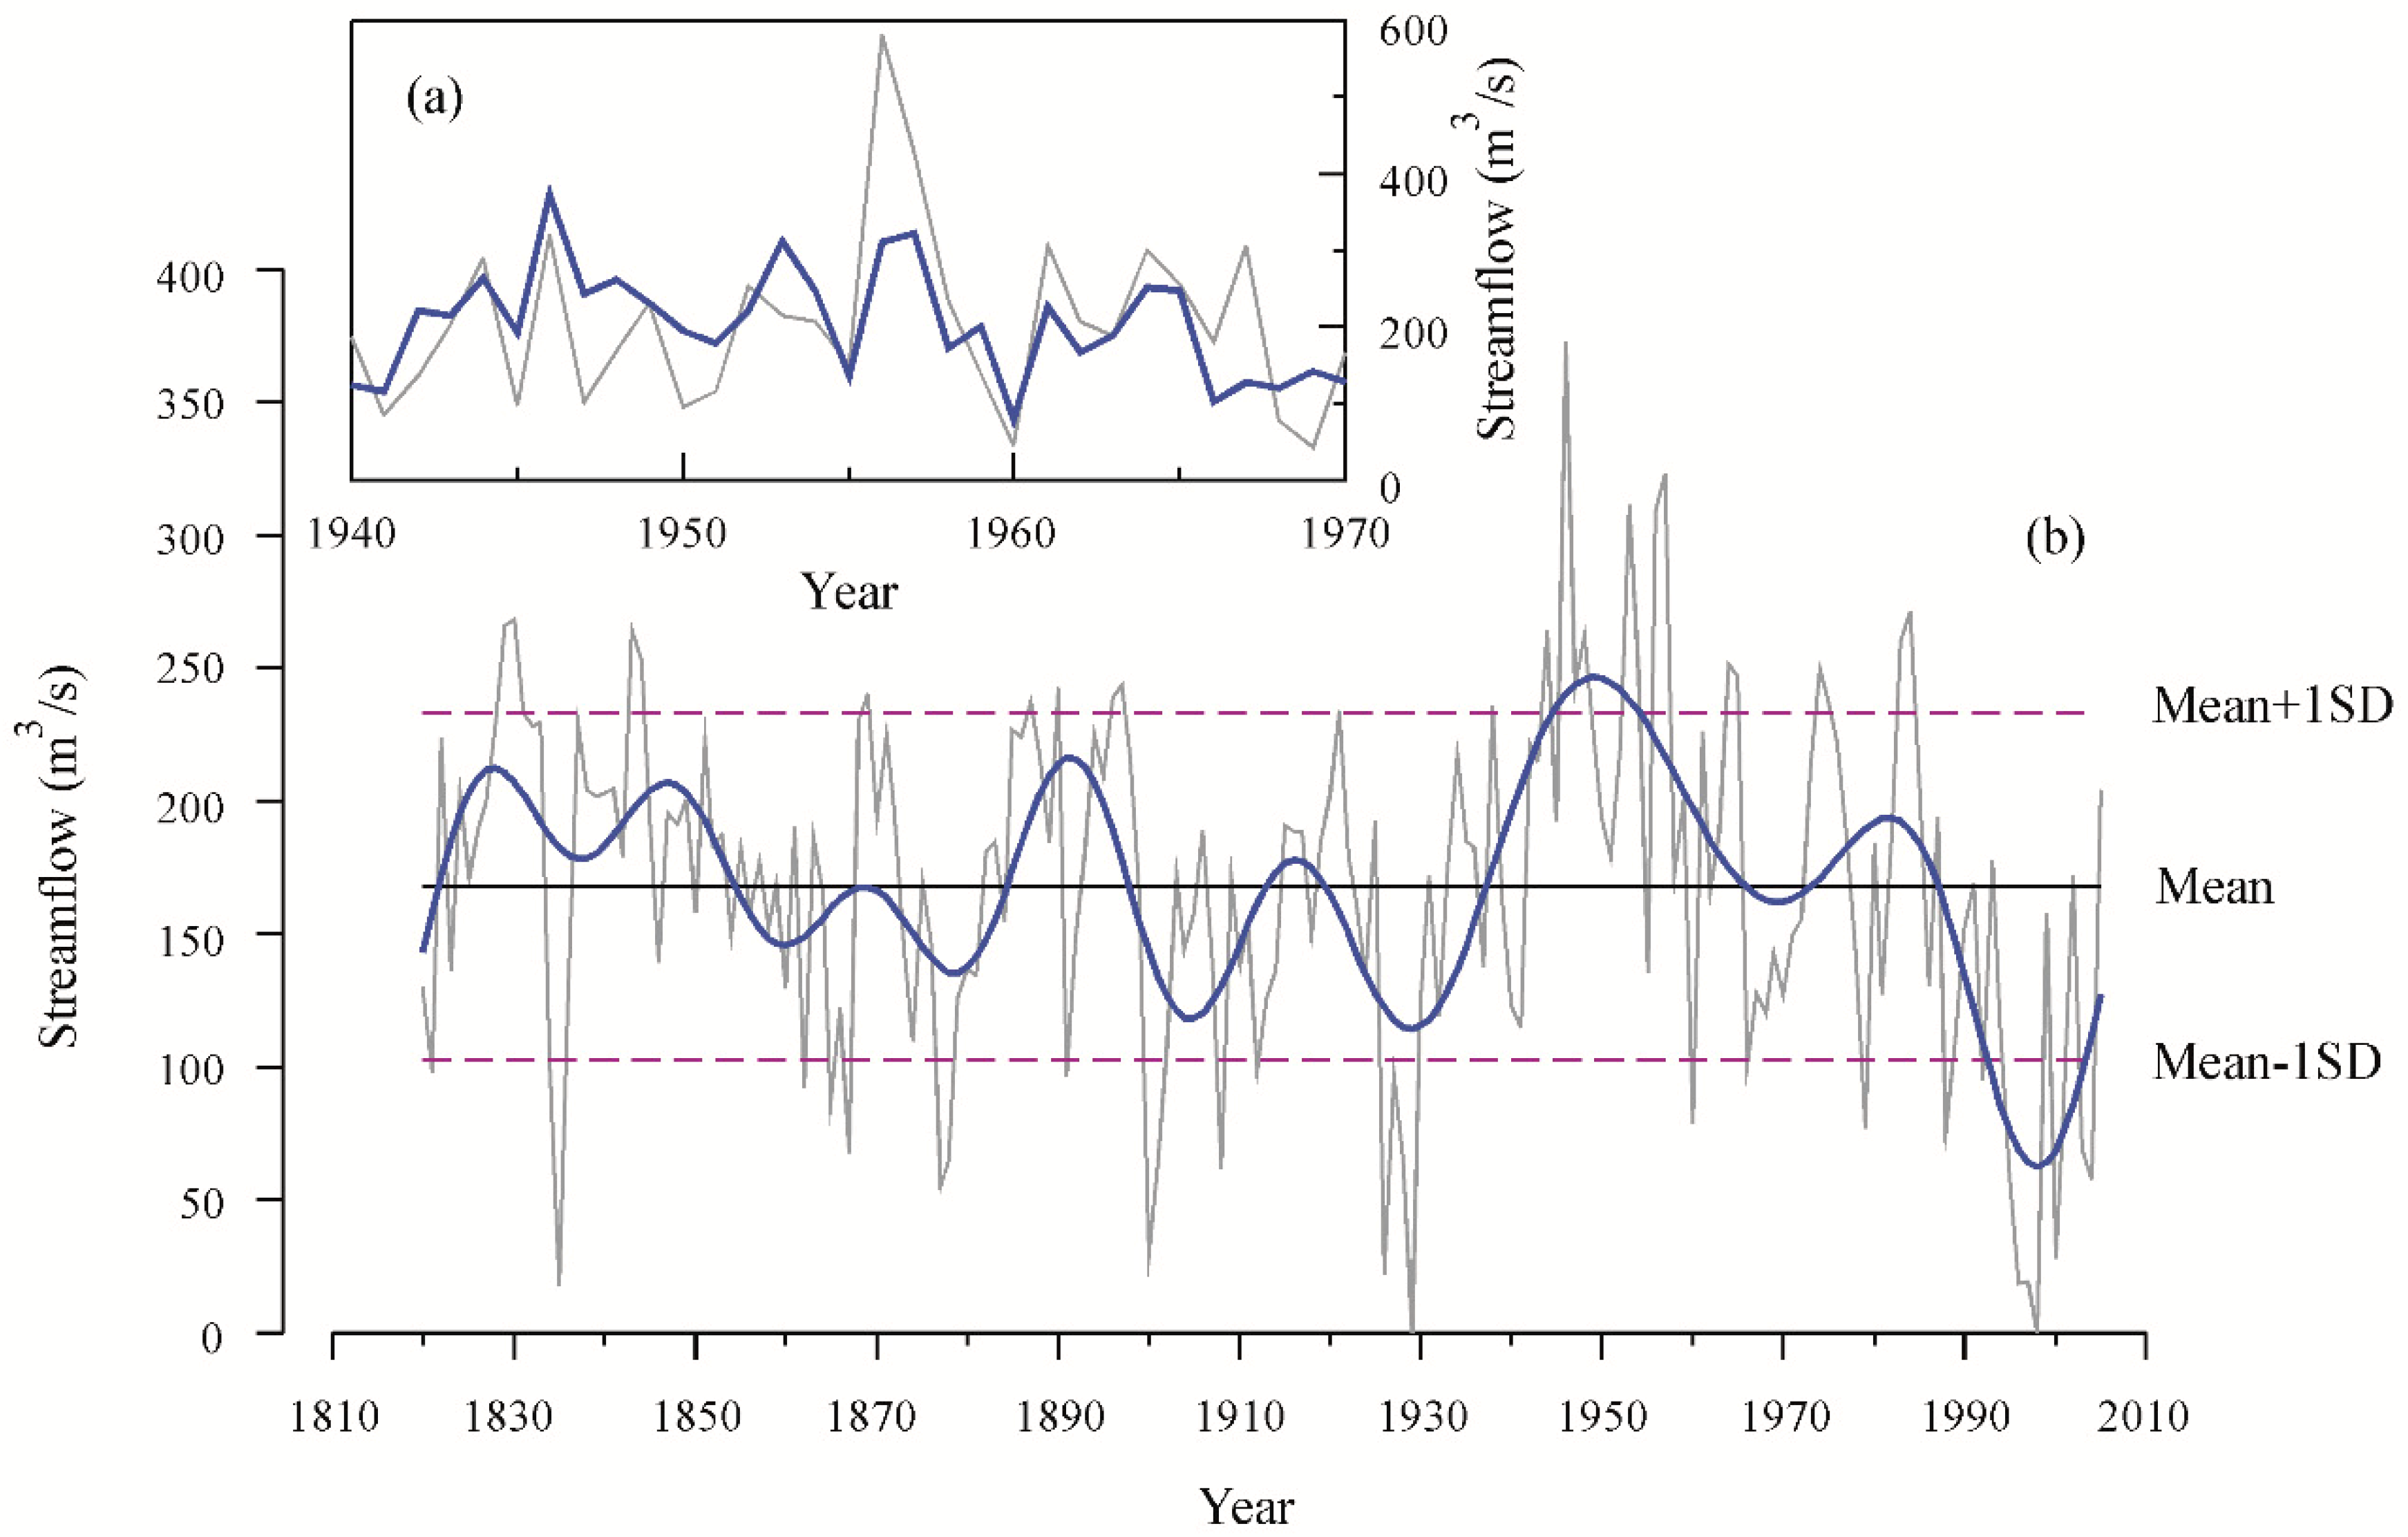
3.2. Streamflow Reconstruction

Based on the analyses results mentioned above, the average June–July streamflow was reconstructed following the transfer function: Qs = 309.208 × NWTabc − 140.02 (r = 0.627, n = 31, F = 18.779, p < 0.0001), where Qs means the average June–July streamflow in the Weihe River. The Durbin–Watson value 1.341 (p < 0.05) suggests no significant first-order autocorrelation in the residuals of the regression model [14]. This function could explain the variance of 39.3% over the observed streamflow period 1940 to 1970 (37.2% considering the loss of degrees of freedom). The variations between reconstructed and observed streamflow agree quite well (Figure 5).
The reconstructed sequence reveals hydrological variability during the last 196 years in the Weihe River. Reduction of error (RE) and Coefficient of efficiency (CE) were used to identify shared variance between observation and reconstruction series, and both statistics had a theoretical range from −∞ to +1. Positive RE and CE values demonstrated that the model was skillful and acceptable for streamflow reconstruction. Statistics results indicate that RE (0.191, 0.271) and CE (0.142, 0.243) were positive in both verification periods of 1960 to 1970 and 1940 to 1959, confirming our model is acceptable and skillful for streamflow reconstruction (Table 1). The ST was applied to check the numbers of agreement or disagreement signs between the paired observed and estimated departures from the series mean. The ST in the calibration spans 1940 to 1959 (15+/5−), and 1960 to 1970 (9+/1−) were at the 0.05 significant level, and, particularly, the ST result (24+/7−) in the full span 1940 to 1970 was at the 0.01 significant level.

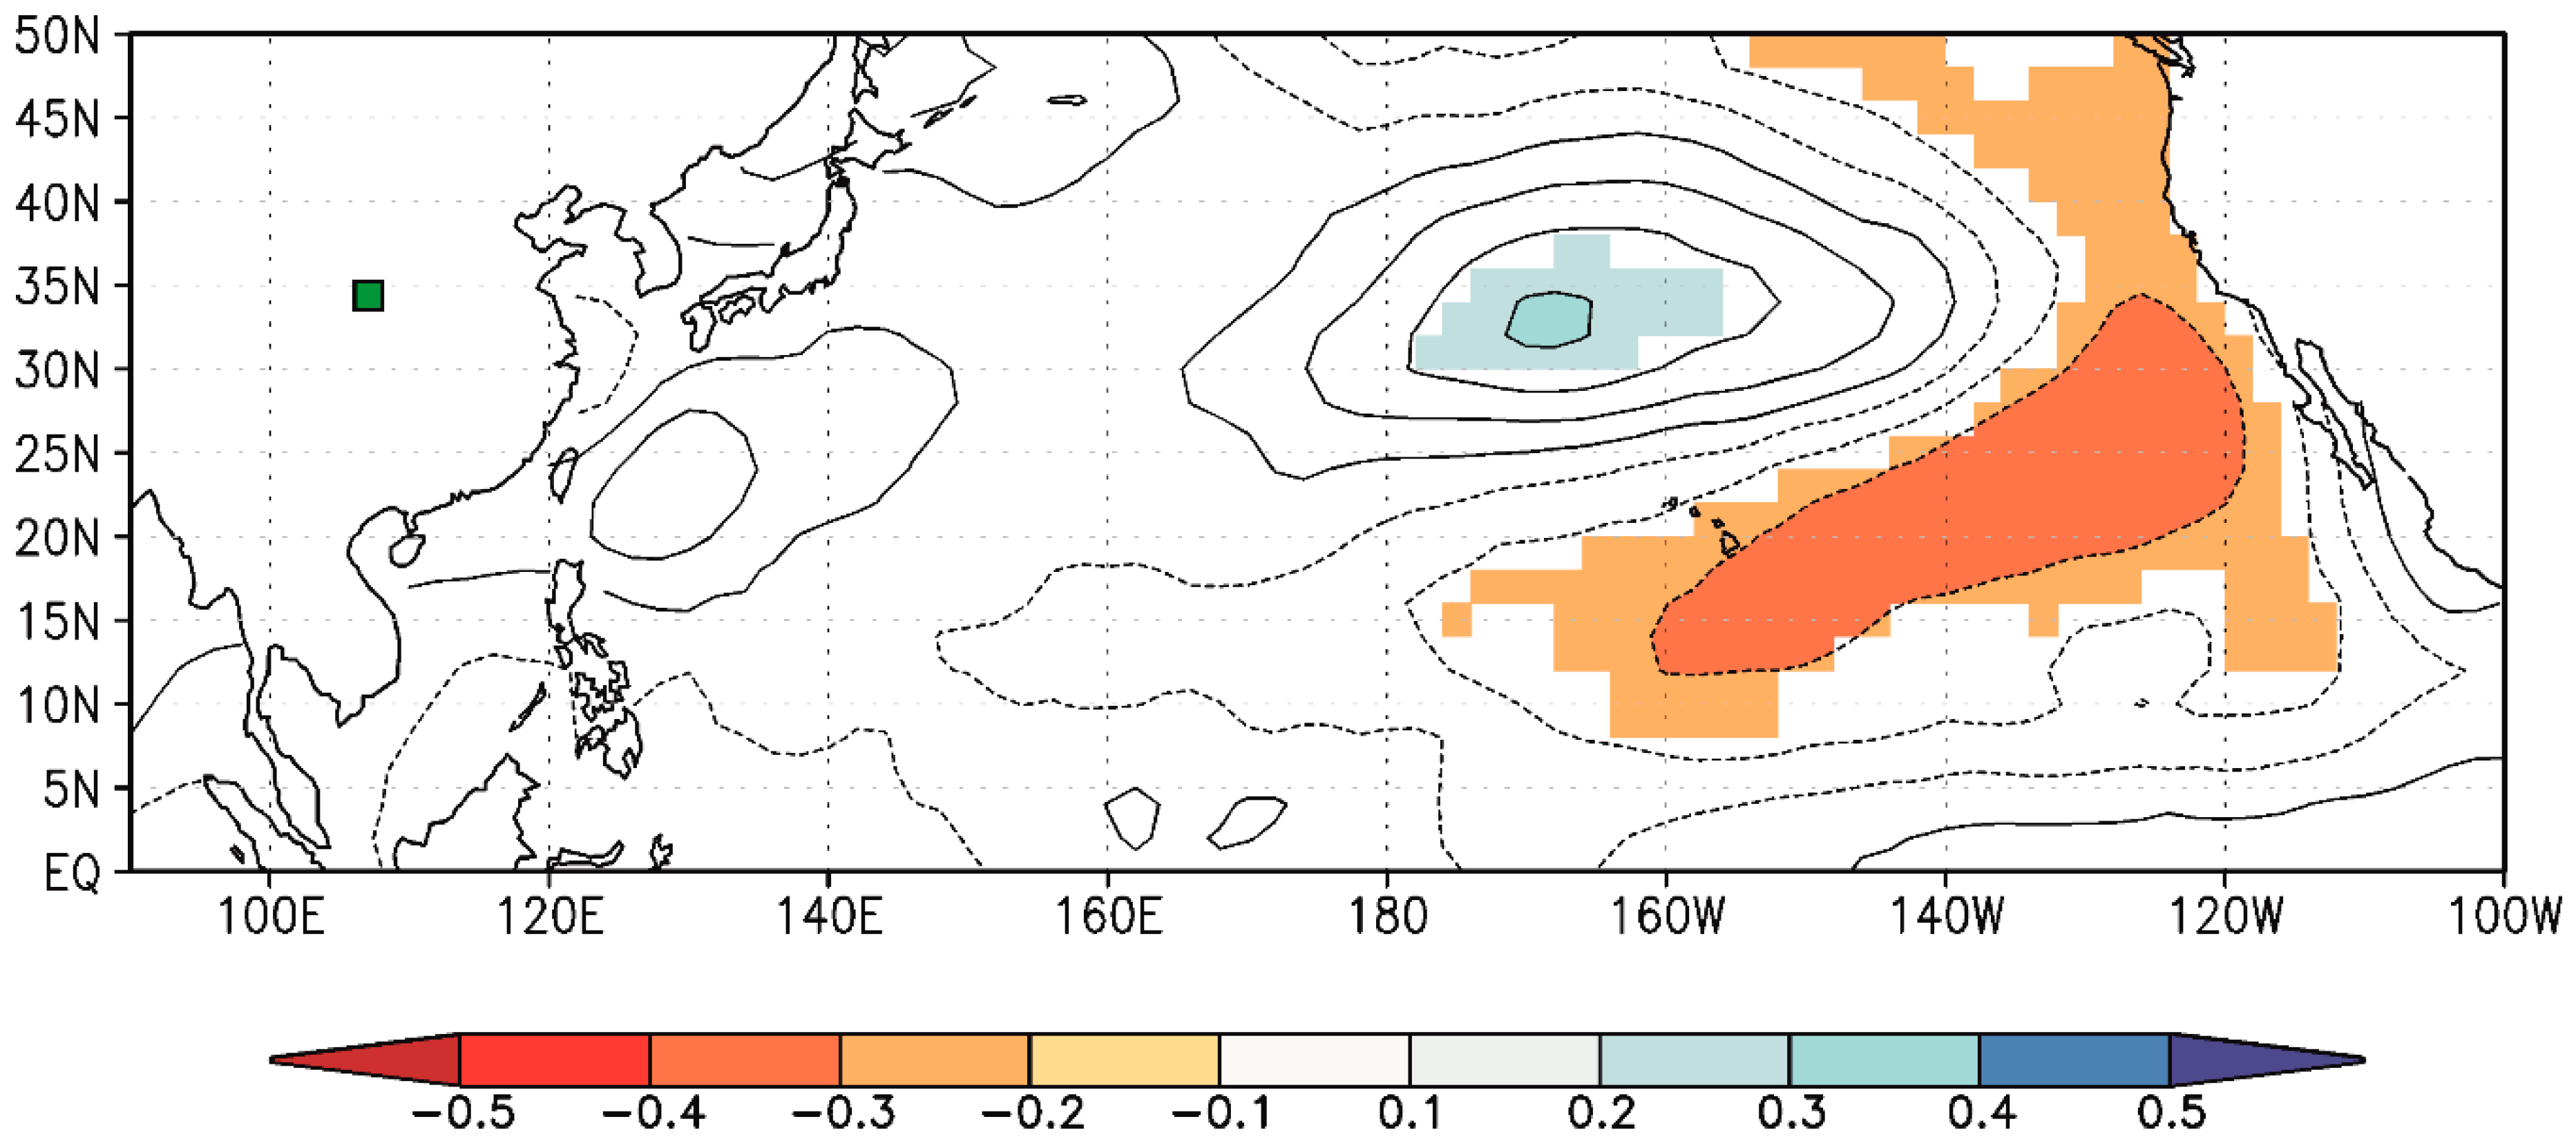
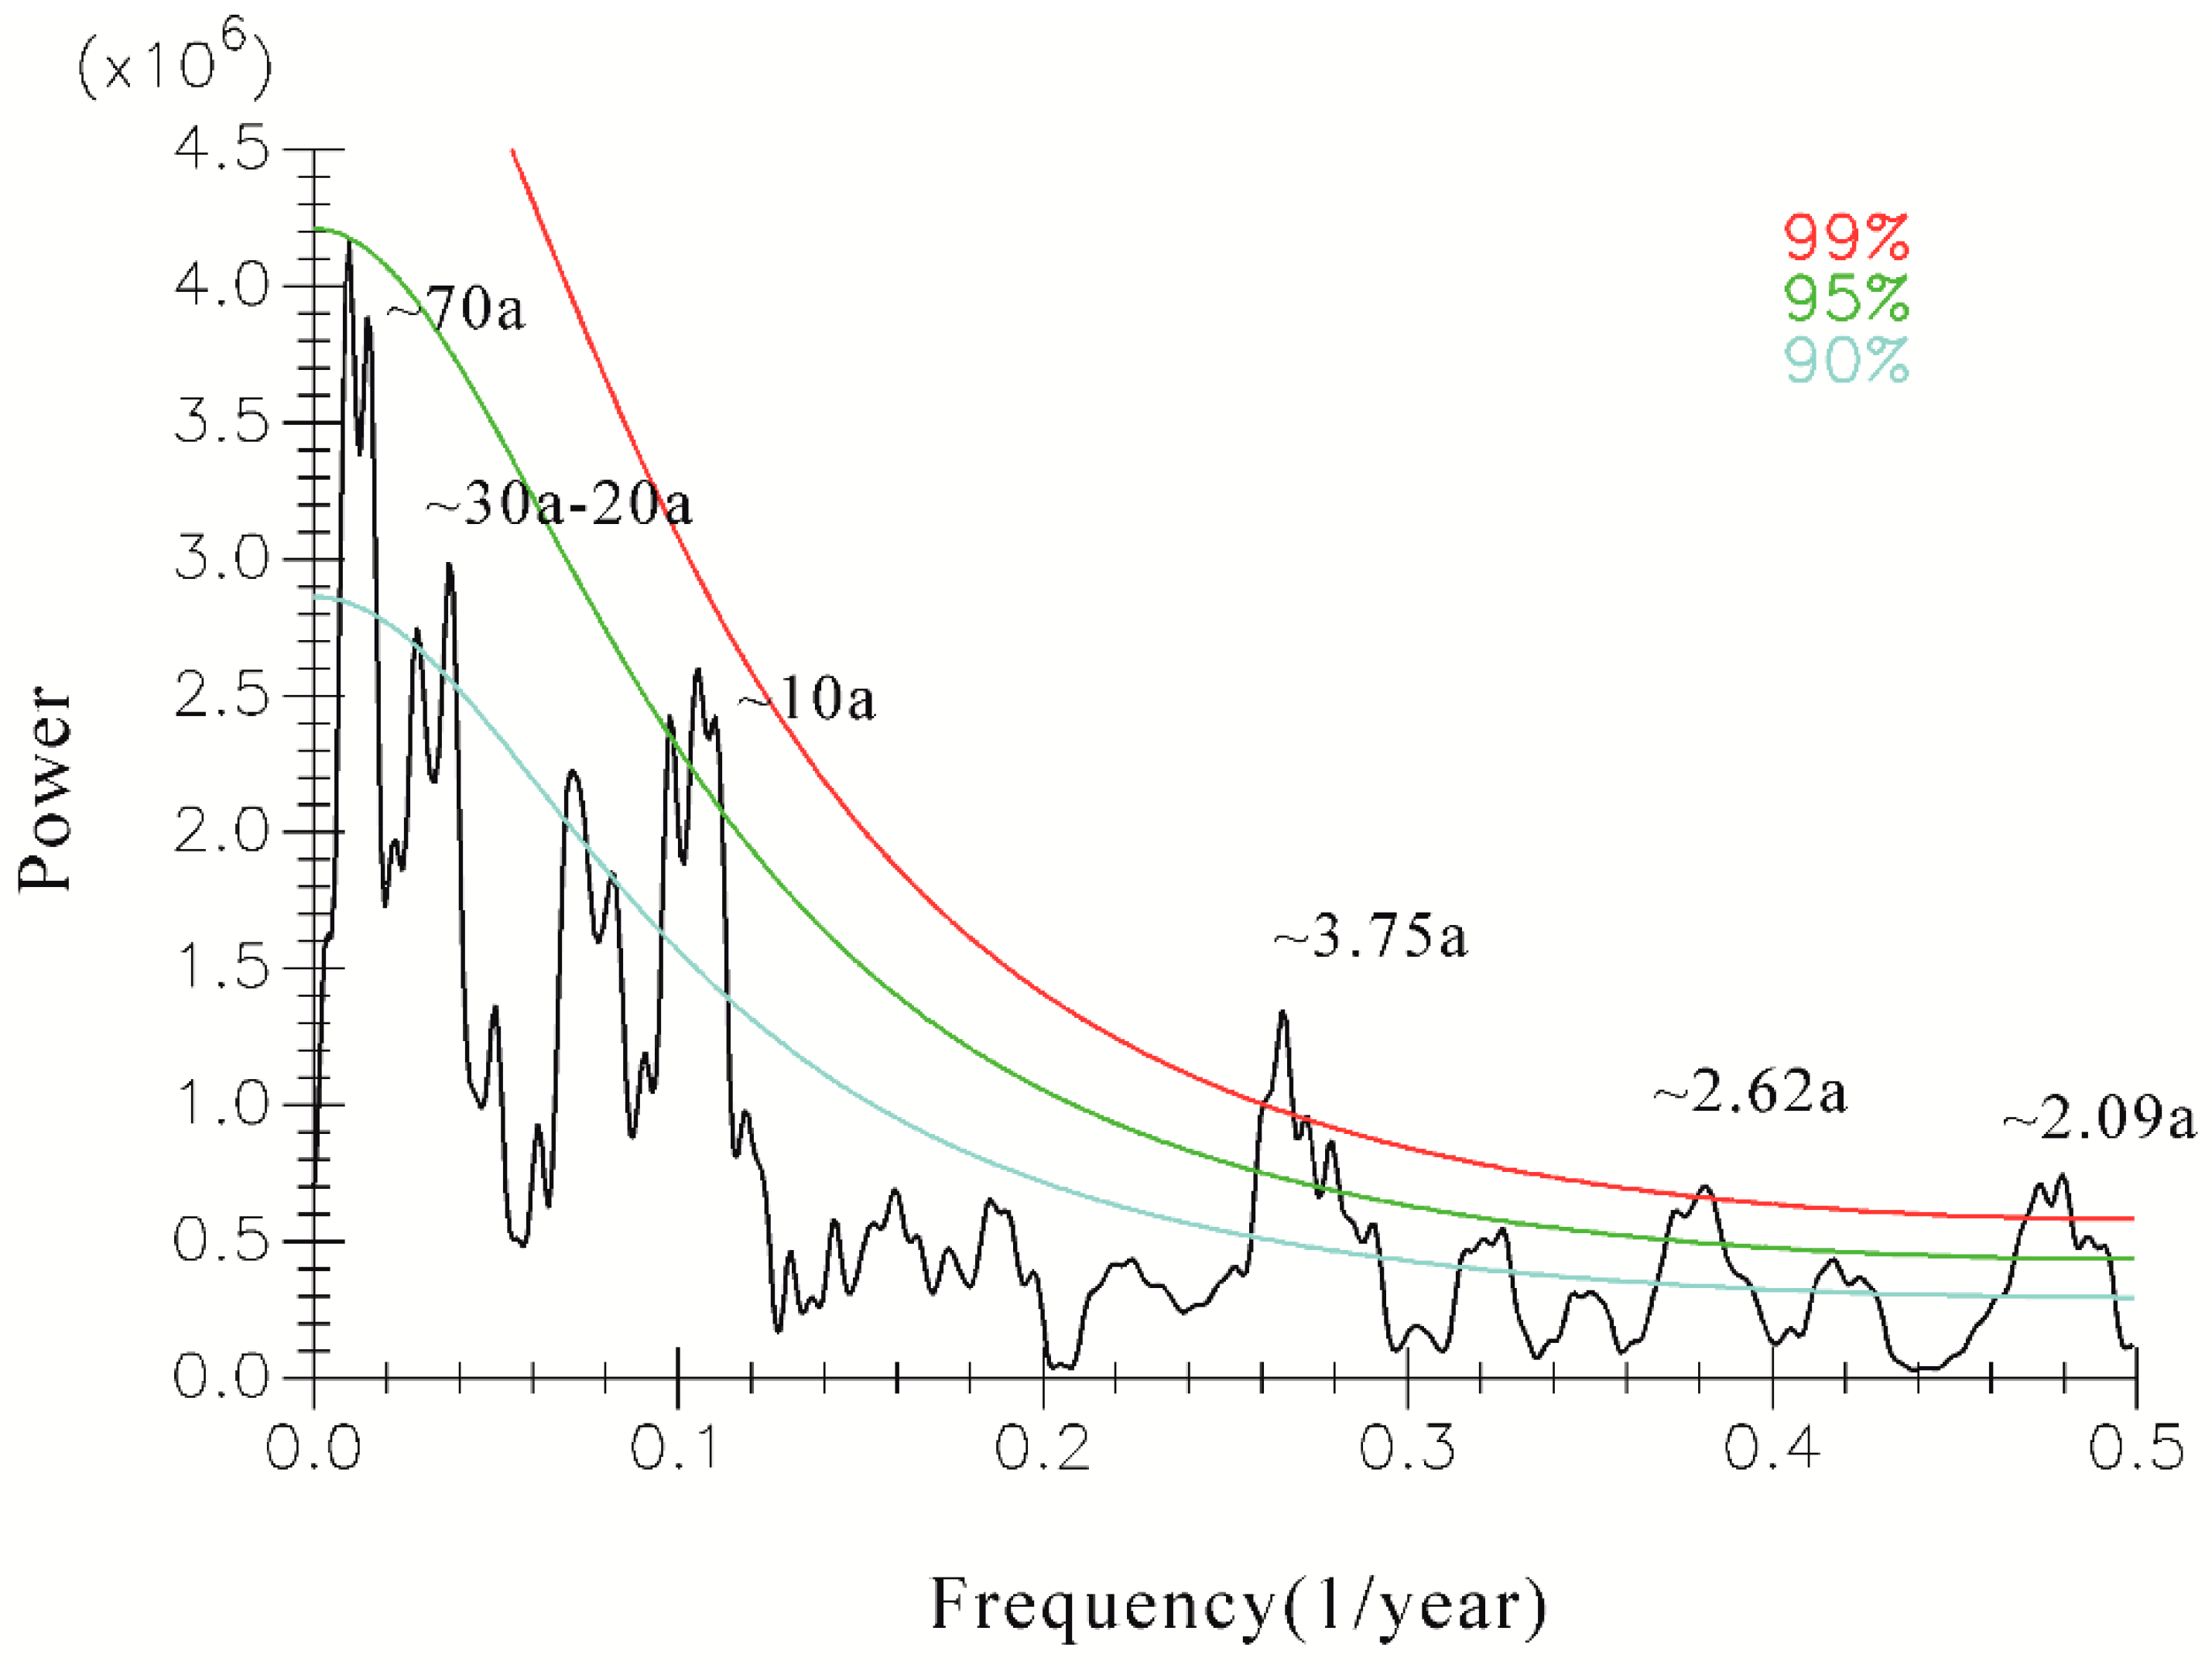
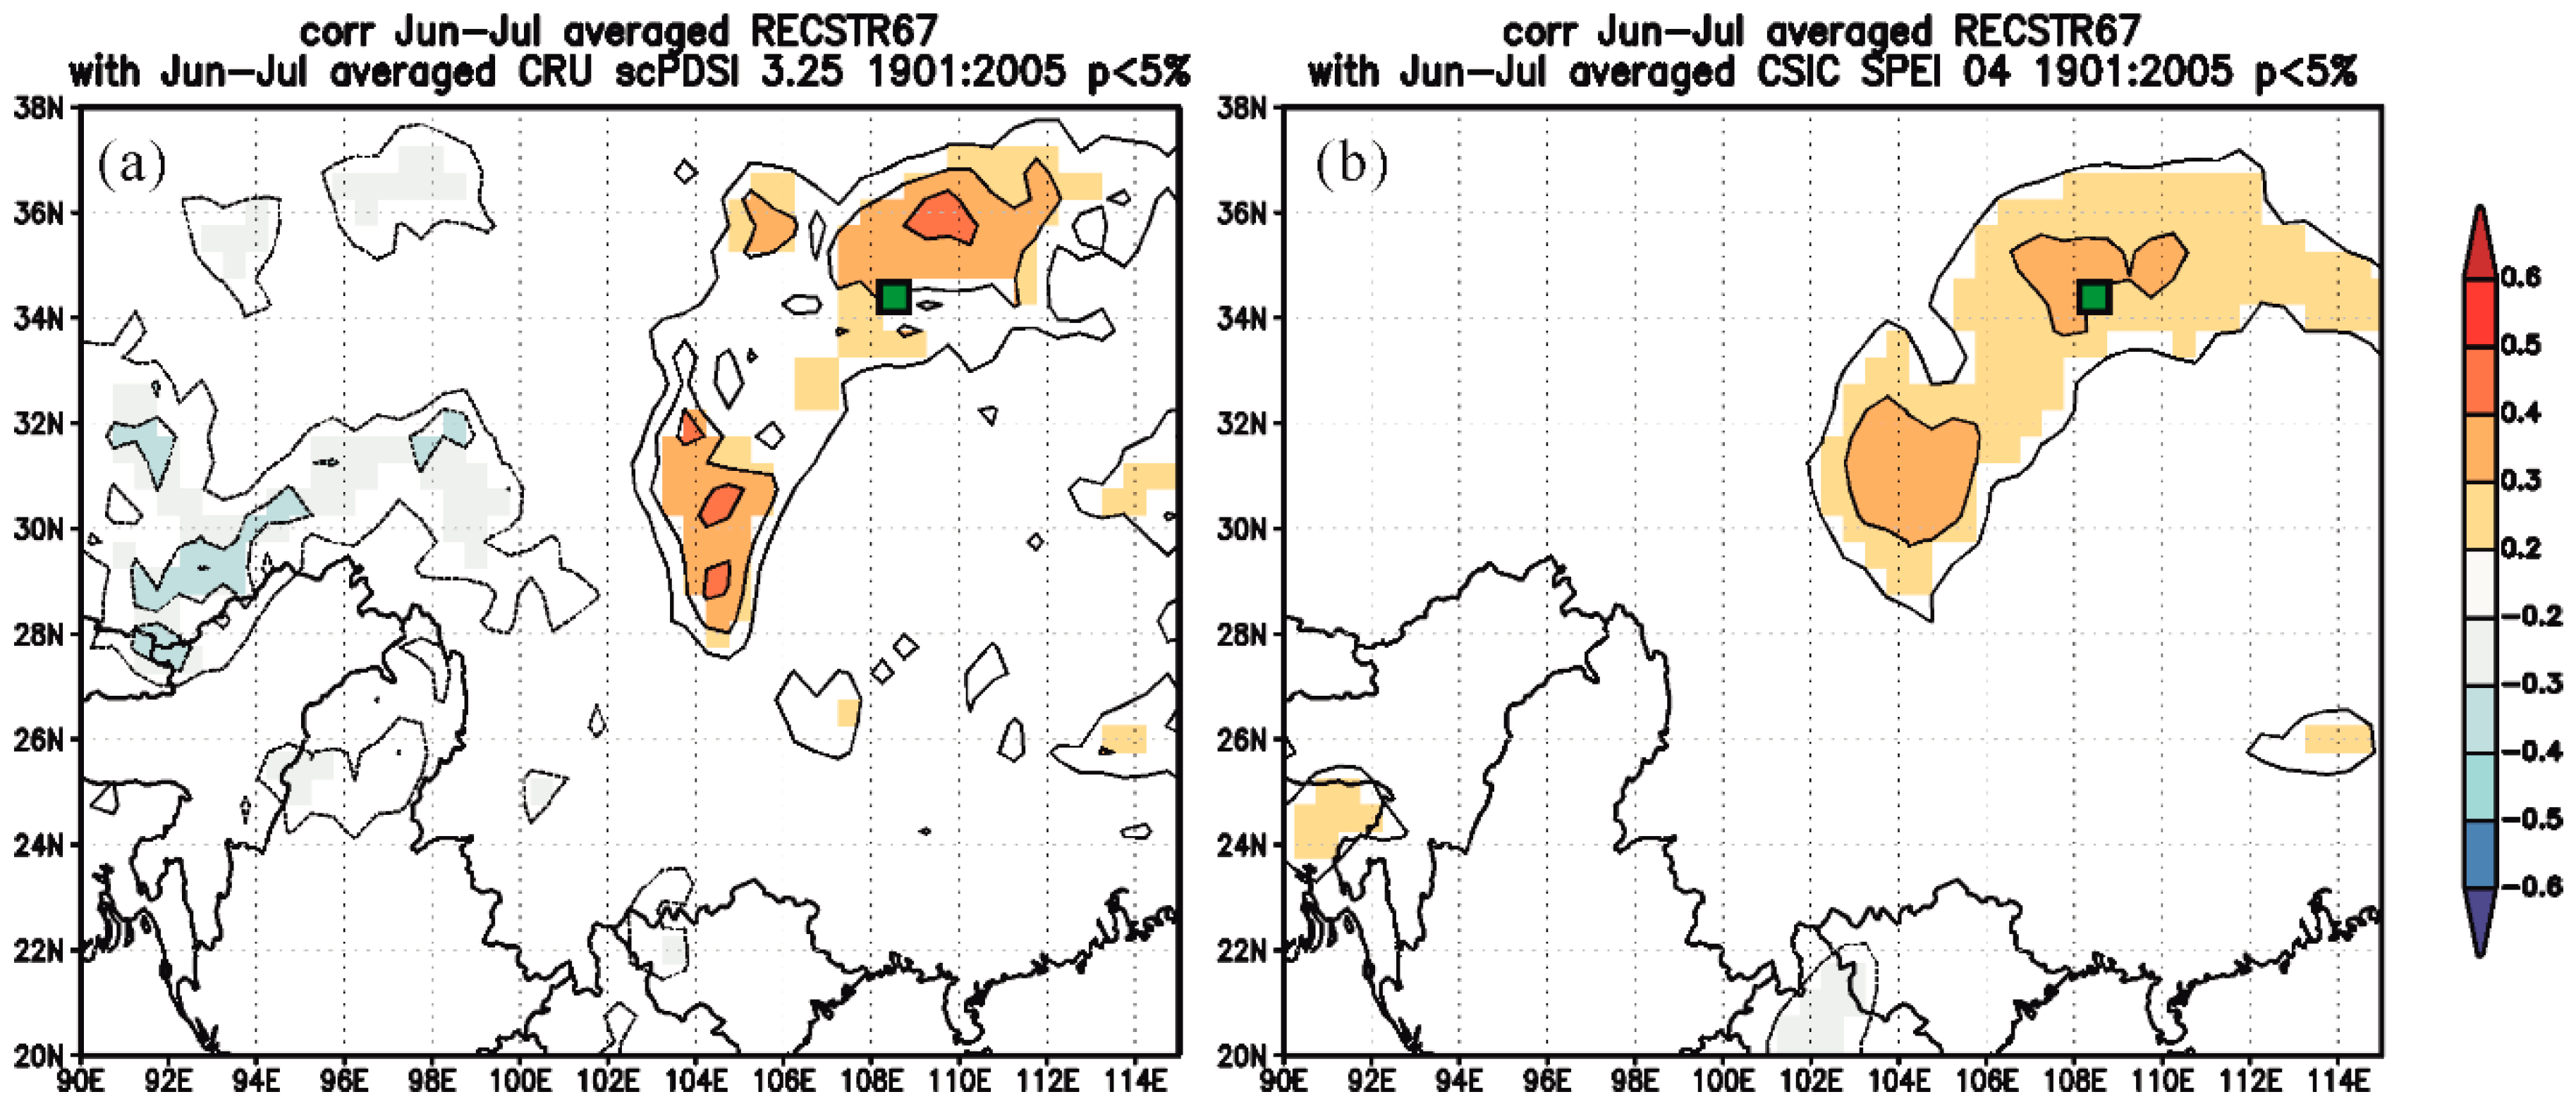
3.3. Variation Features of Streamflow of the Weihe River

The estimated mean June–July streamflow was 168.01 m3/s, and the value of standard deviation (SD) was 65.22 m3/s over the period of 1820 to 2005 AD. Extreme high and low years were determined when the reconstructed values were higher or lower one SD than the long-term mean streamflow. Based on these criteria, 30 extremely low years and 26 high years occurred in our reconstruction, and they accounted for 16.13% and 13.98% of the entire period of the 186 years, respectively (Figure 5). It should be noted that negative values were found in the two extremely lowest years of 1929 and 1998, suggesting the extremely dry conditions beyond the range of the calibration variations. A similar situation occurred in the reconstruction of seasonal streamflow inferred from tree rings in the Mongolian plateau [24]. We modified the negative values with zero in Table 2. The lowest values appeared in eight years, including 1929 (<mean-2SD), 1998 (<2SD), 1835 (<2SD), 1996 (<2SD), 1997 (<2SD), 1926 (<2SD), 2000 (<2SD), and 1900 (<2SD). In particular, the highest year appeared in 1946 with a value 372.65 m3/s (>mean+2SD), the other three higher years were 1953 (>2SD), 1956 (>2SD), and 1967 (>2SD). Low flow events lasting two-year or more occurred in 1834–1835, 1877–1878, 1900–1901,1926–1929, 1995–1998, 2000–2001, and 2003–2004, while high flow events appeared in 1829–1831, 1843–1844, 1896–1897,1946–1948, 1953–1954, 1956–1967, 1964–1965, 1974–1975, and 1983–1984. The low-frequency changes in reconstructed streamflow of the Weihe River showed obvious fluctuations on the inter-annual to multi-decadal scales during the last two centuries (Figure 5). Overall, the higher streamflow spans happened in the 1820s–1840s, 1890s, 1940s–1960s, and the lower spans existed in 1860s–1870s, 1900s, 1920s–1930s, and 1990s–2000s. The significant magnitude of streamflow variations presented from a moisture epoch in the 1950s to drought epoch in the 1990s.
Standard precipitation evapotranspiration Index (SPEI) and self-calibrating Palmer Drought Severity Index (scPDSI) are widely used for dry and wet change studies in different regions and time-scales around the world [25,26]. Considering the time lag effect of runoff to precipitation and the multi-time scale properties of SPEI, four-month scale SPEI data were selected for analysis. The spatial correlation results showed that the reconstructed June–July streamflow was significantly positively correlated with both drought indices in the middle reaches of the Weihe River, indicating that different indicators had a similar ability to capturing hydroclimatical variations (Figure 6). Therefore, the reconstructed streamflow sequence could be proved to reflect regional hydrological variability in the study area within the Weihe River basin. Less precipitation tended to result in lower streamflow. Several extremely low values years (<1SD) were consistent with severe low precipitation events occurring in the upper and down reaches of the Weihe River [3,10], including 1834, 1862, 1867, 1891, 1900, 1908, 1926, and 1928. The drought periods, such as 1851–1867, 1877–1883, 1899–1905, 1925–1941, 1995–2004, inferred from a tree-ring based April–July precipitation reconstruction for Tianshui, the upper reaches of the Weihe River [3] almost coincided with the lower intervals 1860s–1870s, 1900s, 1920s–1930s, and 1990s–2000s existing in our June–July streamflow reconstruction. These results supported the common hydroclimatical variations in the whole basin of the Weihe River.
Previous studies had reported that the dryness and wetness conditions in northern China including our Weihe River basin were related to the climate mode forcing, such as the Pacific Decadal Oscillation (PDO) and El Niño-Southern Oscillation (ENSO) [27,28,29,30]. Spatial correlation of our reconstructed streamflow with SST and MTM spectral analysis results demonstrated the connections between June–July streamflow of the Weihe River and remote oceans (Figure 7 and Figure 8).
Significantly negative correlation areas occurred in the SST over the eastern Pacific Ocean along the North America west coast. Meanwhile, positive correlation occurred in the central-north Pacific Ocean (Figure 7) suggesting the streamflow variability may be modulated by the PDO. In the PDO warm phase, negative precipitation abnormality causing more droughts occurred in North China due to the weak summer monsoon and the strong subtropical high with its position locating far to the south and west [31], whereas positive precipitation abnormality occurred in the middle and down reaches of the Yangtze River and South China associating with more flood conditions [27,32,33]. During the cold phase, the situations were opposite [34].
Significant spectrum peaks of June–July streamflow at 78.74a (p < 0.1), 72.99a (p < 0.1), 68.49a (p < 0.1), 64.10a (p < 0.1), 60.24a (p < 0.1), 35.34a (p < 0.1), 34.13a (p < 0.1), 27.70a (p < 0.1), 26.95a (p < 0.1), 26.25a (p < 0.1), 25.58a (p < 0.1), falling in the range of 50 to 70a as well as 20 to 30a variability of the PDO, supported the close linkages between of the Weihe River and north Pacific ocean on the multi-decadal scales.
Significant short cycles were also identified at 10.24a (p < 0.05), 10.14a (p < 0.05), ~8.98–9.66a (p < 0.01), ~3.75a (p < 0.01), ~2.62 a (p < 0.01), and ~2.09a (p < 0.01). Particularly, the ~2–3a periods suggested the strong teleconnections between streamflow variations in the Weihe River and ENSO. The similar frequency cycles had been revealed in other precipitation reconstructions obtained from tree rings in Tianshui [3] and Huashan [10], two studies conducted in the upper reaches and down reaches of the Weihe River, respectively. The PDSI variations over central and southern parts of Shaanxi province and the southeastern Gansu province, i.e., the Weihe River basin, showed an inverse relationship with the Niño 3.4 index in the period 1960 to 2009 [35]. Reconstructed events of the El Niño and La Nina for the period from 1525 to 2002AD provide another evidence that the extreme dryness (lower streamflow value) or wetness (higher streamflow value) conditions reflected the positive or negative phase of ENSO (Rable 2) [36]. Twelve El Niño and 12 La Nina events occurred in the estimated June–July streamflow series, accounting for 40% of the extreme dryness years and 46.15% of the extreme wetness years, respectively. Several lower streamflows in our reconstruction also were also consistent with the El Niño events identified for eastern Northwest China based on the Niño 3.4 index mentioned above, including 1966, 1992, 1997, and 2003. Two higher streamflow years coincided with the La Nina events in 1974 and 1975 [35].
The close relationships between hydroclimatical fluctuations in proximity to the Weihe River basin and remote oceans driving, such as the PDO and ENSO, have been demonstrated from several dendrohydrologial studies in the main tributaries of the Jinghe River, i.e., Kongtong Moutain [37] and Luohe River, i.e., Huanglong [38] within the Weihe River basin.

4. Conclusions

A robust regional tree-ring width chronology with the period from 1760 to 2005 AD was developed based on three groups samples of Chinese pine for the middle reaches of the Weihe River, in Central China. The highest significant correlation existed between regional chronology and average June–July streamflow. Therefore, a simple regression model was designed, and 39.3% of the actual variance for the calibration 1940 to 1970 AD was explained. Verification statistics proved the regression model was reliable and skillful to hydrology study for the confidence span from 1820 to 2005 AD. During the past 186 years, extremely low and high flow events occurred in 30 years and 26 years, respectively. The higher streamflow periods of 1820s–1840s, 1890s, 1940s–1960s, and the lower periods of 1860s–1870s, 1900s, 1920s–1930s, 1990s–2000s were identified. The significant decreasing trend occurred in the form moisture epoch in 1950s to the drought epoch in 1990s during the second half of the 20th century. Commonly, regional drought and moisture intervals captured in our streamflow reconstruction suggested it is representative of regional hydroclimate conditions over the Weihe River basin area. Significant spectral peaks were found on the multi-decadal and inter-annual scales, in the range of the bandwidths for natural climate oscillations, such as the PDO and ENSO. Spatial correlation patterns between streamflow and northern Pacific sea surface temperature, in addition to extreme streamflow events coinciding with the phase of ENSO activity, demonstrated the opposite relationships of regional streamflow variability with large-scale circulation systems mentioned above. This is the first hydrological reconstruction obtained from tree rings for the Weihe River. Our results demonstrate that there is great potential for recovering the characteristics and mechanisms of long-term hydrological changes in the Weihe River basin based on the relationships between the radial growth of trees and hydrological climatic factors. The reconstructed June–July streamflow results provide a new perspective for regional water resource assessment and forest protection in the Weihe River basin, which is useful to improve the adverse impacts of regional water cycles caused by global warming.

Author Contributions

Conceptualization, G.B. and N.L.; Data curation, G.B. and N.L.; Formal analysis, G.B. and N.L.; Funding acquisition, G.B., N.L. and Y.L.; Investigation, G.B. and N.L.; Methodology, G.B., N.L. and Y.L.; Project administration, G.B. and N.L.; Supervision, Y.L. and H.W.L; Writing-original draft, G.B. and N.L.; Writing-review and editing, G.B., N.L., Y.L. and H.W.L.

Funding

This work is supported by the Natural Science Basic Research Plan in Shaanxi Province of China (2018JQ4022); Shaanxi Key Laboratory of Disaster Monitoring and Mechanism Modeling (17JS005), Key program of the Baoji University of Arts and Sciences (ZK2018047), Second Outstanding Young Talents of Shaanxi Universities (2018), State Key Laboratory of Loess and Quaternary Geology (SKLLQG1711, SKLLQG1801) and the Young Scientist Project of Shaanxi Province (2016KJXX-41).

Acknowledgments

We thank B.F. Shen, R.Y. Wang, and W.P. Wang for their great assistance in the fieldwork. We also acknowledge the reviewers for their constructive comments to improve the manuscript.

Conflicts of Interest

The authors declare no conflict of interest.

References

  1. Song, J.X.; Wang, L.P.; Dou, X.Y.; Wang, F.J.; Guo, H.T.; Zhang, J.L.; Zhang, G.T.; Liu, Q.; Zhang, B. Spatial and depth variability of streambed vertical hydraulic conductivity under the regional flow regimes. Hydrol. Process. 2018, 32, 3006–3018. [Google Scholar] [CrossRef]
  2. Du, J.; Shi, C.X. Effects of climatic factors and human activities on runoff of the Weihe River in recent decades. Quat. Int. 2012, 282, 58–65. [Google Scholar] [CrossRef]
  3. Chen, F.; Yuan, Y.J.; Wei, W.S.; Fan, Z.A.; Yu, S.L.; Zhang, T.W.; Zhang, R.B.; Shang, H.M.; Qin, L. Reconstructed precipitation for the north-central China over the past 380 years and its linkages to East Asian summer monsoon variability. Quat. Int. 2013, 283, 36–45. [Google Scholar] [CrossRef]
  4. Fang, K.; Guo, Z.; Chen, D.; Linderholm, H.W.; Li, J.; Zhou, F.; Gou, G.; Dong, Z.; Li, Y. Drought variation of western Chinese Loess Plateau since 1568 and its linkages with droughts in western North America. Clim. Dyn. 2017, 49, 3839–3850. [Google Scholar] [CrossRef]
  5. Luo, W.G.; Guo, Z.Z.; Kou, X.M. Status Assessment and Improvement Measures Study on Ecological Water Volume in Wei River. Northwest Hydropower 2018, 6, 99–103. [Google Scholar]
  6. Li, X.J.; Zhang, J.L.; Song, J.X.; Yang, X.G. Response of runoff to economic water consumptions of the Weihe River in Shaanxi Province. Arid Land Geogr. 2016, 39, 265–274. [Google Scholar]
  7. Li, S.W.; Jin, l.P.; Zhang, J.; Jiang, T. Several advices on developments of water resources in Guanzhong region. Shaanxi Water Resour. 2018, 2, 197–200. [Google Scholar]
  8. Sun, Y.; Li, D.L.; Zhu, Y.J. Advances in study about runoff variation of the Weihe River and its response to climate change and human activities. J. Arid Meteor. 2013, 31, 396–405. [Google Scholar]
  9. Zhang, Z. Tree-rings, a key ecological indicator of environment and climate change. Ecol. Indic. 2015, 51, 107–116. [Google Scholar] [CrossRef]
  10. Hughes, M.K.; Wu, X.; Shao, X.; Garfin, G. A preliminary reconstruction of rainfall in north-central China since A.D. 1600 from tree-ring density and width. Quat. Res. 1994, 42, 88–99. [Google Scholar] [CrossRef]
  11. Chen, F.; Zhang, R.; Wang, H.; Qin, L.; Yuan, Y. Updated precipitation reconstruction (AD 1482–2012) for Huashan, north-central China. Theor. Appl. Climatol. 2016, 123, 723–732. [Google Scholar] [CrossRef]
  12. Fang, K.; Gou, X.; Chen, F.; D’Arrigo, R.; Li, J. Tree-ring based drought reconstruction for the Guiqing Mountain (China): linkages to the Indian and Pacific Oceans. Int. J. Climatol. 2010, 30, 1137–1145. [Google Scholar] [CrossRef]
  13. Liu, N. The dendroclimatology study on the northern slope of the Qinling Mountains. Master’s Thesis, Xi’an Jiaotong University, Xi’an, China, May 2009. [Google Scholar]
  14. Fritts, H.C. Tree-Rings and Climate; Academic Press: London, UK, 1976. [Google Scholar]
  15. Holmes, R.L. Computer-assisted quality control in tree-ring dating and measurement. Tree-Ring Bull. 1983, 43, 69–95. [Google Scholar]
  16. Cook, E.R.; Kairiukstis, L.A. Methods of Dendrochronology: Applications in the Environmental Sciences; Kluwer Academic Publishers: Boston, MA, USA, 1990. [Google Scholar]
  17. Wigley, T.; Briffa, K.R.; Jones, P.D. On the average value of correlated time series, with applications in dendroclimatology and hydrometeorology. J. Appl. Meteorol. Climatol. 1984, 23, 201–213. [Google Scholar] [CrossRef]
  18. Mitchell, T.D.; Jones, P.D. An improved method of constructing a database of monthly climate observations and associated high-resolution grids. Int. J. Climatol. 2005, 25, 693–712. [Google Scholar] [CrossRef]
  19. Li, B.; Xie, J.C.; Hu, Y.H.; Jiang, R.G. Analysis of variation and abruption of annual runoff in middle and lower Weihe River. Hydro-Sci. Eng. 2016, 3, 61–69. [Google Scholar]
  20. Mann, M.E.; Lees, J. Robust estimation of background noise and signal detection in climatic time series. Clim. Chang. 1996, 33, 409–445. [Google Scholar] [CrossRef]
  21. Vicente-Serrano, S.M.; Beguería, S.; López-Moreno, J.I. A multiscalar drought index sensitive to global warming: the standardized precipitation evapotranspiration index-SPEI. J. Clim. 2010, 23, 1696–1718. [Google Scholar] [CrossRef]
  22. Wells, N.; Goddard, S.; Hayes, M.J. A self–calibrating Palmer Drought Severity Index. J. Clim. 2004, 17, 2335–2351. [Google Scholar] [CrossRef]
  23. Smith, T.M.; Reynolds, R.W.; Peterson, T.C.; Lawrimore, J. Improvements to NOAA’s historical merged land-ocean surface temperature analysis (1880–2006). J. Clim. 2008, 21, 2283–2296. [Google Scholar] [CrossRef]
  24. Pederson, N.; Lealand, C.; Nachin, B.; Hessl, A.E.; Bell, A.R.; Martin-Benito, D.; Saladyga, T.; Suran, B.; Brown, P.M.; Davi, N. Three centuries of shifting hydroclimatic regimes across the Mongolian Breadbasket. Agric. For. Meteorol. 2013, 178–179, 10–20. [Google Scholar] [CrossRef]
  25. Dai, A.G. Drought under global warming: A review. Interdiscip. Rev. Clim. Chang. 2011, 2, 45–65. [Google Scholar] [CrossRef]
  26. Vicente-Serrano, S.M.; Beguería, S.; López-Moreno, J.I.; Angulo, M.; Kenawy, A.E. A new global 0.5° gridded dataset (1901–2006) of a multiscalar drought index: Comparison with current drought index datasets based on the Palmer Drought Severity Index. J. Hydrometeorol. 2010, 11, 1033–1043. [Google Scholar] [CrossRef]
  27. Qian, C.; Zhou, T. Multidecadal Variability of North China Aridity and Its Relationship to PDO during 1900–2010. J. Clim. 2014, 27, 1210–1222. [Google Scholar] [CrossRef]
  28. Bao, G.; Liu, Y.; Liu, N.; Linderholm, H.W. Drought variability in eastern Mongolian Plateau and its linkages to the large-scale climate forcing. Clim. Dyn. 2015, 44, 717–733. [Google Scholar] [CrossRef]
  29. Zhang, Y.; Tian, Q.; Guillet, S.; Stoffel, M. 500-yr. precipitation variability in Southern Taihang Mountains, China, and its linkages to ENSO and PDO. Clim. Chang. 2017, 144, 419–432. [Google Scholar] [CrossRef]
  30. Yang, Q.; Ma, Z.G.; Fan, X.G.; Yang, Z.L.; Xu, Z.F.; Wu, P.L. Decadal modulation of precipitation patterns over eastern China by sea surface temperature anomalies. J. Clim. 2017, 30, 7017–7033. [Google Scholar] [CrossRef]
  31. Shen, C.; Wang, W.C.; Gong, W.; Hao, Z. A Pacific decadal oscillation record since 1470 AD reconstructed from proxy data of summer rainfall over eastern China. Geophys. Res. Lett. 2006, 33, L03702. [Google Scholar] [CrossRef]
  32. Ma, Z.; Fu, C. Some evidence of drying trend over Northern China from 1951 to 2004. Chin. Sci. Bull. 2006, 51, 2913–2925. [Google Scholar] [CrossRef]
  33. Zhou, T.; Song, F.; Lin, R.; Chen, X.; Chen, X. The 2012 North China floods: explaining an extreme rainfall event in the context of a longer-term drying tendency. B. Am. Meteorol. Soc. 2013, 94, S49–S51. [Google Scholar]
  34. Gu, W.; Li, C.; Yang, H. Analysis on interdecadal variations of summer rainfall and its trend in East China. Acta. Meteorol. Sin. 2005, 63, 728–739. [Google Scholar]
  35. Liu, Z.; Menzel, L.; Dong, C.; Fang, R. Temporal dynamics and spatial patterns of drought and the relation to ENSO: a case study in Northwest China. Int. J. Climatol. 2016, 36, 2886–2898. [Google Scholar] [CrossRef]
  36. Gergis, J.L.; Fowler, A.M. A history of ENSO events since A.D. 1525: implications for future climate change. Clim. Chang. 2009, 92, 343–387. [Google Scholar] [CrossRef]
  37. Fang, K.; Gou, X.; Chen, F.; Liu, C.; Davi, N.; Li, J.; Zhao, Z.; Li, Y. Tree-ring based reconstruction of drought variability (1615–2009) in the Kongtong Mountain area, northern China. Glob. Planet Chang. 2012, 80–81, 190–197. [Google Scholar] [CrossRef]
  38. Chen, F.; Yuan, Y.; Zhang, R.; Qin, L. A tree-ring based drought reconstruction (AD 1760–2010) for the Loess Plateau and its possible driving mechanisms. Glob. Planet Chang. 2014, 122, 82–88. [Google Scholar] [CrossRef]
Figure 1. Map of the study area (black rectangle) and locations of the sample site (black tree) and Xianyang hydrological station (black star).
Forests 10 00208 g001
Figure 2. Single groups and composited regional tree-ring width standard chronologies (NWTa, NWTb, NWTc, and NWTabc), and numbers of sample cores.
Forests 10 00208 g002
Figure 3. Monthly total precipitation (blue bar) and mean temperature (red circle) from CRU TS4.01 grid data within the range of 34°–35°N and 107°–109°E (1940–2005), and mean streamflow (green bar) of Xianyang hydrological station (1940–1970).
Forests 10 00208 g003
Figure 4. Correlations of tree-ring standard chronology with monthly average streamflow (grey bar) of Xianyang hydrological station (1940–1970) from the previous October (P10) to current September (C9) at the 95% confidence level (triangle) and 99% confidence level (cross). P indicates previous year, C indicates current year and C67 indicates the average June–July streamflow in the current year.
Forests 10 00208 g004
Figure 5. Comparisons (a) between reconstructed (bold line) and observed (thin line) average June–July streamflow during the period of 1940 to 1970, and (b) variations of the streamflow reconstruction during the entire span of 1820 to 2005 for the middle reaches of the Weihe River (the bold line indicates the 20-year low pass data, the horizontal line indicates the mean value and extremely high and low values with one standard deviation).
Forests 10 00208 g005
Figure 6. Spatial correlations between reconstructed average June–July streamflow (RECSTR67) for the Weihe River and the drought indices of (a) scPDSI and (b) SPEI on the four-month scale during the period 1901 to 2005 (p < 0.05). The sampling site marked by a green rectangle.
Forests 10 00208 g006
Figure 7. Spatial correlations between reconstructed June–July streamflow for the Weihe River and the average May–July sea surface temperature of NCDC ERSSTv5 during the period 1940 to 2005 (p < 0.1). All trends in the data were removed. The sampling site marked by a green rectangle.
Forests 10 00208 g007
Figure 8. Cycles results of multi-taper spectrum (MTM) analyses for reconstructed June–July streamflow for the period 1820 to 2005. The confidence interval at 99%, 95%, and 90% for peaks in the power spectrum was indicated by the red, green, and blue lines.
Forests 10 00208 g008
Table 1. Statistics of split calibration-verification for June–July streamflow reconstruction model.
CalibrationVerification
PeriodrR2STPeriodrR2 RECEST
1940–19590.647 **0.41915 *1960–19700.672 *0.4510.1910.1429 *
1960–19700.672 *0.4519 *1940–19590.647 **0.4190.2710.24311
1940–19700.627 **0.39324 **
* means p < 0.05, ** p < 0.01. RE means reduction of error; CE, coefficient of efficiency, and ST, sign test.
Table 2. Extreme events of reconstructed June–July streamflow of the Weihe River.
YearExtreme Low Value (m3/s)YearExtreme High Value (m3/s)
182198.071829265.97
1834101.781830268.13
183517.681831233.50
186291.891843264.11 b
186586.01a1844253.29
186767.461869240.31
187755.40 a1887237.52 b
187864.68 a1890242.78 b
189196.21 a1896239.07 b
190029.12 a1897243.71
190163.44 a1921233.81 b
190861.891938235.67
191298.38 a1944264.11
192622.00 a1946372.65 b
192796.831947242.47
192865.911948262.26
19290.001953311.42 b
196078.591954247.11
1966100.85 a1956309.26 b
197977.04 a1957322.86 b
198876.431964251.13
199295.29 a1965246.80
199558.491974249.58 b
199618.911975237.83 b
199719.22 a1983259.79
19980.001984271.23 b
200028.19
200184.77
200369.00
200457.56
Note: a indicates the El Niño year; b indicates La Nina year.

