Article

Understanding Community Assembly Based on Functional Traits, Ontogenetic Stages, Habitat Types and Spatial Scales in a Subtropical Forest

1
Key Laboratory of Vegetation Restoration and Management of Degraded Ecosystems, South China Botanical Garden, Chinese Academy of Sciences, Tianhe District, Guangzhou 510650, China
2
College of Resources and Environment, University of Chinese Academy of Sciences, Beijing 100049, China
3
Guangdong Provincial Key Laboratory of Applied Botany, South China Botanical Garden, Chinese Academy of Sciences, Tianhe District, Guangzhou, Guangdong 510650, China
4
Research Institute of Tropical Forestry, Chinese Academy of Forestry, Guangzhou 510520, China
*
Author to whom correspondence should be addressed.
Forests 2019, 10(12), 1055; https://doi.org/10.3390/f10121055
Submission received: 12 October 2019 / Revised: 13 November 2019 / Accepted: 19 November 2019 / Published: 21 November 2019
(This article belongs to the Section Forest Ecology and Management)

Abstract

:
Community assembly in natural communities is commonly explained by stochastic and niche-based processes such as environmental filtering and biotic interactions. Many studies have inferred the importance of these processes using a trait-based approach, however, there are still unknowns around what factors affect the importance of different assembly processes in natural communities. In this study, the trait dispersion patterns of 134 species were examined across different functional traits, habitat types, ontogenetic stages and spatial scales from a 20-ha Dinghushan Forest Dynamic Plot in China. The results showed that (1) functional traits related to productivity such as specific leaf area and leaf area mainly showed functional clustering, indicating these two functional traits were more affected by environmental filtering. However, trait dispersion patterns depended on more than the ecological significances of functional traits. For example, trait dispersions of leaf dry matter content, leaf thickness and maximum height did not show consistent patterns across habitat types and ontogenetic stages, suggesting more complex mechanisms may operate on these traits; (2) the trait dispersion varied with the habitat types and ontogenetic stages. Specifically, we found that habitat types only affected the strength of trait dispersions for all the five traits, but ontogenetic stages influenced both the strength and direction of trait dispersions, which depended on the traits selected; (3) the relative importance of soil, topography and space to trait dispersion varied with ontogenetic stages. Topography and space were more important for trait dispersion of saplings but soil was more important for trait dispersion of adults; (4) biotic interactions dominated community assembly at smaller spatial scales but environmental filtering dominated community assembly at larger spatial scales. Overall, the results highlight the importance of functional traits, habitat types, ontogenetic stages and spatial scales to community assembly in natural communities.

Graphical Abstract

1. Introduction

The reason behind why so many species could coexist in natural communities has long been a focus in ecology [1]. Stochastic processes, niche-based environmental filtering and biotic interactions are three of the main processes that generate community assembly [2,3,4]. Recently trait-based approaches are becoming increasingly important for explaining community assembly [5,6,7,8], as traits are directly related to the performance and the ecological strategies of plants. Stochastic processes associated with neutral theory assume the equivalence of all individuals, therefore trait dispersion within a local community should be random [3]. Trait dispersion can be functional clustered or functional overdispersed compared with a random distribution, as a result of environmental filtering and biotic interactions [9,10]. When environmental filtering dominates community assembly, coexisting species in a specific habitat should share similar traits and functional clustering should be observed [11,12]. When biotic interactions determine community assembly, trait dispersion should be functional overdispersed so that different species could exploit different niches to coexist [4,13,14]. Nonrandom patterns of trait dispersion have been found in the tropical, subtropical to temperate forests, however, the factors that affect the importance of different assembly processes in natural communities is still unknown [8,15].
The two opposing deterministic processes, environmental filtering and biotic interactions, may operate on different niche axes of species [8,15], and thus, different functional traits may respond differently to these processes. To colonize a community in a given habitat, the traits related to the strategies of adaptation should react intensely to environmental filtering [15,16], while traits conferring competition or plant defense should be subject to biotic interactions [14]. Some studies have also proposed that the traits related to productivity should be sensitive to environmental filtering [13] and the traits related to regeneration should be subject to biotic interactions [10]. Despite this, ecologists are trying to determine which functional traits show a certain pattern, and empirical evidence has been mixed at best [8,14,15]. As an important indicator of competition for light, for example, height has shown locally functional overdispersion in a Neotropical dry forest [10] but functional clustering along a stress gradient from open dry grasslands to wetlands [15]. In addition, some studies only focused on the trait dispersion of a multivariate trait [9,17], which integrated multiple niches axes into one variable, and this method may have masked the results of different traits related with opposing niche axes [18]. Therefore, quantifying trait dispersion simultaneously with functional traits individually and in combination may provide less ambiguous information relating to the understanding of the processes of community assembly [10,19].
Trait dispersion not only rests upon the ecological significances of different functional traits, but also depends on the environmental conditions of the habitat [15]. As good predictors of habitats, topographic features (e.g., elevation, slope and convexity) often correlate with the distribution of various resources, such as radiation, soil nutrients and moisture [20,21]. In habitats where resources are limited, less tolerant species are likely to be excluded and the dominant process of community assembly may be environmental filtering [8]. In benign habitats where many species could persist, biotic interactions may dominate the community assembly [8,14]. A widely used explanatory proposition is the stress-dominance hypothesis predicting a shift from functional overdispersion in benign habitats to functional clustering in stressful habitats [14,22,23,24]. Despite this, many studies have tested the generality of the stress-dominance hypothesis in forest, grass, alpine tundra and reptile communities, however, empirical support for this hypothesis is still ambivalent [8,15,24,25,26]. In line with the stress-dominance hypothesis, for instance, Chapman and McEwan [22] found that habitats in high elevation with low soil moisture and soil nutrients were occupied by communities of low functional dispersion in an old-growth Appalachian forest, which suggested the importance of environmental filtering in stressful conditions. However, the opposite trend was also found in other studies [15,26,27]. Therefore, similar studies from other regions could help determine the generality of the stress-dominance hypothesis.
Multiple trait-based studies have focused on environmental gradient dependency [23,24,26], however, how the effects of topographic, edaphic, and spatial factors on trait dispersion vary with ontogeny still remains unfairly explored [28,29]. The regeneration niche hypothesis proposed that habitat partitioning may be more important at the early life stage of trees, where the habitats may be more heterogeneous than those occupied by adults [30,31]. However, adults may be more constrained by soil resources due to higher stomatal conductance and photosynthetic capacities than saplings [28,32]. In addition, the effect of seed dispersal limitation might decrease with trees growing up [33]. Because edaphic variables often relate to the topographic factors [20], we predicted that the explained variation of trait dispersion purely by topography or by space should decrease but purely by edaphic variables should increase from young to old ontogenetic stages.
It is undeniable that the detectability of trait dispersion is scale dependent [14,34]. Legendre et al. [35] found that the relative importance of environmental variables to community assembly increased with increasing spatial scales. Additionally, Chase [36] also proposed that environmental conditions determined the species compositions in communities at larger spatial scales. In addition, Weiher and Keddy [14] pointed out that biotic interactions (especially for the competition) predominated the community assembly at smaller spatial scales. Therefore, we predicted that the relative importance of environmental filtering should increase due to the higher environmental heterogeneity with increasing spatial scales [15,37] and the relative importance of biotic interactions should decrease with increasing spatial scales [10,34] due to less environmental heterogeneity at smaller spatial scales [36] and the sessile lifestyle of plants [38]. Environmental variables such as soil attributes and topographic parameters also vary with spatial scales [20,34] and analyzing the trait dispersion patterns across spatial scales may provide less ambiguous information to community assembly.
Here, we analyzed the functional trait dispersion patterns of 134 tree species across different functional traits, habitat types, ontogenetic stages and spatial scales while taking into account the topographic, edaphic and spatial data in the 20-ha Dinghushan Forest Dynamic Plot (DHS plot), in south China. First, we expected different functional traits should be subjected to different processes of community assembly. Second, we predicted the trait dispersion should not only rest upon the ecological significances of different functional traits, but also vary with the environmental conditions of habitat and ontogenetic stages. Third, we predicted that the variation in trait dispersion could be explained purely by topography or by space, which should decrease but purely by edaphic variables should increase from young to old ontogenetic stages. Finally, we predicted biotic interactions should dominate community assembly at smaller spatial scales and environmental filtering should determine community assembly at larger spatial scales using a null model approach.

2. Materials and Methods

2.1. Study Site

The study was conducted in the 20-ha DHS plot, in China, which was established between December 2004 and April 2005 in the Dinghushan Nature Reserve (23°09′21″–23°11′30″ N, 112°30′39″–112°33′41″ E), Guangdong province, China [39]. This forest has been well-protected from anthropogenic disturbance for over 400 years and is treated as climax vegetation in south China [34]. The DHS plot is covered by monsoon evergreen broadleaved forests, a mean annual temperature of 20.9 °C and average precipitation of 1929 mm, most of which falls between April and September [40]. In addition, the elevation in DHS plot ranges from 240 m to 470 m [32]. In this study, we used the community data collected in 2010 to match the data of functional traits. A total number of 60,265 individuals with ≥1.0 cm diameter at breast height (dbh) from 51 families, 110 genera and 183 species were mapped, tagged and identified to species.

2.2. Functional Traits, Topography and Soil Data Measurements

Five plant functional traits for 134 of the most frequent species were measured during June 2009 and July 2010 [41]. These traits were specific leaf area (SLA), leaf area (LA), leaf dry matter content (LDMC), leaf thickness (LT) and maximum height (Hmax). SLA is associated with the leaf economic spectrum and leaf life span, where species with higher SLA generally have higher metabolic and growth rates [42]. LA is important for leaf water and energy balance [41]. LDMC is related to the average density of the leaf tissues, and species with higher LDMC are often assumed to be more resistant to physical hazards [43]. LT is related to leaf life span, nutrient cycling and litter decomposition [44]. Hmax is indicative of adult size and the adult light niche [45]. Specifically, at least six individuals were randomly selected for each species and 10 mature leaves for each individual were measured [39]. Each leaf (without petiole) was scanned and LA (cm2) was measured using an image software (ImageJ version 1.43u, USA). LT (mm) was measured using a micrometer, avoiding the main and large secondary veins. After weighing for fresh mass, the leaves were dried in an oven at 60 °C for 72 h and reweighed to determine dry mass. SLA (cm2 g−1) was LA divided by the dry mass and LDMC (g g−1) was the dry mass divided by fresh mass. In addition, Hmax was mainly compiled from the data of community survey around this region and Flora of China (http://frps.eflora.cn/). These functional traits may vary across ontogenetic stages within species, potentially limiting our understanding about community assembly via the random sampling methods. Nevertheless, ranks of species by these functional traits may be largely consistent across ontogeny [28] and we used the random samplings to calculate representative mean trait values for the species in this study (Table S1). The number of these 134 species accounted for 99.0% of the total individuals and this definitely dominated the community assembly and ecosystem function in the DHS plot [39].
We also measured the elevation of each quadrat at 10 m × 10 m spatial scale within the DHS plot using an electronic total station [39]. Elevation of each quadrat was defined as the mean elevation at its four corners [35], and convexity of each quadrat was defined as the elevation of the focal quadrat minus the mean elevation of the eight surrounding quadrats [35]. For the edge quadrats, convexity was the elevation at the middle of each quadrat minus the mean of its four corners [35]. Slope of each quadrat was calculated as the mean angular deviation from horizontal of each of the four triangular planes formed by connecting three of its corners [35]. A total of 710 soil samples were taken using both regular and random sampling methods based on 30 m × 30 m grids [46]. At each point, 0.5 kg of soil (0–10 cm depth) was collected and nine soil properties were measured, including soil pH (pH), soil moisture (SM), organic matter (OM), total nitrogen (TN), available nitrogen (AN), total potassium (TK), available potassium (AK), total phosphorus (TP) and available phosphorus (AP) [39,46]. For detailed descriptions see [46].

2.3. Habitat Types, Ontogenetic Stages and Spatial Scales Classification

In a previous study in the DHS plot [47], five habitat types including low gully (LG), low slope (LS), high gully (HG), high slope (HS) and mountain ridge (MR) (Figure 1) were distinguished by similarity in three topographical variables (elevation, slope and convexity) using multivariate regression tree analysis [31,35] at the 20 m × 20 m spatial scale. Pei et al. [47] found phylogenetic filtering played a dominant role in structuring communities in LG and LS habitats but it was less important in structuring communities in HG, HS and MR habitats. Here, we also selected the 20 m × 20 m spatial scale for habitat analysis to make our functional trait dispersion results comparable with previous phylogenetic dispersion results of Pei et al. [47]. It should be noted that it is still difficult to logically test which spatial scale is more appropriate for the habitat type classification in a DHS plot although many studies did the analysis at the 20 m × 20 m spatial scale [33,48,49,50,51]. To our knowledge, 20 m × 20 m spatial scale is treated as a sampling unit in the census protocol of the Center for Tropical Forest Science [52]. Spatial autocorrelation in many tropical forests has been shown to be strongest at spatial scales less than 20 m [48,53], so by treating 20 m × 20 m spatial scale as a sampling unit could remove at least part of the problem of spatial autocorrelation [49,51] although spatial autocorrelation could be removed by a simultaneous spatial autoregressive model [54,55,56]. The detailed classification scheme for topographical habitats in the DHS plot is given in Table 1. Differences among soil properties across habitat types were assessed through a Tukey HSD test (p < 0.05). The results showed that most of the soil properties were highest in LG, followed by LS, and then HG and HS, and were lowest in MR (Table 1). Therefore, the habitat conditions along the rank of LG, LS, HG, HS and MR represented a gradient of increasing environmental stress.
To account for the effect of ontogeny on trait dispersion, we classified all trees into saplings, juveniles, and adults on the basis of dbh [56,57] at the 20 m × 20 m spatial scale. While dbh is not an exact measure of ontogeny, adults will generally be larger than juveniles and saplings [58]. Within each species, individuals were ranked by their dbh and the 99th percentile (dbh99) was calculated. Thus, saplings were individuals with dbh < dbh991/2, adults were individuals with dbh ≥ dbh992/3 and the remaining individuals were classed as juveniles [58]. To identify the statistical power of this analysis, the mean species abundance and richness across three ontogenetic stages and five habitat types were also calculated at the 20 m × 20 m spatial scale (Table S2).
To test the effect of spatial scales on trait dispersion, the DHS plot was divided into four spatial scales (5 m × 5 m, 10 m × 10 m, 20 m × 20 m and 50 m × 50 m). Since the elevation of the DHS plot at the 10 m × 10 m base grid also included the information of 20 m × 20 m, the elevation of each quadrat at the 20 m × 20 m spatial scale could be directly obtained. In addition, the elevation of each quadrat at 5 m × 5 m and 50 m × 50 m spatial scales were interpolated using the kriging methods, which were carried out using the package ‘geoR’ in R [59]. Ecological data are inherently spatially structured because the observations from nearby locations are more similar than would be expected on a random distribution [60] and the kriging methods can help make optimal, unbiased estimates of regionalized variables at unsampled locations using the structural properties of the semi-variogram and the initial set of data values [59]. First, empirical variograms which describe the spatial association as a function of the separation distance could be computed by using the function ‘variog4′ to the elevation data of the DHS plot at the 10 m × 10 m base grid. Second, the optimal model could be selected by visualizing the distribution patterns of variograms [59]. Third, the parameters such as the range, nugget, sill and partial sill values should be determined from the optimal model [59]. Fourth, the elevation values for the grid cells of 5 m × 5 m and 50 m × 50 m could be predicted using the coordinates of the grid cell locations [56]. Last, the elevation of each quadrat can be obtained by calculating the mean elevation at its four corners across these two spatial scales and convexity and slope for each quadrat across spatial scales could be calculated in accordance with the elevation data. In addition, to obtain the predicted values of the nine soil properties for each quadrat, kriging methods were also used to generate soil predictions from the 30 m × 30 m base grid across the four spatial scales [61]. For details about kriging methods refer to [59].

2.4. Trait-Based Analysis of Community Structure

Trait dispersion was quantified by a multidimensional functional diversity index– functional dispersion (FDis), which quantifies the mean distance of individual species to the centroid of all species in trait space within a given community [62]. The main reasons why we selected FDis as the indicator of trait dispersion were as follows: firstly, FDis is independent of species richness [26,34]; furthermore, FDis well represents the degree of trait dissimilarity among coexisting species and thus it is closely related to the ecological strategies of plants [1,63]; finally, FDis can treat relative abundances as weights by shifting the position of the centroid towards the most abundant species [8,62]. Prior to analysis, we standardized all functional traits to mean zero with a standard deviation of one to make sure each trait had the same weight in the FDis calculation [63].
To determine whether the FDis of coexisting species within a quadrat were different from that expected by random distribution, we implemented a frequently used null model, preserving species abundances and occurrence frequency in the DHS plot and only randomly shuffling taxon names 999 times [56]. For each of the 999 shuffles, a null trait dispersion pattern is produced. The 999 values constituted a null distribution of trait dispersion, then a standardized effect size of FDis (ZFDis) was calculated as follows [64]:
ZFDis = (FDisobs − mean(FDisnull))/sd(FDisnull),
where FDisobs is the observed value of FDis for each quadrat and FDisnull are the 999 random values of FDis. First, FDis for each trait individually was calculated across three ontogenetic stages for each quadrat at 20 m × 20 m spatial scale to test the effects of habitat types and ontogenetic stages on trait dispersion. Second, FDis for a multivariate trait (AT) that considered all traits in combination was calculated across three ontogenetic stages to conduct the variance partitioning analyses below. Last, FDis of AT that considered all trees was calculated across four spatial scales to test the effect of spatial scales to trait dispersion. Because trait dispersion patterns were generally spatially autocorrelated in the DHS plot (Tables S3 and S4), all ZFDis were transformed by a simultaneous spatial autoregressive model to remove spatial autocorrelation from the residuals [54,65] except for the below variance partitioning analyses, which have considered the importance of spatial factors to trait dispersions. Last, we used a Wilcoxon test to test whether the median ZFDis of quadrats in each habitat type or spatial scale was different from a null expectation of zero [10]. Positive median ZFDis indicated larger trait dispersion than the null expectation, suggesting that community assembly was dominated by biotic interactions; negative median ZFDis indicated lower trait dispersion than the null expectation, suggesting that community assembly was dominated by environmental filtering [8,26].

2.5. Variance Partitioning Analyses

To test whether the roles of edaphic, topographic and spatial factors in explaining trait dispersion patterns would change with ontogenetic stages, we partitioned the variation of trait dispersion at 20 m × 20 m spatial scale into soil, topography, space and their joint effects [66]. We used the PCNM approach to introduce space as an explanatory variable with the ‘vegan’ R package [67]. First, a Euclidean distance matrix based on the coordinates of 500 quadrats was created [68]. Second, this Euclidean distance matrix was truncated using the threshold distance of 20 m which defined the finest spatial scale at which spatial pattern could be detected [68,69]. Third, a principal coordinate analysis was conducted to the truncated distance matrix and the eigenvectors associated with positive eigenvalues were retained as PCNM variables [66,68]. Last, 352 PCNM variables were obtained at the 20 m × 20 m spatial scale.
All analyses were conducted in R 3.4.4 [70]. We used the ‘FD’ package [55] to calculate FDis and the ‘picante’ package [55] to run the null models. The SAR analyses were made with the ‘spdep’ package (http://www.r-project.org/) and the variance partitioning analyses were performed in the ‘vegan’ package [67].

3. Results

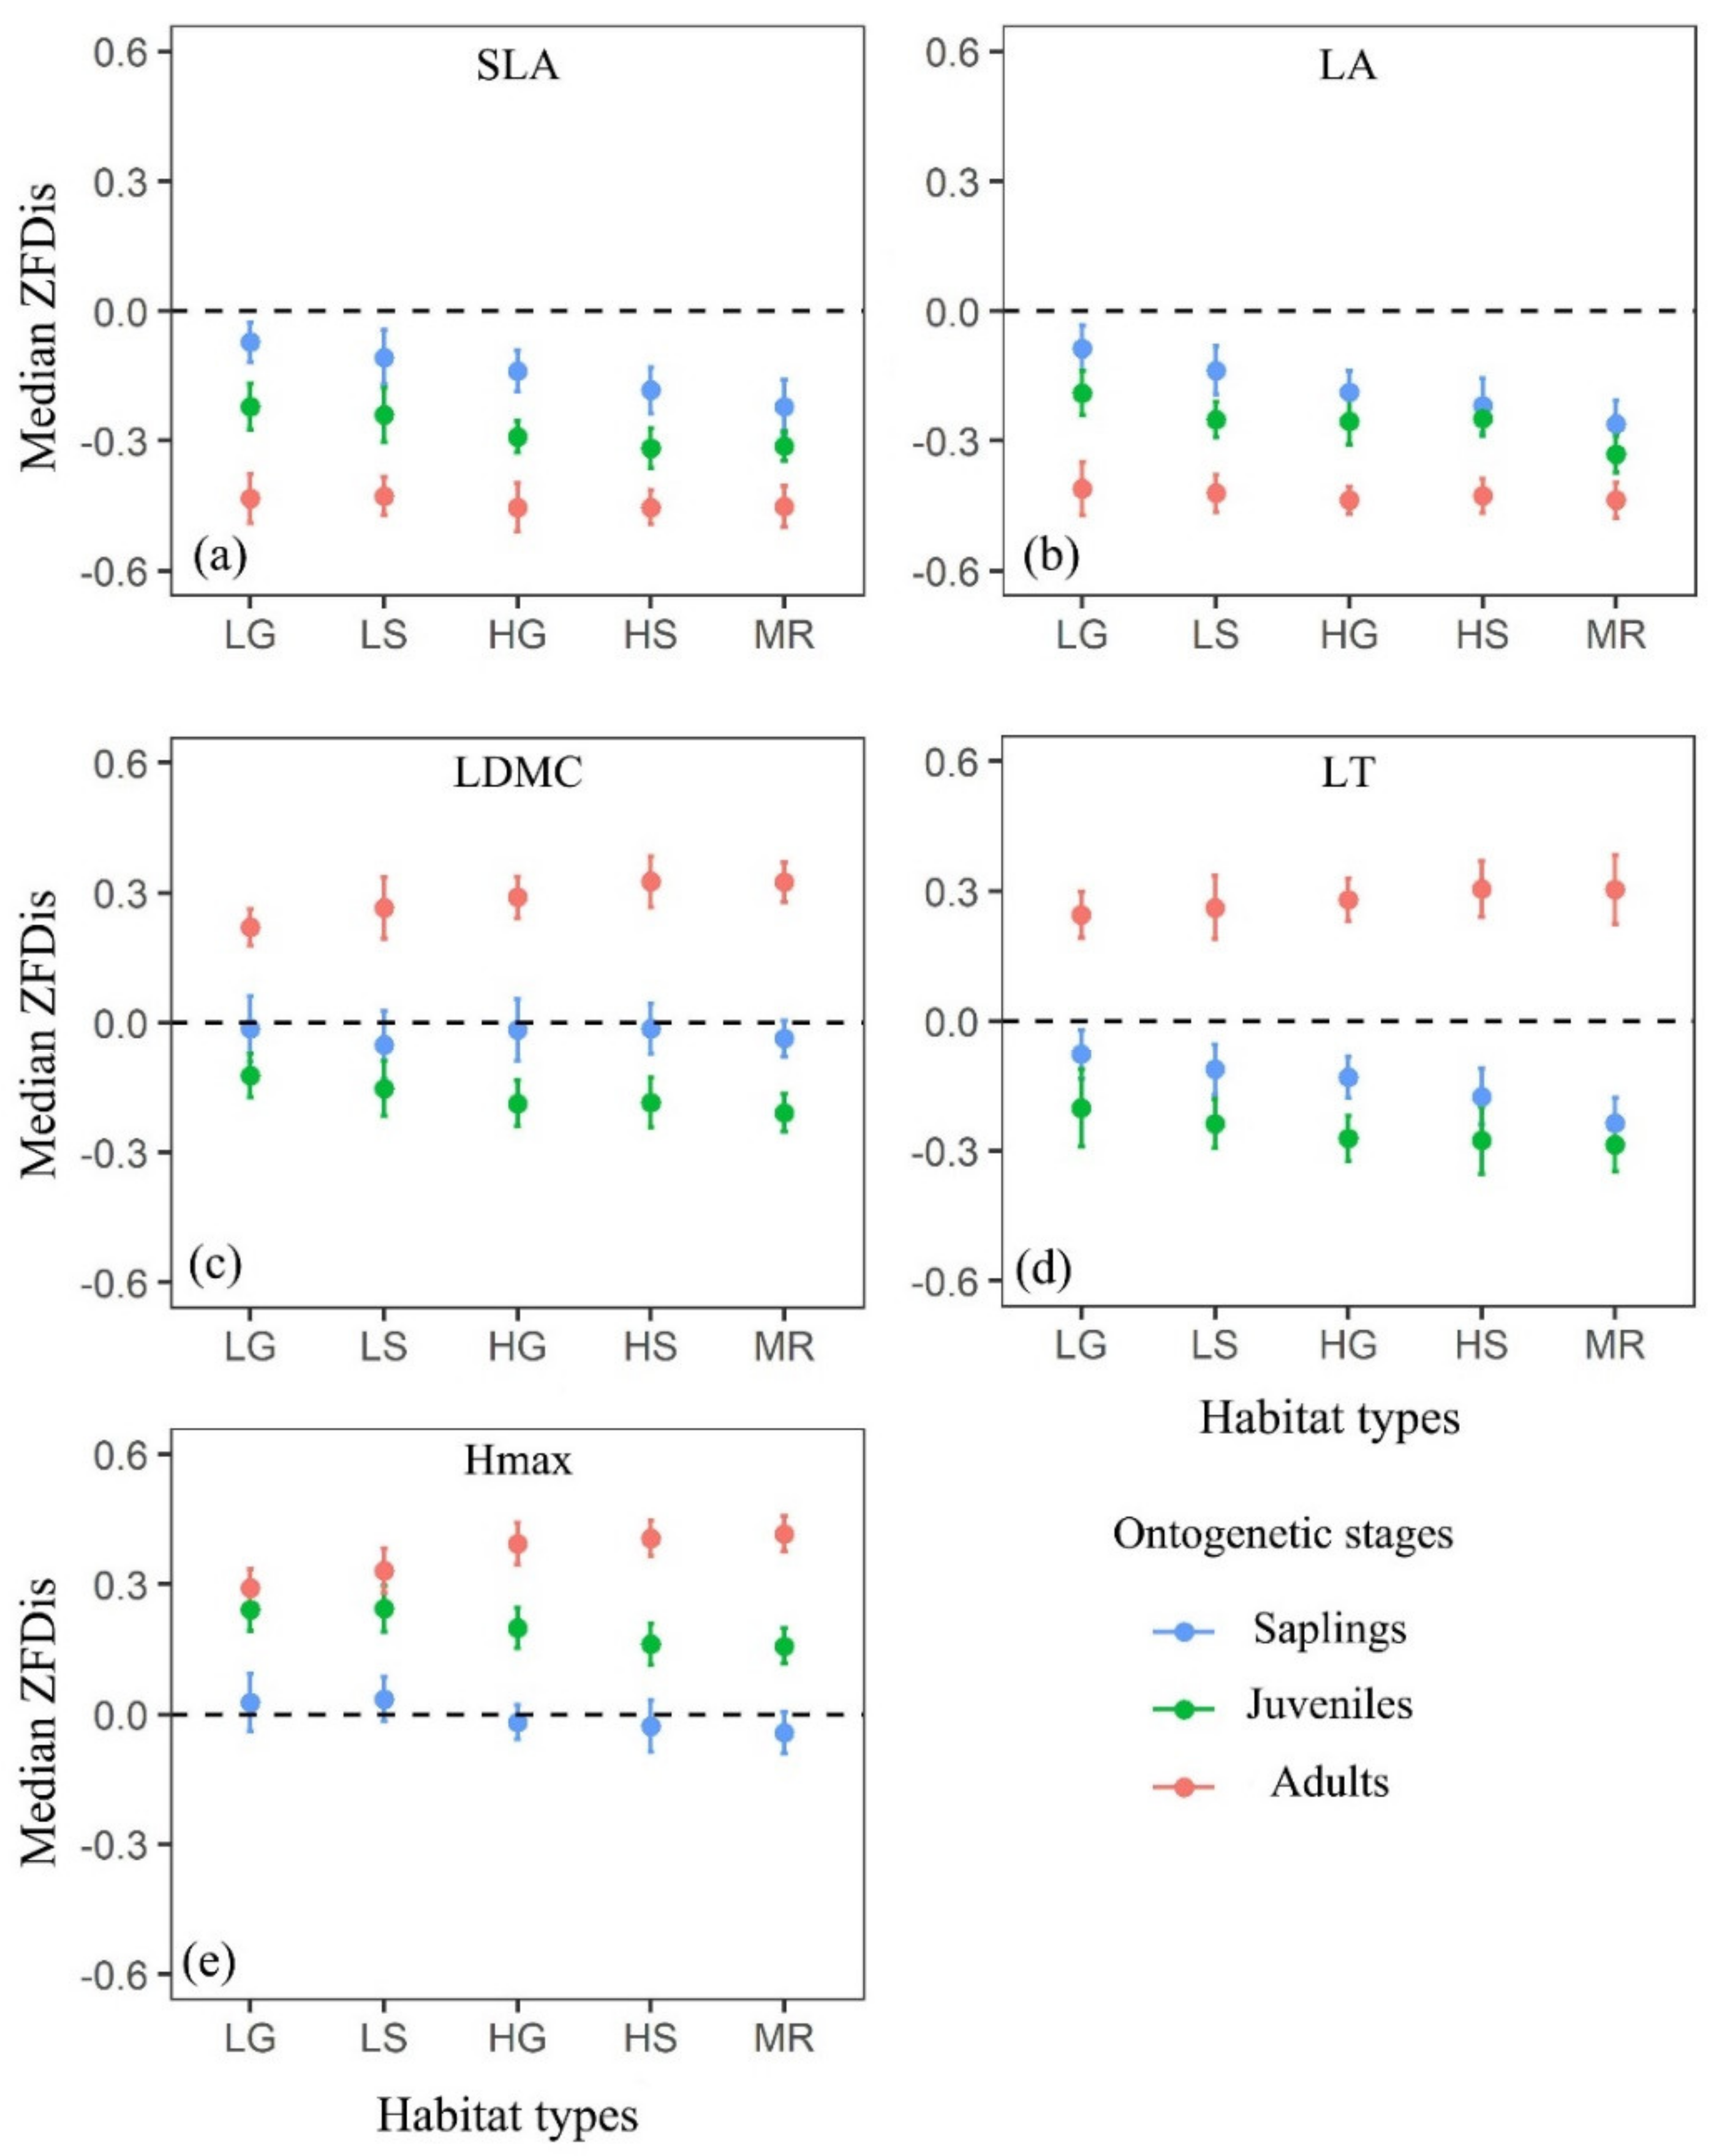
3.1. Trait Dispersions Across Different Functional Traits, Ontogenetic Stages and Habitat Types

The trait dispersions of SLA and LA showed functional clustering for each ontogenetic stage across all habitat types and the strength of functional clustering for the two traits also increased with ontogeny and the rise of environmental stress (Figure 2a,b). However, the trait dispersions of LDMC, LT or Hmax did not show consistent patterns across habitat types and ontogenetic stages (Figure 2c–e). Specifically, LDMC showed functional randomness for saplings but functional clustering for juveniles; LT showed functional clustering for both saplings and juveniles; Hmax showed functional random for saplings but functional overdispersion for juveniles. In addition, all of these three traits showed functional overdispersion for adults. For all trees in the DHS plot, trait dispersion of the multivariate trait (AT) turned from functional overdispersion to functional clustering along with a gradient of increasing environmental stress (Figure 3).

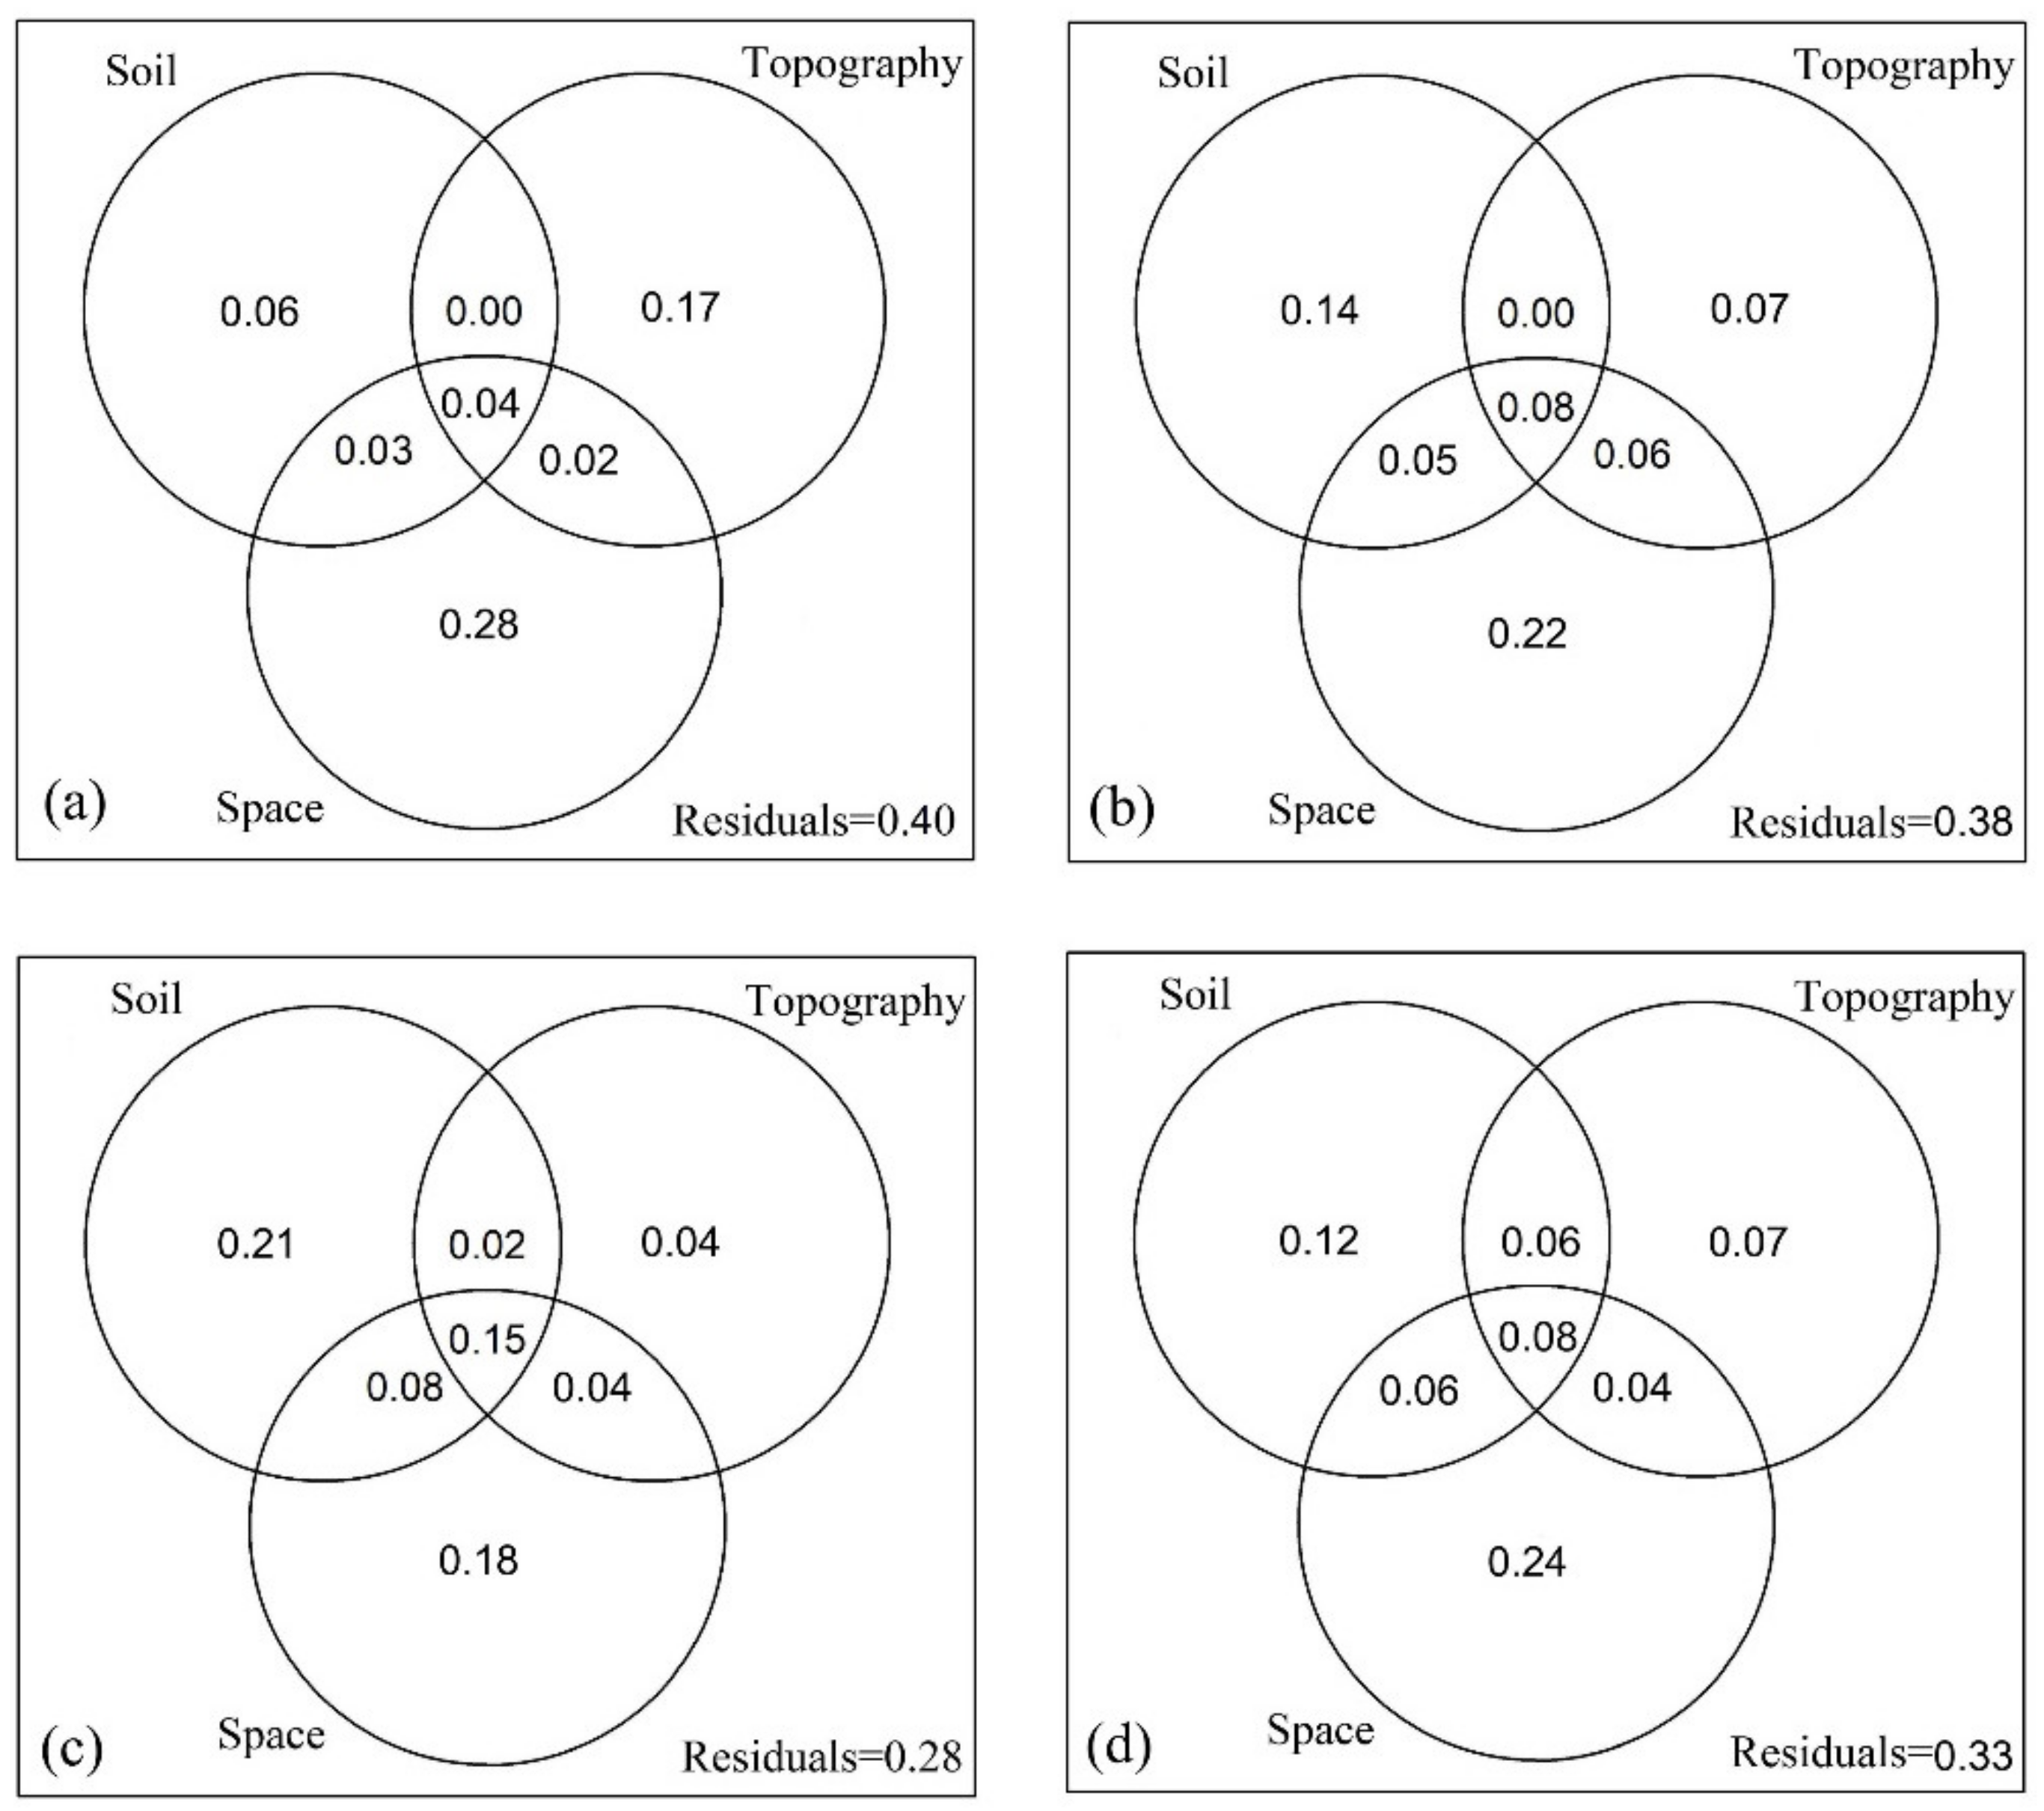
3.2. Effects of Soil, Topography and Space on Trait Dispersions Across Ontogenetic Stages

The explained variation in trait dispersion by soil, topography and space at 20 m × 20 m spatial scale varied with ontogenetic stages (Figure 4). Overall, the total explained variation in trait dispersion increased from young to old ontogenetic stages (Figure 4a–c). Specifically, the variation explained purely by soil increased but the variation explained purely by topography or by space decreased with ontogenetic stages (Figure 4a–c). Compared with the results of different ontogenetic stages, variance partitioning for all individuals in the DHS plot showed that the three variables (soil, topography and space) explained a moderate level of trait dispersion (Figure 4d).

3.3. Trait Dispersions of the Multivariate Trait (AT) For All Trees Across Spatial Scales

In the DHS plot, trait dispersions across spatial scales showed both functional clustering and functional overdispersion patterns (Figure 5). Based on the Wilcoxon tests, we found a shift from functional overdispersion at the smallest 5 m × 5 m spatial scale to functional clustering with increased spatial scales (Figure 5). Thus, coexisting species were more functionally dissimilar than expected at smaller spatial scales but more functionally similar than expected at larger spatial scales.

4. Discussion

4.1. The Importance of Trait Selection, Ontogenetic Stages and Habitat Types on Community Assembly

Plants have to cope with many difficulties in realizing growth and survival during their life cycle and their strategies in the struggle are reflected by their functional traits [19,26]. The two opposing deterministic processes, environmental filtering and biotic interactions, may operate on different niche axes of species [8,15], and thus, we expected that different functional traits should respond differently to these processes. Consistent with this hypothesis, SLA and LA mainly showed functional clustering across ontogenetic stages and habitat types in our research plot [9,10,66], indicating coexisting species were more functionally similar than expected for these two traits. These results also supported Grime’s prediction [13] that traits related to productivity were often functionally clustered. In addition, the increase in clustering with ontogeny for these two traits (Figure 2a,b) suggested that the effects of environmental filtering may be cumulative along an individual life cycle [71]. In other words, the strength of environmental filtering increases as trees grow up.
We also found the strength of functional clustering for SLA and LA increased with the increasing environmental stress (Figure 2a,b), thus the stress-dominance hypothesis, which stressed the increasing importance of environmental filtering in stressful habitats appeared to be supported by our results [14,22,23,24], as indicated by the changing trait dispersion patterns of AT across habitat types (Figure 3). Consistent with the stress-dominance hypothesis, we also found that biotic interactions dominated the community assembly in benign habitats such as the LG and LS habitats (Figure 3). Interestingly, the results of phylogenetic filtering from this forest [47] were consistent with the present functional trait dispersion results. For example, Pei et al. [47] found that coexistence species were more closely related in LG and LS habitats in the DHS plot. The more closely related species often had more similar niches and therefore, species with close relatives also competed more than with distant relatives [72] which may lead to the dominant role of biotic interactions in the LG and LS habitats. However, some studies failed to support the stress-dominance hypothesis [15,26,27] and this may have related to the proxies, which were used to measure environmental gradients [8,15,25]. For example, standing biomass is commonly used to indicate environmental gradients [15,25,73] as a decrease in standing biomass to some extent reflects the degree of stress [74,75]. However, the gradient of standing biomass could be driven by various factors such as edaphic, topographic or microclimatic properties [74,76], thus making it no basis for comparison between different studies. Therefore, the method of quantifying environmental gradients efficiently might be more important for testing the generality of the stress-dominance hypothesis. However, trait dispersions of LDMC, LT and Hmax did not show consistent patterns across habitat types and ontogenetic stages, indicating more complex mechanisms may operate on these traits [77]. Hmax was mainly functionally random for saplings, suggesting it might be not important for small trees’ coexistence [10]. The overdispersed patterns of Hmax for juveniles and adults imply larger trees could utilize different light environments by occupying different vertical stratifications to coexist [10]. Moreover, the competitive effects are still cumulative [13,18,71], indicated by the more overdispersed patterns of Hmax for adults than juveniles (Figure 2e). Hmax can be treated as an indicator which reflects potential competitive ability of species because of its relationship with the plant fecundity and competition for light [41]. Therefore, we can infer that Hmax of a tree plays an increasingly important role in determining the coexistence of species from young to old ontogenetic stages. In contrast with Hmax, Swenson and Enquist [10] found that the seed mass of a tree played a less important role in determining the coexistence of species from young to old ontogenetic stages. There is no doubt that other traits such as relative growth rate may be far more relevant for trees during young ontogenetic stages and further research is still needed. Similar to Hmax, we did not detect any significant effects of selective pressures from abiotic or biotic filters on LDMC for saplings (Figure 2c). In general, the adults in canopy layer tended to have high LDMC to be resistant to physical hazards and thick leaves to minimize transpiration losses and prevent overheating [41]. In contrast, the adults in the shade tended to have low LDMC and thin leaves to maximize light acquisition [78]. This explained the overdispersed patterns of LDMC and LT for adults in the DHS plot. Interestingly, we found that habitat types only affected the strength of trait dispersion patterns, but ontogenetic stages could influence both the strength and direction of trait dispersion patterns, which depended on the traits selected (Figure 2).

4.2. The Variation of Trait Dispersion Explained by Soil, Topography and Space Changed with Ontogenetic Stages

Trees growing from saplings to adults require a long time and should experience marked changes in environmental conditions [33]. Therefore we expect the effects of topographic, edaphic, and spatial factors on trait dispersion to vary with ontogenetic stages. Here, we found that the variation of trait dispersion explained purely by soil increased but the variation explained purely by topography or by space decreased with ontogenetic stages (Figure 4), which supported our prediction. Seed dispersal and seedling establishment are more important for trees at early life stages [79,80] and the individuals at this stage should have functional traits to maintain a positive carbon balance in different habitats [28], which may lead to stronger habitat preferences for saplings relative to adults [81]. The regeneration niche hypothesis also proposed that habitat partitioning may be more important at the early life stages of trees, where the habitats may be more heterogeneous than those occupied with adults [30,31]. As an important driver of habitat diversification, topography not only affected soil moisture and nutrient availability [20,31], but also influenced the trees’ interception for light [39]. Therefore, the large variation of trait dispersion explained purely by topography might be greatly related to the light heterogeneity and taking light heterogeneity into account should be helpful for further understanding the species coexistence [82], especially for the coexistence of individuals at early life stages. However, the increasing importance of soil in trait dispersion from young to old ontogenetic stages suggested that juveniles and adults were more constrained by soil resources due to higher stomatal conductance and photosynthetic capacities than saplings [28,32]. In addition, the decreasing importance of space in trait dispersion from young to old ontogenetic stages (Figure 4) might be related with the fact that the effect of seed dispersal limitation usually decreases with the trees growing up [33]. Compared with the result of variance partitioning for all individuals in this plot (Figure 4d), taking the effect of ontogeny on trait dispersion into account provided more detailed information for inferring community assembly.

4.3. The Effect of Spatial Scale on Community Assembly

It is undeniable that the detectability of trait dispersion is scale dependent [8,57], and we found that the relative importance of environmental filtering and biotic interactions changed with spatial scales in the DHS plot (Figure 5). Due to less environmental heterogeneity at smaller spatial scales [36] and the sessile lifestyle of plants [38], the relative importance of biotic interactions was greater than environmental filtering at the smallest 5 m × 5 m spatial scale in this plot as predicted by Weiher and Keddy [14]. In contrast, some studies failed to prove this mechanism [10,34]. One reason might be the lack of a small enough spatial scale in these studies (e.g., [34]). However, even at the same scale of 5 m × 5 m, Swenson and Enquist [10] found that coexisting species were typically functional clustered in San Emilio Forest Dynamics Plot. This might be related with the fact that trait dispersion in a natural community was also stem size dependent [56,57]. Swenson and Enquist [10] only analyzed the trait dispersion of individuals being equal or larger than 3.0 cm in diameter which might possibly have underestimated the strength of biotic interactions. Consistent with the proposition of Weiher and Keddy [14], we also found a shift in the dominant pattern from functional overdispersion to clustering with increasing spatial scales, indicating the importance of environmental filtering to community assembly at larger scales [34,83].

5. Conclusions

Based on the trait dispersion patterns of 134 tree species across different functional traits, habitat types, ontogenetic stages and spatial scales while taking into account the topographic, edaphic and spatial data from a subtropical forest, our results revealed that the trait dispersion not only rested upon the ecological significances of different functional traits, but also varied with the environmental conditions of habitat and ontogenetic stages. Specifically, that habitat types only affected the strength of trait dispersion, but ontogenetic stages could influence both the strength and direction of trait dispersion, which depended on the traits selected. In addition, topography and space were more important for trait dispersion of saplings but soil was more important for trait dispersion of adults. Last, biotic interactions dominated community assembly at smaller spatial scales but environmental filtering dominated community assembly at larger spatial scales. Overall, the results highlight the importance of functional traits, ontogenetic stages, habitat types and spatial scales to community assembly in natural communities.

Supplementary Materials

The following are available online at https://www.mdpi.com/1999-4907/10/12/1055/s1. Table S1: The mean functional trait values of 134 species in Dinghushan Forest Dynamics Plot, China, Table S2: The mean species abundance and richness across three ontogenetic stages and five habitat types, Table S3: Testing spatial autocorrelation by Moran’s I for standardized effect size of functional dispersion (ZFDis) of six functional traits across three ontogenetic stages, Table S4: Testing spatial autocorrelation by Moran’s I for standardized effect size of functional dispersion (ZFDis) of a multivariate trait (AT) that considered all trees across four spatial scales.

Author Contributions

Conceptualization, J.L., W.Y. and Y.L.; methodology, Y.L.; validation, W.Y.; formal analysis, Y.L.; investigation, H.X.; data curation, J.L.; writing—original draft preparation, Y.L.; writing—review and editing, H.X.; visualization, Y.B., H.X., Y.N., R.Z.; supervision, W.Y.; funding acquisition, J.L. and W.Y.

Funding

This research was funded by the Strategic Priority Research Program of the Chinese Academy of Sciences (XDB31030000), the National Key R&D Program of China (grand No. 2017YFC0505802), National Natural Science Foundation of China (No. 41371078) and Chinese Forest Biodiversity Monitoring Network.

Acknowledgments

The 20-ha Dinghushan Forest Dynamics Plot was generously supported by the Biodiversity Committee of the Chinese Academy of Sciences. We appreciate all individuals who contributed to the field surveys of this plot.

Conflicts of Interest

The authors declare no conflicts of interest.

References

  1. Chiang, J.M.; Spasojevic, M.J.; Muller-Landau, H.C.; Sun, I.F.; Lin, Y.; Su, S.H.; Chen, Z.S.; Chen, C.T.; Swenson, N.G.; McEwan, R.W. Functional composition drives ecosystem function through multiple mechanisms in a broadleaved subtropical forest. Oecologia 2016, 182, 829–840. [Google Scholar] [CrossRef]
  2. Gravel, D.; Canham, C.D.; Beaudet, M.; Messier, C. Reconciling niche and neutrality: The continuum hypothesis. Ecol. Lett. 2006, 9, 399–409. [Google Scholar] [CrossRef]
  3. Hubbell, S.P. The Unified Neutral Theory of Biodiversity and Biogeography; Princeton University Press: Princeton, NJ, USA, 2001; pp. 1–375. [Google Scholar]
  4. MacArthur, R.; Levins, R. The limiting similarity, convergence, and divergence of coexisting species. Am. Nat. 1967, 101, 377–385. [Google Scholar] [CrossRef]
  5. Chauvet, M.; Kunstler, G.; Roy, J.; Morin, X. Using a forest dynamics model to link community assembly processes and traits structure. Funct. Ecol. 2017, 31, 1452–1461. [Google Scholar] [CrossRef]
  6. Kunstler, G.; Falster, D.; Coomes, D.A.; Hui, F.; Kooyman, R.M.; Laughlin, D.C.; Poorter, L.; Vanderwel, M.; Vieilledent, G.; Wright, S.J.; et al. Plant functional traits have globally consistent effects on competition. Nature 2016, 529, 204–207. [Google Scholar] [CrossRef]
  7. Paine, C.E.T.; Baraloto, C.; Chave, J.; Herault, B. Functional traits of individual trees reveal ecological constraints on community assembly in tropical rain forests. Oikos 2011, 120, 720–727. [Google Scholar] [CrossRef]
  8. Wang, R.; Wang, Q.; Liu, C.; Kou, L.; Zhao, N.; Xu, Z.; Zhang, S.; Yu, G.; He, N. Changes in trait and phylogenetic diversity of leaves and absorptive roots from tropical to boreal forests. Plant Soil 2018, 432, 389–401. [Google Scholar] [CrossRef]
  9. Cornwell, W.K.; Schwilk, D.W.; Ackerly, D.D. A trait-based test for habitat filtering: Convex hull volume. Ecology 2006, 87, 1465–1471. [Google Scholar] [CrossRef]
  10. Swenson, N.G.; Enquist, B.J. Opposing assembly mechanisms in a Neotropical dry forest: Implications for phylogenetic and functional community ecology. Ecology 2009, 90, 2161–2170. [Google Scholar] [CrossRef] [PubMed]
  11. Díaz, S.; Cabido, M.; Casanoves, F. Plant functional traits and environmental filters at a regional scale. J. Veg. Sci. 2009, 9, 113–122. [Google Scholar]
  12. Götzenberger, L.; Botta-Dukat, Z.; Leps, J.; Partel, M.; Zobel, M.; de Bello, F. Which randomizations detect convergence and divergence in trait-based community assembly? A test of commonly used null models. J. Veg. Sci. 2016, 27, 1275–1287. [Google Scholar] [CrossRef]
  13. Grime, J.P. Trait convergence and trait divergence in herbaceous plant communities: Mechanisms and consequences. J. Veg. Sci. 2006, 17, 255–260. [Google Scholar] [CrossRef]
  14. Weiher, E.; Keddy, P.A. Assembly rules, null models, and trait dispersion: New questions from old patterns. Oikos 1995, 74, 159–164. [Google Scholar] [CrossRef]
  15. Lhotsky, B.; Kovacs, B.; Onodi, G.; Csecserits, A.; Redei, T.; Lengyel, A.; Kertesz, M.; Botta-Dukat, Z. Changes in assembly rules along a stress gradient from open dry grasslands to wetlands. J. Ecol. 2016, 104, 507–517. [Google Scholar] [CrossRef]
  16. Begon, M.; Mortimer, M.; Thompson, D.J. Population Ecology: A Unified Study of Animals and Plants, 3rd ed.; Blackwell Scientific Publications: Oxford, UK, 1996; pp. 246–247. [Google Scholar]
  17. Thompson, K.; Petchey, O.L.; Askew, A.P.; Dunnett, N.P.; Beckerman, A.P.; Willis, A.J. Little evidence for limiting similarity in a long-term study of a roadside plant community. J. Ecol. 2010, 98, 480–487. [Google Scholar] [CrossRef]
  18. Cornwell, W.K.; Ackerly, D.D. Community assembly and shifts in plant trait distributions across an environmental gradient in coastal California. Ecol. Monogr. 2009, 79, 109–126. [Google Scholar] [CrossRef]
  19. Price, J.; Tamme, R.; Gazol, A.; de Bello, F.; Takkis, K.; Uria-Diez, J.; Kasari, L.; Partel, M. Within-community environmental variability drives trait variability in species-rich grasslands. J. Veg. Sci. 2017, 28, 303–312. [Google Scholar] [CrossRef]
  20. John, R.; Dalling, J.W.; Harms, K.E.; Yavitt, J.B.; Stallard, R.F.; Mirabello, M.; Hubbell, S.P.; Valencia, R.; Navarrete, H.; Vallejo, M.; et al. Soil nutrients influence spatial distributions of tropical tree species. Proc. Natl. Acad. Sci. USA 2007, 104, 864–869. [Google Scholar] [CrossRef]
  21. Larsen, D.R.; Speckman, P.L. Multivariate regression trees for analysis of abundance data. Biometrics 2004, 60, 543–549. [Google Scholar] [CrossRef]
  22. Chapman, J.I.; McEwan, R.W. The Role of Environmental Filtering in Structuring Appalachian Tree Communities: Topographic Influences on Functional Diversity Are Mediated through Soil Characteristics. Forests 2018, 9, 19. [Google Scholar] [CrossRef]
  23. Kuczynski, L.; Grenouillet, G. Community disassembly under global change: Evidence in favor of the stress-dominance hypothesis. Glob. Chang. Biol. 2018, 24, 4417–4427. [Google Scholar] [CrossRef] [PubMed]
  24. Ramm, T.; Cantalapiedra, J.L.; Wagner, P.; Penner, J.; Roedel, M.-O.; Mueller, J. Divergent trends in functional and phylogenetic structure in reptile communities across Africa. Nat. Commun. 2018, 9, 4697. [Google Scholar] [CrossRef] [PubMed]
  25. Costa, D.S.; Gerschlauer, F.; Pabst, H.; Kuehnel, A.; Huwe, B.; Kiese, R.; Kuzyakov, Y.; Kleyer, M. Community-weighted means and functional dispersion of plant functional traits along environmental gradients on Mount Kilimanjaro. J. Veg. Sci. 2018, 28, 684–695. [Google Scholar] [CrossRef]
  26. Spasojevic, M.J.; Suding, K.N. Inferring community assembly mechanisms from functional diversity patterns: The importance of multiple assembly processes. J. Ecol. 2012, 100, 652–661. [Google Scholar] [CrossRef]
  27. Bernard-Verdier, M.; Navas, M.-L.; Vellend, M.; Violle, C.; Fayolle, A.; Garnier, E. Community assembly along a soil depth gradient: Contrasting patterns of plant trait convergence and divergence in a Mediterranean rangeland. J. Ecol. 2012, 100, 1422–1433. [Google Scholar] [CrossRef]
  28. Spasojevic, M.J.; Yablon, E.A.; Oberle, B.; Myers, J.A. Ontogenetic trait variation influences tree community assembly across environmental gradients. Ecosphere 2014, 5. [Google Scholar] [CrossRef]
  29. Yang, Q.; Shen, G.; Liu, H.; Wang, Z.; Ma, Z.; Fang, X.; Zhang, J.; Wang, X. Detangling the Effects of Environmental Filtering and Dispersal Limitation on Aggregated Distributions of Tree and Shrub Species: Life Stage Matters. PLoS ONE 2016, 11, e0156326. [Google Scholar] [CrossRef]
  30. Grubb, P.J. The maintenance of species-richness in plant communities: The importance of the regeneration niche. Biol. Rev. 1977, 52, 107–145. [Google Scholar] [CrossRef]
  31. Kanagaraj, R.; Wiegand, T.; Comita, L.S.; Huth, A. Tropical tree species assemblages in topographical habitats change in time and with life stage. J. Ecol. 2011, 99, 1441–1452. [Google Scholar] [CrossRef]
  32. Dong, T.; Zhang, Y.; Zhang, Y.; Zhang, S. Continuous planting under a high density enhances the competition for nutrients among young Cunninghamia lanceolata saplings. Ann. For. Sci. 2016, 73, 331–339. [Google Scholar] [CrossRef]
  33. Shi, H.; Xie, F.; Zhou, Q.; Shu, X.; Zhang, K.; Dang, C.; Feng, S.; Zhang, Q.; Dang, H. Effects of Topography on Tree Community Structure in a Deciduous Broad-Leaved Forest in North-Central China. Forests 2019, 10, 53. [Google Scholar] [CrossRef]
  34. Zhang, H.; Chen, H.Y.H.; Lian, J.; John, R.; Li, R.; Liu, H.; Ye, W.; Berninger, F.; Ye, Q. Using functional trait diversity patterns to disentangle the scale-dependent ecological processes in a subtropical forest. Funct. Ecol. 2018, 32, 1379–1389. [Google Scholar] [CrossRef]
  35. Legendre, P.; Mi, X.; Ren, H.; Ma, K.; Yu, M.; Sun, I.F.; He, F. Partitioning beta diversity in a subtropical broad-leaved forest of China. Ecology 2009, 90, 663–674. [Google Scholar] [CrossRef] [PubMed] [Green Version]
  36. Chase, J.M. Spatial scale resolves the niche versus neutral theory debate. J. Veg. Sci. 2014, 25, 319–322. [Google Scholar] [CrossRef]
  37. Siefert, A.; Ravenscroft, C.; Weiser, M.D.; Swenson, N.G. Functional beta-diversity patterns reveal deterministic community assembly processes in eastern North American trees. Glob. Ecol. Biogeogr. 2013, 22, 682–691. [Google Scholar] [CrossRef]
  38. Uriarte, M.; Condit, R.; Canham, C.D.; Hubbell, S.P. A spatially explicit model of sapling growth in a tropical forest: Does the identity of neighbours matter? J. Ecol. 2004, 92, 348–360. [Google Scholar] [CrossRef]
  39. Shen, Y.; Yu, S.X.; Lian, J.; Shen, H.; Cao, H.; Lu, H.; Ye, W. Inferring community assembly processes from trait diversity across environmental gradients. J. Trop. Ecol. 2016, 32, 290–299. [Google Scholar] [CrossRef]
  40. Li, L.; Wei, S.; Huang, Z.; Ye, W.; Cao, H. Spatial Patterns and Interspecific Associations of Three Canopy Species at Different Life Stages in a Subtropical Forest, China. J. Integr. Plant Biol. 2008, 50, 1140–1150. [Google Scholar] [CrossRef]
  41. Cornelissen, J.H.C.; Lavorel, S.; Garnier, E.; Diaz, S.; Buchmann, N.; Gurvich, D.E.; Reich, P.B.; ter Steege, H.; Morgan, H.D.; van der Heijden, M.G.A.; et al. A handbook of protocols for standardised and easy measurement of plant functional traits worldwide. Aust. J. Bot. 2003, 51, 335–380. [Google Scholar] [CrossRef] [Green Version]
  42. Wright, I.J.; Reich, P.B.; Westoby, M.; Ackerly, D.D.; Baruch, Z.; Bongers, F.; Cavender-Bares, J.; Chapin, T.; Cornelissen, J.H.C.; Diemer, M.; et al. The worldwide leaf economics spectrum. Nature 2004, 428, 821–827. [Google Scholar] [CrossRef]
  43. Vaieretti, M.V.; Diaz, S.; Vile, D.; Garnier, E. Two measurement methods of leaf dry matter content produce similar results in a broad range of species. Ann. Bot. 2007, 99, 955–958. [Google Scholar] [CrossRef] [PubMed]
  44. Onoda, Y.; Westoby, M.; Adler, P.B.; Choong, A.M.F.; Clissold, F.J.; Cornelissen, J.H.C.; Diaz, S.; Dominy, N.J.; Elgart, A.; Enrico, L.; et al. Global patterns of leaf mechanical properties. Ecol. Lett. 2011, 14, 301–312. [Google Scholar] [CrossRef] [PubMed] [Green Version]
  45. Kohyama, T.; Suzuki, E.; Partomihardjo, T.; Yamada, T.; Kubo, T. Tree species differentiation in growth, recruitment and allometry in relation to maximum height in a Bornean mixed dipterocarp forest. J. Ecol. 2003, 91, 797–806. [Google Scholar] [CrossRef]
  46. Lin, G.; Stralberg, D.; Gong, G.; Huang, Z.; Ye, W.; Wu, L. Separating the Effects of Environment and Space on Tree Species Distribution: From Population to Community. PLoS ONE 2013, 8, e56171. [Google Scholar] [CrossRef] [Green Version]
  47. Pei, N.; Lian, J.; Erickson, D.L.; Swenson, N.G.; Kress, W.J.; Ye, W.; Ge, X. Exploring Tree-Habitat Associations in a Chinese Subtropical Forest Plot Using a Molecular Phylogeny Generated from DNA Barcode Loci. PLoS ONE 2011, 6, e21273. [Google Scholar] [CrossRef]
  48. Comita, L.S.; Condit, R.; Hubbell, S.P. Developmental changes in habitat associations of tropical trees. J. Ecol. 2007, 95, 482–492. [Google Scholar] [CrossRef]
  49. Harms, K.E.; Condit, R.; Hubbell, S.P.; Foster, R.B. Habitat associations of trees and shrubs in a 50-ha neotropical forest plot. J. Ecol. 2001, 89, 947–959. [Google Scholar] [CrossRef]
  50. Lai, J.; Mi, X.; Ren, H.; Ma, K. Species-habitat associations change in a subtropical forest of China. J. Veg. Sci. 2009, 20, 415–423. [Google Scholar] [CrossRef]
  51. Valencia, R.; Foster, R.B.; Villa, G.; Condit, R.; Svenning, J.C.; Hernandez, C.; Romoleroux, K.; Losos, E.; Magard, E.; Balslev, H. Tree species distributions and local habitat variation in the Amazon: Large forest plot in eastern Ecuador. J. Ecol. 2004, 92, 214–229. [Google Scholar] [CrossRef]
  52. Condit, R. Tropical Forest Census Plots: Methods and Results from Barro Colorado Island, Panama and a Comparison with Other Plots; Springer: Belin, Germany, 1998. [Google Scholar]
  53. Condit, R.; Ashton, P.S.; Baker, P.; Bunyavejchewin, S.; Gunatilleke, S.; Gunatilleke, N.; Hubbell, S.P.; Foster, R.B.; Itoh, A.; LaFrankie, J.V.; et al. Spatial patterns in the distribution of tropical tree species. Science 2000, 288, 1414–1418. [Google Scholar] [CrossRef]
  54. Katabuchi, M.; Kurokawa, H.; Davies, S.J.; Tan, S.; Nakashizuka, T. Soil resource availability shapes community trait structure in a species-rich dipterocarp forest. J. Ecol. 2012, 100, 643–651. [Google Scholar] [CrossRef]
  55. Bivand, R.S. Spatial Econometric Functions. In R. Handbook of Applied Spatial Analysis; Springer: Berlin, Germany, 2010; pp. 53–71. [Google Scholar]
  56. Yang, J.; Zhang, G.; Ci, X.; Swenson, N.G.; Cao, M.; Sha, L.; Li, J.; Baskin, C.C.; Slik, J.W.F.; Lin, L. Functional and phylogenetic assembly in a Chinese tropical tree community across size classes, spatial scales and habitats. Funct. Ecol. 2014, 28, 520–529. [Google Scholar] [CrossRef]
  57. Ding, Y.; Zang, R.; Letcher, S.G.; Liu, S.; He, F. Disturbance regime changes the trait distribution, phylogenetic structure and community assembly of tropical rain forests. Oikos 2012, 121, 1263–1270. [Google Scholar] [CrossRef]
  58. Bagchi, R.; Henrys, P.A.; Brown, P.E.; Burslem, D.F.R.P.; Diggle, P.J.; Gunatilleke, C.V.S.; Gunatilleke, I.A.U.N.; Kassim, A.R.; Law, R.; Noor, S.; et al. Spatial patterns reveal negative density dependence and habitat associations in tropical trees. Ecology 2011, 92, 1723–1729. [Google Scholar] [CrossRef]
  59. Ribeiro, J.; Diggle, P. geoR: A package for geostatistical analysis. R News 2001, 1, 14–18. [Google Scholar]
  60. Kissling, W.D.; Carl, G. Spatial autocorrelation and the selection of simultaneous autoregressive models. Glob. Ecol. Biogeogr. 2008, 17, 59–71. [Google Scholar] [CrossRef]
  61. Gallardo, A. Spatial variability of soil properties in a floodplain forest in northwest Spain. Ecosystems 2003, 6, 564–576. [Google Scholar] [CrossRef]
  62. Laliberte, E.; Legendre, P. A distance-based framework for measuring functional diversity from multiple traits. Ecology 2010, 91, 299–305. [Google Scholar] [CrossRef]
  63. Hao, M.; Zhang, C.; Zhao, X.; von Gadow, K. Functional and phylogenetic diversity determine woody productivity in a temperate forest. Ecol. Evol. 2018, 8, 2395–2406. [Google Scholar] [CrossRef]
  64. Gurevitch, J.; Morrow, L.L.; Wallace, A.; Walsh, J.S. A meta-analysis of field experiments on competition. Am. Nat. 1992, 140, 539–572. [Google Scholar] [CrossRef]
  65. Kembel, S.W.; Hubbell, S.P. The phylogenetic structure of a neotropical forest tree community. Ecology 2006, 87, S86–S99. [Google Scholar] [CrossRef]
  66. Liu, X.; Swenson, N.G.; Zhang, J.; Ma, K. The environment and space, not phylogeny, determine trait dispersion in a subtropical forest. Funct. Ecol. 2013, 27, 264–272. [Google Scholar] [CrossRef]
  67. Oksanen, J.; Blanchet, F.G.; Friendly, M.; Kindt, R.; Legendre, P.; McGlinn, D.; Minchin, P.R.; O’Hara, R.B.; Simpson, G.L.; Solymos, P.; et al. Package ‘vegan’: Community Ecology Package. 2019. Available online: https://cran.r-project.org/web/packages/vegan/vegan.pdf (accessed on 25 April 2019).
  68. Yuan, Z.; Gazol, A.; Wang, X.; Lin, F.; Ye, J.; Bai, X.; Li, B.; Hao, Z. Scale specific determinants of tree diversity in an old growth temperate forest in China. Basic Appl. Ecol. 2011, 12, 488–495. [Google Scholar] [CrossRef]
  69. Borcard, D.; Legendre, P. All-scale spatial analysis of ecological data by means of principal coordinates of neighbour matrices. Ecol. Model. 2002, 153, 51–68. [Google Scholar] [CrossRef]
  70. Team, R.C. R: A Language and Environment for Statistical Computing; R Foundation for Statistical Computing: Vienna, Austria, 2018. [Google Scholar]
  71. Kunstler, G.; Lavergne, S.; Courbaud, B.; Thuiller, W.; Vieilledent, G.; Zimmermann, N.E.; Kattge, J.; Coomes, D.A. Competitive interactions between forest trees are driven by species trait hierarchy, not phylogenetic or functional similarity: Implications for forest community assembly. Ecol. Lett. 2012, 15, 831–840. [Google Scholar] [CrossRef] [PubMed] [Green Version]
  72. Burns, J.H.; Strauss, S.Y. More closely related species are more ecologically similar in an experimental test. Proc. Natl. Acad. Sci. USA 2012, 109, 10605. [Google Scholar] [CrossRef] [Green Version]
  73. Liu, Z.; Fu, B.; Zheng, X.; Liu, G. Plant biomass, soil water content and soil N:P ratio regulating soil microbial functional diversity in a temperate steppe: A regional scale study. Soil Biol. Biochem. 2010, 42, 445–450. [Google Scholar] [CrossRef]
  74. Gross, N.; Liancourt, P.; Choler, P.; Suding, K.N.; Lavorel, S. Strain and vegetation effects on local limiting resources explain the outcomes of biotic interactions. Perspect. Plant Ecol. Evol. Syst. 2010, 12, 9–19. [Google Scholar] [CrossRef]
  75. Grime, J.P. Evidence for the existence of three primary strategies in plants and its relevance to ecological and evolutionary theory. Am. Nat. 1977, 111, 1169–1194. [Google Scholar] [CrossRef]
  76. Michalet, R. Is facilitation in arid environments the result of direct or complex interactions? Commentary. New Phytol. 2006, 169, 3–6. [Google Scholar] [CrossRef]
  77. Poorter, L.; Bongers, L.; Bongers, F. Architecture of 54 moist-forest tree species: Traits, trade-offs, and functional groups. Ecology 2006, 87, 1289–1301. [Google Scholar] [CrossRef]
  78. Petter, G.; Wagner, K.; Wanek, W.; Delgado, E.J.S.; Zotz, G.; Cabral, J.S.; Kreft, H. Functional leaf traits of vascular epiphytes: Vertical trends within the forest, intra- and interspecific trait variability, and taxonomic signals. Funct. Ecol. 2016, 30, 188–198. [Google Scholar] [CrossRef] [Green Version]
  79. Norden, N.; Letcher, S.G.; Boukili, V.; Swenson, N.G.; Chazdon, R. Demographic drivers of successional changes in phylogenetic structure across life-history stages in plant communities. Ecology 2012, 93, S70–S82. [Google Scholar] [CrossRef] [Green Version]
  80. Paine, C.E.T.; Beck, H. Seed predation by neotropical rain forest mammals increases diversity in seedling recruitment. Ecology 2007, 88, 3076–3087. [Google Scholar] [CrossRef] [PubMed]
  81. Dent, D.H.; DeWalt, S.J.; Denslow, J.S. Secondary forests of central Panama increase in similarity to old-growth forest over time in shade tolerance but not species composition. J. Veg. Sci. 2013, 24, 530–542. [Google Scholar] [CrossRef]
  82. Ali, A.; Lin, S.L.; He, J.K.; Kong, F.M.; Yu, J.H.; Jiang, H.S. Tree crown complementarity links positive functional diversity and aboveground biomass along large-scale ecological gradients in tropical forests. Sci. Total Environ. 2019, 656, 45–54. [Google Scholar] [CrossRef] [PubMed]
  83. Shipley, B. Comparative plant ecology as a tool for integrating across scales–Preface. Ann. Bot. 2007, 99, 965–966. [Google Scholar] [CrossRef]
Figure 1. The spatial distribution of the five habitat types (LG, low gully; LS, low slope; HG, high gully; HS, high slope and MR, mountain ridge) with 20 m × 20 m grid cell in the 20-ha DHS plot, China.
Forests 10 01055 g001
Figure 2. Standardized effect size of functional dispersion (ZFDis) of five functional traits across three ontogenetic stages (saplings, juveniles and adults) and five habitat types at 20 m × 20 m spatial scale. (a) SLA: specific leaf area, (b) LA: leaf area, (c) LDMC: leaf dry matter content, (d) LT: leaf thickness, (e) Hmax: maximum height, LG: low gully, LS: low slope, HG: high gully, HS: high slope and MR: mountain ridge. Positive median ZFDis indicates functional overdispersion, and so the community assembly is dominated by biotic interactions. Negative median ZFDis indicates functional clustering, and so the community assembly is dominated by environmental filtering. Error bars were 95% confidence intervals, calculated by the Wilcoxon test.
Forests 10 01055 g002
Figure 3. Standardized effect sizes of functional dispersion (ZFDis) of a multivariate trait (AT) for all trees across five habitat types at 20 m × 20 m spatial scale. See Figure 2 for interpretation details.
Forests 10 01055 g003
Figure 4. Variance partitioning results of trait dispersion (ZFDis, the standardized effect size of functional dispersion) against the soil, topography and space across three ontogenetic stages and all trees at 20 m × 20 m spatial scale. (a) Saplings, (b) juveniles, (c) adults and (d) all trees.
Forests 10 01055 g004
Figure 5. The trait dispersion (FDis) of a multivariate trait (AT) for all trees across four spatial scales. Positive median ZFDis indicates community assembly is dominated by biotic interactions. Negative median ZFDis indicates community assembly is dominated by environmental filtering. Error bars are 95% confidence intervals, calculated by the Wilcoxon test.
Forests 10 01055 g005
Table 1. Criterions and soil properties of five habitat types at 20 m × 20 m spatial scale for 20-ha DHS plot, China.
LGLSHGHSMR
Area (ha)6.924.63.082.922.48
Elevation (m)<326.30<326.30≥326.30≥326.30≥326.30
(297.50 ± 1.61)(311.21 ± 1.64)(382.64 ± 3.66)(393.83 ± 4.39)(389.45 ± 4.79)
Convexity (degree)--<0.00>0.00>0.00
(−4.37 ± 0.26)(3.59 ± 0.32)(−3.59 ± 0.38)(5.00 ± 0.48)(5.45 ± 0.46)
Slope (degree)<33.00≥33.00≥33.00≥33.00<33.00
(31.93 ± 0.76)(34.45 ± 1.16) (35.08 ± 1.06)(33.43 ± 1.10)(31.27 ± 0.98)
pH3.77 ± 0.01a3.78 ± 0.01a3.71 ± 0.01b3.68 ± 0.01c3.74 ± 0.01b
SM (%)19.17 ± 0.23a19.19 ± 0.21a17.91 ± 0.34b17.80 ± 0.31b17.85 ± 0.28b
OM (g kg−1)58.62 ± 0.70c59.61 ± 0.73c62.92 ± 1.76b69.55 ± 1.52a57.64 ± 0.92c
TN (g kg−1)1.11 ± 0.04b1.52 ± 0.06a1.30 ± 0.08a1.06 ± 0.03b1.04 ± 0.04b
AN (mg kg−1)200.66 ± 2.86b219.55 ± 4.29a207.22 ± 5.12b196.47 ± 2.62bc187.18 ± 2.88bc
TK (g kg−1)19.18 ± 0.25a18.73 ± 0.36a16.93 ± 0.27bc17.59 ± 0.30b16.39 ± 0.43c
AK (mg kg−1)63.72 ± 1.66a51.76 ± 1.08b54.18 ± 2.61b53.02 ± 2.09b39.90 ± 0.76c
TP (g kg−1)0.30 ± 0.00a0.28 ± 0.00b0.28 ± 0.01b0.29 ± 0.01ab0.24 ± 0.00c
AP (mg kg−1)1.82 ± 0.09a2.07 ± 0.10a1.76 ± 0.09a1.20 ± 0.07b1.99 ± 0.11a
Different letters within the same row indicate significant differences (Tukey HSD test, p < 0.05) among five habitat types (LG, low gully; LS, low slope; HG, high gully; HS, high slope and MR, mountain ridge). The values of soil properties represent mean ± SE.

