Article

Growth and Needle Properties of Young Pinus koraiensis Sieb. et Zucc. Trees across an Elevational Gradient

1
College of Forest Science, Beijing Forestry University, No.35 Qinghua Donglu, Haidian District, Beijing 100083, China
2
Rocky Mountain Research Station, Forest Service, United States Department of Agriculture, 2500 S. Pine Knoll Drive, Flagstaff, AZ 86001-6381, USA
3
College of Science, Beijing Forestry University, No.35 Qinghua Donglu, Haidian District, Beijing 100083, China
*
Author to whom correspondence should be addressed.
Forests 2019, 10(1), 54; https://doi.org/10.3390/f10010054
Submission received: 5 November 2018 / Revised: 6 January 2019 / Accepted: 7 January 2019 / Published: 11 January 2019
(This article belongs to the Special Issue Physiological Responses to Abiotic and Biotic Stress in Forest Trees)

Abstract

:
A better understanding of the response of plant growth to elevational gradients may shed light on how plants respond to environmental variation and on the physiological mechanisms underlying these responses. This study analyzed whole plant growth and physiological and morphological properties of needles in young Pinus koraiensis Sieb. et Zucc. trees at thirteen points along an elevational gradient ranging from 750 to 1350 m above sea level (a.s.l.) at the end of a growing season on Changbai Mountain in northeastern China. Sampling and analyses indicated the following; (1) many needle properties of P. koraiensis varied with forest type along the elevational gradient though some needle properties (e.g., intrinsic water use efficiency, concentration of chlorophyll, and leaf mass per area) did not change with elevation and forest types; (2) growth was significantly influenced by both forest type and elevation and growth of saplings in P. koraiensis and mixed broadleaved forests was greater than that in evergreen forests and increased with elevation in both forest types; (3) in P. koraiensis and mixed broadleaved forests, there were significant correlations between growth properties and light saturation point, leaf water potential, mean within-crown humidity, annual precipitation, cumulative temperature (≥5 °C), within-crown air temperature, and atmospheric pressure; while in evergreen forests, the leaf C, leaf P content, net rate of light saturation in photosynthesis, water content of soil, within-crown humidity, annual precipitation, cumulative temperature (≥5 °C), within-crown air temperature, and total soil P content displayed a significant relationship with plant growth. These results may help illuminate how P. koraiensis responds to environmental variation and evaluate the adaptive potential of Pinus koraiensis to climate change. Data presented here could also contribute to the more accurate estimation of carbon stocks in this area and to refinement of a plant trait database.

1. Introduction

Variation in biomass accumulation, biomass allocation, and leaf physiological and morphological responses to elevational gradients may reflect adaptations of plants to environmental variation and indicate potential responses to future climatic variability. Ecologists and biogeographers have long been aware of the value of elevational gradients for understanding how plants respond to changes in macroclimate [1]. Elevation affects environmental factors, such as temperature [2], precipitation [3], partial carbon dioxide (CO2) pressure [4], and ultraviolet (UV) irradiance [5] over long periods of time. Hence, elevational gradients can serve as powerful case studies for understanding longer-term, larger-scale plant responses to environmental changes as a complement to controlled experiments [6,7].
Changes in temperature, precipitation, partial CO2 pressure and UV irradiance affect biomass accumulation [8], biomass allocation [9], photosynthetic leaf characteristics [10,11], plant water status [12], chlorophyll concentrations in leaves [13], leaf mass per area [14], and leaf nutrients [15] along elevational gradients. Annual biomass accumulation reflects the growth of plants directly. Biomass allocation tends to optimize allocation to components where resources are the most limited. For example, plants growing in nutrient-poor soils may preferentially allocate biomass to roots: where light is a limiting factor, biomass preferentially accrues to leaves [16]. Photosynthesis is one of the most important physiological parameters for all aspects of plant growth [17,18]. Many indices quantify processes related to photosynthesis. The apparent quantum yield (AQY, mol·mol−1) may indicate weak light utilization efficiency [19]. The light saturation point (LSP, μmol·m−2·s−1) measures the ability of a plant to adapt to strong light [20,21]. The net rate of light saturation in photosynthesis (Asat, μmol CO2·m−2·s−1) indicates maximum photosynthetic potential [22]. Stomatal conductance (Cond, mol H2O·m−2·s−1) is related to both carbon fixation and leaf transpiration [23]. Intrinsic water use efficiency (iWUE, μmol CO2·mmol−1 H2O), calculated as Pn/Cond, is reported to stimulate tree growth in some high elevational areas [24]. Many studies have shown that the spectral water band index (WI) can be used to predict plant water status: leaf water potential [25]. Composition and concentration of chlorophyll influence the photosynthetic capacity of leaves [26]. Leaf mass per area (LMA, g·m−2) is a measure of the light harvesting surface for a given amount of dry matter investment, also closely related to plant growth [27]. On the other hand, leaf nutrients are important to plant ecophysiological processes; for example, relative and absolute leaf nitrogen content are highly correlated with plant photosynthetic capacity [28]. Therefore, responses of photosynthetic characteristics, water relations, chlorophyll concentrations, leaf mass per area, and leaf nutrient levels to elevational gradients may reflect responses and adaptations of plants to environmental variation.
The primeval forest on Changbai Mountain is a well preserved temperate mountain forest ecosystem in northeast China [29]. This region is at the ecological limit of many species which are thus very sensitive to climatic changes but also has experienced climate warming during the past 50 years [30]. Hence, Changbai Mountain has become an important area for study and conservation in China. The Changbai Mountain ecosystem has characteristics typical of montane forests at similar ranges of elevation. At elevations from 750 to 1100 m, Pinus koraiensis and mixed broadleaved forests (PBMF) are dominated by Pinus koraiensis Sieb. et Zucc., Tilia amurensis Rupr., Populus davidiana Dode, and Betula platyphylla Suk. From 1100 to 1700 m, evergreen coniferous forests (ECF) are dominated by Larix olgensis Henry, Picea jezoensis Carr., and Abies nephrolepis (Trautv.) Maxim., but Pinus koraiensis is also present. Between 1700 and 1950 m, Betula ermanii is the dominant species. Beyond this elevation and up to 2691 m, the landscape consists of tundra [31,32]. The incline in the topography has made this region an ideal place for studying the ecophysiology of alpine trees along an elevational gradient.
Pinus koraiensis is one of the three major five-needle pines in the northern hemisphere, and is the most abundant coniferous species in the Changbai Mountain landscape [33]. It plays an important role in maintaining biodiversity and providing ecosystem services in East Asia. This native pine is also an economically valuable species because of its edible pine nuts and high-quality wood products [34]. The essential oil of Pinus koraiensis needles contains properties valuable in treating high cholesterol and colorectal cancer [35,36]. In recent decades, extreme freezing, forest fires, pests, and diseases caused by extreme weather events and overutilization have degraded the natural Pinus koraiensis forest, so considerable efforts have been made to preserve Pinus koraiensis [37,38]. Studies of Pinus koraiensis saplings report that natural regeneration of Pinus koraiensis, considered to be shade tolerant, takes place even under dense canopies, where young plants may survive under such conditions for 10 to 20 years [39]. Long-term survival and establishment of forests are often associated with the young trees’ leaf properties in the understory [40]. To date, no research has dealt with growth and needle property responses to an elevational gradient in wild Pinus koraiensis saplings.
To explore these relationships, Pinus koraiensis saplings of the same age and under the same light condition (represented by canopy openness) were sampled along an elevational gradient from 750 to 1350 m a.s.l. by 50 m increments on Changbai Mountain (above 1350 m a.s.l., few Pinus koraiensis saplings were found). We focused on three subjects: (1) needle properties of young Pinus koraiensis trees across an elevational gradient in two forest types; (2) effects of elevation on growth of Pinus koraiensis in two forest types; and (3) needle characteristics, soil properties, and atmospheric indices that may influence the growth of Pinus koraiensis in two forest types. Results of this study may help in illuminating how Pinus koraiensis saplings respond to environmental variation and which physiological and morphological mechanisms are at work.

2. Materials and Methods

2.1. Study Area

The sampling area of this study was on the north slope of the Changbai Mountain Natural Reserve (42°25′–42°09′, 128°04′–128°55′) in Jilin Province, northeastern China. The study transected the Pinus koraiensis distribution (750–1350 m a.s.l.) and crossed two vegetation types (PBMF and ECF) free from anthropogenic disturbance. The climate is a continental monsoon type with long, cold winters; hot, rainy summers; mean annual precipitation (RIA) of 644.25–820.89 mm; and cumulative temperature (≥5 °C, ACT5) of 1682.26 to 2388.28 °C [41]. The mean within-crown temperatures (WCT) decreased by 0.68 °C and the mean within-crown levels of humidity (WCH) increased by 0.93% with each 100 m increase in elevation during the growing season [32] (Table 1). Soil properties are summarized in Table 2.

2.2. Plant Materials

Five healthy Pinus koraiensis saplings (n = 5; N = 65; >300 m apart from each other at each elevation) up to 97 ± 30 cm in height, without any evident damage or deformed shape, at seemingly the same age (35 years ± 5) were selected randomly as sample trees in the understory of this natural forest at each elevation from 750 to 1350 m at thirteen 50 m intervals of the transect. All saplings were located under a closed canopy layer with approximately the same light conditions. Tree height, basal stem diameter, crown length (S–N), crown width (E–W), and canopy openness were recorded and are summarized in Table 3.

2.3. Canopy Openness

Understory light conditions were measured by hemispheric photography. Canopy openness was defined as the fraction of open sky in a hemisphere, visible from a point beneath the canopy [42]. A camera (Nikon Coolpix 950 with FC-E8 fisheye; Nikon Corp., Tokyo, Japan) was leveled and oriented above each sapling and then pictures were taken with its fisheye lens. The photographs were analyzed using the Adobe Photoshop® (San Jose, CA, USA) software to calculate the ratio of the canopy area to the entire sky area as a measure of canopy openness [43]. The pictures were taken during the morning on the same day as the photosynthetic measurements.

2.4. Soil Properties

Soils near each sapling were collected with soil corers (6 soil cores for each sapling). Organic and mineral layers of each core were separated and then the organic layer was screened. After the stones and plant residues were set aside, the organic layer of each sapling was thoroughly mixed and spread on shallow aluminum trays, and then air-dried. Next, the air-dried samples were finely ground and homogenized for the nutrient determination. Soil pH (pH soil) was determined from a deionized water-based saturated paste extract. The total soil carbon content (C soil) was determined by a simplified colorimetric method [44]. The soil total nitrogen content (N soil) was determined by the semimicro Kjeldahl method [45]. Total soil phosphorus content (P soil) was determined by a colorimetric method [46]. Soil water content (WC soil) is defined as the dry weight divided by the wet weight of the soil.

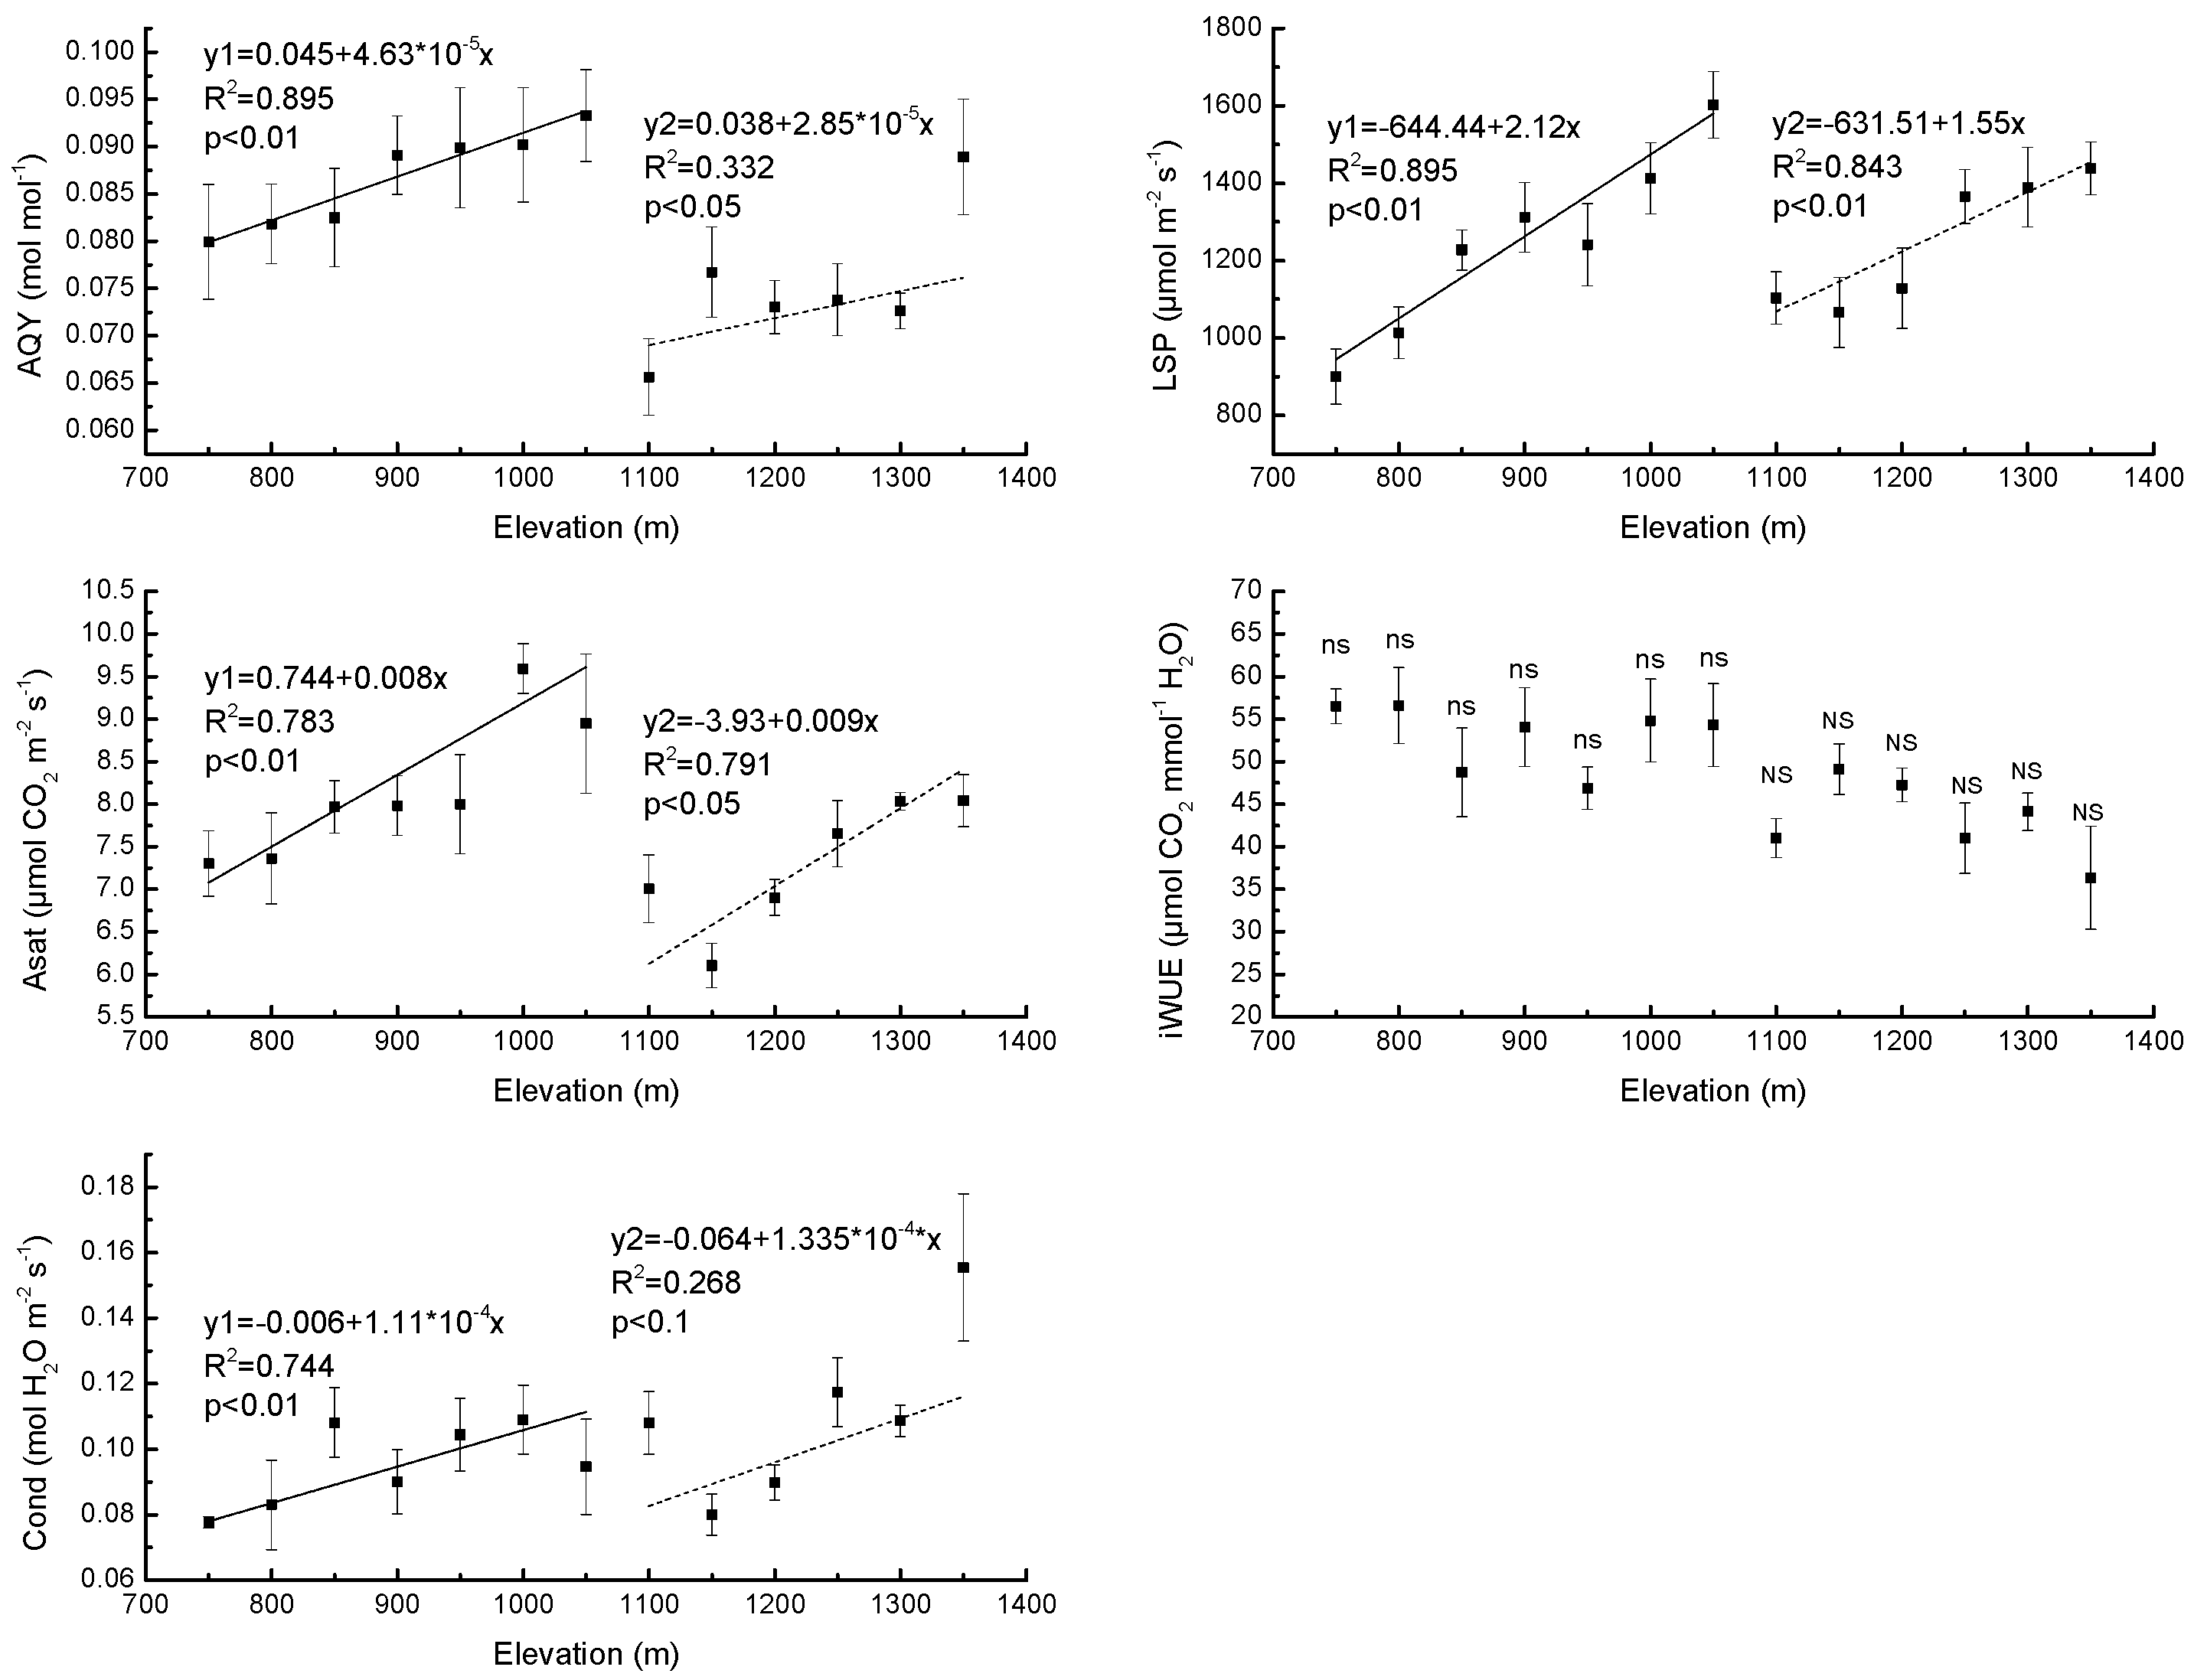
2.5. Needle Gas Exchange

Because we used saplings, that photosynthesis could be measured without cutting any branches from trees. We also decided to take needle samples at the end of the growing season in 2014, as suggested by Shi et al. [47]. Photosynthetic light response curves for each young tree were obtained from fully expanded, mature, and visibly healthy one-year-old needles. Five young trees were measured on clear and sunny days at each elevation. Determinations were taken in situ with a portable photosynthetic system (LI 6400, Li-Cor, Lincoln, NE, USA) with a built-in red-blue light source (LI-6400-02B). Measurements were taken from low to high elevations of CO2 levels maintained at 380 m·mol·mol−1, temperature at 25 ± 1 °C, water vapor within leaf chamber at 21 ± 1 m·mol·mol−1, and a constant flow rate at 500 mL·min−1.
A pre-experiment was conducted to determine the saturation light intensity. Before measurements for the light response curves, needles were given a dose of photosynthetically active radiation (PAR) of 1000 μmol·m−2·s−1 (approximately equal to the saturation light intensity) for at least 10 min in the chamber until CO2 uptake was steady-state, where steady-state in practice means that CO2 uptake shows no systematic increase or decrease (±2%) over a 5 min period. This is important to ensure a steady-state activation of Rubisco. Measurements were taken at 14 different light levels (2100, 1800, 1500, 1200, 900, 600, 400, 200, 150, 100, 50, 20, 10, and 0 μmol·m−2·s−1) and recorded automatically. The minimum waiting time was 90 s and the maximum 120 s at each light level. After the measurements, projected areas of measured needles were determined with a scanner using leaf area analysis software. Since the needles are three-sided, the red-blue light illuminated the largest needle side. All rates of gas exchange were based on the projected needle area. Predicted nonlinear light response curves were constructed and fit the observations well (R2 > 0.99). Last, we calculated the photosynthetic parameters (AQY, LSP, Asat, WUE, and Cond) from the light response curve data. According to the relationship between PPFD and Pn, light-response curves of Pinus koraiensis at different elevations were fitted by a nonlinear model [48]:
P ( I ) = α 1 2 β I β γ I 2 + ( γ + β ) Ic ( 1 + γ I ) 2

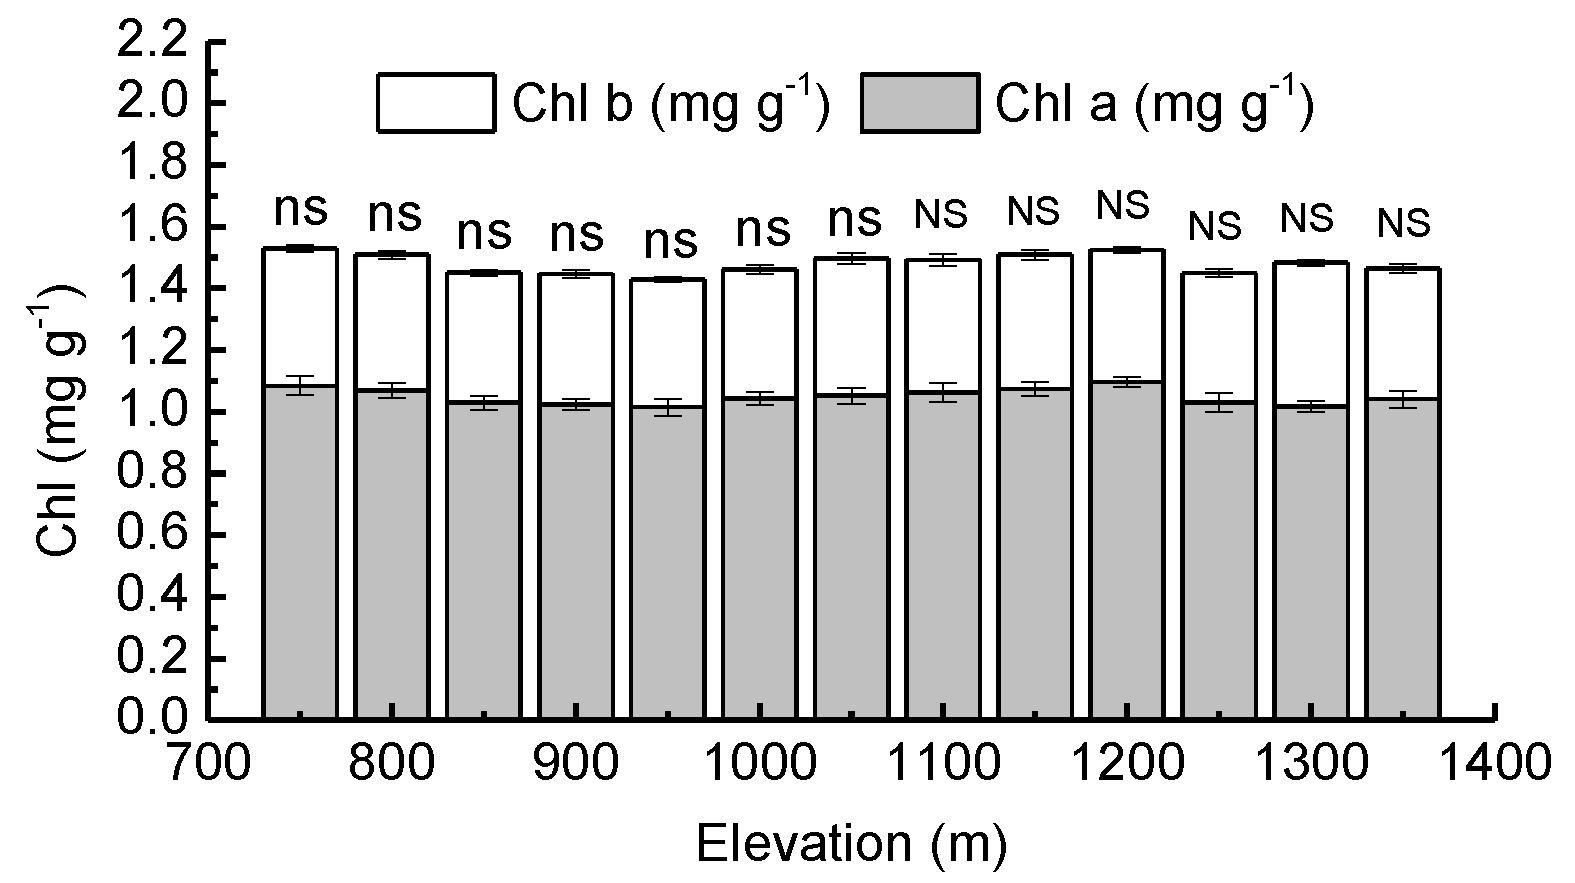
2.6. Needle Chlorophyll Concentration

The five groups of one-year-old needles mentioned earlier were used to determine the difference in the amount of needle chlorophyll. The chlorophyll from these fresh needles was extracted with an 80% (v/v) acetone solution by grinding and centrifuging methods and their concentrations quantified, using a 722 spectrometer (the 3rd Analytical Instrument Company of Shanghai, Shanghai, China). The amounts of chlorophyll a (Chl a, mg·g−1), chlorophyll b (Chl b, mg·g−1), and total chlorophyll (Chl, mg·g−1) were expressed as the amount of chlorophyll per fresh needle mass. In our calculations, we used the equation by Arnon [49]:
Chl   a = 12.7 × OD 663 2.69 × OD 645 ;   Chl   b = 22.9 × OD 645 4.86 × OD 663 ;   Chl                    = Chl   a + Chl   b
where OD645 and OD663 are the optical densities at wavelengths of 645 nm and 662 nm, respectively.

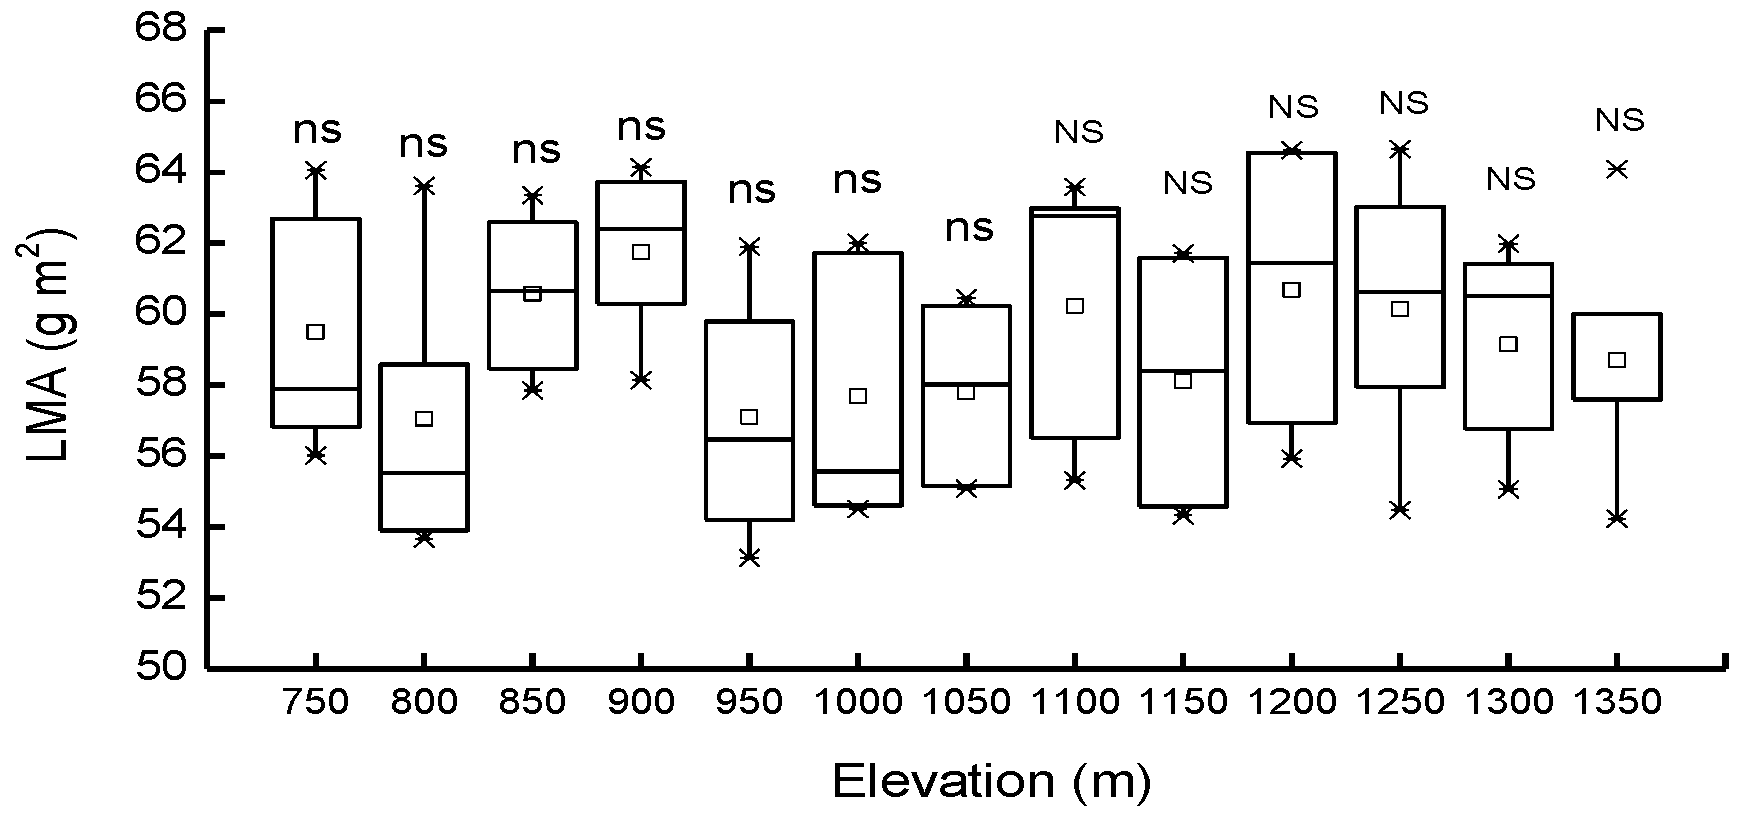
2.7. Needle Morphological Trait

Projected areas of the five groups of one-year-old needles from five saplings at each elevation were determined. Needles were laid out and scanned separately (CanoScan LiDE 120, Tokyo, Japan), with a reference object for scale. The total projected needle area for each sapling was calculated with image processing software (Image J; National Institute of Mental Health, Bethesda, MD, USA) [50]. Then, these needles were oven-dried (75 °C, 72 h) to a constant weight to obtain their dry weight and the LMA (g·m−2) of each sapling was calculated.

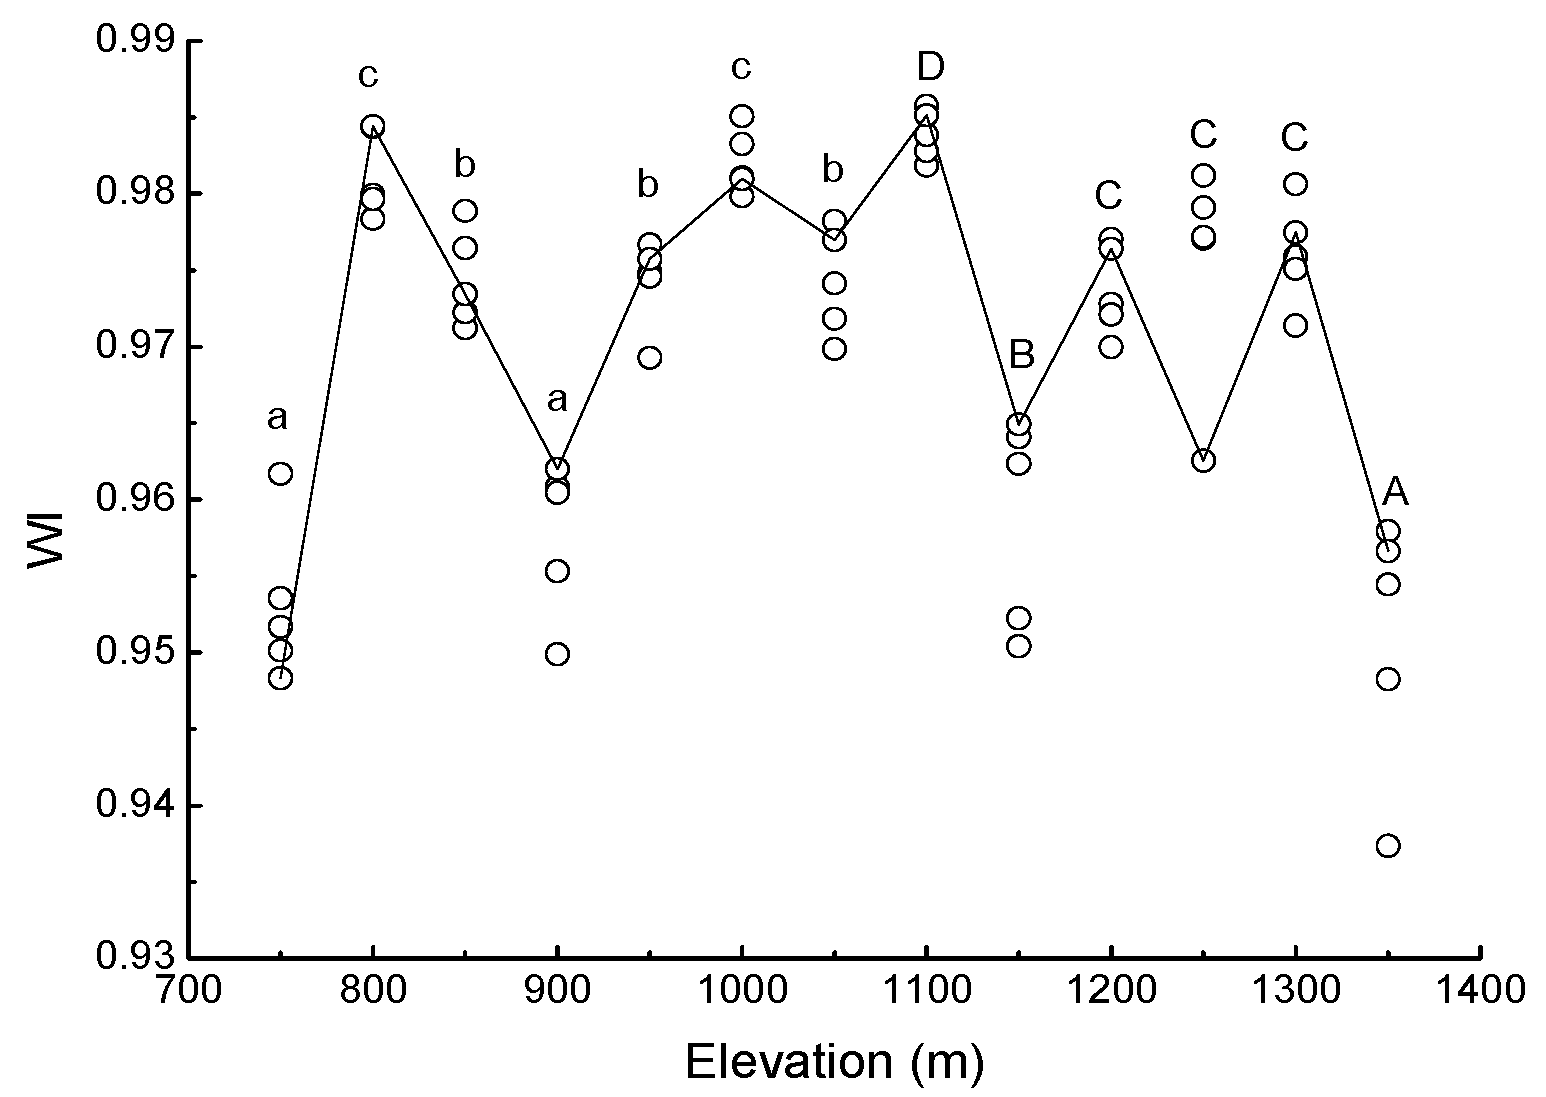
2.8. Needle Water Band Index

Thirty one-year-old needles from each of the five similar saplings at each elevation were selected. They were sampled evenly in five directions, south, east, north, west, and central. Spectral reflectance, at wavelengths from 310 to 1130 nm, was measured using a UniSpec Spectral Analysis System (PP Systems, Haverhill, MA, USA) with a 0.5 mm diameter optical fiber and an internal 5 V halogen lamp. Last, spectral water band index (WI = R900/R970) was calculated to characterize the plant water potential [51], where R900 and R970 are spectral reflectance at a wavelength of 900 nm and 970 nm, respectively.

2.9. Growth Properties

We harvested the 65 saplings and divided each into current-year needles, current-year branches, one-year-old needles, one-year-old branches, stems, and roots after measuring the gas exchange, chlorophyll concentration, spectral reflectance, and LMA of needles. Biomass samples were oven-dried (75 °C, 72 h) to a constant moisture level to obtain the dry weight of their current-year needle biomass (CN, g), their current-year branch biomass (CB, g), their one-year-old needle biomass (ON, g), and their one-year-old branch biomass (OB, g). The current-year needle biomass/total biomass ratio (CNR) and one-year-old needle biomass/total biomass ratio (ONR) of each sapling were then calculated.

2.10. Needle Nutrients

We finely ground and homogenized the dried one-year-old needles for the nutrient determination. Leaf C, N, and P content per unit leaf mass were determined by the same methods as the soil.

2.11. Statistical Analyses

Before our analyses, we tested for homogeneity of variances and normality of the data. All data were found to meet the requirements of the one-way analysis of variance (ANOVA) assumptions. Differences among means were determined by a Duncan’s test at a significance level of <0.05. ANOVAs were used to test the effects of elevation on the various variables. Relationships between photosynthetic parameters, growth parameters, and elevational gradient were determined using a general linear regression model for each forest type. Pearson’s correlation coefficients were used to detect the relationships between growth and other variables. Multivariate analysis of variance was used to help determine whether changes in elevation and forest type had significant effects on growth parameters. Redundancy analysis was used to identify the relationship between the leaf characteristic parameters, atmospheric index, soil factors, and growth data using the R vegan software package.

3. Results

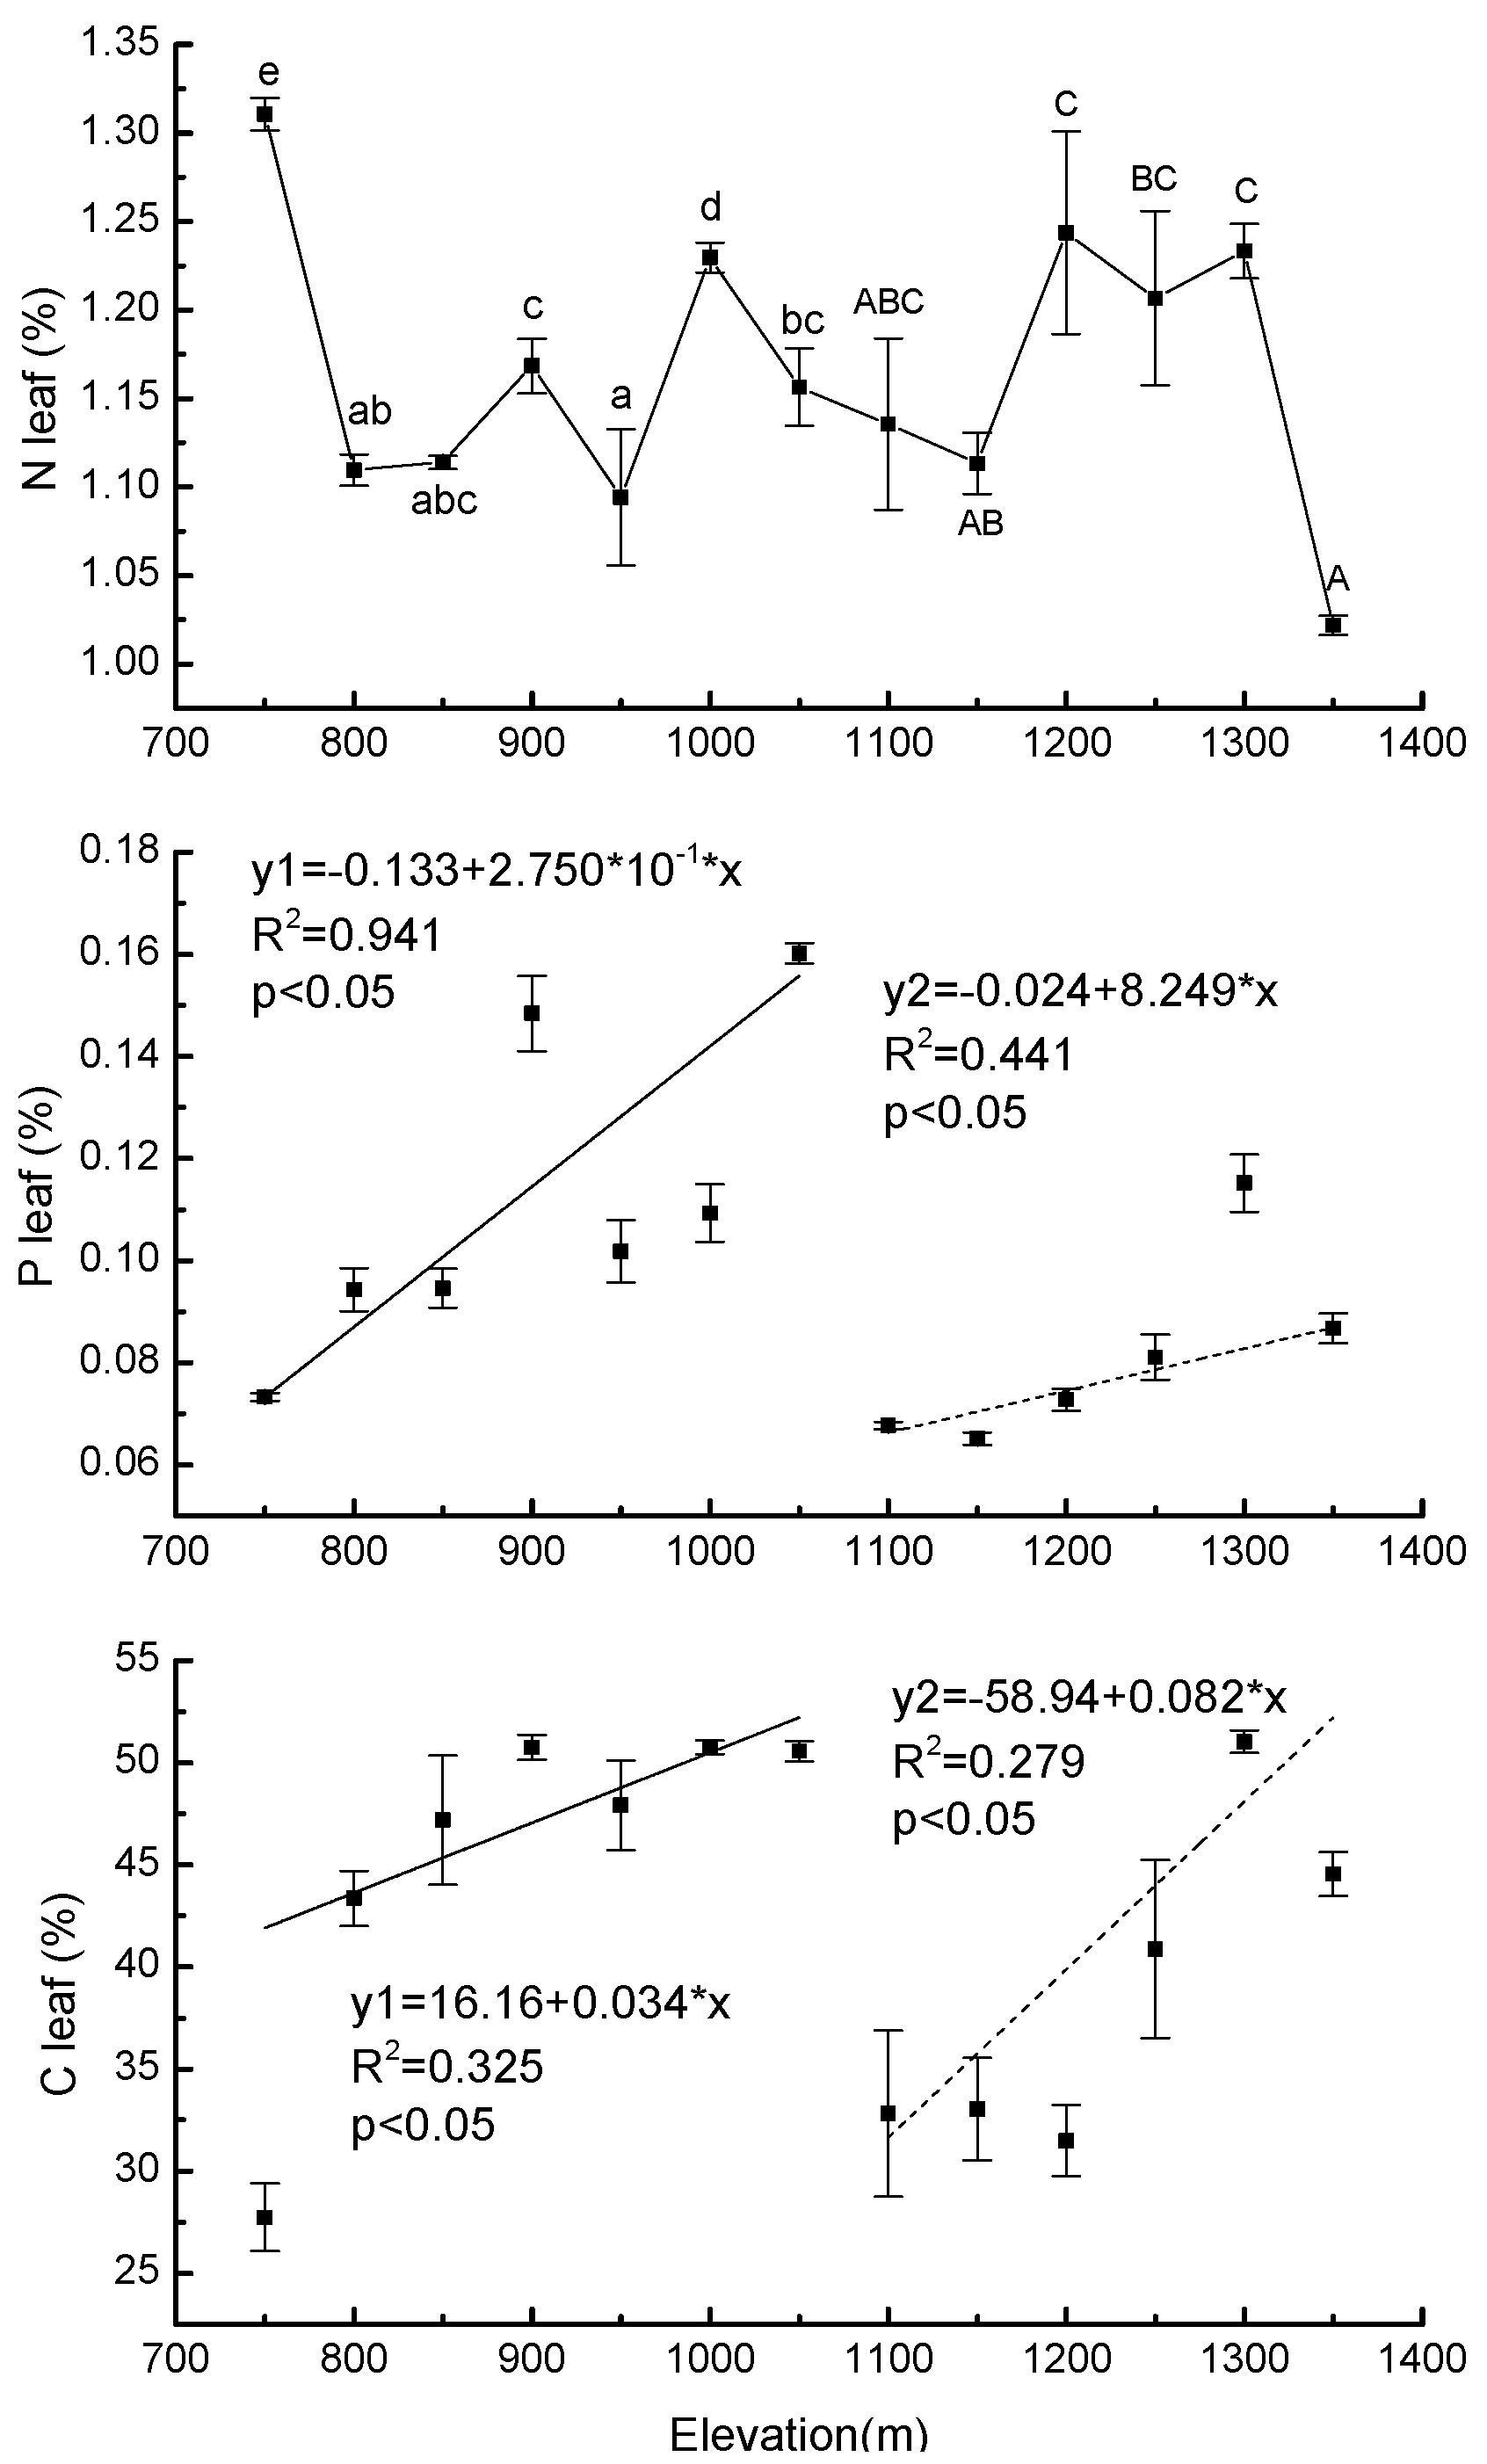
3.1. Needle Properties of Young Pinus koraiensis Trees along an Elevational Gradient in Two Different Forest Types

The AQY increased with elevation in PBMF, i.e., when elevation was below 1100 m (R2 = 0.90, p < 0.01) and also followed a monotonic trend with respect to elevation in ECF, (R2 = 0.33, p < 0.05) (Figure 1). The LSP increased with elevation in both PBMF (R2 = 0.90, p < 0.01) and ECF (R2 = 0.84, p < 0.01) (Figure 1). Area-based Asat was also observed to increase with elevation in PBMF (R2 = 0.78, p < 0.01) and ECF (R2 = 0.79, p < 0.01) (Figure 1). The results showed no significant differences (p > 0.05) between iWUE at various elevations in either PBMF or ECF (Figure 1). In addition, Cond increased with elevation in PBMF (R2 = 0.74, p < 0.01) (Figure 1).
There were no significant differences (p > 0.05) between the average needle Chl a, Chl b and total needle chlorophyll from various elevations. Taking all elevations into account, Chl a in needles ranged between 1.02 and 1.08 mg·g−1, Chl b ranged between 0.41 and 0.45 mg·g−1 and total needle chlorophyll ranged between 1.42 and 1.53 mg·g−1. Chl a, Chl b, and total needle chlorophyll were observed to be not significantly (p > 0.05) affected by forest type (Figure 2).
Water band index was greatest at 1100 m (WI = 0.9838 ± 0.0007), and smallest at 1350 m (WI = 0.9509 ± 0.0378). With increasing elevation, the WI changed frequently (Figure 3).
Differences in LMA among the populations from different elevations were not significant (p > 0.05), either in PBMF or in ECF. LMA was also observed to be not significantly (p > 0.05) affected by forest type; mean values were 58.8 and 59.5 g·m−2 in PBMF and ECF, respectively (Figure 4).
There was a significant difference in Nleaf at different elevations in each forest type. Values ranged from 1.09% (±0.04) to 1.31% (±0.01) in PBMF and from 1.02% (±0.01) to 1.24% (±0.006) in ECF (Figure 5). In both PBMF and ECF, Pleaf increased with elevation (R2 = 0.94, p < 0.05 for PBMF, R2 = 0.44, p < 0.05 for ECF) (Figure 5). The lowest Cleaf (27.73% ± 1.67) occurred at an elevation of 750 m. At an elevation of 1050 m, Cleaf was 45% higher than at 750 m. In ECF, Cleaf increased by 38% from the lowest to the highest elevation (Figure 5).

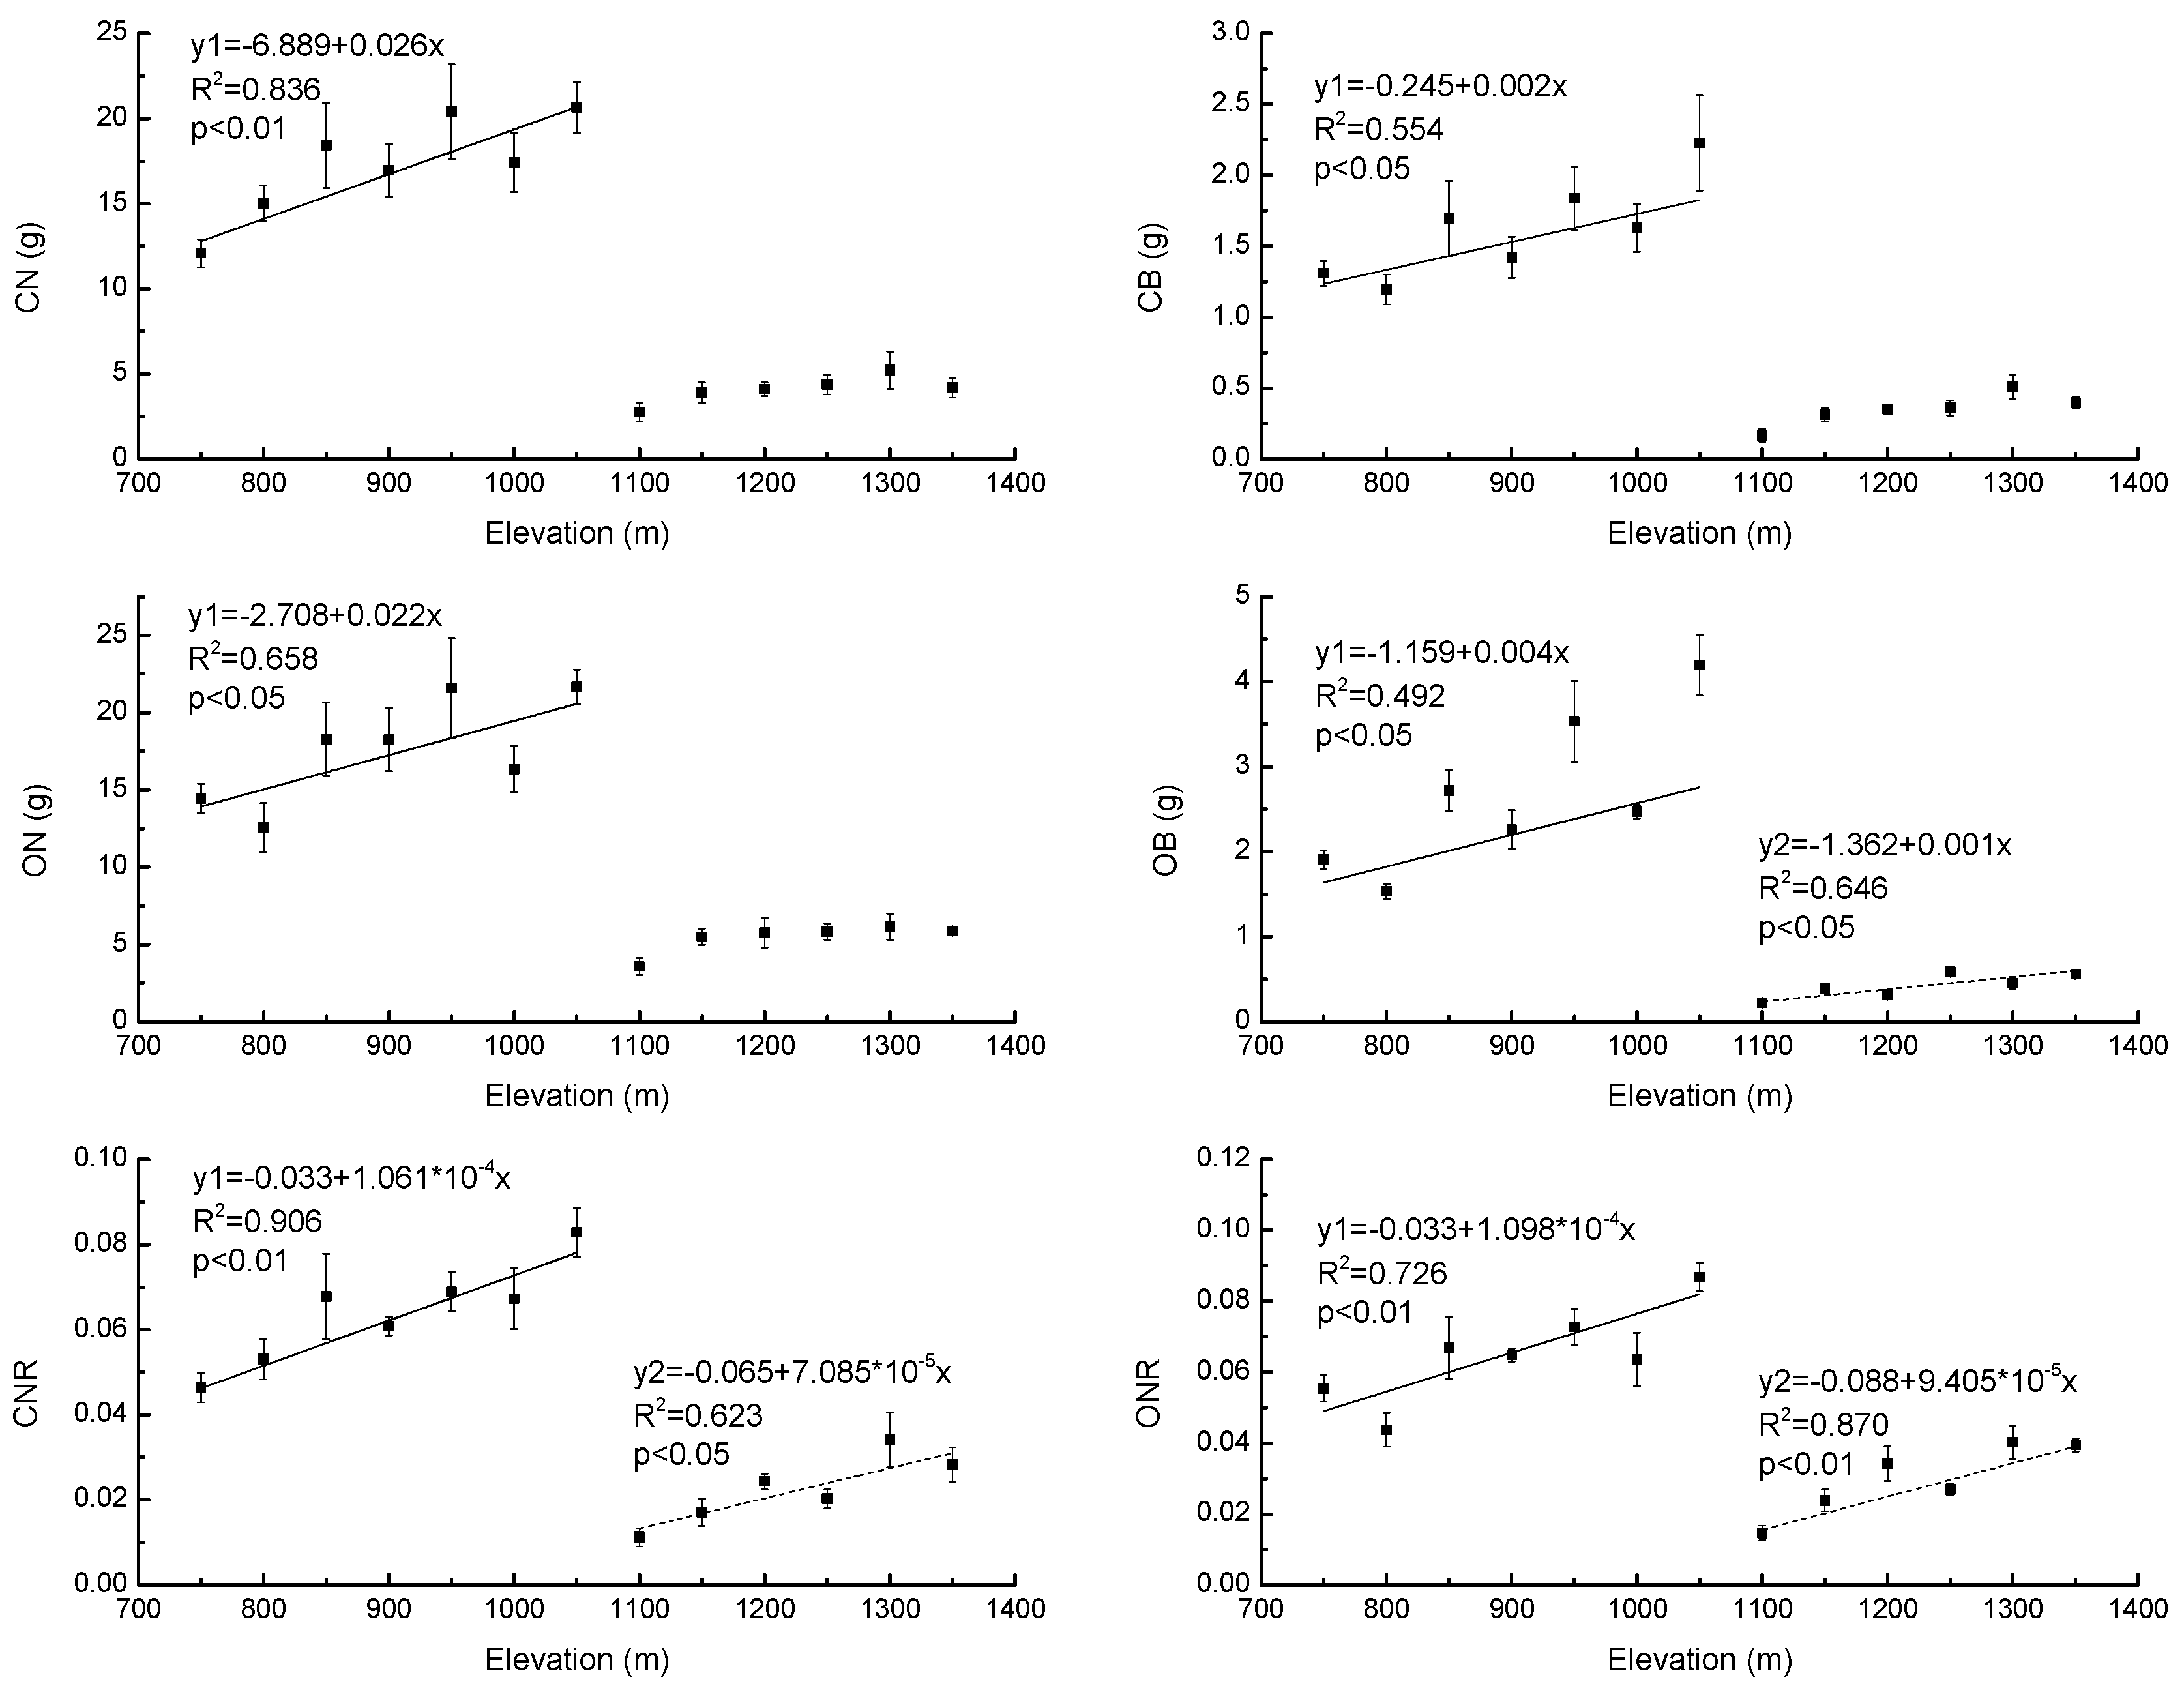
3.2. Growth Properties of Young Pinus Koraiensis Trees along an Elevational Gradient in Two Different Forest Types

Forest type and elevation had significant effects on the growth properties CN, CB, ON, OB, CNR, and ONR (Table 4).
Our results showed that CN, CB, ON, OB, CNR, and ONR increased significantly with increasing elevation (R2 = 0.84, p < 0.01; R2 = 0.55, p < 0.05; R2 = 0.66, p < 0.05; R2 = 0.49, p < 0.05; R2 = 0.91, p < 0.01 and R2 = 0.73, p < 0.01, respectively) in PBMF (Figure 6). In ECF, OB, CNR, and ONR also increased significantly with increasing elevation (R2 = 0.65, p < 0.05) (Figure 6). There were also significantly higher (p < 0.05) CN, CB, ON, OB, CNR, and ONR values of Pinus koraiensis in PBMF when compared to the saplings in ECF (Table 5).
Results of redundancy analysis showed that the needle properties could explain 42.26% of the differences in growth in PBMF. The first two RDA axes explained 93.05% of the total variance of the relationship between the growth indices and the needle properties. The first RDA axis primarily reflected the changing trend of Nleaf, LMA and WI values. The correlation coefficients between these three factors and the first RDA axis were −0.41, −0.52, and 0.66, respectively. The second RDA axis primarily reflected the changing trend of Chl a, TC, and LSP, and correlation coefficients with the sorting axis were −0.39, −0.45, and 0.48. Growth index CN was positively correlated with WI, Chlb, and TC, and growth index OB was positively correlated with LSP (Figure 7). Correlation analysis indicated that the growth index CN was positively correlated with Pleaf, Cleaf, LSP, and WI, and the growth index OB was positively correlated with Pleaf, Cleaf, and LSP (Table 5). These showed that WI and LSP were factors that significantly affect growth of Pinus koraiensis in PBMF. RDA and correlation analysis showed that growth of Pinus koraiensis was significantly correlated with Pleaf, Cleaf, and Asat in ECF (Figure 7, Table 5).
The redundancy analysis of growth properties and environmental factors revealed that environmental factors could explain 45.11% of growth changes in PBMF, and 97.03% of the total variance of the relationship between growth and environmental factors was explained. The first sorting axis primarily reflected the changing trend of WC soil, N soil, and P soil. The correlation coefficients of these three factors and the first sorting axis were 0.78, −0.35, and −0.21, respectively. The second RDA axis primarily reflected the changing trend of Pair, RIA, ACT5, WCH, and WCT, and their correlation coefficients with the RDA axis were 0.72, −0.64, 0.65, −0.65, and 0.65. As can be seen from the RDA diagram, growth indicator OB was positively correlated with WCH and RIA, and negatively correlated with ACT5, WCT, and pH soil in PBMF (Figure 7). Correlation analysis also showed that growth index OB was positively correlated with WCH and RIA, and negatively correlated with WCT, ACT5, and Pair (Table 6). These results indicate that growth indicators were significantly influenced by WCH, RIA, WCT, ACT5, and Pair in PBMF; WCT, WCH, ACT5, RIA, WC soil, and P soil were the most relevant environmental factors limiting the growth of Pinus koraiensis in ECF (Figure 7, Table 6).

4. Discussion

4.1. Response of Needle Properties to Elevational Gradient in Two Different Forest Types

Differences in photosynthetic characteristics of Pinus koraiensis between high and low elevation plants have been documented in our study. We showed that AQY, Asat, and LSP increased significantly with the increase in elevation for both PBMF and ECF. These results indicate that the ability to utilize weak light, the ability to adapt to strong illumination and maximum photosynthetic potential increase with elevation in both PBMF and ECF. Further, the AQY and Asat of PBMF are greater than those of ECF. There was no significant elevational difference in iWUE in either PBMF or ECF, suggesting a simultaneous decrease in photosynthesis with water deficit-induced lower stomatal conductance along the elevational gradient in each forest type. The maximum photosynthetic potential in plants at a given elevation has been variously found to be equal, lower, or higher at higher elevations compared to lower elevations [52]. A previous study showed that conifer populations from high elevations have evolved to exhibit higher maximum rates of CO2 assimilation than trees from low elevations [53]. There is also some previous evidence that photosynthetic capacity decreases with increasing elevation [54,55], which may be caused by lower activity of Rubisco [52]. These inconsistent results may be explained by differences in plant material, equipment, elevational range, and conditions [55]. Photosynthesis is dependent on stomata for its supply of CO2 [56]. It is generally accepted that photosynthesis increases when the stomata open and decreases when the stomata close [57,58]. However, a study by Farquhar and Sharkey (1982) [59] provided no evidence of a positive correlation between photosynthesis and Cond. Our study shows that Asat is affected primarily by stomatal factors in each forest type. Kumar et al. [60] reported that the Cond displayed some degree of plasticity in response to elevation and suggested that this could be one of the adaptive features allowing a wider elevational distribution of plants.
The chlorophyll concentration may be an important nonstomatal factor that affects the photosynthetic characteristics of plants. Studies have shown steady declines in total chlorophyll concentrations over an elevational range from 650 m a.s.l. to 1950 m a.s.l. [61]. Chlorophyll degradation is generally related to stress [62]. With increasing elevation, plants are often exposed to low temperatures, large diurnal temperature fluctuations, high UV-B radiation, and low partial CO2 pressures: these conditions are harmful to chlorophyll formation and conducive to chlorophyll degradation, thus serving as negative factors for plant growth [63,64]. It has also been reported that high elevation populations tend to have higher leaf chlorophyll concentrations than those from low elevations [65]. Higher chlorophyll concentrations could increase leaf photosynthetic efficiency as an important protective strategy for a harsher alpine environment [66]. In our study, the chlorophyll concentration in needles did not change significantly with increasing elevation in PBMF or ECF, nor was it correlated with AQY, LSP, and Asat. The elevational disparity may not be large enough to affect the needle chlorophyll concentration of Pinus koraiensis saplings.
Stomatal closure occurs when water availability is reduced [67]. Stomatal conductance may be a good indicator of plant water status, but it indicates only a short-term response [68]. The water band index (WI) can track variation in stomatal aperture [69], so it has utility for predicting components of plant water status including leaf water potential [25], relative water content [70] and water content as a percentage of dry mass [71]. The present study shows that WI varied significantly with elevation, and this result based on the soil moisture content for each forest type at the time of study.
LMA is a widely used index in functional ecology because it is thought to reflect relative growth and important physiological traits, such as photosynthetic rate. An increase in LMA with increasing elevation has been generally reported in natural populations of herbs and shrubs [72], conifers [73], and broadleaved tree species [74,75] and across a wide spectrum of tree taxa reaching the tree line [76]. LMA was also found to remain constant along narrow elevational gradients [77,78,79] or even to decrease [80]. Additionally, earlier studies have suggested that greater photosynthetic capacity is often related to higher levels of LMA, which is enhanced by ambient irradiance leading to facilitated growth [81,82,83]. Differences in the accumulation of starch or the number of palisade cell layers [84] are likely to result in inconsistent findings. Plants growing under low irradiance have thinner leaves, consequently having lower LMA [85]. Here, we found no elevational differences in LMA, possibly because the plants we sampled spend long periods of time in the understory. This would be an advantage for the survival of Pinus koraiensis seedlings and saplings [83,86], although further investigation is needed.
The C leaf and P leaf ranges of needles in Pinus koraiensis were consistent with the results of previous studies [87]. The range of total nitrogen content in leaves of Pinus koraiensis was also consistent with that of previous measurements [88]. Significant differences in N leaf were detected in both forest types, but these responses to elevational gradients varied nonlinearly with increasing elevation, which was similar to previous studies on spruce [89]. The content of total leaf nitrogen in samples at the lowest elevation was the highest and the content in the highest elevation was the lowest, because N is relatively less limiting due to high rates of plant turnover and decomposition as well as abundant N fixers at low elevations [90]. The increase in P leaf in sampled saplings with increasing elevation in both forest types may result from leaching of highly weathered soils, as well as chemical processes that immobilize P within the soils [91]. Our results suggested increased N limitation and decreased P limitation with increasing elevation, results consistent with studies by Fisher et al. [15]. Additionally, our elevational variation of leaf photosynthetic characteristics explained the elevational variation of leaf carbon content well although further research is needed in this area due to our small sample size.
There are striking differences in many leaf traits between sun-exposed and shade leaves, such as leaf photosynthesis and chlorophyll concentration [92], LMA [93], leaf water potential [94], and leaf nutrients [95]. Elevational variation observed in this study could be related to changes in sun-exposed leaves, in shade leaves or in both. As leaves in this study were not differentiated between sun and shade, we cannot distinguish any effect of type of leaves upon these traits. Future investigations should account for these potential differences.

4.2. Response of Growth Properties to Elevational Gradient in Two Different Forest Types

Elevational gradient and forest type affect the growth of plants. Studies have shown that growth does not follow a simple linear trend as a function of elevation. Based on data from a tropical forest transect in the Peruvian Andes, Girardin et al. [96] demonstrated that net primary productivity does not vary linearly with elevation. Analyzing data from 2400 trees across a 1650 m elevational gradient in Kosnipata Valley, Peru, Rapp et al. [97] also found that growth does not show a consistent trend with elevation within species, although higher-elevation species had lower growth rates than lower-elevation species. In our study, the absolute annual biomass accumulation (CN, CB, ON, and OB) of Pinus koraiensis increased with increasing elevation in both PBMF and ECF. However, an inflection point was observed at the junction of these two forest types; furthermore, the average CN, CB, ON, and OB in PBMF were significantly higher than those in ECF.
Growth in PBMF increased with increasing elevation within a certain temperature range, a pattern that may be largely determined by precipitation. Based on data from ring-width chronologies, Yu et al. [98] found that precipitation in the previous September and the current June is the primary limiting factor for growth of Pinus koraiensis at low-elevation sites. Higher precipitation in September results in a greater amount of moisture available in the soil, a condition advantageous to the growth of Pinus koraiensis in the next year [30]. Precipitation (including that in the previous September and the June) increases with an increase in elevation [41], which would be the main reason why the absolute biomass and relative growth rate increase with increasing elevation of PBMF. Wang et al. (2013) [30] built regression equations to predict the future growth of Pinus koraiensis under future climate change scenarios. They found that the radial growth of Pinus koraiensis will increase at higher elevations relative to lower elevations, which is consistent with our findings. Results of redundancy and correlation analysis indicated that the growth of Pinus koraiensis was significantly affected by LSP as well as WI, WCH, and RIA in PBMF. This may be because a large part of light used for photosynthesis of understory plants comes from the sunflecks. Therefore, plants should have higher light saturation points to adapt to strong sunflecks that may appear at any time.
When temperatures drop below a threshold value (the threshold value in this study is ACT5 = 2000 °C), growth abruptly slows, even with an increase in precipitation. This is probably the result of a sudden decline in the rate of metabolism when the temperature is below a certain range [99], coupled with the decreasing number of growing degree-days [100]. As is generally known, frost damage to growth increases with increasing elevation [101]. Other studies have shown that the current July temperature (decreasing with rising elevation) is the main limiting factor for the growth of Pinus koraiensis, because a decrease in temperature may lead to a delay in the onset of the growth period and the termination of growth before the end of the normal growing season [30]. In addition, decreases in temperature along an elevational gradient result in changes of forest type, i.e., from PBMF to ECF, leading to a variety of stand compositions and developmental stages; soil types [102] and rates of mineralization of dead organic matter and nutrient cycling [103] may also differ, all of which affect plant growth. As the result of the interaction of many factors, high elevation saplings (ECF) showed much more stress in growth when compared with saplings growing at a low elevation (PBMF); hence the greater growth in PBMF than in ECF.
Within a certain range of low temperatures in ECF, growth increases again with increasing elevation. The increase in Asat caused by increasing precipitation is a likely explanation for this pattern and represents an important strategy for plant survival under adverse environmental conditions. Asat is an important photosynthetic parameter representing maximum photon utilization capacity in plants; hence, Asat reflects the net assimilation rate [104] and a relatively high photosynthetic rate would result in a higher growth rate. Our results also showed that there was a significant positive correlation between plant growth and P soil and P leaf in ECF. According to some reports, P may be more limiting than N [105]. The amount of phosphorus in the soil is related to the high degree of weathering of apatite by physical and chemical functions and also related to the chemical process of fixing phosphorus within the soil. Due to the high rate of regeneration and decomposition by plants and animals, and the abundant nitrogen-fixing microorganisms present, N is much less a limiting factor than P in soil. The increase of leaf phosphorus with increasing elevation is another important reason for the increasing growth in ECF.
Low temperatures may explain why few Pinus koraiensis saplings were found above their current upper elevational limits (1350 m). At very low temperatures, plants cannot perform normal physiological activities and cells cannot differentiate properly. Low temperatures there also limit both the survival and activity of squirrels (Sciurus spp.), which are the primary seed dispersers of Pinus koraiensis [33] and facilitators of germination of Pinus koraiensis seeds [106].

5. Conclusions

The responses of needle and growth properties to elevational gradients (low elevation to upper elevational limits) and the possible underlying morphological and physiological mechanisms in natural young Pinus koraiensis trees were studied for the first time on Changbai Mountain. These responses and adaptations to elevation are related to forest type. The growth of young Pinus koraiensis trees increases with rising elevations in each vegetation belt. Redundancy and correlation analysis has shown that the growth of plants is closely related to the light saturation point, leaf water potential, mean within-crown humidity, annual precipitation, cumulative temperature (≥5 °C), within-crown air temperature, and atmospheric pressure in Pinus koraiensis and mixed broadleaved forests; in evergreen forests, the leaf C, leaf P content, net rate of light saturation in photosynthesis, water content of soil, within-crown humidity, annual precipitation, cumulative temperature (≥5 °C), within-crown air temperature, and total soil P content displayed a significant relationship with growth of Pinus koraiensis. This study will help us to understand better the ecophysiological processes that may enable young Pinus koraiensis trees to adapt to varying environments and to evaluate the species’ adaptive potential in scenarios of climate change, although further studies and demonstrations are needed. These data could also provide baseline data for future work on exploring the contribution of young trees to estimated forest carbon stocks and refining a leaf trait database. Further investigation of these issues is required before these results can be used in a broader range of species and conditions.

Author Contributions

Conceptualization, Y.F., W.K.M., and Y.C.; Data Curation, Y.F.; Formal Analysis, Y.F.; Funding Acquisition, Y.C.; Investigation, Y.F. and Y.C.; Methodology, Y.F., W.K.M., and Y.C.; Project administration, Y.C.; Writing—Original Draft, Y.F.; Writing—Review and Editing, Y.F., W.K.M., and Y.C.

Funding

This research was funded by (the Key Project of National Key Research and Development Plan) grant number (2017YFC050400101) and (the Program of National Natural Science Foundation of China) grant number (31670643).

Acknowledgments

We thank Zhen Huang, Junwei Wang, Shuai Liu, Shasha Song, Xian Wu, Yizhi Zhou, and Lei Yi, for field work assistance.

Conflicts of Interest

The authors declare no conflict of interest.

References

  1. Sundqvist, M.K.; Sanders, N.J.; Wardle, D.A. Community and ecosystem responses to elevational gradients: Processes, mechanisms, and insights for global change. Ann. Rev. Ecol. Evol. Syst. 2013, 44, 261–280. [Google Scholar] [CrossRef]
  2. Panek, J.A.; Waring, R.H. Stable carbon isotopes as indicators of limitations to forest growth imposed by climate stress. Ecol. Appl. 1997, 7, 854–863. [Google Scholar] [CrossRef]
  3. Miller, J.M.; Farquhar, G.D. Carbon isotope discrimination by a sequence of eucalyptus species along a subcontinental rainfall gradient in Australia. Funct. Ecol. 2001, 15, 222–232. [Google Scholar] [CrossRef]
  4. Kouwenberg, L.L.R.; Kürschner, W.M.; Mcelwain, J.C. Stomatal frequency change over altitudinal gradients: Prospects for paleoaltimetry. Rev. Mineral. Geochem. 2007, 66, 215–241. [Google Scholar] [CrossRef]
  5. Korner, C. Alpine Plant Life: Functional Plant Ecology of High Mountain Ecosystems; Springer: Berlin/Hamburg, Germany, 1999; p. 1501. [Google Scholar]
  6. Fukami, T.; Wardle, D.A. Long-term ecological dynamics: Reciprocal insights from natural and anthropogenic gradients. Proc. R. Soc. Lond. B Biol. Sci. 2005, 272, 2105–2115. [Google Scholar] [CrossRef] [PubMed]
  7. Walker, L.R.; Wardle, D.A.; Bardgett, R.D.; Clarkson, B.D. The use of chronosequences in studies of ecological succession and soil development. J. Ecol. 2010, 98, 725–736. [Google Scholar] [CrossRef] [Green Version]
  8. Malhi, Y.; Silman, M.; Salinas, N.; Bush, M.; Meir, P.; Saatchi, S. Introduction: Elevation gradients in the tropics: Laboratories for ecosystem ecology and global change research. Glob. Chang. Biol. 2010, 16, 3171–3175. [Google Scholar] [CrossRef]
  9. Malhi, Y.; Girardin, C.A.; Goldsmith, G.R.; Doughty, C.E.; Salinas, N.; Metcalfe, D.B.; Huaraca, H.W.; Silvaespejo, J.E.; Del, A.J.; Farfán, A.F. The variation of productivity and its allocation along a tropical elevation gradient: A whole carbon budget perspective. New Phytol. 2017, 214, 1019–1032. [Google Scholar] [CrossRef]
  10. Terashima, I.; Masuzawa, T.; Ohba, H.; Yokoi, Y. Is photosynthesis suppressed at higher elevations due to low CO2 pressure? Ecology 1995, 76, 2663–2668. [Google Scholar] [CrossRef]
  11. Wang, Q.; Iio, A.; Tenhunen, J.; Kakubari, Y. Annual and seasonal variations in photosynthetic capacity of fagus crenata along an elevation gradient in the naeba mountains, Japan. Tree Physiol. 2008, 28, 277–285. [Google Scholar] [CrossRef]
  12. Körner, C.; Cochrane, P.M. Stomatal responses and water relations of eucalyptus pauciflora in summer along an elevational gradient. Oecologia 1985, 66, 443–455. [Google Scholar] [CrossRef] [PubMed]
  13. Chen, T.; Zhao, Z.; Zhang, Y.; Qiang, W.; Feng, H.; An, L.; Li, Z. Physiological variations in chloroplasts of rhodiola coccinea along an altitudinal gradient in tianshan mountain. Acta Physiol. Plant. 2012, 34, 1007–1015. [Google Scholar] [CrossRef]
  14. Reinhardt, K.; Castanha, C.; Germino, M.J.; Kueppers, L.M. Ecophysiological variation in two provenances of pinus flexilis seedlings across an elevation gradient from forest to alpine. Tree Physiol. 2011, 31, 615–625. [Google Scholar] [CrossRef] [PubMed]
  15. Fisher, J.B.; Malhi, Y.; Cuba Torres, I.; Metcalfe, D.B.; van de Weg, M.J.; Meir, P.; Silva-Espejo, J.E.; Huaraca Huasco, W. Nutrient limitation in rainforests and cloud forests along a 3,000-m elevation gradient in the peruvian andes. Oecologia 2013, 172, 889–902. [Google Scholar] [CrossRef] [PubMed]
  16. Chapin, F.S.I.; Matson, P.A.I.; Mooney, H.A. Principles of terrestrial ecosystem eology. In Terrestrial Decomposition; Springer: Berlin/Hamburg, Germany, 2002. [Google Scholar]
  17. Kramer, P.J.; Kozlowski, T.T. 17–environmental and cultural factors affecting growth. In Physiology of Woody Plants; Academic Press: Cambridge, MA, USA, 1979; pp. 628–702. [Google Scholar]
  18. Jensen, A.M.; Gardiner, E.S.; Vaughn, K.C. High-light acclimation in quercus robur l. Seedlings upon over-topping a shaded environment. Environ. Exp. Bot. 2012, 78, 25–32. [Google Scholar] [CrossRef]
  19. Wang, Q.; Zhang, Q.; Fan, D.; Lu, C. Photosynthetic light and CO2 utilization and c4 traits of two novel super-rice hybrids. Plan. Physiol. 2006, 163, 529–537. [Google Scholar] [CrossRef] [PubMed]
  20. Kneeshaw, D.D.; Kobe, R.K.; Coates, K.D.; Messier, C. Sapling size influences shade tolerance ranking among southern boreal tree species. J. Ecol. 2010, 94, 471–480. [Google Scholar] [CrossRef]
  21. Pastur, G.M.; Lencinas, M.V.; Peri, P.L.; Arena, M. Photosynthetic plasticity of nothofagus pumilio seedlings to light intensity and soil moisture. For. Ecol. Manag. 2007, 243, 274–282. [Google Scholar] [CrossRef]
  22. Roberntz, P.; Stockfors, J. Effects of elevated cO2 concentration and nutrition on net photosynthesis, stomatal conductance and needle respiration of field-grown norway spruce trees. Tree Physiol. 1998, 18, 233–241. [Google Scholar] [CrossRef] [PubMed]
  23. Ziska, L.H.; Sullivan, J.H. Physiological sensitivity of plants along an elevational gradient to uv-b radiation. Am. J. Bot. 1992, 79, 863–871. [Google Scholar] [CrossRef]
  24. Huang, R.; Zhu, H.; Liu, X.; Liang, E.; Grießinger, J.; Wu, G.; Li, X.; Bräuning, A. Does increasing intrinsic water use efficiency (iwue) stimulate tree growth at natural alpine timberline on the southeastern tibetan plateau? Glob. Planet. Chang. 2017, 148, 217–226. [Google Scholar] [CrossRef]
  25. Peñuelas, J.; Filella, I.; Biel, C.; Serrano, L.; Savé, R. The reflectance at the 950–970 nm region as an indicator of plant water status. Int. J. Remote Sens. 1993, 14, 1887–1905. [Google Scholar] [CrossRef]
  26. Li, Y.; Yang, D.; Xiang, S.; Li, G. Different responses in leaf pigments and leaf mass per area to altitude between evergreen and deciduous woody species. Aust. J. Bot. 2013, 61, 424–435. [Google Scholar] [CrossRef] [Green Version]
  27. Wright, I.J.; Reich, P.B.; Westoby, M.; Ackerly, D.D.; Baruch, Z.; Bongers, F.; Cavenderbares, J.; Chapin, T.; Cornelissen, J.H.; Diemer, M. The worldwide leaf economics spectrum. Nature 2004, 428, 821–827. [Google Scholar] [CrossRef] [Green Version]
  28. Reich, P.B.; Walters, M.B.; Kloeppel, B.D.; Ellsworth, D.S. Different photosynthesis-nitrogen relations in deciduous hardwood and evergreen coniferous tree species. Oecologia 1995, 104, 24–30. [Google Scholar] [CrossRef]
  29. Fang, O.; Wang, Y.; Shao, X. The effect of climate on the net primary productivity (npp) of pinus koraiensis in the changbai mountains over the past 50 years. Trees 2016, 30, 281–294. [Google Scholar] [CrossRef]
  30. Wang, H.; Shao, X.; Jiang, Y.; Fang, X.; Wu, S. The impacts of climate change on the radial growth of pinus koraiensis along elevations of changbai mountain in northeastern china. For. Ecol. Manag. 2013, 289, 333–340. [Google Scholar] [CrossRef]
  31. Zhang, Y.; Drobyshev, I.; Gao, L.; Zhao, X.; Bergeron, Y. Disturbance and regeneration dynamics of a mixed korean pine dominated forest on changbai mountain, north-eastern China. Dendrochronologia 2014, 32, 21–31. [Google Scholar] [CrossRef]
  32. Yu, D.; Wang, Q.; Liu, J.; Zhou, W.; Qi, L.; Wang, X.; Zhou, L.; Dai, L. Formation mechanisms of the alpine erman’s birch (Betula ermanii) treeline on changbai mountain in northeast china. Trees 2014, 28, 935–947. [Google Scholar] [CrossRef]
  33. Hutchins, H.E.; Hutchins, S.A.; Liu, B.W. The role of birds and mammals in korean pine (Pinus koraiensis) regeneration dynamics. Oecologia 1996, 107, 120–130. [Google Scholar] [CrossRef]
  34. Kang, K.S.; Choi, W.Y.; Han, S.U.; Kim, C.S. Effective number and seed production in a clonal seed orchard of pznus korazenszs’. For. Genet. 2004, 11, 277–280. [Google Scholar]
  35. Kim, J.H.; Lee, H.J.; Jeong, S.J.; Lee, M.H.; Kim, S.H. Essential oil of pinus koraiensis leaves exerts antihyperlipidemic effects via up-regulation of low-density lipoprotein receptor and inhibition of acyl-coenzyme a: Cholesterol acyltransferase. Phytother. Res. 2012, 26, 1314–1319. [Google Scholar] [CrossRef] [PubMed]
  36. Cho, S.M.; Lee, E.O.; Kim, S.H.; Lee, H.J. Essential oil of pinus koraiensis inhibits cell proliferation and migration via inhibition of p21-activated kinase 1 pathway in hct116 colorectal cancer cells. BMC Complement. Altern. Med. 2014, 14, 275. [Google Scholar] [CrossRef] [PubMed]
  37. Li, W.H. Degradation and restoration of forest ecosystems in china. For. Ecol. Manag. 2004, 201, 33–41. [Google Scholar]
  38. Zhu, J.; Mao, Z.; Hu, L.; Zhang, J. Plant diversity of secondary forests in response to anthropogenic disturbance levels in montane regions of northeastern china. J. For. Res. 2007, 12, 403–416. [Google Scholar] [CrossRef]
  39. Sun, Y.; Zhu, J.; Sun, O.J.; Yan, Q. Photosynthetic and growth responses of pinus koraiensis seedlings to canopy openness: Implications for the restoration of mixed-broadleaved korean pine forests. Environ. Exp. Bot. 2016, 129, 118–126. [Google Scholar] [CrossRef]
  40. Royo, A.A.; Carson, W.P. On the formation of dense understory layers in forests worldwide: Consequences and implications for forest dynamics, biodiversity, and succession. Can. J. For. Res. 2006, 36, 1345–1362. [Google Scholar] [CrossRef]
  41. Fan, B.; Sang, W.; Axmacher, J.C. Forest vegetation responses to climate and environmental change: A case study from changbai mountain, ne china. For. Ecol. Manag. 2012, 262, 2052–2060. [Google Scholar]
  42. Jennings, S.B.; Brown, N.D.; Sheil, D. Assessing forest canopies and understorey illumination: Canopy closure, canopy cover and other measures. Forestry 1999, 72, 59–74. [Google Scholar] [CrossRef]
  43. Frazer, G.W.; Fournier, R.A.; Trofymow, J.; Hall, R.J. A comparison of digital and film fisheye photography for analysis of forest canopy structure and gap light transmission. Agric. For. Meteorol. 2001, 109, 249–263. [Google Scholar] [CrossRef]
  44. Schollenberger, C.J. A rapid approximate method for determining soil organic matter. Soil Sci. 1927, 24, 65–68. [Google Scholar] [CrossRef]
  45. Mitchell, A.K. Acclimation of pacific yew (Taxus brevifolia) foliage to sun and shade. Tree Physiol. 1998, 18, 749–757. [Google Scholar] [CrossRef] [PubMed]
  46. Isaac Berenblum, E.C. An improved method for the colorimetric determination of phosphate. Biochem. J. 1938, 32, 295–298. [Google Scholar] [CrossRef] [Green Version]
  47. Shi, P.; Körner, C.; Hoch, G. End of season carbon supply status of woody species near the treeline in western china. Basic Appl. Ecol. 2005, 7, 370–377. [Google Scholar] [CrossRef]
  48. Ye, Z.-P. A new model for relationship between irradiance and the rate of photosynthesis in oryza sativa. Photosynthetica 2007, 45, 637–640. [Google Scholar] [CrossRef]
  49. Arnon, D.I. Copper enzymes in isolated chloroplasts. Polyphenoloxidase in beta vulgaris. Plant Physiol. 1949, 24, 1. [Google Scholar] [CrossRef] [PubMed]
  50. Blackman, C.J.; Brodribb, T.J.; Jordan, G.J. Leaf hydraulics and drought stress: Response, recovery and survivorship in four woody temperate plant species. Plant Cell Environ. 2009, 32, 1584–1595. [Google Scholar] [CrossRef] [PubMed]
  51. Sims, D.A.; Gamon, J.A. Estimation of vegetation water content and photosynthetic tissue area from spectral reflectance: A comparison of indices based on liquid water and chlorophyll absorption features. Remote Sens. Environ. 2003, 84, 526–537. [Google Scholar] [CrossRef]
  52. Korner, C.; Diemer, M. In situ photosynthetic responses to light, temperature and carbon dioxide in herbaceous plants from low and high altitude. Funct. Ecol. 1987, 1, 179–194. [Google Scholar] [CrossRef]
  53. Saxe, H.; Cannell, M.G.R.; Johnsen, B.; Ryan, M.G.; Vourlitis, G. Tree and forest functioning in response to global warming. New Phytol. 2001, 149, 369–399. [Google Scholar] [CrossRef]
  54. Cabrera, H.; Rada, F.; Cavieres, L. Effects of temperature on photosynthesis of two morphologically contrasting plant species along an altitudinal gradient in the tropical high andes. Oecologia 1998, 114, 145–152. [Google Scholar] [CrossRef] [PubMed]
  55. Rada, F.; Azocar, A.; Gonzalez, J.; Briceño, B. Leaf gas exchange in espeletia schultzii wedd, a giant caulescent rosette species, along an altitudinal gradient in the venezuelan andes. Acta Oecol. 1998, 19, 73–79. [Google Scholar] [CrossRef]
  56. Morison, J.I.L. Stomatal response to increased CO2 concentration. J. Exp. Bot. 1998, 49, 443–452. [Google Scholar] [CrossRef]
  57. Heber, U.; Neimanis, S.; Lange, O.L. Stomatal aperture, photosythesis and water fluxes in mesophyll cells as affected by the abscission of leaves. Simultaneous measurements of gas exchange, light scattering and chlorphyll fluorescence. Planta 1986, 167, 554–562. [Google Scholar] [CrossRef] [PubMed]
  58. Bunce, J.A. Effects of boundary layer conductance on substomatal pressures of carbon dioxide. Plant Cell Environ. 1988, 11, 205–208. [Google Scholar] [CrossRef]
  59. And, G.D.F.; Sharkey, T.D. Stomatal conductance and photosynthesis. Ann. Rev. Plant Physiol. 1982, 33, 317–345. [Google Scholar]
  60. Kumar, N.; Kumar, S.; Ahuja, P.S. Photosynthetic characteristics of hordeum, triticum, rumex, and trifolium species at contrasting altitudes. Photosynthetica 2005, 43, 195–201. [Google Scholar] [CrossRef]
  61. Liu, W.; Fan, X.; Wang, J.; Zhang, C.; Lu, W.; Gadow, K.V. Spectral reflectance response of fraxinus mandshurica leaves to above-and belowground competition. Int. J. Remote Sens. 2012, 33, 5072–5086. [Google Scholar] [CrossRef]
  62. Curran, P.J. Exploring the relationship between reflectance red edge and chlorophyll content in slash pine. Tree Physiol. 1990, 7, 33–48. [Google Scholar] [CrossRef] [Green Version]
  63. Haldimann, P. Effects of changes in growth temperature on photosynthesis and carotenoid composition in zea mays leaves. Physiol. Plant. 1996, 97, 554–562. [Google Scholar] [CrossRef]
  64. Lefsrud, M.G.; Kopsell, D.A. Biomass production and pigment accumulation in kale grown under different radiation cycles in a controlled environment. HortScience 2006, 41, 1412–1415. [Google Scholar]
  65. Oleksyn, J.; Modrzýnski, J.; Tjoelker, M.; Reich, P.; Karolewski, P. Growth and physiology of picea abies populations from elevational transects: Common garden evidence for altitudinal ecotypes and cold adaptation. Funct. Ecol. 1998, 12, 573–590. [Google Scholar] [CrossRef]
  66. Ran, F.; Zhang, X.; Zhang, Y.; Korpelainen, H.; Li, C. Altitudinal variation in growth, photosynthetic capacity and water use efficiency of abies faxoniana rehd. Et wils. Seedlings as revealed by reciprocal transplantations. Trees 2013, 27, 1405–1416. [Google Scholar] [CrossRef]
  67. Lovisolo, C.; Perrone, I.; Carra, A.; Ferrandino, A.; Flexas, J.; Medrano, H.; Schubert, A. Drought-induced changes in development and function of grapevine (Vitis spp.) organs and in their hydraulic and non-hydraulic interactions at the whole-plant level: A physiological and molecular update. Funct. Plant Biol. 2010, 37, 98–116. [Google Scholar] [CrossRef]
  68. Chaves, M.M.; Zarrouk, O.; Francisco, R.; Costa, J.M.; Santos, T.; Regalado, A.P.; Rodrigues, M.L.; Lopes, C.M. Grapevine under deficit irrigation: Hints from physiological and molecular data. Ann. Bot. 2010, 105, 661–676. [Google Scholar] [CrossRef] [PubMed]
  69. Dzikiti, S.; Verreynne, J.S.; Stuckens, J.; Strever, A.; Verstraeten, W.W.; Swennen, R.; Coppin, P. Determining the water status of satsuma mandarin trees [citrus unshiu marcovitch] using spectral indices and by combining hyperspectral and physiological data. Agric. For. Meteorol. 2010, 150, 369–379. [Google Scholar] [CrossRef]
  70. Cibula, W.G.; Zetka, E.F.; Rickman, D.L. Response of thematic mapper bands to plant water stress. Int. J. Remote Sens. 1992, 13, 1869–1880. [Google Scholar] [CrossRef]
  71. Ustin, S.L.; Roberts, D.A.; Pinzón, J.; Jacquemoud, S.; Gardner, M.; Scheer, G.; Castañeda, C.M.; Palacios-Orueta, A. Estimating canopy water content of chaparral shrubs using optical methods. Remote Sens. Environ. 1998, 65, 280–291. [Google Scholar] [CrossRef]
  72. Korner, C.; Allison, A.; Hilscher, H. Altitudinal variation of leaf diffusive conductance and leaf anatomy in heliophytes of montane new guinea and their interrelation with microclimate. Flora 1983, 174, 91–135. [Google Scholar] [CrossRef]
  73. Hultine, K.; Marshall, J. Altitude trends in conifer leaf morphology and stable carbon isotope composition. Oecologia 2000, 123, 32–40. [Google Scholar] [CrossRef]
  74. Piper, F.I. Intraspecific trait variation and covariation in a widespread tree species (Nothofagus pumilio) in southern chile. New Phytol. 2011, 189, 259–271. [Google Scholar]
  75. Bresson, C.C.; Vitasse, Y.; Kremer, A.; Delzon, S. To what extent is altitudinal variation of functional traits driven by genetic adaptation in european oak and beech? Tree Physiol. 2013, 31, 1164–1174. [Google Scholar] [CrossRef]
  76. Smith, M. Alpine treelines: Functional ecology of the global high elevation tree limits. Mt. Res. Dev. 2013, 33, 357. [Google Scholar] [CrossRef]
  77. Sveinbjornsson, B.; Nordell, O.; Kauhanen, H. Nutrient relations of mountain birch growth at and below the elevational tree-line in swedish lapland. Funct. Ecol. 1992, 6, 213–220. [Google Scholar] [CrossRef]
  78. Kudo, G. Altitudinal effects on leaf traits and shoot growth of betulaplatyphyl. Can. J. For. Res. 2011, 25, 1881–1885. [Google Scholar] [CrossRef]
  79. Birmann, K.; Körner, C. Nitrogen status of conifer needles at the alpine treeline. Plant Ecol. Divers. 2009, 2, 233–241. [Google Scholar] [CrossRef]
  80. Schoettle, A.W.; Rochelle, S.G. Morphological variation of pinus flexilis (pinaceae), a bird-dispersed pine, across a range of elevations. Am. J. Bot. 2000, 87, 1797–1806. [Google Scholar] [CrossRef]
  81. Ellsworth, D.S.; Reich, P.B. Leaf mass per area, nitrogen content and photosynthetic carbon gain in acer saccharum seedlings in contrasting forest light environments. Funct. Ecol. 1992, 6, 423–435. [Google Scholar] [CrossRef]
  82. Le, R.X.; Walcroft, A.S.; Sinoquet, H.; Chaves, M.M.; Rodrigues, A.; Osorio, L. Photosynthetic light acclimation in peach leaves: Importance of changes in mass: Area ratio, nitrogen concentration, and leaf nitrogen partitioning. Tree Physiol. 2001, 21, 377–386. [Google Scholar]
  83. Pollastrini, M.; Stefano, V.D.; Ferretti, M.; Agati, G.; Grifoni, D.; Zipoli, G.; Orlandini, S.; Bussotti, F. Influence of different light intensity regimes on leaf features of vitis vinifera l. In ultraviolet radiation filtered condition. Environ. Exp. Bot. 2011, 73, 108–115. [Google Scholar] [CrossRef]
  84. Luomala, E.M.; Laitinen, K.; Sutinen, S.; Kellomäki, S.; Vapaavuori, E. Stomatal density, anatomy and nutrient concentrations of scots pine needles are affected by elevated co 2 and temperature. Plant Cell Environ. 2005, 28, 733–749. [Google Scholar] [CrossRef]
  85. Björkman, O. Responses to Different Quantum Flux Densities; Springer: Berlin/Heidelberg, Germany, 1981; pp. 57–107. [Google Scholar]
  86. Reich, P.B.; Ellsworth, D.S.; Walters, M.B. Leaf structure (specific leaf area) modulates photosynthesis-nitrogen relations: Evidence from within and across species and functional groups. Funct. Ecol. 1998, 12, 948–958. [Google Scholar] [CrossRef]
  87. Park, B.-B.; Byun, J.-K.; Park, P.-S.; Lee, S.-W.; Kim, W.-S. Growth and tissue nutrient responses of fraxinus rhynchophylla, fraxinus mandshurica, pinus koraiensis, and abies holophylla seedlings fertilized with nitrogen, phosphorus, and potassium. J. Korean Soc. For. Sci. 2010, 99, 186–196. [Google Scholar]
  88. Cai-Feng, Y.; Shi-Jie, H.; Yu-Mei, Z.; Cun-Guo, W.; Guan-Hua, D.; Wen-Fa, X.; Mai-He, L. Needle-age related variability in nitrogen, mobile carbohydrates, and δ13c within pinus koraiensis tree crowns. PLoS ONE 2012, 7, e35076. [Google Scholar]
  89. Luo, J.; Zang, R.; Li, C. Physiological and morphological variations of picea asperata populations originating from different altitudes in the mountains of southwestern china. For. Ecol. Manag. 2006, 221, 285–290. [Google Scholar] [CrossRef]
  90. Hedin, L.O.; Brookshire, E.J.; Menge, D.N.; Barron, A.R. The nitrogen paradox in tropical forest ecosystems. Ann. Rev. Ecol. Evol. Syst. 2009, 40, 613–635. [Google Scholar] [CrossRef]
  91. Vitousek, P.M.; Porder, S.; Houlton, B.Z.; Chadwick, O.A. Terrestrial phosphorus limitation: Mechanisms, implications, and nitrogen-phosphorus interactions. Ecol. Appl. 2010, 20, 5–15. [Google Scholar] [CrossRef]
  92. Lichtenthaler, H.K.; Ač, A.; Marek, M.V.; Kalina, J.; Urban, O. Differences in pigment composition, photosynthetic rates and chlorophyll fluorescence images of sun and shade leaves of four tree species. Plant Physiol. Biochem. 2007, 45, 577–588. [Google Scholar] [CrossRef]
  93. Hendrik, P.; Ulo, N.; Lourens, P.; Wright, I.J.; Rafael, V. Causes and consequences of variation in leaf mass per area (lma): A meta-analysis. New Phytol. 2010, 182, 565–588. [Google Scholar]
  94. Guiying Ben, C.B.O.; Sharkey, T.D. Comparisons of photosynthetic responses of xanthium strumarium and helianthus annuus to chronic and acute water stress in sun and shade. Plant Physiol. 1987, 84, 476–482. [Google Scholar]
  95. Rosati, A.; Esparza, G.; Dejong, T.M.; Pearcy, R.W. Influence of canopy light environment and nitrogen availability on leaf photosynthetic characteristics and photosynthetic nitrogen-use efficiency of field-grown nectarine trees. Tree Physiol. 1999, 19, 173–180. [Google Scholar] [CrossRef]
  96. Girardin, C.A.J.; Malhi, Y.; Aragão, L.E.O.C.; Mamani, M.; Huasco, W.H.; Durand, L.; Feeley, K.J.; Rapp, J.; Silva-Espejo, J.E.; Silman, M. Net primary productivity allocation and cycling of carbon along a tropical forest elevational transect in the peruvian andes. Glob. Chang. Biol. 2010, 16, 3176–3192. [Google Scholar] [CrossRef]
  97. Rapp, J.M.; Silman, M.R.; Clark, J.S.; Girardin, C.A.; Galiano, D.; Tito, R. Intra- and interspecific tree growth across a long altitudinal gradient in the peruvian andes. Ecology 2012, 93, 2061–2072. [Google Scholar] [CrossRef]
  98. Yu, D.; Wang, Q.; Wang, Y.; Zhou, W.; Ding, H.; Fang, X.; Jiang, S.; Dai, L. Climatic effects on radial growth of major tree species on changbai mountain. Ann. For. Sci. 2011, 68, 921–933. [Google Scholar] [CrossRef]
  99. Gillooly, J.F.; Charnov, E.L. Effects of size and temperature on metabolic rate. Science 2001, 293, 2248–2251. [Google Scholar] [CrossRef]
  100. Reiners, W.A.; Hollinger, D.Y.; Lang, G.E. Temperature and evapotranspiration gradients of the white mountains, new hampshire, USA. Arct. Alp. Res. 1984, 16, 31–36. [Google Scholar] [CrossRef]
  101. Dittmar, C.; Fricke, W.; Elling, W. Impact of late frost events on radial growth of common beech (Fagus sylvatica L.) in southern germany. Eur. J. For. Res. 2006, 125, 249–259. [Google Scholar] [CrossRef]
  102. Yan, C.; Han, S.; Zhou, Y.; Zheng, X.; Yu, D.; Zheng, J.; Dai, G.; Li, M.-H. Needle δ13c and mobile carbohydrates in pinus koraiensis in relation to decreased temperature and increased moisture along an elevational gradient in ne china. Trees 2012, 27, 389–399. [Google Scholar] [CrossRef]
  103. Salinas, N.; Malhi, Y.; Meir, P.; Silman, M.; Cuesta, R.R.; Huaman, J.; Salinas, D.; Huaman, V.; Gibaja, A.; Mamani, M.; et al. The sensitivity of tropical leaf litter decomposition to temperature: Results from a large-scale leaf translocation experiment along an elevation gradient in peruvian forests. New Phytol. 2011, 189, 967–977. [Google Scholar] [CrossRef]
  104. Surabhi, G.K.; Reddy, K.R.; Singh, S.K. Photosynthesis, fluorescence, shoot biomass and seed weight responses of three cowpea (Vigna unguiculata (L.) Walp.) cultivars with contrasting sensitivity to uv-b radiation. Environ. Exp. Bot. 2009, 66, 160–171. [Google Scholar] [CrossRef]
  105. Vitousek, P.M.; Sanford, R.L. Nutrient cycling in moist tropical forest. Ann. Rev. Ecol. Syst. 1986, 17, 137–167. [Google Scholar] [CrossRef]
  106. Asakawa, S. Further investigation on hastening the germination of pinus koraiensis seeds. J. Jpn. For. Soc. 1956, 38, 1–4. [Google Scholar]
Figure 1. Regression equations of the mean values of apparent quantum yield (AQY), light saturation point (LSP), light saturation net photosynthetic rate (Asat), intrinsic water use efficiency (iWUE) and stomatal conductance (Cond) of needles in Pinus koraiensis Sieb. et Zucc. as a function of elevation on Changbai Mountain. The sample size was 7 for Pinus koraiensis and mixed broadleaved forests (solid lines) and 6 for evergreen coniferous forests (dotted lines). For each elevation, the sample size was 5. The abbreviations “ns” and “NS” mean not statistically significant in PBMF (Pinus koraiensis and mixed broadleaved forests) and ECF (evergreen coniferous forests), respectively (both at the p < 0.05 level).
Forests 10 00054 g001
Figure 2. Mean values of chlorophyll a concentration (Chl a) and chlorophyll b concentration (Chl b) in needles of Pinus koraiensis at different elevations, Changbai Mountain. The abbreviations “ns” and “NS” mean not statistically significant in PBMF (Pinus koraiensis and mixed broadleaved forests) and ECF (evergreen coniferous forests), respectively (both at the p < 0.05 level). For each elevation, the sample size was 5.
Forests 10 00054 g002
Figure 3. Scatter plot of water band index (WI) of needles in Pinus koraiensis at each elevation on Changbai Mountain. For each elevation, the sample size was 5. Lowercase letters denote significant differences among elevations in PBMF (Pinus koraiensis and mixed broadleaved forests). Uppercase letters denote significant differences in ECF (evergreen coniferous forests) (both at the p < 0.05 level).
Forests 10 00054 g003
Figure 4. Mean values of leaf mass per area (LMA) in Pinus koraiensis at different elevations, Changbai Mountain. The abbreviations “ns” and “NS” means not statistically significant in PBMF (Pinus koraiensis and mixed broadleaved forests) and ECF (evergreen coniferous forests), respectively (at the p < 0.05 level). For each elevation, the sample size was 5.
Forests 10 00054 g004
Figure 5. Regression equations of the mean values of total leaf N, total leaf P, and total leaf C content in Pinus koraiensis as a function of elevation on Changbai Mountain. The sample size was 7 for Pinus koraiensis and mixed broadleaved forests (solid lines) and 6 for evergreen coniferous forests (dotted lines). For each elevation, the sample size was 5. Lowercase letters denote significant differences among elevations in PBMF (Pinus koraiensis and mixed broadleaved forests). Uppercase letters denote significant differences in ECF (evergreen coniferous forests) (both at the p < 0.05 level).
Forests 10 00054 g005
Figure 6. Regression equations of biomass of current-year needles (CN), biomass of current-year branches (CB), biomass of one-year-old needles (ON), biomass of one-year-old branches (OB), current-year needle biomass/total biomass ratio (CNR), and one-year-old needle biomass/total biomass ratio (ONR) of Pinus koraiensis at different elevations, Changbai Mountain. The sample size was 7 for Pinus koraiensis and mixed broadleaved forests (solid lines) and 6 for evergreen coniferous forests (dotted lines). For each elevation, the sample size was 5.
Forests 10 00054 g006
Figure 7. PBMF-1: RDA analysis between growth and needle properties in Pinus koraiensis and mixed broadleaved forests; PBMF-2: RDA analysis between growth properties and environmental factors in Pinus koraiensis and mixed broadleaved forests. ECF-1: RDA analysis between growth and needle properties in evergreen coniferous forests; ECF-2: RDA analysis between growth properties and environmental factors in evergreen coniferous forests.
Forests 10 00054 g007
Table 1. General description of plots at various elevations on Changbai Mountain.
Elevation (m)Type of ForestsSlope AspectSlope (°)WCT # (°C)ACT5 ## (°C)RIA ## (mm)WCH # (%)Pair (kPa)
750PBMFN<1015.552388.28644.2577.1791.80 ± 0.07
800PBMFN<1015.212329.44658.9777.6390.60 ± 0.02
850PBMFN<1014.872270.61673.6978.1090.75 ± 0.11
900PBMFN<1014.532211.77688.4178.5690.88 ± 0.03
950PBMFN<1014.192152.94703.1379.0390.78 ± 0.02
1000PBMFN<1013.852094.10717.8579.4990.03 ± 0.06
1050PBMFN<1013.512035.27732.5779.9689.05 ± 0.02
1100ECFN<1013.171976.43747.2980.4288.49 ± 0.01
1150ECFN<1012.831917.60762.0180.8987.85 ± 0.04
1200ECFN<1012.491858.76776.7381.3588.02 ± 0.04
1250ECFN<1012.151799.93791.4581.8286.99 ± 0.09
1300ECFN<1011.811741.09806.1782.2886.94 ± 0.04
1350ECFN<1011.471682.26820.8982.7585.81 ± 0.01
Note: PBMF = Pinus koraiensis and mixed broadleaved forests, ECF = evergreen coniferous forests, WCT = within-crown air temperature, WCH = within-crown relative humidity, RIA = annual precipitation, ACT5 = cumulative temperature (≥5 °C), Pair = atmospheric pressure, # data from [28], ## data from [41].
Table 2. General description of soil properties at various elevations on Changbai Mountain.
Elevation (m) N Soil (%)C Soil (%)P Soil (%)pHWC Soil (%)
7500.2148 ± 0.0389 de5.8475 ± 0.4568 ab0.3492 ± 0.0258 a5.4492 ± 0.1319 c27.7338 ± 1.6653 a
8000.0674 ± 0.0017 a4.8923 ± 0.4933 a0.3008 ± 0.0114 a5.2173 ± 0.0715 bc43.3591 ± 1.3379 c
8500.1046 ± 0.0098 ab6.0790 ± 1.0523 ab0.3005 ± 0.0072 a5.5433 ± 0.2471 c47.1886 ± 3.1609 b
9000.1624 ± 0.0203 bcd4.1960 ± 0.9026 a0.3228 ± 0.0241 a5.1678 ± 0.0570 abc50.7534 ± 0.6221 a
9500.2551 ± 0.0271 e8.1750 ± 0.5909 b0.3264 ± 0.0181 a5.0633 ± 0.0840 ab47.9172 ± 2.2047 b
10000.1691 ± 0.0115 cd4.7742 ± 0.2660 a0.2957 ± 0.0109 a5.2323 ± 0.0293 bc50.7662 ± 0.3353 c
10500.1154 ± 0.0047 abc3.6204 ± 1.2684 a0.3159 ± 0.0104 a4.8427 ± 0.0378 a50.5732 ± 0.4940 b
11000.1343 ± 0.0063 CD2.4571 ± 0.1983 AB0.2519 ± 0.0103 BC5.1591 ± 0.0367 D32.8224 ± 4.0644 D
11500.0919 ± 0.0027 A2.2594 ± 0.6608 AB0.2327 ± 0.0041 AB4.9967 ± 0.0194 C33.0481 ± 2.5072 AB
12000.1107 ± 0.0038 B3.9636 ± 0.1945 CD0.2419 ± 0.0044 BC4.8632 ± 0.0620 B31.4864 ± 1.7371 BC
12500.1199 ± 0.0024 BC4.8995 ± 0.1732 D0.1951 ± 0.0261 A4.5588 ± 0.0385 A40.8705 ± 4.3609 C
13000.0868 ± 0.0067 A1.5724 ± 0.2830 A0.2733 ± 0.0130 BC4.9167 ± 0.0254 BC51.0298 ± 0.5400 C
13500.1500 ± 0.0113 D3.3030 ± 0.5744 BC0.2794 ± 0.0118 C4.9364 ± 0.0037 BC44.5513 ± 1.0680 A
Note: For each elevation, the sample size was 5. Significant differences among elevations are denoted by lowercase letters in PBMF (Pinus koraiensis Sieb. et Zucc. and mixed broadleaved forests) and uppercase letters in ECF (evergreen coniferous forests) (both at the p < 0.05 level).
Table 3. Information at each elevation of plants sampled.
Elevation (m)Height (cm)BSD (cm)Height/BSDCrown Length (cm)Crown Width (cm)Canopy Openness (%)
75099.21 ± 4.791.79 ± 0.1256.03 ± 2.90 ns95.00 ± 8.34 86.40 ± 10.33 77.93 ± 1.05 ns
80097.82 ± 4.691.84 ± 0.1053.28 ± 1.74 ns95.60 ± 9.57 85.20 ± 8.06 76.93 ± 1.09 ns
85097.72 ± 5.131.85 ± 0.1152.82 ± 0.84 ns95.00 ± 9.99 84.60 ± 10.08 78.77 ± 0.57 ns
90095.73 ± 3.201.83 ± 0.1453.08 ± 2.51 ns93.60 ± 9.24 83.60 ± 7.54 76.82 ± 0.68 ns
95099.36 ± 4.351.80 ± 0.1155.72 ± 2.43 ns97.00 ± 9.32 86.60 ± 9.63 78.83 ± 0.80 ns
100099.89 ± 3.431.85 ± 0.1354.82 ± 3.03 ns98.00 ± 10.26 85.80 ± 9.65 77.86 ± 0.51 ns
105098.46 ± 4.851.79 ± 0.1555.98 ± 3.30 ns108.20 ± 9.48 95.20 ± 10.28 78.28 ± 1.08 NS
110097.96 ± 4.481.83 ± 0.1354.12 ± 2.21 ns84.40 ± 4.55 73.80 ± 4.85 79.36 ± 0.72 NS
115098.36 ± 3.621.82 ± 0.1454.82 ± 2.79 ns94.20 ± 9.93 86.40 ± 9.56 78.28 ± 0.87 NS
120099.50 ± 4.551.82 ± 0.1355.13 ± 2.16 ns97.40 ± 9.35 85.20 ± 10.51 77.56 ± 0.57 NS
125097.30 ± 5.171.82 ± 0.1454.04 ± 2.02 ns97.40 ± 9.52 84.40 ± 10.37 78.49 ± 1.08 NS
130094.04 ± 4.101.90 ± 0.1350.11 ± 2.36 ns94.80 ± 9.56 85.60 ± 9.14 78.71 ± 0.98 NS
135097.85 ± 5.371.79 ± 0.1254.77 ± 1.22 ns96.00 ± 9.36 83.40 ± 8.13 77.56 ± 1.18 ns
Note: BSD = basal stem diameter. Lowercase letters ns mean not statistically significant in PBMF (Pinus koraiensis and mixed broadleaved forests) and uppercase letters NS mean not statistically significant in ECF (evergreen coniferous forests) (both at the p < 0.05 level). Sample size at each elevation was 5.
Table 4. Results of multivariate ANOVA showing the effects of forest type and elevation on growth properties.
TotalCNCBONOBCNRONR
Forest TypePr(>F)<2.2×10⁻¹⁶ ***3.2×10⁻¹⁵ ***7.533×10⁻¹³ ***1.598×10⁻¹³ ***2.516×10⁻¹⁴ ***<2.2×10⁻¹⁶ ***6.209×10⁻¹⁴ ***
F 39.208107.15080.31887.46796.466140.90092.001
ElevationPr(>F)1.805×10⁻⁹ ***4.699×10⁻¹⁵ ***1.895×10⁻¹⁴ ***3.697×10⁻¹⁶ ***<2.2×10⁻¹⁶ ***<2.2×10⁻¹⁶ ***5.336×10⁻¹⁶ ***
F 2.69119.26217.97621.788120.52022.42521.408
Note: CN = biomass of current-year needles, CB = biomass of current-year branches, ON = biomass of one-year-old needles, OB = biomass of one-year-old branches, CNR = current-year needle biomass/total biomass ratio, ONR = one-year-old needle biomass/total biomass ratio. *** Correlation is significant at the <0.01 level (two-tailed). The sample size was 65.
Table 5. Correlation coefficients of growth properties with leaf indicators at each forest type.
Chl aChl bTCN LeafP LeafC LeafLMAAQYLSPAsatCondiWUEWI
PBMF
CN−0.0310.1870.056−0.2320.482 **0.396 *−0.2340.2280.522 **0.1750.310−0.2850.337 *
CB−0.1110.2490.019−0.1530.440 **0.325−0.2580.1710.513 **0.1210.153−0.1340.214
ON−0.0200.1150.034−0.1140.530 **0.305−0.0900.2960.491 **0.2030.259−0.2500.127
OB−0.1410.038−0.098−0.2120.594 **0.416 *−0.2010.2910.607 **0.2660.106−0.0810.230
CNR−0.0190.1730.060−0.2520.452 **0.384 *−0.2020.1910.518 **0.2060.356 *−0.3120.337 *
ONR0.0040.0670.033−0.0610.488 **0.2240.0120.2740.434 **0.2310.251−0.2280.022
ECF
CN−0.1300.2440.0040.1550.646 **0.377 *−0.0050.2680.512 **0.3000.174−0.052−0.112
CB−0.3220.169−0.1790.1310.713 **0.450 *−0.1000.3260.458 *0.384 *0.343−0.197−0.227
ON0.0010.2890.1270.1320.611 **0.377 *−0.0270.3240.538 **0.2880.176−0.006−0.230
OB−0.1120.182−0.008−0.1080.593 **0.535 **0.0070.492 **0.441 *0.441 *0.357−0.133−0.422
CNR−0.1190.2420.0120.1470.644 **0.388 *0.0240.2620.521 **0.3060.179−0.054−0.102
ONR0.0420.3030.1660.1060.602 **0.412 *−0.0230.3270.565 **0.2950.197−0.015−0.260
Note: * Correlation is significant at the 0.05 level (two-tailed). ** Correlation is significant at the 0.01 level (two-tailed). The sample size was 35 for PBMF, Pinus koraiensis, and mixed broadleaved forests and 30 for ECF, evergreen coniferous forests.
Table 6. Growth properties of each forest type and their correlation coefficients with environment factors.
Mean ± S.E.WCTWCHACT5RIAPairN SoilC SoilP SoilpH SoilWC Soil
PBMF
CN18.15 ± 6.64 a−0.647 **0.648 **−0.647 **0.647 **−0.611 **−0.040−0.185−0.198−0.1850.226
CB1.71 ± 0.77 a−0.629 **0.630 **−0.629 **0.629 **−0.631 **−0.032−0.287−0.126−0.2920.087
ON18.33 ± 6.58 a−0.665 **0.666 **−0.665 **0.665 **−0.555 **0.039−0.125−0.133−0.233−0.058
OB2.79 ± 1.28 a−0.795 **0.796 **−0.795 **0.795 **−0.747 **0.045−0.175−0.060−0.450 **0.035
CNR0.06 ± 0.02 a−0.616 **0.616 **−0.616 **0.616 **−0.563 **−0.033−0.139−0.209−0.1320.238
ONR0.06 ± 0.02 a−0.599 **0.599 **−0.599 **0.599 **−0.446 **0.074−0.059−0.114−0.182−0.170
ECF
CN4.62 ± 2.89 b−0.605 **0.604 **−0.605 **0.605 **−0.497 **−0.116−0.0220.215−0.214−0.257
CB0.40 ± 0.24 b−0.734 **0.734 **−0.734 **0.734 **−0.594 **−0.1000.0470.423 *−0.217−0.397 *
ON6.02 ± 3.16 b−0.683 **0.682 **−0.683 **0.683 **−0.569 **−0.0480.0290.285−0.231−0.401 *
OB0.46 ± 0.25 b−0.874 **0.874 **−0.874 **0.874 **−0.845 **0.1120.0720.348−0.304−0.555 **
CNR0.02 ± 0.01 b−0.617 **0.617 **−0.617 **0.617 **−0.509 **−0.1050.0250.201−0.244−0.254
ONR0.03 ± 0.01 b−0.724 **0.723 **−0.724 **0.724 **−0.609 **−0.0310.0830.281−0.274−0.439 *
Note: * Correlation is significant at the 0.05 level (two-tailed). ** Correlation is significant at the 0.01 level (two-tailed). The sample size was 35 for PBMF, Pinus koraiensis, and mixed broadleaved forests and 30 for ECF, evergreen coniferous forests. Lowercase letters denote significant differences between PBMF and ECF.

