Abstract
Biclustering is crucial for gene expression data analysis, but evolutionary algorithm-based methods often suffer from high computational costs. To address this, we propose a novel subspace evolution-based biclustering method that significantly reduces runtime by constraining the search space and enhancing population diversity. Our approach first partitions the original expression matrix into submatrices, within which bicluster seeds are efficiently identified using a newly designed selection strategy. These seeds are then expanded and merged to form final biclusters. Experimental evaluation on both synthetic and real-world gene expression datasets demonstrates that our method outperforms existing typical biclustering algorithms in bicluster quality, achieving an average improvement of 57.31% in mean recovery. Moreover, it reduces runtime by approximately 63.42% compared to state-of-the-art evolutionary biclustering methods.
1. Introduction
Over the past decades, microarray technology has been developing rapidly and playing an important role in biological and biomedical research. Microarray techniques can measure the gene expression levels under many conditions and produce a large amount of data, which is finally structured in a matrix usually called gene expression data [1,2,3]. Many local coherent blocks composed of a gene subset and a condition subset can be utilized to mine biological information [4,5,6]. Biclustering instead of one-way clustering [7,8] is frequently used to extract such local coherent blocks.
The problem of biclustering was first introduced [9] to search for biclusters with constant values, and later used to analyze gene expression data [10,11,12]. We aim for the rows/columns in biclusters to have strong correlations/coherence and also desire the volume of a bicluster to be large [13]. In a typical gene expression matrix, the rows correspond to genes and the columns correspond to samples (e.g., patients, tissues, or experimental conditions). Each entry in the matrix represents the expression level of a particular gene in a specific sample. The goal of biclustering is to identify a subset of genes that exhibit a coherent expression pattern (e.g., correlated) across a subset of samples. Such a bicluster can reveal, for instance, a functional gene module (e.g., a pathway) that is characteristically active or suppressed in a particular class of samples (e.g., a disease subtype), thereby attaching direct biological meaning to the analysis. However, strong coherence and large volume are two conflicting goals. Hence, a large number of multiple objective evolutionary algorithm (MOEA), such as NSGA2 (non-dominated sorting genetic algorithm II)-based methods, have been proposed to simultaneously optimize the conflicting objectives [14,15,16].
In the literature, most MOEA-based biclustering algorithms use the binary string encoding the individual whose length is the sum of row counts and column counts [17]. However, there is a limitation in such an encoding approach. As the size of gene expression data increases, the search space tends to be extremely large due to the exponential relation between individual length and search space [18]. A large search space may cause MOEA to fail to find optimal biclusters within a reasonable time. Hence, in this study the whole space is divided into many subspaces to reduce the search space. Since in the gene expression data matrix, row count is larger than column count, in this study, the search space is divided in the row direction. As shown in Figure 1, in the top subfigure, the whole search space is . In the bottom subfigure, the rows are divided into k equal parts; in each part, the search space is , and the whole search space is . By dividing into subspaces, the whole search space will be reduced dramatically. As shown in the bottom subfigure of Figure 1, the overall strategy is first dividing subspaces, subsequently finding bicluster seeds from each subspace with MOEA, and finally enlarging these bicluster seeds into the biclusters of the whole space.
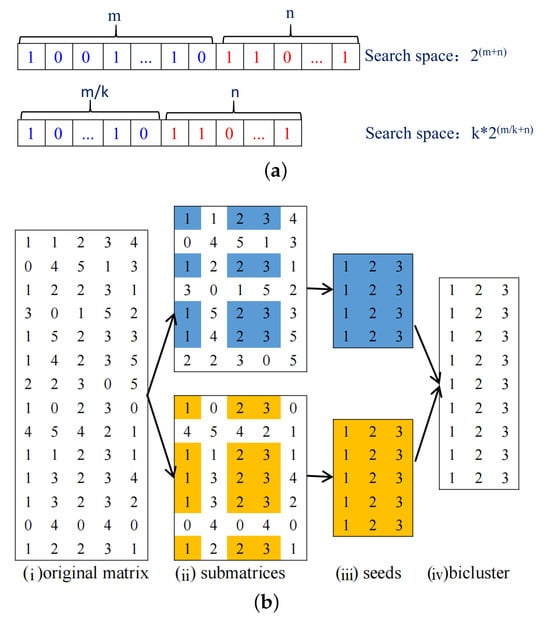
Figure 1.
Subspace illustration. (a) Illustration of reducing search space by partitioning subspaces. (b) An example for illustrating row division. (i) Original matrix. (ii) Divide into two spaces according to row direction. (iii) Mine two bicluster seeds from two subspaces. (iv) Enlarge bicluster seed’ size.
In addition, due to the intrinsic properties of the evolutionary algorithms [19,20], the diversity of the bicluster population may not be high even though NSGA2 is capable of finding promising regions [21]. Therefore, we aim to incorporate a clustering algorithm to solve this problem. In NSGA2, the strategy of Pareto-dominance cannot provide sufficient selection pressure to make progress towards the optimal solutions. The elitist solutions are mainly selected by the nondominated sorting approach, and then selected by the crowding-distance computation. Such a selection operator is not efficient enough because most solutions are selected only by the nondominated approach without considering the diversity of solutions. Therefore, the selected solutions are apt to be trapped in local optima. Accordingly, we aim to propose a novel and easy-to-use selection operator [9] with consideration of the individuals’ diversity and high efficiency before the nondominated sorting. In this study, a modified NSGA2 using a traditional clustering approach for the selection operator is designed. Clustering is an unsupervised classification method that divides a set of individuals into K disjoint clusters [22]. The individuals in the same cluster are more similar than those in different clusters. In NSGA2 [23], the solutions were selected according to the nondominated rank and then the crowding distance rank, which may select some solutions with a higher nondominated rank but a poor crowding distance rank, resulting in insufficient diversity. In order to alleviate such situations, we innovatively apply the apcluster [24] method and choose the solutions with higher nondominated rank in each disjoint cluster, which is possible to guarantee the convergence and the diversity of the selected solutions simultaneously. In this study, the employment of the clustering algorithms allows us to select the representative individuals from different regions of the search space. In this way, we could obtain the uniformly distributed solutions more efficiently. In addition, by selecting the representative individuals from each cluster, it is possible to avoid choosing similar solutions which are more likely to exist in the same cluster. Thus the considerable computation time for the similar individuals could be saved.
Since the proposed biclustering method is based on subspace evolution [25], it is named as SSEB. The technical contributions of SSEB can be summarized as follows:
- *
- A Novel “Subspace Co-Evolution” Framework for Biclustering. To reduce the search space, a row subspace division strategy whose core idea is finding bicluster seeds from each subspace and then enlarging the bicluster seeds is proposed.
- *
- A Formalized Solution to Population Diversity Maintenance in Multi-Objective Biclustering. To improve the diversity of the bicluster population, a modified selection operator is proposed. It automatically clusters the search space and retains the most representative individual of each cluster for the next generation, leading to a faster convergence speed and a more uniform distribution of optimal solutions.
- *
- Experimental results verify that the proposed method can find better biclusters and save considerable time.
2. Related Work
2.1. Preliminaries
2.1.1. Bicluster Type
As mentioned above, a bicluster is a sub-matrix consisting of a subset of rows and a subset of columns with a coherent pattern. According to the coherent pattern that genes express under the experimental conditions, several types of biclusters have been presented and classified [13,26,27,28]. We define a bicluster as a sub-matrix B consisting of genes and conditions. There are many kinds of biclusters, and three common types are defined as follows:
- Shift: ;
- Scale: ;
- Scaleshift: .
where c is a constant value; and , respectively, refer to additive coefficient for gene i and condition j; and , are the multiplicative coefficient for row i and column j, respectively; corresponds to constant values for each gene/row i. The shifting and scaling patterns are also corresponding to additive and multiplicative patterns, respectively [19,29].
2.1.2. Quality Measure
Quality measures can assess the quality of biclusters [30], helping the biclustering algorithm find better biclusters. Common measure for shift bicluster is mean square residue (MSR) [31], calculated as Equation (1). For scale bicluster, the most commonly used evaluation measure is square mean square residue (SMSR) [32], calculated as Equation (2).
2.1.3. The Multi-Objective Evolutionary Algorithms (MOEAs)
A multi-objective optimization problem involves several objective functions that are either minimized or maximized [33]. Due to the conflicts among the objectives, it is difficult to obtain a single solution. Thus, several optimal solutions, known as the Pareto set, need to be searched. The Pareto optimal solutions are determined by their dominance relationship. For a multi-objective minimization problem which has m objectives and n dimension variables, it can be expressed as follows:
where X is a vector containing n elements and is the ith objective function.
A solution dominates solution if, and only if, the following two requirements are satisfied:
The Pareto solutions are the solutions for which there exist no other solutions in the solution space that can dominate them. The Pareto optimal front is generated when mapping all the Pareto solutions into the coordinate system.
The purpose of an MOEA is to efficiently search for converging individuals with a uniform distribution. Since evolutionary algorithms can find a variety of solutions in a single simulation run, they have proven to be efficient for solving multi-objective problems. Additionally, their excellent ability to quickly explore and identify promising regions in the search space enables them to perform well in global search [34].
NSGA2 is one of the most representative and the most widely used EMO algorithms [35,36]. It has the following three features. Firstly, it employs the elitism strategy to help avoid the loss of good solutions in the evolutionary processes. Secondly, by applying a novel density-estimation metric and the crowed-comparison operator, an explicit diversity preserving mechanism is developed in NSGA2. Ultimately, the nondominated solutions are emphasized in the main loop, which leads to an acceleration of the converging speed. The experimental results in [37] have demonstrated that NSGA2 was able to uniformly maintain solutions among Pareto-optimal front.
In NSGA2, in order to emphasize the solutions in better nondominated sets, the solutions are selected first according to the nondominated rank. If the counts of individuals in the best-nondominated set are smaller than that of the selected population, then all the solutions in the best-nondominated set are chosen. Such an approach may choose some solutions with a higher nondominated rank but a poor crowding distance rank. To this end, we innovatively propose to incorporate the clustering approach into the selection procedure.
2.2. Multi-Objective Evolutionary Algorithm-Based Biclustering Methods and Their Limitations
Although multi-objective evolutionary algorithms (MOEAs) have demonstrated strong capability in balancing the conflicting objectives of biclustering (e.g., volume vs. coherence) and have become a mainstream framework in the field, existing MOEA-based methods, particularly those built on NSGA-II, still suffer from fundamental limitations that hinder their application to large-scale gene expression data analysis. This subsection reviews representative works with a critical focus on their shortcomings, thereby clarifying the motivation for our study.
2.2.1. Curse of Dimensionality and Encoding Efficiency Issues
Most MOEA-based biclustering methods employ binary encoding, where the chromosome length equals the sum of the number of genes and conditions [17]. This encoding scheme leads to a search space that grows exponentially with data size [18]. For large-scale matrices generated by modern high-throughput sequencing (e.g., over 10,000 genes), this curse of dimensionality makes it difficult for evolutionary algorithms to converge to high-quality solution regions within a reasonable time. For instance, the pioneering work by Mitra and Banka [38], which first applied NSGA-II to biclustering, did not address the computational scalability issue for large-scale data. In [38], the two objectives the authors try to optimize are shown in Equations (8) and (9). needs to be maximized, while needs to be minimized. In real case, large usually comes with large , thus and are two conflicting objectives. Similarly, the variable-length encoding used by Maulik et al. [39] and the integer encoding strategy adopted by Seridi et al. [40], while offering optimizations in memory usage or local search, fundamentally do not alter the nature of random search across the entire space. Consequently, computational overhead remains prohibitively high for very high-dimensional data.
2.2.2. Inadequate Definition and Maintenance of Population Diversity
NSGA-II maintains population diversity through non-dominated sorting and crowding distance computation, a mechanism proven effective for many problems [35,36]. However, in the specific context of biclustering, where a solution is essentially a subspace of the data matrix, the traditional crowding distance measures the distribution of solutions in the objective function space but fails to effectively capture their diversity in the original row-column structural space. This can lead the algorithm to converge to a set of solutions that are well-distributed in objective values but are highly similar in their row and column composition, i.e., a loss of “structural diversity”. Early studies by Chakraborty and Maka [21] and Bleuler et al. [22] both observed the tendency of evolutionary algorithms to get trapped in local optima during biclustering, but none provided a theoretically rigorous diversity-preserving operator specifically designed for the structural characteristics of biclusters. A significant research gap exists in the current literature regarding “how to define and quantify the structural diversity of a bicluster population.”
2.2.3. Limitations of Existing Improvement Strategies
To enhance efficiency, some studies have attempted to incorporate local search (e.g., the strategy in [38]) or hybridize with specific algorithms (e.g., the CC algorithm in [40]). However, these approaches often introduce new problems: the integration of local search can increase computational burden and make the algorithm more sensitive to initial solution quality; coupling with other algorithms may disrupt the coherence of the evolutionary process and increase parameter tuning complexity. More importantly, these improvements are largely heuristic and engineering-oriented, lacking a unified framework to systematically address the two core challenges of “excessively large search space” and “insufficient structural diversity” simultaneously.
In summary, the current research landscape presents two critical gaps that demand resolution: (i) the lack of a theoretical framework capable of systematically and substantially reducing the dimensionality of the evolutionary search space without compromising global solution quality; and (ii) the absence of a selection mechanism that can accurately measure and effectively maintain the diversity of a bicluster population in the original row-column space. It is precisely to bridge these gaps that this study proposes an evolutionary framework based on row subspace partitioning (to address the first issue) and an AP-cluster-based selection operator (to address the second issue). Our approach is not merely an engineering improvement to NSGA-II, but rather a targeted extension of the evolutionary search paradigm and diversity preservation theory within the specific context of biclustering.
3. Method
The flowchart of SSEB is displayed in Figure 2. Firstly, the entire dataset (search space) is separated into multiple subsets (subspaces). Subsequently bicluster seeds () are mined from each subspace with MOEA. Finally, these bicluster seeds are enlarged to large biclusters of the entire dataset (space) through merging and expansion.
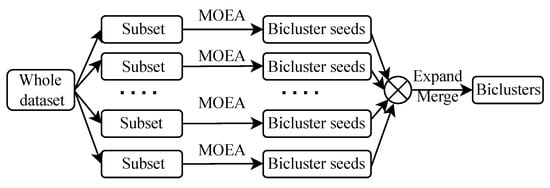
Figure 2.
Flowchart of SSEB.
3.1. Subspaces Division
To obtain row subspaces, the gene expression data matrix is uniformly and randomly divided into disjoint subspaces along row direction. The size of each subspace is .
3.2. Find Bicluster Seeds from Subspaces
Because each subspace is independent, mining bicluster seeds from each subspace is performed in parallel. The parameters for the evolutionary process include the size of the initial population (N), the maximum generation (), the crossover probability () and the mutation probability (). All individuals in the bicluster population are represented by binary vectors. The two fitness functions are ACV [32] and the counts of elements in a bicluster. ACV is based on the average Pearson correlation coefficient among rows/columns. ACV can detect nearly all kinds of biclusters. ACV of bicluster is calculated with Equation (10).
The initial population is randomly generated, and the offspring of the initial population is also generated via the processes of tournament selection, single-point crossover and uniform mutation. Due to the elitist strategy, which aims to preserve the best nondominated solutions from the current generation to the next generation, we combine the initial population and the offspring population for the following selection process. The size of the combined population is 2N.
3.2.1. Selection
As mentioned above, we modified the NSGA-II algorithm by integrating the apcluster algorithm into the selection process. In each generation, the apcluster algorithm [24] is applied to all individuals, partitioning them into K clusters in the search space. We select the representative optimal individual in each cluster according to the nondominated rank. The representative individuals selected from different clusters maintain a good diversity. Figure 3 shows the main loop of evolution in subspace, and the detailed methods are given in the following paragraphs.
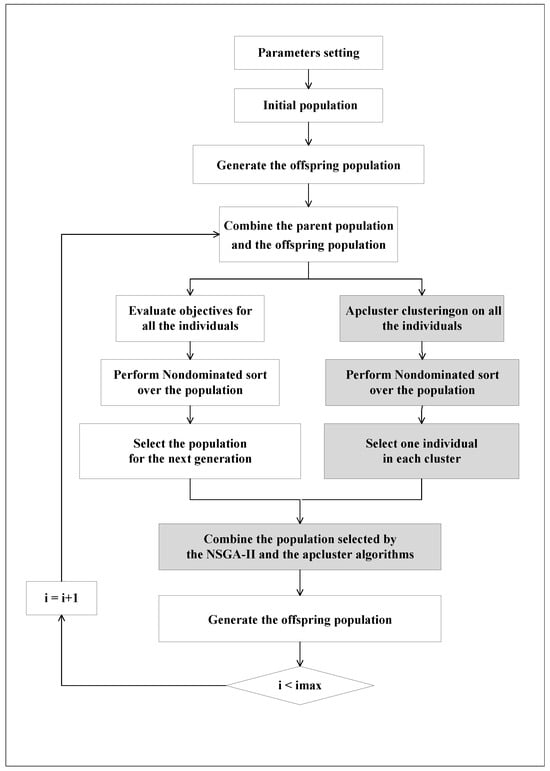
Figure 3.
Main loop of evolution in subspaces.
In order to preserve the solutions selected in the offspring population, the apcluster algorithm is employed to automatically partition all the individuals into K clusters and then the optimal solution in each cluster is chosen. The detailed procedures are shown as follows: (1): Perform the apcluster [24] on the combined population. The technical details of apcluster can be seen in [24]. The optimal value of K is automatically determined. (2): Apply non-dominated sorting to all individuals in the combined population. The fast non-dominated sorting method is described in [37]. (3): For each cluster, randomly select one individual from the best nondominated set. This results in K solutions.
Along with the K solutions selected by apcluster, N-K solutions are selected from the remaining 2N-K solutions using NSGA-II. After performing fast non-dominated sorting with NSGA-II, we iteratively select solutions from the leading non-dominated fronts until the total number of solutions reaches N-K. The crowded-comparison operator is then used to measure the diversity of individuals in the last non-dominated front, and solutions are selected based on their diversity ranks.
3.2.2. Other Operators
After obtaining the selected solutions through apcluster and NSGA-II, we use traditional genetic operators (including binary tournament selection, simulated binary crossover, and polynomial mutation) to generate the offspring population, which also has a size of N. The entire process of selecting the offspring population constitutes a single generation. We repeat the selection process iteratively until the maximum number of generations is reached.
3.3. Enlarge Bicluster Seeds
3.3.1. Expand
Since the sizes of the mined from subspaces are small, they need to be expanded to the whole space. The expansion of each bicluster seed is performed as follows:
- *
- For the remaining rows, add row to if the ACV of new that is composed of the old and newly inserted row is not smaller than original ACV.
- *
- For the remaining columns, add add column to if the ACV of new that is composed of the old and newly inserted column is not smaller than the original ACV.
3.3.2. Merge
Because the expanded biclusters may overlap with each other, to improve diversity of biclusters, these expanded biclusters are merged using Algorithm 1.
| Algorithm 1 Merge biclusters |
| Input: , expanded biclusters; , the number of found bicluster in ; , the predefined ACV threshold of bicluster; Output: , final bicluster set
|
4. Experiment
4.1. Experiment Setup
First, comparison methods are introduced. Subsequently, the generation of synthetic datasets is described, along with detailed information about real gene expression datasets. Finally, evaluation measures and parameter settings are provided. SSEB is implemented with Matlab language, the code is available at link (https://github.com/sunjianjunraymon/SSEB, accessed on 21 December 2025).
4.1.1. Comparison Methods
SSEB is compared with seven related methods in the literature: FBCP [11], IGABA [16], OPSM [41], BIMAX [42], SOEA [22], CC [31] and ISA [43]. These comparison methods are representative in the field. Even though OPSM, BIMAX, SOEA, CC and ISA are old methods, they are typical and highly cited biclustering methods and are usually used for baseline comparison methods.
4.1.2. Synthetic Dataset
Since little is known about the biclusters in real gene expression data, synthetic datasets are generated to comprehensively evaluate the performance of SSEB. The synthetic dataset generation process is as follows: (1) Generate the background matrix of size 200 × 30. All the elements in obey uniform distribution U(0,1). (2) Generate the synthetic bicluster of size 20 × 20 with following two steps: (i) generate one reference column that obeys U(0,1). uniform distribution; and (ii) multiply/add different coefficients to the reference column to produce other columns. (3) Randomly select indices and implant the synthetic bicluster into by replacing corresponding elements. To test the noise tolerance of SSEB, noise obeying normal distribution is added to bicluster.
4.1.3. Real Gene Expression Dataset
The performance of SSEB is further verified using two real gene expression datasets: BCLL [44] and DLBCL [45]. Both are frequently used leukemia datasets, and their detailed information is provided in Table 1.

Table 1.
Real gene expression dataset.
4.1.4. Evaluation Measure
For synthetic dataset, two measures ( and ) are used.
where is the implanted bicluster, is one of the biclusters in the retrieved bicluster set found by biclustering method, and represent the volume of the intersection and union of the two biclusters, respectively.
To further investigate the performance of SSEB, two additional measures and are used, with their expressions shown in Equations (14) and (15).
where R denotes the set of rows in a bicluster.
For a real gene expression dataset, two performance measures (Coverage ratio and Enrich ratio) are employed. Coverage ratio (CR) reflects the diversity of biclusters. CR is calculated with Equation (16). The higher the CR is, the better the diversity of the found biclusters is. High CR means there are fewer overlaps between the retrieved biclusters. Enrich ratio denotes the percentage of enriched biclusters. ER is calculated with Equation (17).
where is the element counts in the union of the retrieved biclusters, and denotes the volume of the gene expression data matrix.
where means the counts of the retrieved bicluster set , and represents the counts of enriched biclusters.
4.1.5. Parameter Setting
Since the core idea of SSEB is subspace division, it is necessary to investigate the effect of the optimal number of subspaces . Figure 4 displays the and running time of SSEB when searching shift bicluster. Finally, the optimal value of is set as 14. The parameter values of SSEB and comparison methods are displayed in Table 2. All methods were run on a laptop with Windows 11, 1 GB size disk, 8 G memory and Matlab R2014a software.
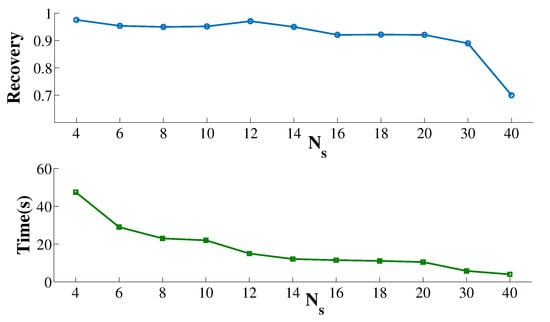
Figure 4.
Recovery and runtime of SSEB under different .
Table 2.
Parameter settings.
4.2. Experiment Results and Analysis
To comprehensively investigate the performance of SSEB, extensive experiments are conducted. All experimental results are the average of three runs. First, an ablation study is performed to verify the positive contributions of subspace division and apcluster-based selection. Subsequently, the performance of SSEB under different noise levels, overlap ratios, generations and sizes is investigated. Finally, the performance of SSEB on real gene expression datasets is explored.
Figure 5 displays the RowRecovery and ColumnRecovery comparison of all methods under shift bicluster of size 20 × 20 and no noise. It can be found that SSEB obtains the highest RowRecovery and ColumnRecovery.
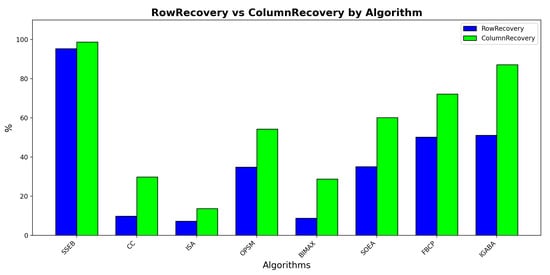
Figure 5.
RowRecovery and ColumnRecovery comparison.
4.2.1. Ablation Study
Since the technical contributions of SSEB lie in two parts: apcluster-based selection and subspace division, an ablation experiment is conducted to verify the contribution of each part separately. SSEB is compared with NSGA2, ANSGA2 and SNSGA2. ANSGA2 refers to NSGA2 with only apcluster-based selection added. SNSGA2 refers to NSGA2 with only subspace division applied. The experimental results of the four methods when searching for shift biclusters are shown in Figure 6. It can be seen that SSEB achieves the highest values for both metrics across all noise levels, while the two metrics of NSGA2 are lower than those of ANSGA2 and SNSGA2. The average runtime (in seconds) of NSGA-II, ANSGA-II, SNSGA-II and SSEB is shown in Table 3. SSEB has the shortest runtime. The experimental results demonstrate the positive contributions of apcluster-based selection and subspace division.
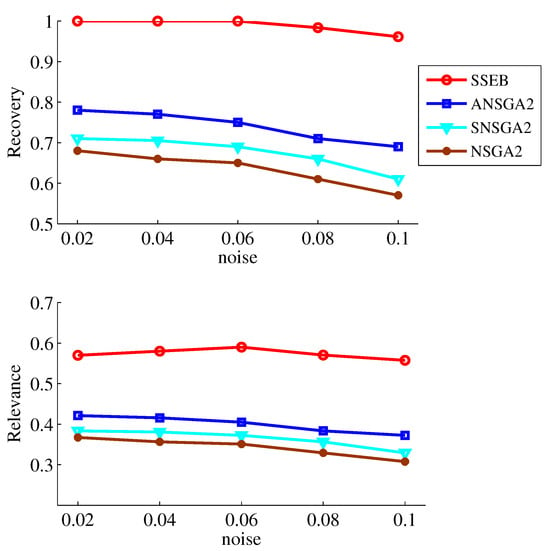
Figure 6.
Ablation study results.
Table 3.
Runtime comparison.
4.2.2. Effect of Noise
Since data may be contaminated by noise, noise tolerance experiments on shift, scale and scale-shift biclusters are conducted. Five noise levels ( = 0.02, 0.04, 0.06, 0.08, 0.1) are set. The experimental results of the noise tests are displayed in Figure 7, Figure 8 and Figure 9. It can be found that SSEB significantly outperforms the comparison methods across all noise levels and all types of biclusters. Additionally, the results of all methods on shift biclusters are higher than those on scale-shift biclusters, and the results on scale-shift biclusters are higher than those on scale biclusters.
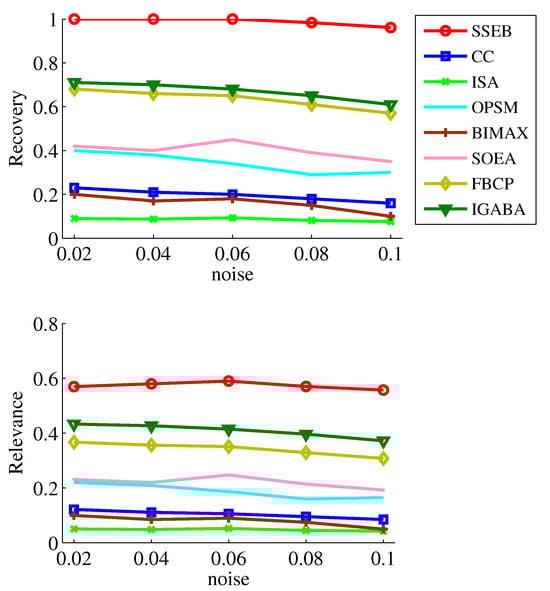
Figure 7.
Noise experiment results on shift bicluster.
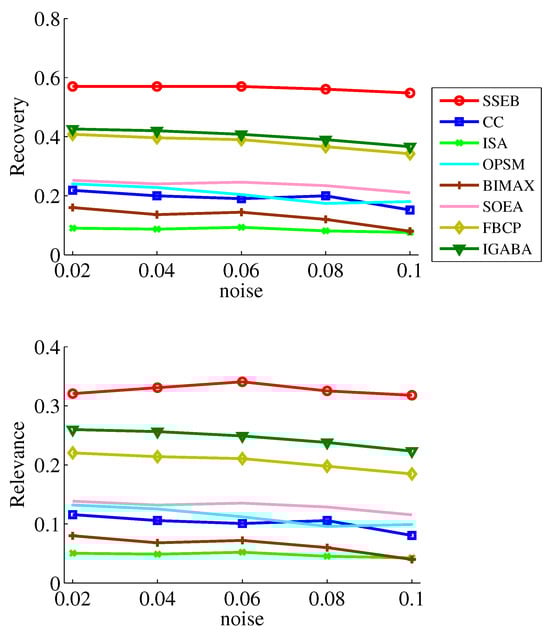
Figure 8.
Noise experiment results on scale bicluster.
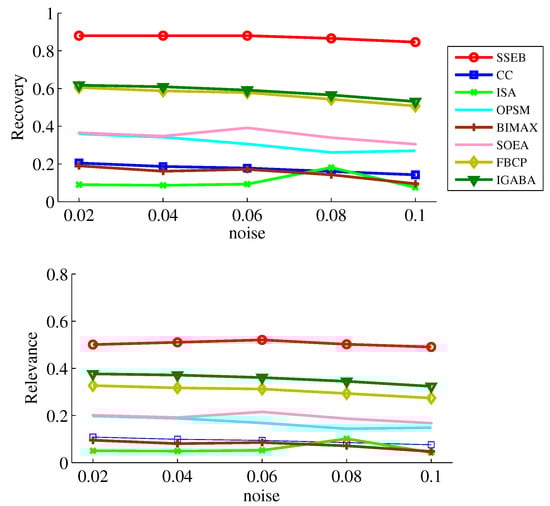
Figure 9.
Noise experiment results on scaleshift bicluster.
4.2.3. Effect of Overlap Ratio
In real cases, biclusters may overlap with each other. To explore the performance of SSEB under different overlap ratios, two 10 × 10 biclusters are generated and implanted into the background matrix, with the overlap ratio ranging from 10% to 90%. The results are displayed in Figure 10. It can be found that SSEB obtains the best results across all overlap ratios. Higher overlap ratios lead to lower and .
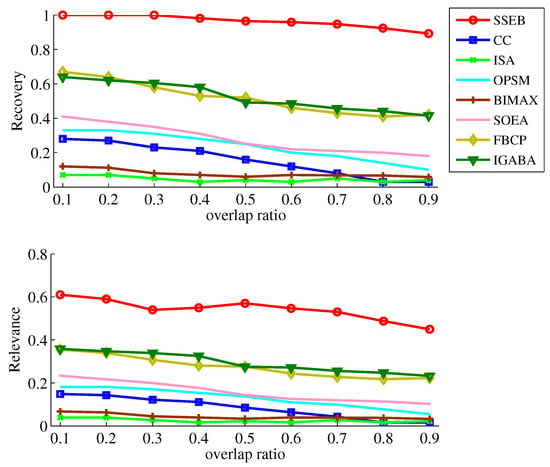
Figure 10.
Experiment results under different overlap ratios.
4.2.4. Effect of Generations
The and of SSEB when searching for shift biclusters under different generations are shown in Figure 11. It can be observed that when the number of generations is less than 160, and increase with the number of generations.
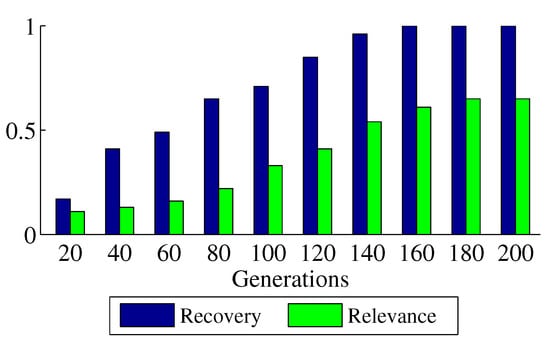
Figure 11.
Experiment results under different generations.
4.2.5. Effect of Bicluster/Background Matrix Size
To more comprehensively investigate the performance of SSEB, experiments are conducted with different bicluster sizes while keeping the background matrix size fixed. As shown in Figure 12, across all five sizes, the and of SSEB are the highest. It can also be found higher bicluster size will result in higher and . Additionally, experiments are conducted with different background matrix sizes while keeping the implanted bicluster size fixed. As shown in Figure 13, across six background matrix sizes (200 × 30, 500 × 50, 1000 × 50, 3000 × 100, 5000 × 200, 10,000 × 300), the and of SSEB are the highest. Furthermore, as the background matrix size increases, and of all methods tend to decrease.
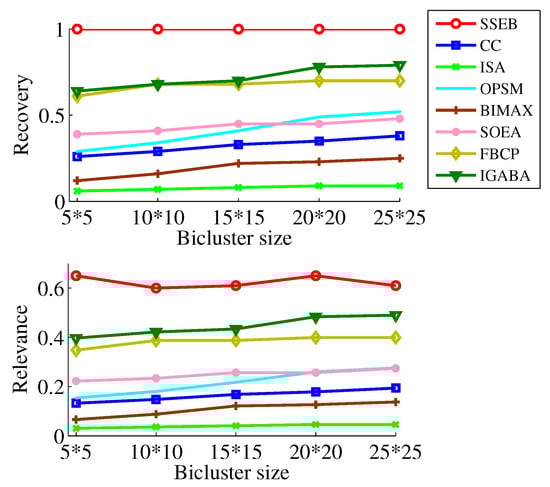
Figure 12.
Experiment results under different sizes of shift bicluster.
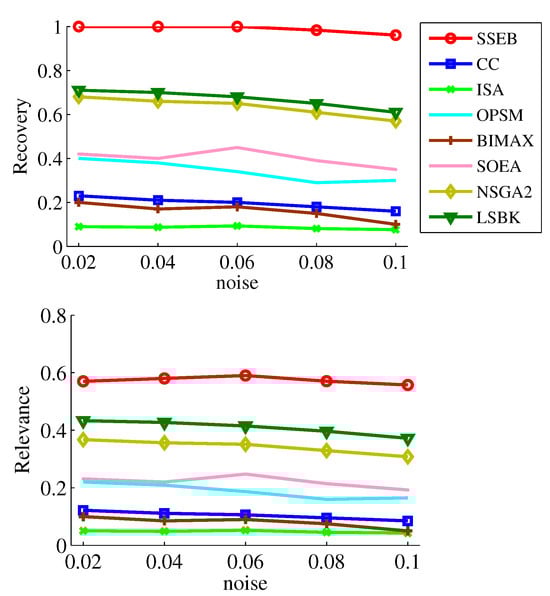
Figure 13.
Experiment results under different sizes of background matrix.
4.2.6. Real Gene Expression Dataset
The CR of SSEB and the seven comparison methods on the two gene expression datasets are shown in Table 4 and Table 5. The BCLL (B-Cell Lymphoma/Leukemia) dataset profiles 24 samples spanning several B-cell-derived malignancies, measuring expression for 12,625 genes. Its heterogeneous composition tests an algorithm’s ability to identify distinct molecular signatures. The DLBCL (Diffuse Large B-Cell Lymphoma) dataset includes 96 samples from DLCL patients, with expression measurements for 4026 genes. It is a standard benchmark for discerning molecular subtypes within this heterogeneous lymphoma and assessing the stability of biclustering algorithms. We can see that on both datasets, the total CR of SSEB is the highest and the gene CR of SSEB is also the highest. High CR demonstrates the ability of SSEB to find the biclusters containing high diversity. Condition CR of all methods are 100%, this may be due to the number of conditions is small.
Table 4.
Coverage rate for different methods on BCll dataset.
Table 5.
Coverage rate for different methods on DLBCL dataset.
A bicluster is deemed enriched if the adjusted p-value for all GO terms is no larger than the predefined cutoff (significance level). In this study, the adjusted p-values of all output biclusters are compared with predefined cutoffs of 0.1% and 0.5%. The ER of all methods is shown in Figure 14. It can be seen that SSEB achieves the highest ER in all cases. The runtime of NSGA-II, FBCP and IGABA on the BCLL and DLBCL datasets is shown in Table 6. The shorter runtime of SSEB demonstrates its advantages.
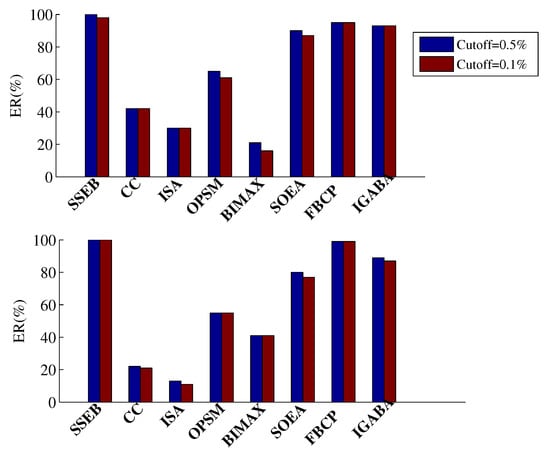
Figure 14.
ER of all methods on two real gene expression datasets (top: BCLL, bottom: DLBCL).
Table 6.
Runtime (hours) comparison.
5. Discussion and Conclusions
In this study, we propose SSEB, a novel biclustering method that addresses the critical challenges of high computational cost and low population diversity in existing NSGA-II-based approaches. The core innovations lie in (1) a subspace partitioning strategy that drastically reduces the search space, and (2) an affinity propagation (AP)-based selection mechanism that effectively maintains population diversity. Ablation studies confirmed the individual positive contribution of each component to the overall performance.
We conducted a comprehensive evaluation against several leading biclustering algorithms, the results demonstrate that SSEB achieves superior bicluster quality and computational efficiency. Specifically: In terms of bicluster quality, SSEB consistently discovered biclusters with significantly higher recovery and biological relevance. This can be attributed to our AP-based selection, which preserves diverse high-quality candidate solutions, preventing premature convergence. Regarding computational efficiency, SSEB reduced runtime by approximately 63.42% compared to other evolutionary methods. This gain is directly linked to the subspace strategy, which confines the evolutionary search to promising local regions, thereby cutting down the chromosome encoding length and evaluation overhead.
The efficiency of SSEB opens the door for real-time or interactive biclustering analysis of modern large-scale genomic data (e.g., single-cell RNA sequencing). From a methodological perspective, the subspace-evolution framework offers a generic paradigm for scaling up evolutionary computations in high-dimensional spaces, and the AP-based selection strategy provides a viable solution to diversity maintenance in multi-objective optimization.
In conclusion, SSEB represents an effective advance in evolutionary biclustering. By intelligently reducing the search space and enhancing population diversity, it delivers higher-quality biclusters in significantly less time. Future work will focus on developing adaptive subspace sizing and extending SSEB to integrate multi-omics data for more comprehensive biological discovery.
6. Limitations
While SSEB works well on large datasets, this study has limitations. If the dataset size is very small, the divided row subspaces may be too small to mine meaningful bicluster seeds, potentially causing bicluster mining to fail. Another key limitation of this study is its foundational premise: the row dimension is larger than the column dimension. Violation of this premise—specifically, in datasets where columns outnumber rows—could compromise SSEB’s effectiveness. Additionally, empirical evaluations on two gene expression datasets reveal a trade-off in computational efficiency: although SSEB is faster than comparable evolutionary methods, it does not match the speed of conventional, deterministic (non-evolutionary) algorithms.
Author Contributions
Conceptualization, J.S.; methodology, Q.Y.; software, B.J.; validation, X.Z.; formal analysis, J.S.; investigation, P.Z.; resources, J.S.; data curation, X.Z.; writing—original draft preparation, B.J.; writing—review and editing, B.J.; visualization, B.J.; supervision, J.S.; project administration, J.S. All authors have read and agreed to the published version of the manuscript.
Funding
This research received no external funding.
Data Availability Statement
Data is available upon request.
Conflicts of Interest
The authors declare no conflicts of interest.
References
- Yuan, W.; Li, Y.; Han, Z.; Chen, Y.; Xie, J.; Chen, J.; Bi, Z.; Xi, J. Evolutionary Mechanism Based Conserved Gene Expression Biclustering Module Analysis for Breast Cancer Genomics. Biomedicines 2024, 12, 2086. [Google Scholar] [CrossRef]
- Gafar, M.G.; Abohany, A.A.; Elkhouli, A.E.; El-Mageed, A.A.A. Optimization of gene selection for cancer classification in high-dimensional data using an improved african vultures algorithm. Algorithms 2024, 17, 342. [Google Scholar] [CrossRef]
- Georgieva, O. An Iterative Unsupervised Method for Gene Expression Differentiation. Genes 2023, 14, 412. [Google Scholar] [CrossRef] [PubMed]
- Hanafi, S.; Palubeckis, G.; Glover, F. Bi-objective optimization of biclustering with binary data. Inf. Sci. 2020, 538, 444–466. [Google Scholar] [CrossRef]
- Flores, J.L.; Inza, I.; Larranaga, P.; Calvo, B. A new measure for gene expression biclustering based on non-parametric correlation. Comput. Methods Programs Biomed. 2013, 112, 367–397. [Google Scholar] [CrossRef]
- Nepomuceno, J.A.; Troncoso, A.; Nepomuceno-Chamorro, I.A.; Aguilar-Ruiz, J.S. Integrating biological knowledge based on functional annotations for biclustering of gene expression data. Comput. Methods Programs Biomed. 2015, 119, 163–180. [Google Scholar] [CrossRef]
- Yang, M.S.; Sinaga, K.P. Federated multi-view K-means clustering. IEEE Trans. Pattern Anal. Mach. Intell. 2024, 47, 2446–2459. [Google Scholar] [CrossRef]
- Datta, S.; Datta, S. Comparisons and validation of statistical clustering techniques for microarray gene expression data. Bioinformatics 2003, 19, 459–466. [Google Scholar] [CrossRef]
- Hartigan, J.A. Direct clustering of a data matrix. J. Am. Stat. Assoc. 1972, 67, 123–129. [Google Scholar] [CrossRef]
- Cheng, Y.; Church, G.M. Biclustering of expression data. Proc. Int. Conf. Intell. Syst. Mol. Biol. 2000, 8, 93–103. [Google Scholar]
- Chen, S.; Zhang, L.; Lu, L.; Meng, J.; Liu, H. FBCwPlaid: A Functional Biclustering Analysis of Epi-Transcriptome Profiling Data Via a Weighted Plaid Model. IEEE/ACM Trans. Comput. Biol. Bioinform. 2022, 19, 1640–1650. [Google Scholar] [CrossRef]
- Chu, H.M.; Kong, X.Z.; Liu, J.X.; Zheng, C.H.; Zhang, H. A New Binary Biclustering Algorithm Based on Weight Adjacency Difference Matrix for Analyzing Gene Expression Data. IEEE/ACM Trans. Comput. Biol. Bioinform. 2023, 20, 2802–2809. [Google Scholar] [CrossRef] [PubMed]
- Mukhopadhyay, A.; Maulik, U.; Bandyopadhyay, S. On biclustering of gene expression data. Curr. Bioinform. 2010, 5, 204–216. [Google Scholar] [CrossRef]
- Trepowski, J.; Diego, P.P.R.; Miguel, G.T.; Divina, F. Electric Energy Charge Biclustering A Genetic Algorithms Approach. In Proceedings of the 2023 IEEE CHILEAN Conference on Electrical, Electronics Engineering, Information and Communication Technologies (CHILECON), Valdivia, Chile, 5–7 December 2023; pp. 1–6. [Google Scholar]
- Charfaoui, Y.; Houari, A.; Boufera, F. AMoDeBic: An adaptive Multi-objective Differential Evolution biclustering algorithm of microarray data using a biclustering binary mutation operator. Expert Syst. Appl. 2024, 238, 121863. [Google Scholar] [CrossRef]
- Wu, Z.; Wang, J.; Wang, X. Gene expression data mining by hybrid biclustering with improved GA and BA. Sci. Rep. 2025, 15, 33208. [Google Scholar] [CrossRef]
- Kocaturk, A.; Orkcu, H.H.; Altunkaynak, B. Parameter optimization in biclustering algorithms for large datasets using a combined approach of NSGA-II and TOPSIS. Int. J. Data Sci. Anal. 2025, 20, 5499–5516. [Google Scholar] [CrossRef]
- Divina, F.; Aguilar-Ruiz, J.S. Biclustering of expression data with evolutionary computation. IEEE Trans. Knowl. Data Eng. 2006, 18, 590–602. [Google Scholar] [CrossRef]
- Huang, Q.; Tao, D.; Li, X.; Liew, A. Parallelized Evolutionary Learning for Detection of Biclusters in Gene Expression Data. IEEE/ACM Trans. Comput. Biol. Bioinform. 2012, 9, 560–570. [Google Scholar] [CrossRef]
- Yu, K.; Li, W.; Xie, W.; Wang, L. A hybrid feature-selection method based on mRMR and binary differential evolution for gene selection. Processes 2024, 12, 313. [Google Scholar] [CrossRef]
- Chakraborty, A.; Maka, H. Biclustering of gene expression data using genetic algorithm. In Proceedings of the 2005 IEEE Symposium on Computational Intelligence in Bioinformatics and Computational Biology, La Jolla, CA, USA, 14–15 November 2005; pp. 1–8. [Google Scholar]
- Bleuler, S.; Prelic, A.; Zitzler, E. An EA framework for biclustering of gene expression data. In Proceedings of the 2004 Congress on Evolutionary Computation (IEEE Cat. No.04TH8753), Portland, OR, USA, 19–23 June 2004; Volume 1, pp. 166–173. [Google Scholar]
- Yeung, K.Y.; Haynor, D.R.; Ruzzo, W.L. Validating clustering for gene expression data. Bioinformatics 2001, 17, 309–318. [Google Scholar] [CrossRef] [PubMed]
- Frey, B.J.; Dueck, D. Clustering by passing messages between data points. Science 2007, 315, 972–976. [Google Scholar] [CrossRef]
- Wei, Y.; Hu, H.; Xu, H.; Mao, X. Unsupervised hyperspectral band selection via multimodal evolutionary algorithm and subspace decomposition. Sensors 2023, 23, 2129. [Google Scholar] [CrossRef]
- Pontes, B.; Giráldez, R.; Aguilar-Ruiz, J.S. Biclustering on expression data: A review. J. Biomed. Inform. 2015, 57, 163–180. [Google Scholar] [CrossRef]
- Castanho, E.N.; Aidos, H.; Madeira, S.C. Biclustering data analysis: A comprehensive survey. Brief. Bioinform. 2024, 25, bbae342. [Google Scholar] [CrossRef]
- Mounir, M.; Hamdy, M. On biclustering of gene expression data. In Proceedings of the 2015 IEEE Seventh International Conference on Intelligent Computing and Information Systems (ICICIS), Cairo, Egypt, 12–14 December 2015; pp. 641–648. [Google Scholar]
- Aguilar-Ruiz, J.S. Shifting and scaling patterns from gene expression data. Bioinformatics 2005, 21, 3840–3845. [Google Scholar] [CrossRef]
- Vandromme, M.; Jacques, J.; Taillard, J.; Jourdan, L.; Dhaenens, C. A Biclustering Method for Heterogeneous and Temporal Medical Data. IEEE Trans. Knowl. Data Eng. 2022, 34, 506–518. [Google Scholar] [CrossRef]
- Cheng, Y.; Church, G.M. Biclustering of expression data. In Proceedings of the Eighth International Conference on Intelligent Systems for Molecular Biology, La Jolla/San Diego, CA, USA, 19–23 August 2000; pp. 799–808. [Google Scholar]
- Pontes, B.; Girldez, R.; Aguilar-Ruiz, J.S. Quality Measures for Gene Expression Biclusters. PLoS ONE 2015, 10, e0115497. [Google Scholar] [CrossRef] [PubMed]
- Peng, L.; Gu, L.; He, L.; Shi, Y. Diversified kernel latent variable space and multi-objective optimization for selective ensemble learning-based soft sensor. Appl. Sci. 2023, 13, 5224. [Google Scholar] [CrossRef]
- Martínez-Estudillo, A.C.; Hervás-Martínez, C.; Martínez-Estudillo, F.J.; García-Pedrajas, N. Hybridization of evolutionary algorithms and local search by means of a clustering method. IEEE Trans. Syst. Man Cybern. Part B (Cybern.) 2006, 36, 534–545. [Google Scholar] [CrossRef]
- Zheng, W.; Doerr, B. Runtime Analysis for the NSGA-II: Proving, Quantifying, and Explaining the Inefficiency For Many Objectives. IEEE Trans. Evol. Comput. 2023, 28, 1442–1454. [Google Scholar] [CrossRef]
- Suresh, A.; Deb, K. Machine Learning Based Prediction of New Pareto-Optimal Solutions From Pseudo-Weights. IEEE Trans. Evol. Comput. 2023, 28, 1351–1365. [Google Scholar] [CrossRef]
- Deb, K.; Pratap, A.; Agarwal, S.; Meyarivan, T. A fast and elitist multiobjective genetic algorithm: NSGA-II. IEEE Trans. Evol. Comput. 2002, 6, 182–197. [Google Scholar] [CrossRef]
- Mitra, S.; Banka, H. Multi-objective evolutionary biclustering of gene expression data. Pattern Recognit. 2006, 39, 2464–2477. [Google Scholar] [CrossRef]
- Maulik, U.; Mukhopadhyay, A.; Bandyopadhyay, S. Finding multiple coherent biclusters in microarray data using variable string length multiobjective genetic algorithm. IEEE Trans. Inf. Technol. Biomed. 2009, 13, 969–975. [Google Scholar] [CrossRef] [PubMed]
- Seridi, K.; Jourdan, L.; Talbi, E.G. Multi-objective evolutionary algorithm for biclustering in microarrays data. In Proceedings of the 2011 IEEE Congress of Evolutionary Computation (CEC), Ritz Carlton, NO, USA, 5–8 June 2011; pp. 2593–2599. [Google Scholar]
- Ben-Dor, A.; Chor, B.; Karp, R.; Yakhini, Z. Discovering local structure in gene expression data: The order-preserving submatrix problem. J. Comput. Biol. 2003, 10, 373–384. [Google Scholar] [CrossRef]
- Prelić, A.; Bleuler, S.; Zimmermann, P.; Wille, A.; Bühlmann, P.; Gruissem, W.; Hennig, L.; Thiele, L.; Zitzler, E. A systematic comparison and evaluation of biclustering methods for gene expression data. Bioinformatics 2006, 22, 1122–1129. [Google Scholar] [CrossRef]
- Ihmels, J.; Friedlander, G.; Bergmann, S.; Sarig, O.; Ziv, Y.; Barkai, N. Revealing modular organization in the yeast transcriptional network. Nat. Genet. 2002, 31, 370. [Google Scholar] [CrossRef]
- Zhang, H.; Zeng, J.; Zhang, F.; Liu, J.; Liang, L. Role of B-Cell Lymphoma/Leukemia 11A in Normal and Malignant Hematopoiesis. Biology 2025, 14, 26. [Google Scholar] [CrossRef] [PubMed]
- Barraclough, A.; Hawkes, E.; Sehn, L.H.; Smith, S.M. Diffuse large B-cell lymphoma. Hematol. Oncol. 2024, 42, e3202. [Google Scholar] [CrossRef] [PubMed]
Disclaimer/Publisher’s Note: The statements, opinions and data contained in all publications are solely those of the individual author(s) and contributor(s) and not of MDPI and/or the editor(s). MDPI and/or the editor(s) disclaim responsibility for any injury to people or property resulting from any ideas, methods, instructions or products referred to in the content. |
© 2026 by the authors. Licensee MDPI, Basel, Switzerland. This article is an open access article distributed under the terms and conditions of the Creative Commons Attribution (CC BY) license.